bottom-up and top-down management of soybean aphid ... fileof soybean aphid (aphis glycines...
TRANSCRIPT

BOTTOM-UP AND TOP-DOWN MANAGEMENT OF SOYBEAN APHID (APHIS GLYCINES MATSUMURA) IN APHID-
RESISTANT SOYBEAN (GLYCINE MAX (L.) MERRILL)
By
T. Michael Kates
A THESIS
Submitted to: Michigan State University
in partial fulfillment of the requirements for the degree of
MASTER OF SCIENCE
Entomology
2011
ABSTRACT
BOTTOM-UP AND TOP-DOWN MANAGEMENT OF SOYBEAN APHID (APHIS GLYCINES MATSUMURA) IN APHID-
RESISTANT SOYBEAN (GLYCINE MAX (L.) MERRILL)
By
T. Michael Kates
Since the discovery of soybean aphid (Aphis glycines Matsumura) (Hemiptera:
Aphididae) in North America in 2000, researchers have identified the top-down suppression
of aphid populations by natural enemies, and the bottom-up effects of soil nutrition,
specifically soil potassium on aphid populations. In addition to these factors, genes that
convey aphid resistance have also been identified. We studied how several of these genes
interacted with the ecosystem services of natural enemies, and how they preformed in
potassium deficient soil. The overall number of natural enemies was no different between
resistant and susceptible plots. There were significant differences in the density of certain
taxa, corresponding with different aphid density in resistant and susceptible plots. There was
no significant difference in the ecosystem services provided by natural enemies in resistant
and susceptible plots. No significant difference in aphid populations was detected between
plants grown in potassium deficient and potassium amended soil. We also used molecular
markers to explore the relationships of aphid populations on resistant and susceptible
soybean. We found significant impacts of geography on aphid populations and that
populations of aphids from each resistant line were significantly different from the other
resistant line.

iii
To my grandfathers- The men to whom I owe my love of nature, science, and the creation.

iv
ACKNOWLEDGEMENTS
Many thanks to the North Central Soybean Research Program and the Michigan
Soybean Promotion Committee for funding assistance. Without Fred Springborn and Paul
Horny I would not have had land to conduct my experiments. Thanks to Mike Jewett, Meg
Chludzinski, Chelsea Smith, Liz Watson, Nick Peuppke, Casey Rowley, Eric Rehum, Alex
Barnes, and Diana Miller for their faithful aphid counting. Thanks to Desmi Chandrasena
for her assistance with soybean and aphid lab work. I would like to Dr. Andy Michel and
Lucia Orantes for teaching me how to analyze SNPs. Without the support of Riverview,
Brian and Robin Langford, Dr. John Bell, Dr. Roy Cole, and my family, I would not have
made it to this point. Finally, I need to thank my advisor, Dr. Chris DiFonzo, for the red ink,
encouragement, and insight.
v
TABLE OF CONTENTS
LIST OF TABLES ………………………………………………………………………vi
LIST OF FIGURES……………………………………………………………………..vii
CHAPTER 1- ECOSYSTEM SERVICES PROVIDED BY APHID PREDATORS IN APHID-RESISTANT AND APHID SUSCEPTIBLE SOYBEAN……………………………..…1 Introduction……………………………………………………………………………….2 Materials and Methods………………………………………………………………..…....5 Results……………………………………………………………………………………..7 Discussion...…………………………………………………………………………....….10 Appendix...…………………………………………………………………………......….13 Figures and Tables…………………………………………………………......…..14 Record of deposition of voucher specimens……………………………………….20 References.…………………………………………………………………………....…...21
CHAPTER 2- HOST PLANT RESISTANCE TO SOYBEAN APHID (APHIS GLYCINES MATSUMURA) IN POTASSIUM DEFICIENT SOILS……….……………………...…26 Introduction………………………………………………………………………….....…27 Materials and Methods………………………………………………………………….....29 Results and Discussion…...……………………………………………………………..…32 Appendix...…………………………………………………………………………......….35 Figures and Tables………………………………………………………………....36 References.…………………………………………………………………………..……40
CHAPTER 3- MOLECULAR MARKER PROFILES OF SOYBEAN APHID (APHIS GLYCINES MATSUMURA) ON APHID-RESISTANT AND SUSCEPTIBLE SOYBEAN…....……43 Introduction………………………………………………………………………….....…44 Materials and Methods……………………………………………………………………47 Results…………………………………………………………………………………….50 Discussion...……………………………………………………………...………………..51 Appendix...…………………………………………………………………………......….53 Figures and Tables…………………………………………………….……............54 References.…………………………………………………………………………..……56
vi
LIST OF TABLES
Table 1.1: Mean aphid population size per plant (± Standard Error) per plant aphid-resistant and susceptible soybean plots during 2010 and 2011 in East Lansing and Frankenmuth, MI. Different letters signify significantly different means……………………………...………15 Table 1.2: Biological control service index (BSI) values (± Standard Error) in aphid suppression on aphid islands in aphid-resistant and susceptible soybean (Glycine max) Different letters signify significantly different means………………………...………...…..17 Table 1.3: Mean quantity (± Standard Error) and diversity of natural enemies collected in aphid-resistant and susceptible soybean (Glycine max) in East Lansing and Frankenmuth. Different letters signify significantly different means.……………………………………...18 Table 1.4: Mean (± Standard Error) coccinellid beetles and anthocorid bugs collected in aphid resistant aphid susceptible soybean (Glycine max) and Frankenmuth, MI during 2011. Different letters signify significantly different means……………………………………...19 Table 2.1: Potassium levels of soybean plants and soil in potassium amended (K+) and potassium deficient (K-) cages in a potassium-deficient field in Montcalm County, MI. Different letters signify significantly different means……………………………………...36
Table 3.1: Comparison of aphid populations collected from aphid-resistant and susceptible soybean lines in East Lansing and Frankenmuth MI in August 2010. Genetic distance (Fst values) between populations by FSTAT 2.9.3 (Goudet 2002) X’s signify significant differences between populations using 7 SNP markers……………………………………55
vii
LIST OF FIGURES
Figure 1.1: Diagram of soybean plots and aphid islands used in 2010 and 2011to sample ecosystem services and natural enemy numbers in East Lansing and Frankenmuth, MI…...14 Figure 1.2: Mean population size of aphids per plant (± Standard Error) on open and closed aphid islands during 2010 and 2011…………………………………………………….....16 Figure 2.1: Mean population size (± Standard Error) of soybean aphid on aphid-resistant soybean on potassium deficient and potassium amended soil during 2009…………..…….37 Figure 2.2: Mean population size (± Standard Error) of soybean aphid on aphid-resistant soybean lines on potassium deficient and potassium amended soil during 2010. ……….....38
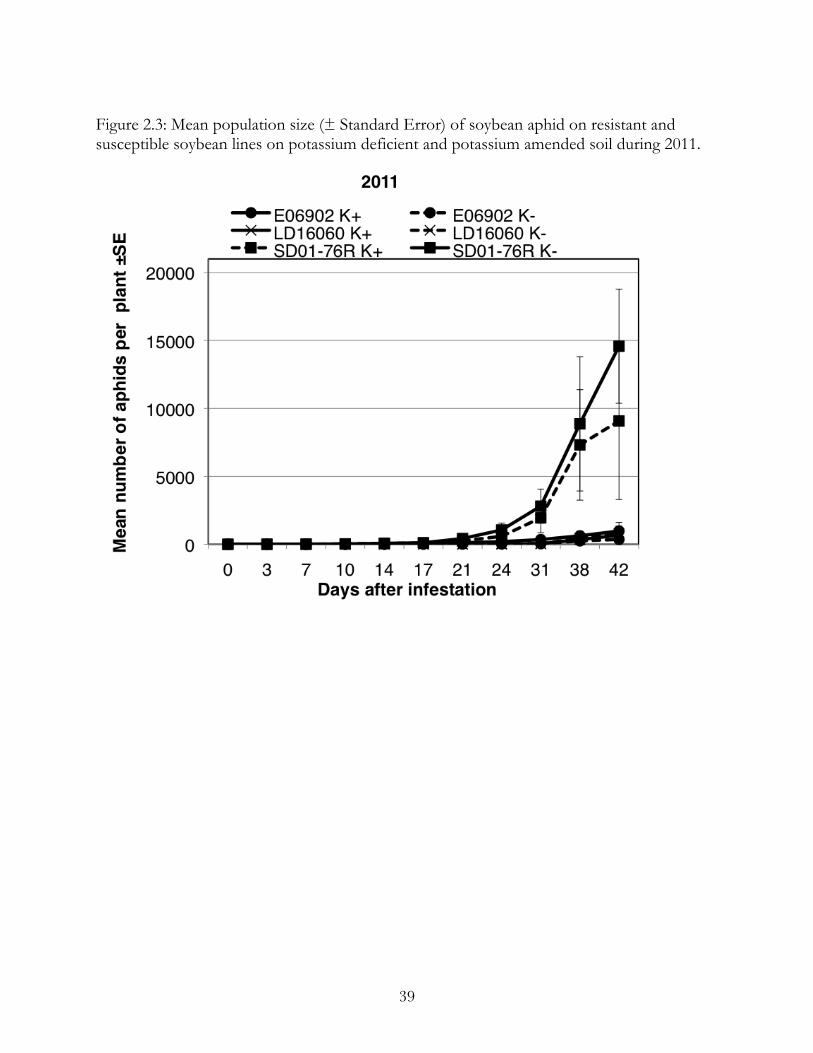
Figure 2.3: Mean population size (± Standard Error) of soybean aphid on resistant and susceptible soybean lines on potassium deficient and potassium amended soil during 2009………………………………………………………………………………………39 Figure 3.1: Principal component analysis of soybean aphid populations collected from aphid-resistant and susceptible soybean lines in East Lansing and Frankenmuth MI, during August, 2010 using 7 SNP markers……….……………………………………….………………54

1
CHAPTER 1:
ECOSYSTEM SERVICES PROVIDED BY APHID PREDATORS IN APHID-RESISTANT AND APHID SUSCEPTIBLE SOYBEAN
Abstract
Natural enemies are an important factor in managing soybean aphid (Aphis glycines
Matsumura), but are sometimes unable to maintain aphid numbers below economically
damaging levels. Several genes that convey resistance to soybean aphid have been
discovered. In this study, we survey natural enemy populations in aphid-resistant and
susceptible soybean and measure the ecosystem services they provide using a biological
control services index (BSI). The overall number of natural enemies was no different
between resistant and susceptible plots, while there were significant differences in the density
of certain taxa- specifically coccinellid lady beetles. There were significantly more coccinellid
beetles in susceptible soybean than in resistant, corresponding with different aphid density.
There was no significant difference in the BSI between resistant and susceptible plots.
2
Introduction
Ecosystems provide goods and services that are beneficial to human beings (Daily et
al. 2000). These ecosystem services can be tangible things, such as timber and wild fisheries,
or intangible processes, such as pollination of crops by insects, carbon sequestration by
forests, and filtration of water by wetlands. By expansion, ecosystem services can be
monetized through ecotourism or carbon offsets. Although ecosystem services are vital to
human well being, it is difficult to quantify them and include their value in everyday
decision-making (Barbier and Heal 2006, Daily et al. 2009, Nelson et al. 2009).
Entomophagous (insect-eating) arthropods offer significant ecosystem services by
regulating pest populations in a wide array of environments (Losey and Vaughan 2006).
Beneficial insects provide efficient, resilient, and environmentally friendly reduction and
suppression of populations of pest species in many agricultural systems. The soybean aphid,
Aphis glycines Matsumura (Hemiptera: Aphididae), is an example of a pest strongly impacted
by biological control. Soybean aphid is a native of Asia, where it is a pest of soybean (Glycine
max (L.) Merrill). The soybean aphid was first discovered in North America in 2000. By
2003, soybean aphid moved across the northern United States and eastern Canada, causing
billions of dollars in crop loss (NCSRP 2004, Ragsdale et al. 2004), and a dramatic increase in
the application of insecticides to soybean in outbreak years (DiFonzo 2009). In infested
soybean fields, natural enemies significantly reduce aphid numbers (Costamagna and Landis
2006, Miao et al. 2007, Landis et al. 2004, Gardiner et al. 2009, Costamagna et al. 2007).
Minute pirate bugs (Hemiptera: Anthocoridae), coccinellid beetles (Coleoptera:
Coccinellidae), syrphid flies (Diptera: Syrphidae), and parasitoid wasps consume aphids and
3
often keep aphid populations below established thresholds (Rutledge et al. 2004, Costamagna
et al. 2007, Kaiser et al. 2007, Ragsdale et al. 2007, Schmidt et al. 2008, Gardiner et al. 2009,
Ragsdale et al. 2010). But natural enemies do not always keep soybean aphid populations
below economically damaging levels. When outbreaks occur, insecticide applications
effectively manage soybean aphid populations and mitigate yield loss (Myers et al. 2005,
Johnson et al. 2009). However, insecticides have both lethal and sublethal effects on natural
enemies (Elzen 2001, Bosik 2006, Desneaux et al. 2006, Desneaux et al. 2007, Ohnesorg et al.
2009), add significant cost to soybean production (Song et al. 2006), and have negative
environment impact.
To control soybean aphid while reducing the application of insecticides, soybean
breeders identified several sources of host plant resistance, with Rag (Resistance Aphis
glycines) genes. The first sources had single, dominant genes- Rag, Rag1 (Hill et al. 2004, Hill
et al. 2006, Li et al. 2007), or Rag2 (Mian et al. 2008, Kim et al. 2010). Mensah et al. (2008)
screened over 2,000 plant introductions (PIs) from China and reported two additional
sources of aphid resistance. These two sources, PI 567541B and PI 567598B, each contained
two recessive genes (rag1c and rag4, rag1b and rag3, respectively) that conveyed epistatic
(synergistic) aphid resistance (Chiozza et al. 2008). Rag1 was available in commercial varieties
beginning 2010 and other sources of resistance were listened for use by seed companies.
Soybean aphid biotypes that colonize Rag1 (Kim et al. 2008) and Rag2 (Hill et al. 2010)
were reported relatively quickly after the genes were discovered. The ability of aphids to
overcome host-plant resistance is well documented (Dreyer and Campbell 1987, Dixon
1998). Aphid life cycles are typified by sexual and parthenogenic reproduction, telescoping
4
generations, and host alternation. Many aphid species also have symbiotic bacteria that allow
aphids to live on poor food sources. These characteristics also apply to soybean aphid
(Michel et al. 2011), increasing the risk of soybean aphids overcoming all known resistance
genes. To lengthen the time that aphid resistant genes are effective, it is important to
consider multiple integrated tactics in including the impacts of biological control.
The coupling of host plant resistance and biological control can have additive or
synergistic effects on the suppression of aphids. Natural enemies take longer to reproduce
than aphids. Host plant resistance can slow the growth of an aphid population, allowing
natural enemies to keep pace, and have a greater impact than on a susceptible plot (Dreyer
and Campbell 1987). Conversely, host plant resistance may decrease an aphid populations
and eliminate the prey base that attracts and sustains natural enemies, making biological
control less than in a susceptible crop. The effects of antibiosis resistance have been seen to
negatively impact two trophic levels of predators feeding on insects feeding on resistant
soybean (Orr and Boethel 1986). How the reduced number of soybean aphids and the
antibiotic effects of resistant plants will effect natural enemy populations is not well
understood.
How predator populations and the ecosystem services they provide are effected by
prey density can be difficult to categorize. In spite of this difficulty, certain aphid predators
are density-dependent in a multitude of systems. Coccinellid beetles are strongly affected by
aphid numbers (Evans and Nadeer 1992, Ives et al. 1993, Schellhorn and Andow 2005).
These patterns also hold true in soybean (Donaldson et al. 2007) By dramatically reducing
aphid numbers, resistant soybean fields may recruit and support fewer natural enemies,
5
allowing low density aphid populations (for example isolated colonies of a biotype) to
persist.
The objective of this study was to compare the numbers, diversity and ecosystem
services (as measured by aphid population suppression) of natural enemies in susceptible and
aphid-resistant soybean.
We expected to see lower natural enemy density in plots with fewer aphids, leading to
lower numbers and diversity of natural enemies as well as lower ecosystem services in
resistant plots when compared to susceptible plots.
Materials and Methods
The study was conducted at the Michigan State University (MSU) Entomology Field
Research Station in East Lansing, Michigan (42°41'26.12"N, 84°29'38.92"W), and the MSU
Saginaw Valley Research and Extension Center in Frankenmuth, Michigan (43°23'54.81"N,
83°41'44.76"W) in 2010 and 2011.
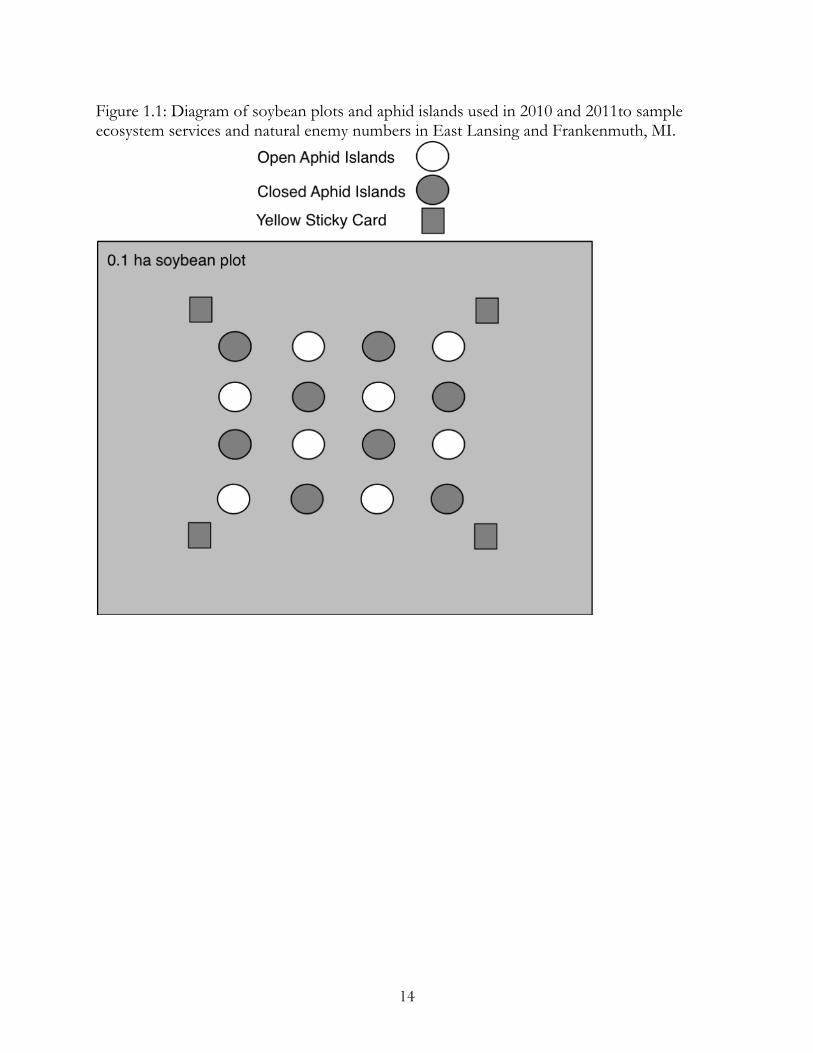
At both locations in 2010, four replicates of three soybean lines were planted. These
lines represented three different levels of resistance to soybean aphid: susceptible (SD01-
76R), Rag1 resistant (LD16060), and rag1b and rag3 resistant (E06902). Soybeans were
planted in East Lansing on 19 May and in Frankenmuth on 5 May in 0.1ha plots in 76 cm
rows. Within a day of planting, 16 seeds in each plot were removed by hand and replaced
with 16 SD01-76R seeds. This created single susceptible plants, or 'aphid islands,' in a
background of susceptible or resistant soybeans. Aphid islands were arranged in a
6
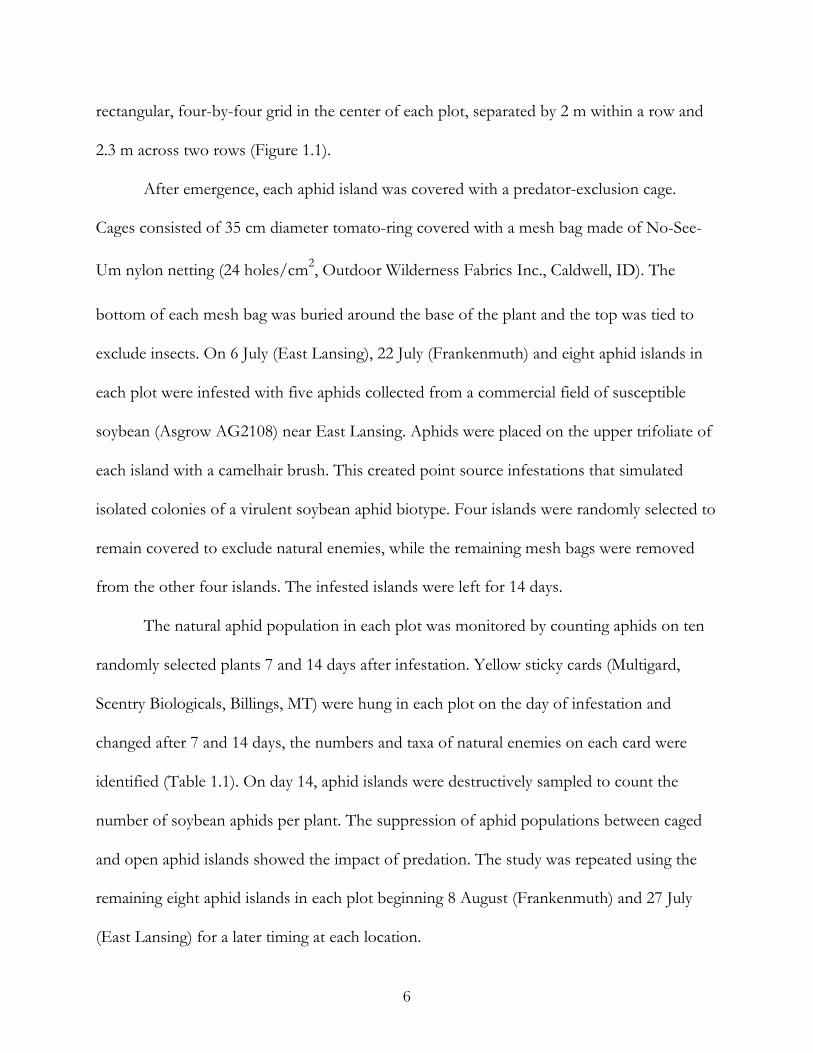
rectangular, four-by-four grid in the center of each plot, separated by 2 m within a row and
2.3 m across two rows (Figure 1.1).
After emergence, each aphid island was covered with a predator-exclusion cage.
Cages consisted of 35 cm diameter tomato-ring covered with a mesh bag made of No-See-
Um nylon netting (24 holes/cm2, Outdoor Wilderness Fabrics Inc., Caldwell, ID). The
bottom of each mesh bag was buried around the base of the plant and the top was tied to
exclude insects. On 6 July (East Lansing), 22 July (Frankenmuth) and eight aphid islands in
each plot were infested with five aphids collected from a commercial field of susceptible
soybean (Asgrow AG2108) near East Lansing. Aphids were placed on the upper trifoliate of
each island with a camelhair brush. This created point source infestations that simulated
isolated colonies of a virulent soybean aphid biotype. Four islands were randomly selected to
remain covered to exclude natural enemies, while the remaining mesh bags were removed
from the other four islands. The infested islands were left for 14 days.
The natural aphid population in each plot was monitored by counting aphids on ten
randomly selected plants 7 and 14 days after infestation. Yellow sticky cards (Multigard,
Scentry Biologicals, Billings, MT) were hung in each plot on the day of infestation and
changed after 7 and 14 days, the numbers and taxa of natural enemies on each card were
identified (Table 1.1). On day 14, aphid islands were destructively sampled to count the
number of soybean aphids per plant. The suppression of aphid populations between caged
and open aphid islands showed the impact of predation. The study was repeated using the
remaining eight aphid islands in each plot beginning 8 August (Frankenmuth) and 27 July
(East Lansing) for a later timing at each location.
7
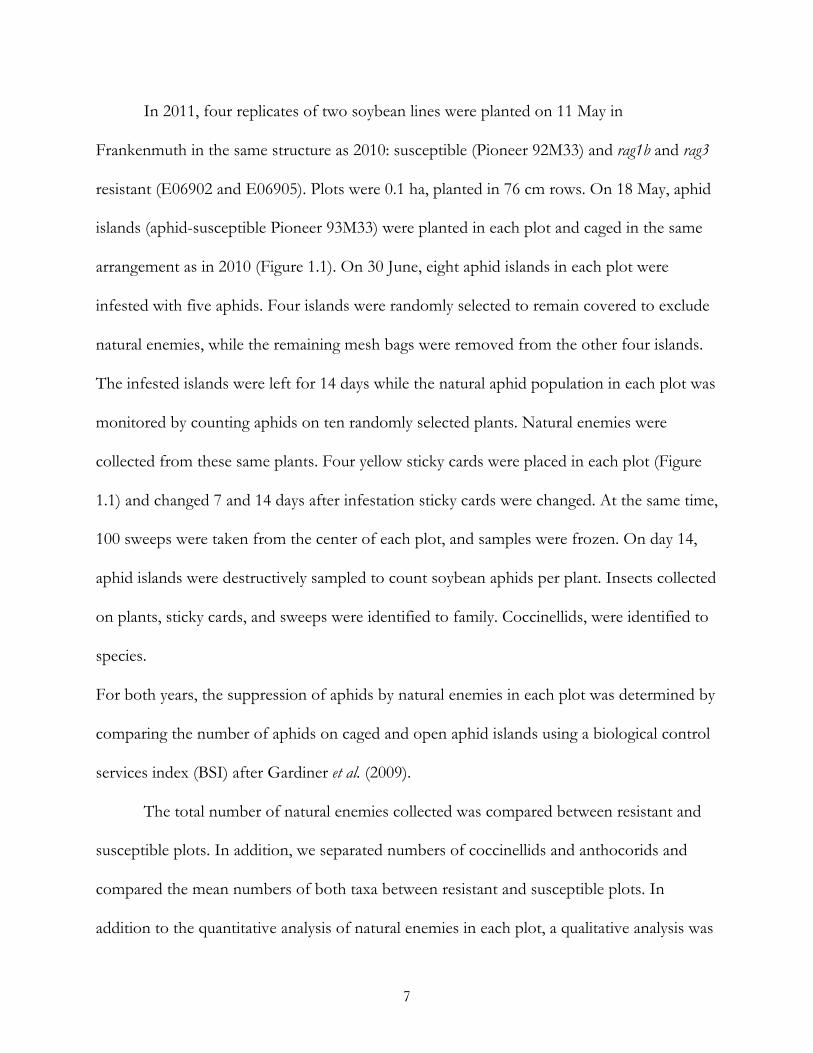
In 2011, four replicates of two soybean lines were planted on 11 May in
Frankenmuth in the same structure as 2010: susceptible (Pioneer 92M33) and rag1b and rag3
resistant (E06902 and E06905). Plots were 0.1 ha, planted in 76 cm rows. On 18 May, aphid
islands (aphid-susceptible Pioneer 93M33) were planted in each plot and caged in the same
arrangement as in 2010 (Figure 1.1). On 30 June, eight aphid islands in each plot were
infested with five aphids. Four islands were randomly selected to remain covered to exclude
natural enemies, while the remaining mesh bags were removed from the other four islands.
The infested islands were left for 14 days while the natural aphid population in each plot was
monitored by counting aphids on ten randomly selected plants. Natural enemies were
collected from these same plants. Four yellow sticky cards were placed in each plot (Figure
1.1) and changed 7 and 14 days after infestation sticky cards were changed. At the same time,
100 sweeps were taken from the center of each plot, and samples were frozen. On day 14,
aphid islands were destructively sampled to count soybean aphids per plant. Insects collected
on plants, sticky cards, and sweeps were identified to family. Coccinellids, were identified to
species.
For both years, the suppression of aphids by natural enemies in each plot was determined by
comparing the number of aphids on caged and open aphid islands using a biological control
services index (BSI) after Gardiner et al. (2009).
The total number of natural enemies collected was compared between resistant and
susceptible plots. In addition, we separated numbers of coccinellids and anthocorids and
compared the mean numbers of both taxa between resistant and susceptible plots. In
addition to the quantitative analysis of natural enemies in each plot, a qualitative analysis was
8
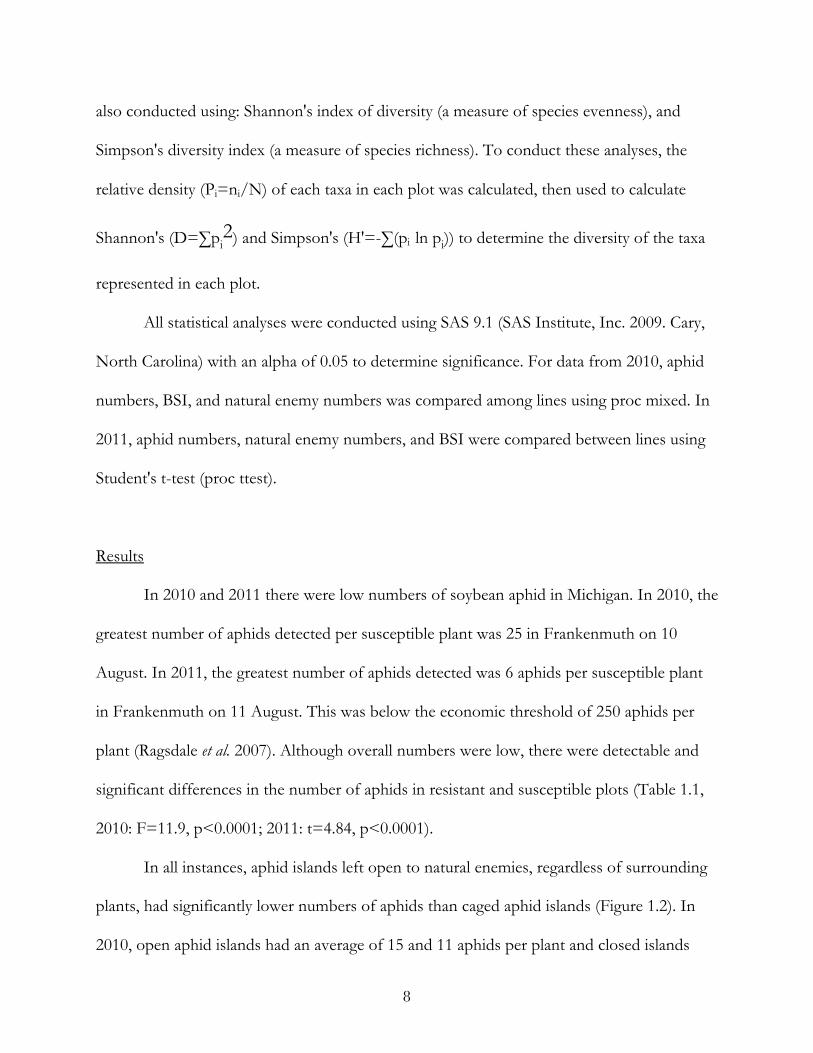
also conducted using: Shannon's index of diversity (a measure of species evenness), and
Simpson's diversity index (a measure of species richness). To conduct these analyses, the
relative density (Pi=ni/N) of each taxa in each plot was calculated, then used to calculate
Shannon's (D=∑pi2) and Simpson's (H'=-∑(pi ln pi)) to determine the diversity of the taxa
represented in each plot.
All statistical analyses were conducted using SAS 9.1 (SAS Institute, Inc. 2009. Cary,
North Carolina) with an alpha of 0.05 to determine significance. For data from 2010, aphid
numbers, BSI, and natural enemy numbers was compared among lines using proc mixed. In
2011, aphid numbers, natural enemy numbers, and BSI were compared between lines using
Student's t-test (proc ttest).
Results
In 2010 and 2011 there were low numbers of soybean aphid in Michigan. In 2010, the
greatest number of aphids detected per susceptible plant was 25 in Frankenmuth on 10
August. In 2011, the greatest number of aphids detected was 6 aphids per susceptible plant
in Frankenmuth on 11 August. This was below the economic threshold of 250 aphids per
plant (Ragsdale et al. 2007). Although overall numbers were low, there were detectable and
significant differences in the number of aphids in resistant and susceptible plots (Table 1.1,
2010: F=11.9, p<0.0001; 2011: t=4.84, p<0.0001).
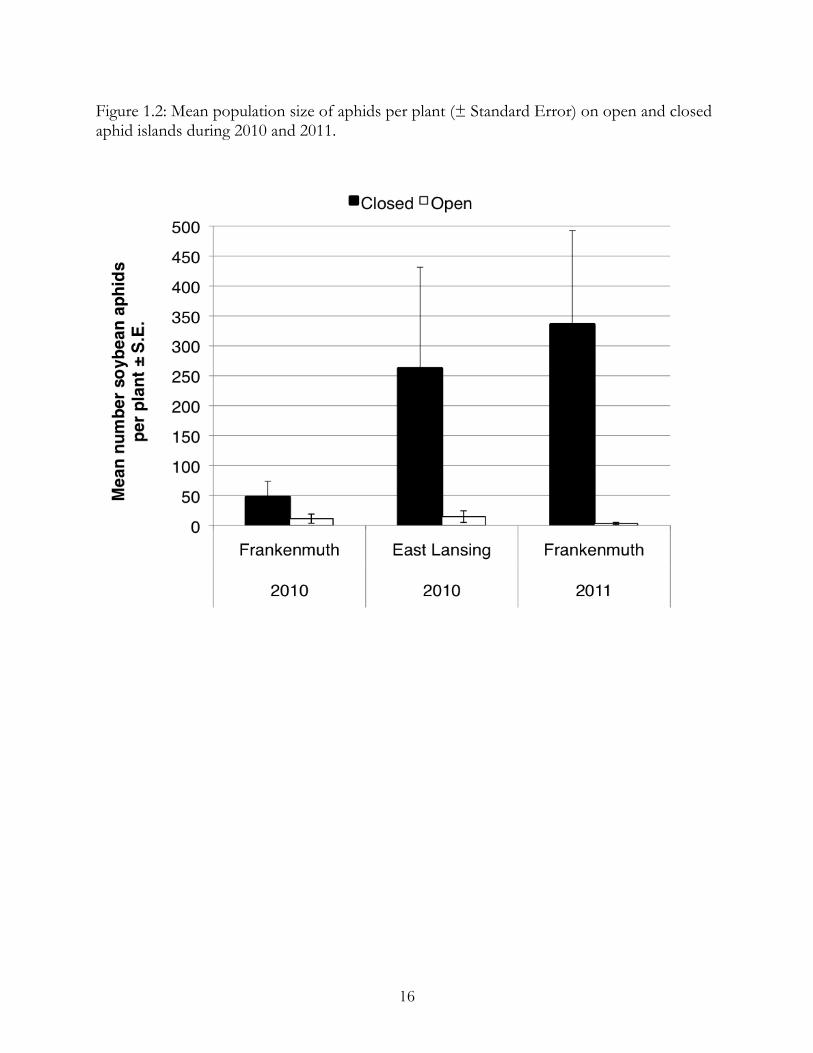
In all instances, aphid islands left open to natural enemies, regardless of surrounding
plants, had significantly lower numbers of aphids than caged aphid islands (Figure 1.2). In
2010, open aphid islands had an average of 15 and 11 aphids per plant and closed islands

9
had an average of 262.2 and 47.4 aphids per plant in East Lansing (t=2.96, p=0.006) and
Frankenmuth (t=3.97, p=0.006), respectively. In 2011, open aphid islands averaged of 3
aphids per plant, and closed islands averaged of 336 aphids per plant (t=3.64, p=0.0024).
This demonstrated the effect of natural enemies in reducing aphid numbers. When natural
enemies were excluded, aphid numbers rose above the economic threshold of 250 aphids
per plant (Ragsdale et al. 2007).
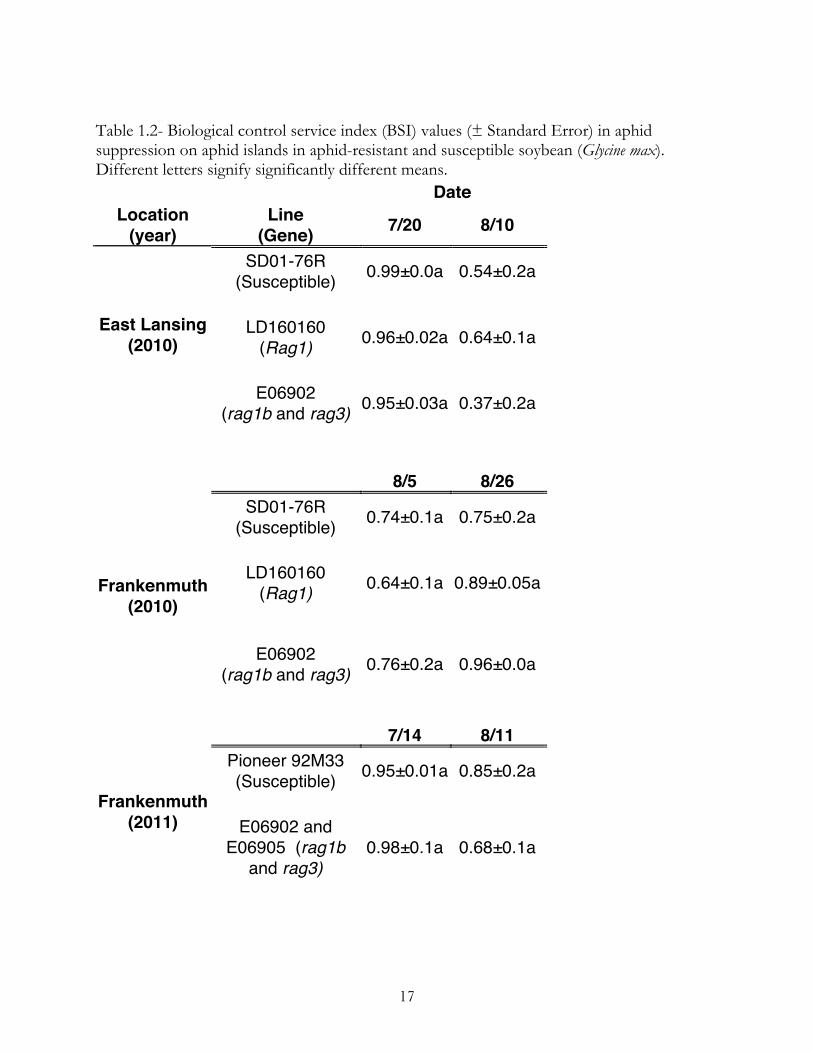
In both years however, there was no difference in the suppression of aphid
populations between resistant and susceptible plots (2010: F=0.04, p=0.957, 2011:t=1.11,
p=0.29). Natural enemies reduced aphid numbers just as efficiently in resistant plots as
susceptible plots (Table 1.2).
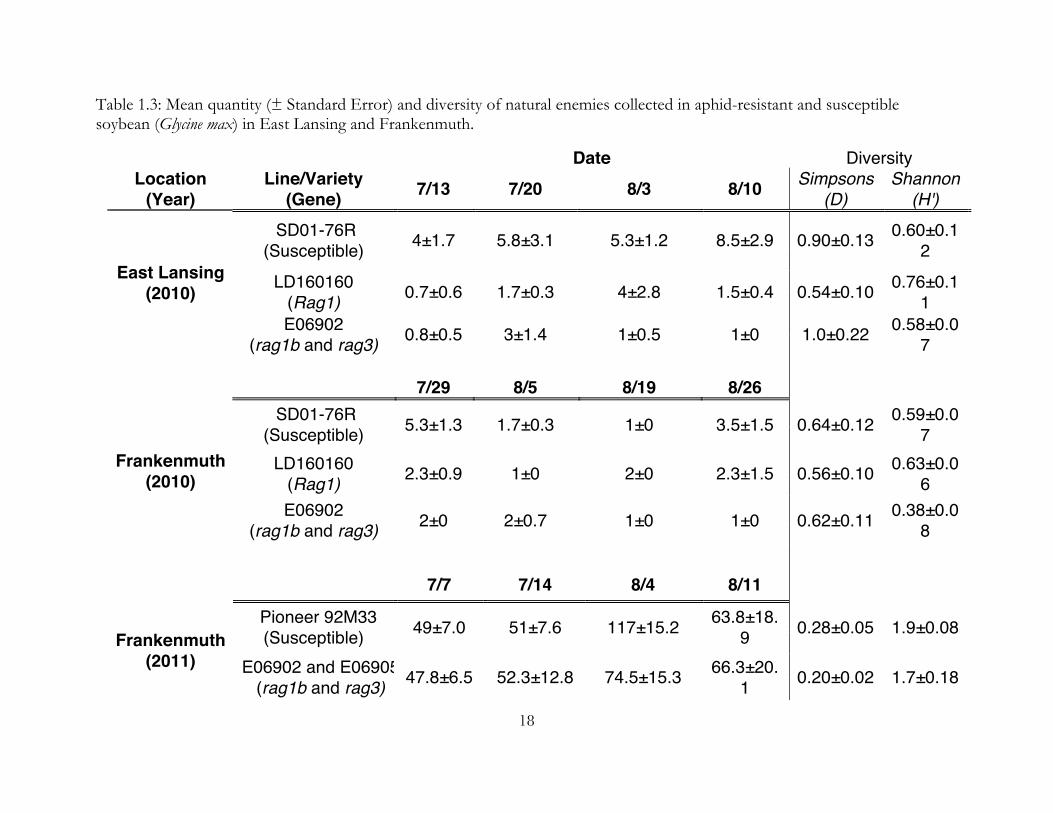
In 2010, we collected 310 natural enemies on yellow sticky cards, consisting primarily
of coccinellid beetles (N=136, 44% of total) and syrphid flies (N=117, 38% of total). This is
unsurprising as both taxa are mobile and likely to be caught by a sticky trap. There was no
significant difference in the overall numbers of natural enemies collected between the three
lines (F=0.0168, p=0.98) or by location (t=0.44, p=0.66). The diversity of natural enemies
did not differ significantly between resistant and susceptible plots (Shannon: F=1.61,
p=0.21, Simpsons: F=2.76, p=0.079), by date (Shannon: F=0.18, p=0.68, Simpsons: F=0.84,
p=0.55), or by location (Shannon: t=-1.07, p=0.91, Simpsons: t=0.11, p=0.91).
In 2011, we collected 2,248 natural enemies on whole plants (N=73, 3% of total),
sticky cards (N=1359, 56% of total), and sweeps (N=996, 41% of total), consisting primarily
of anthocorids (N=1,747, 72%), syrphid flies (N=333, 14% of total), and coccinellid beetles
(N=245, 10% of total). The larger proportion of anthocorids caught in 2011 when compared
10
to 2010 is due to the inclusion of sweep netting and of natural enemies on plants. There
were no significant differences in the number of natural enemies collected in resistant and
susceptible plots overall (t=-0.75, p=0.46), and for each individual date (Table 1.3). The
diversity of natural enemies did not differ significantly between resistant and susceptible
plots (Shannon: F=1.84, p=0.21, Simpsons: F=1.97, p=0.19) or by date (Shannon: F=0.18,
p=0.68, Simpsons: F=0.01, p=0.93)
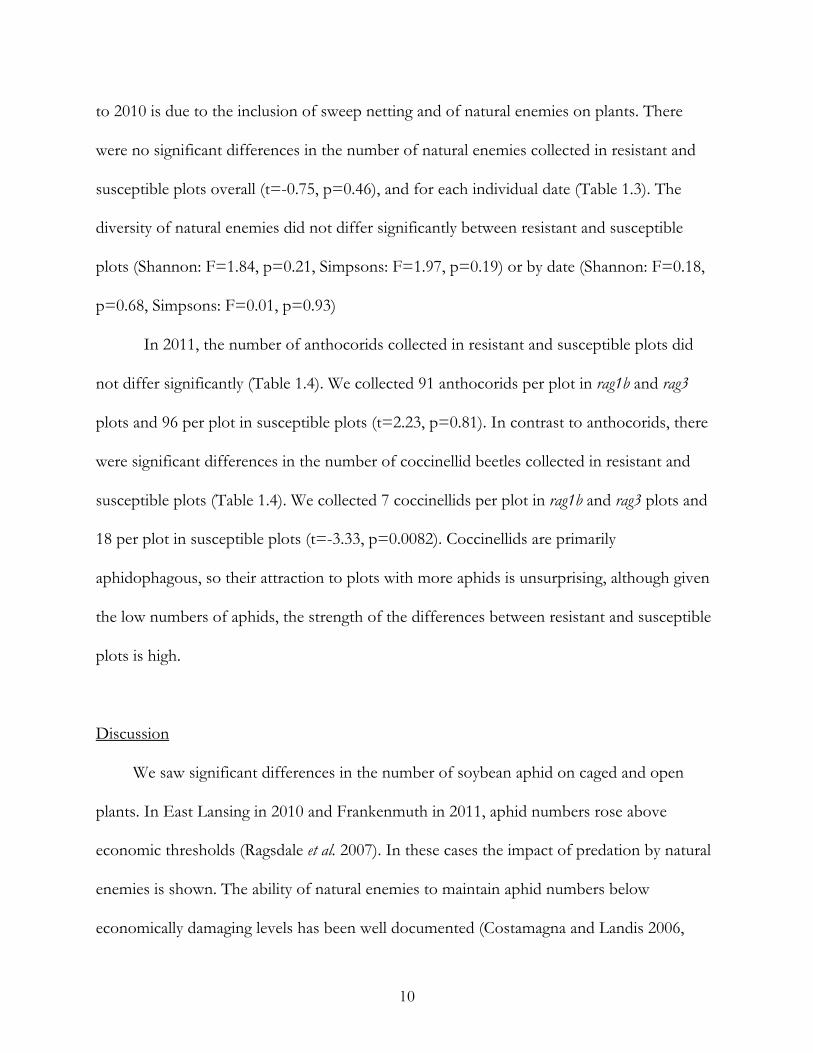
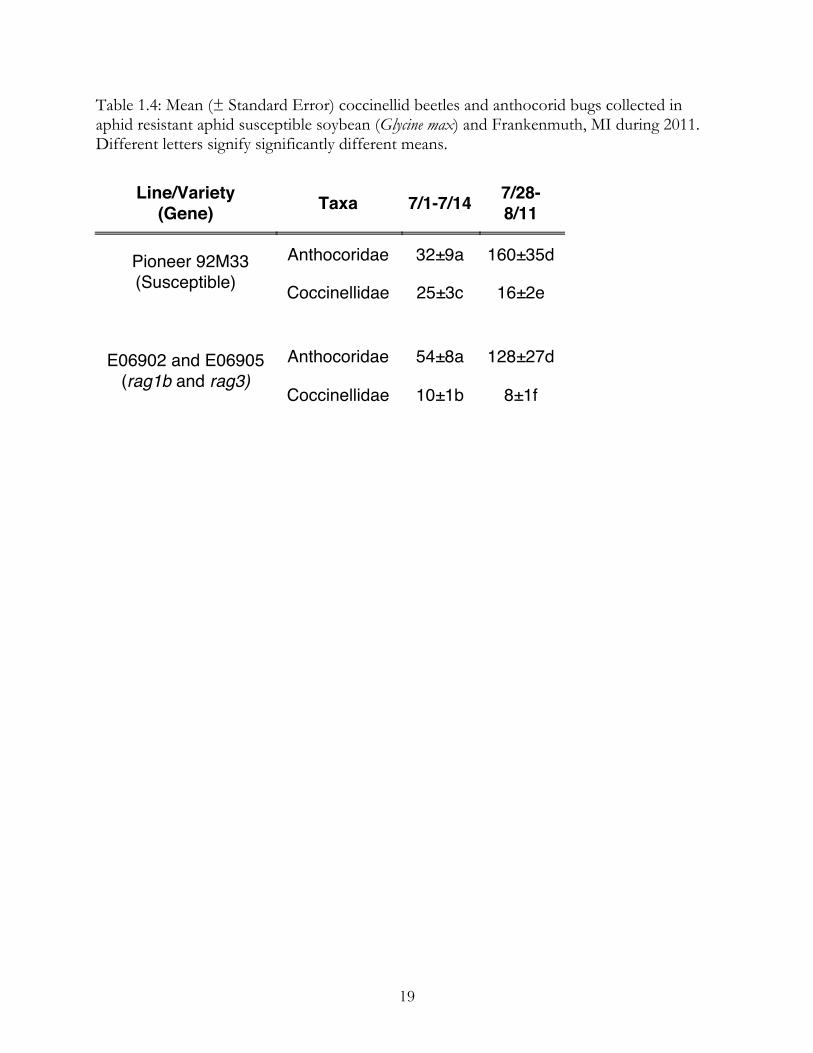
In 2011, the number of anthocorids collected in resistant and susceptible plots did
not differ significantly (Table 1.4). We collected 91 anthocorids per plot in rag1b and rag3
plots and 96 per plot in susceptible plots (t=2.23, p=0.81). In contrast to anthocorids, there
were significant differences in the number of coccinellid beetles collected in resistant and
susceptible plots (Table 1.4). We collected 7 coccinellids per plot in rag1b and rag3 plots and
18 per plot in susceptible plots (t=-3.33, p=0.0082). Coccinellids are primarily
aphidophagous, so their attraction to plots with more aphids is unsurprising, although given
the low numbers of aphids, the strength of the differences between resistant and susceptible
plots is high.
Discussion
We saw significant differences in the number of soybean aphid on caged and open
plants. In East Lansing in 2010 and Frankenmuth in 2011, aphid numbers rose above
economic thresholds (Ragsdale et al. 2007). In these cases the impact of predation by natural
enemies is shown. The ability of natural enemies to maintain aphid numbers below
economically damaging levels has been well documented (Costamagna and Landis 2006,
11
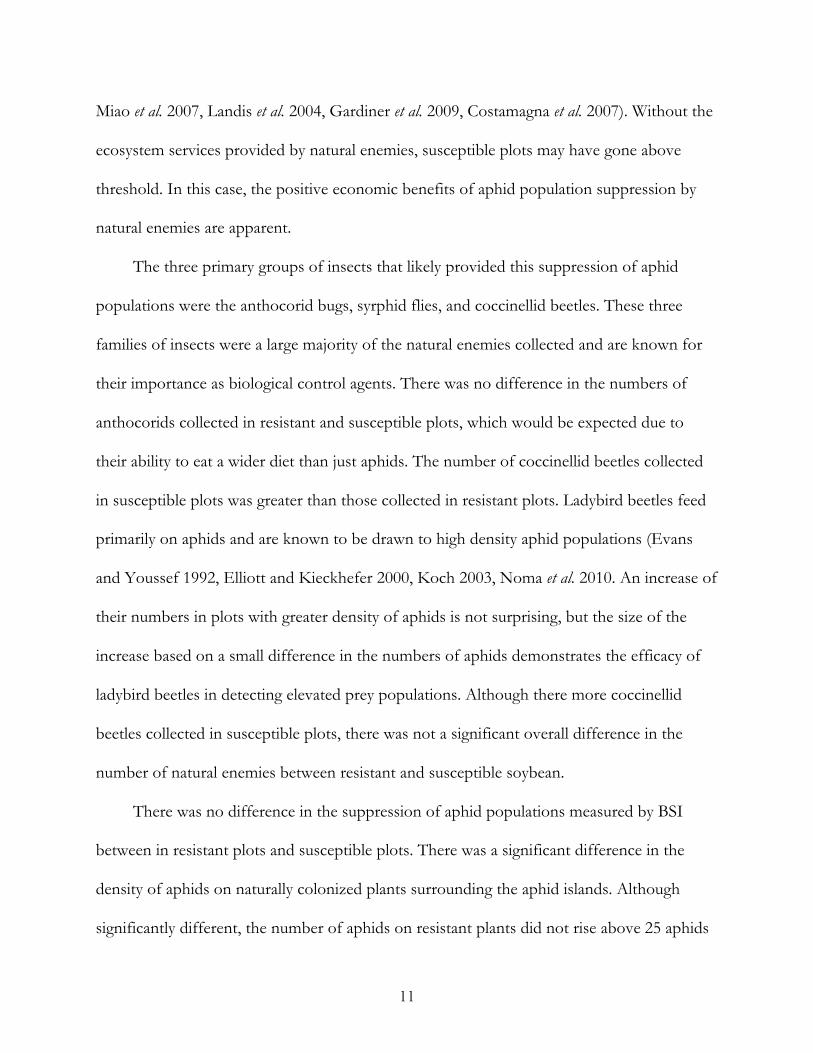
Miao et al. 2007, Landis et al. 2004, Gardiner et al. 2009, Costamagna et al. 2007). Without the
ecosystem services provided by natural enemies, susceptible plots may have gone above
threshold. In this case, the positive economic benefits of aphid population suppression by
natural enemies are apparent.
The three primary groups of insects that likely provided this suppression of aphid
populations were the anthocorid bugs, syrphid flies, and coccinellid beetles. These three
families of insects were a large majority of the natural enemies collected and are known for
their importance as biological control agents. There was no difference in the numbers of
anthocorids collected in resistant and susceptible plots, which would be expected due to
their ability to eat a wider diet than just aphids. The number of coccinellid beetles collected
in susceptible plots was greater than those collected in resistant plots. Ladybird beetles feed
primarily on aphids and are known to be drawn to high density aphid populations (Evans
and Youssef 1992, Elliott and Kieckhefer 2000, Koch 2003, Noma et al. 2010. An increase of
their numbers in plots with greater density of aphids is not surprising, but the size of the
increase based on a small difference in the numbers of aphids demonstrates the efficacy of
ladybird beetles in detecting elevated prey populations. Although there more coccinellid
beetles collected in susceptible plots, there was not a significant overall difference in the
number of natural enemies between resistant and susceptible soybean.
There was no difference in the suppression of aphid populations measured by BSI
between in resistant plots and susceptible plots. There was a significant difference in the
density of aphids on naturally colonized plants surrounding the aphid islands. Although
significantly different, the number of aphids on resistant plants did not rise above 25 aphids
12
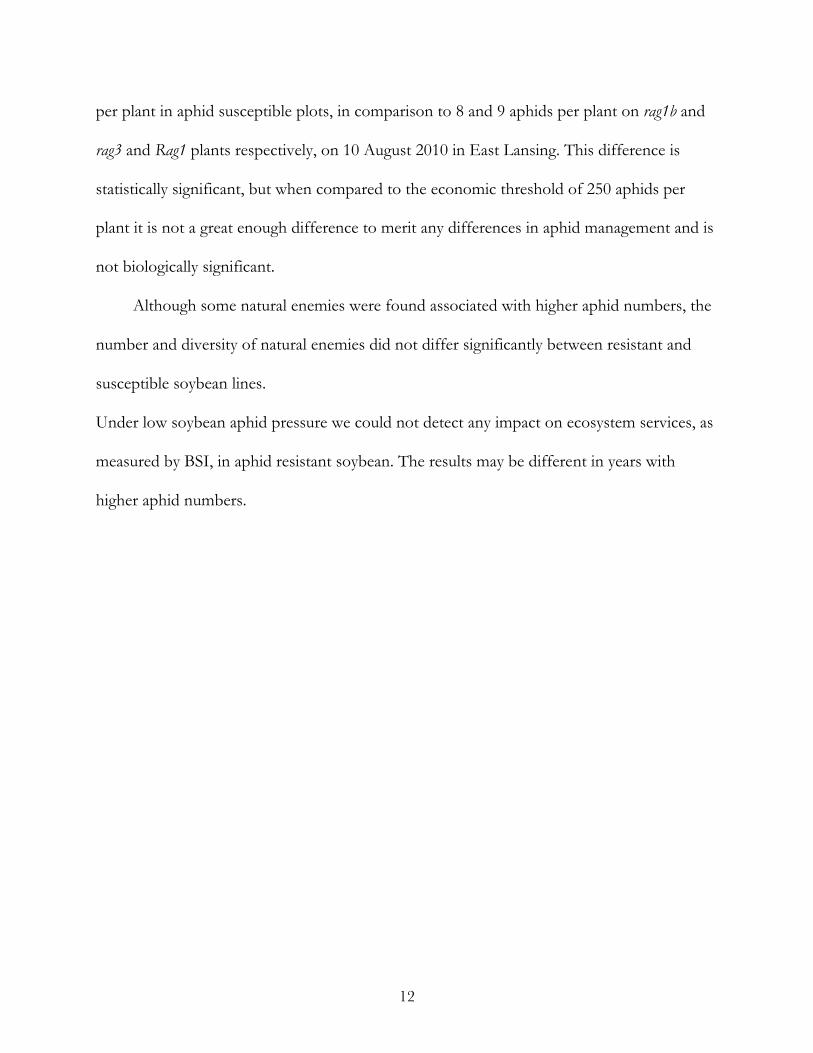
per plant in aphid susceptible plots, in comparison to 8 and 9 aphids per plant on rag1b and
rag3 and Rag1 plants respectively, on 10 August 2010 in East Lansing. This difference is
statistically significant, but when compared to the economic threshold of 250 aphids per
plant it is not a great enough difference to merit any differences in aphid management and is
not biologically significant.
Although some natural enemies were found associated with higher aphid numbers, the
number and diversity of natural enemies did not differ significantly between resistant and
susceptible soybean lines.
Under low soybean aphid pressure we could not detect any impact on ecosystem services, as
measured by BSI, in aphid resistant soybean. The results may be different in years with
higher aphid numbers.

13
APPENDIX
14
Figure 1.1: Diagram of soybean plots and aphid islands used in 2010 and 2011to sample ecosystem services and natural enemy numbers in East Lansing and Frankenmuth, MI.
15
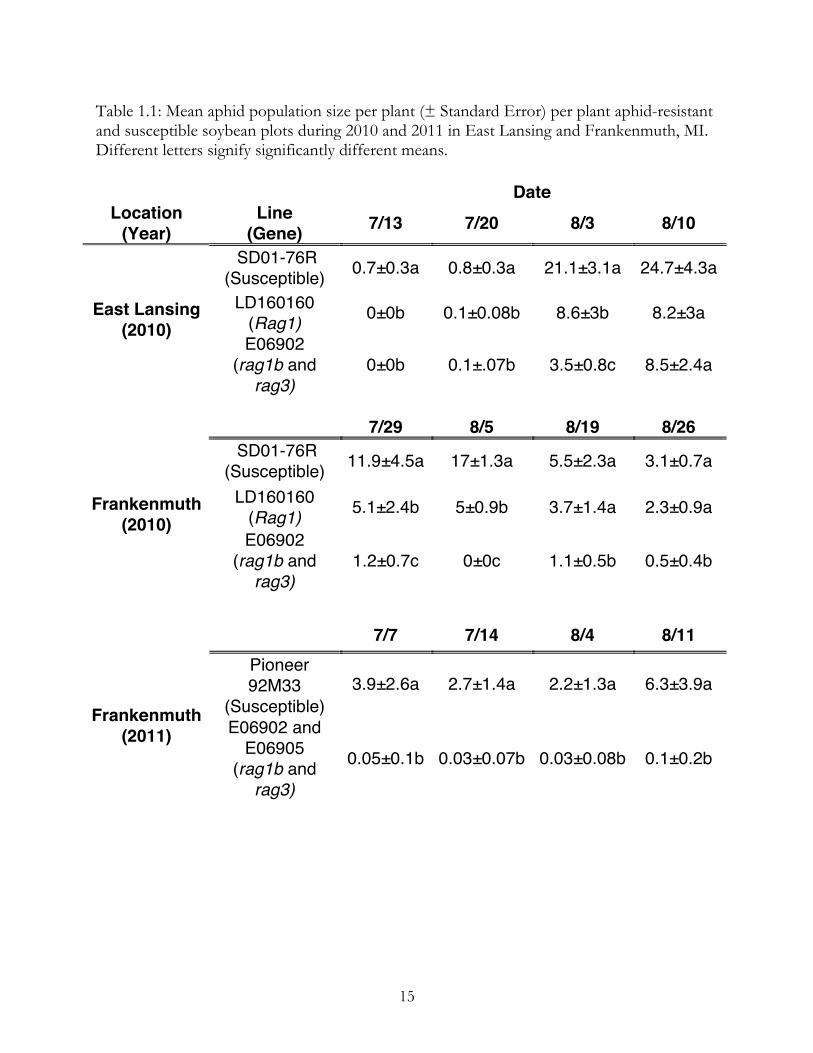
Table 1.1: Mean aphid population size per plant (± Standard Error) per plant aphid-resistant and susceptible soybean plots during 2010 and 2011 in East Lansing and Frankenmuth, MI. Different letters signify significantly different means. Date
Location (Year)
Line (Gene) 7/13 7/20 8/3 8/10
SD01-76R (Susceptible) 0.7±0.3a 0.8±0.3a 21.1±3.1a 24.7±4.3a
LD160160 (Rag1) 0±0b 0.1±0.08b 8.6±3b 8.2±3a East Lansing
(2010) E06902
(rag1b and rag3)
0±0b 0.1±.07b 3.5±0.8c 8.5±2.4a
7/29 8/5 8/19 8/26
SD01-76R (Susceptible) 11.9±4.5a 17±1.3a 5.5±2.3a 3.1±0.7a
LD160160 (Rag1) 5.1±2.4b 5±0.9b 3.7±1.4a 2.3±0.9a Frankenmuth
(2010) E06902
(rag1b and rag3)
1.2±0.7c 0±0c 1.1±0.5b 0.5±0.4b
7/7 7/14 8/4 8/11 Pioneer 92M33
(Susceptible) 3.9±2.6a 2.7±1.4a 2.2±1.3a 6.3±3.9a
Frankenmuth (2011) E06902 and
E06905 (rag1b and rag3)
0.05±0.1b 0.03±0.07b 0.03±0.08b 0.1±0.2b
16
Figure 1.2: Mean population size of aphids per plant (± Standard Error) on open and closed aphid islands during 2010 and 2011.
17
Table 1.2- Biological control service index (BSI) values (± Standard Error) in aphid suppression on aphid islands in aphid-resistant and susceptible soybean (Glycine max). Different letters signify significantly different means. Date
Location (year)
Line (Gene) 7/20 8/10
SD01-76R (Susceptible) 0.99±0.0a 0.54±0.2a
LD160160
(Rag1) 0.96±0.02a 0.64±0.1a
East Lansing (2010)
E06902 (rag1b and rag3) 0.95±0.03a 0.37±0.2a
8/5 8/26
SD01-76R (Susceptible) 0.74±0.1a 0.75±0.2a
LD160160
(Rag1) 0.64±0.1a 0.89±0.05a
Frankenmuth
(2010)
E06902 (rag1b and rag3) 0.76±0.2a 0.96±0.0a
7/14 8/11
Pioneer 92M33 (Susceptible) 0.95±0.01a 0.85±0.2a
Frankenmuth (2011) E06902 and
E06905 (rag1b and rag3)
0.98±0.1a 0.68±0.1a
18
Table 1.3: Mean quantity (± Standard Error) and diversity of natural enemies collected in aphid-resistant and susceptible soybean (Glycine max) in East Lansing and Frankenmuth.
Date Diversity Location
(Year) Line/Variety
(Gene) 7/13 7/20 8/3 8/10 Simpsons (D)
Shannon (H')
SD01-76R (Susceptible) 4±1.7 5.8±3.1 5.3±1.2 8.5±2.9 0.90±0.13 0.60±0.1
2
LD160160 (Rag1) 0.7±0.6 1.7±0.3 4±2.8 1.5±0.4 0.54±0.10 0.76±0.1
1 East Lansing
(2010) E06902
(rag1b and rag3) 0.8±0.5 3±1.4 1±0.5 1±0 1.0±0.22 0.58±0.07
7/29 8/5 8/19 8/26
SD01-76R (Susceptible) 5.3±1.3 1.7±0.3 1±0 3.5±1.5 0.64±0.12 0.59±0.0
7 LD160160
(Rag1) 2.3±0.9 1±0 2±0 2.3±1.5 0.56±0.10 0.63±0.06
Frankenmuth (2010)
E06902 (rag1b and rag3) 2±0 2±0.7 1±0 1±0 0.62±0.11 0.38±0.0
8
7/7 7/14 8/4 8/11 Pioneer 92M33
(Susceptible) 49±7.0 51±7.6 117±15.2 63.8±18.9 0.28±0.05 1.9±0.08
Frankenmuth (2011) E06902 and E06905
(rag1b and rag3) 47.8±6.5 52.3±12.8 74.5±15.3 66.3±20.1 0.20±0.02 1.7±0.18
19
Table 1.4: Mean (± Standard Error) coccinellid beetles and anthocorid bugs collected in aphid resistant aphid susceptible soybean (Glycine max) and Frankenmuth, MI during 2011. Different letters signify significantly different means.
Line/Variety (Gene) Taxa 7/1-7/14 7/28-
8/11
Anthocoridae 32±9a 160±35d Pioneer 92M33 (Susceptible) Coccinellidae 25±3c 16±2e
Anthocoridae 54±8a 128±27d E06902 and E06905 (rag1b and rag3)
Coccinellidae 10±1b 8±1f
20
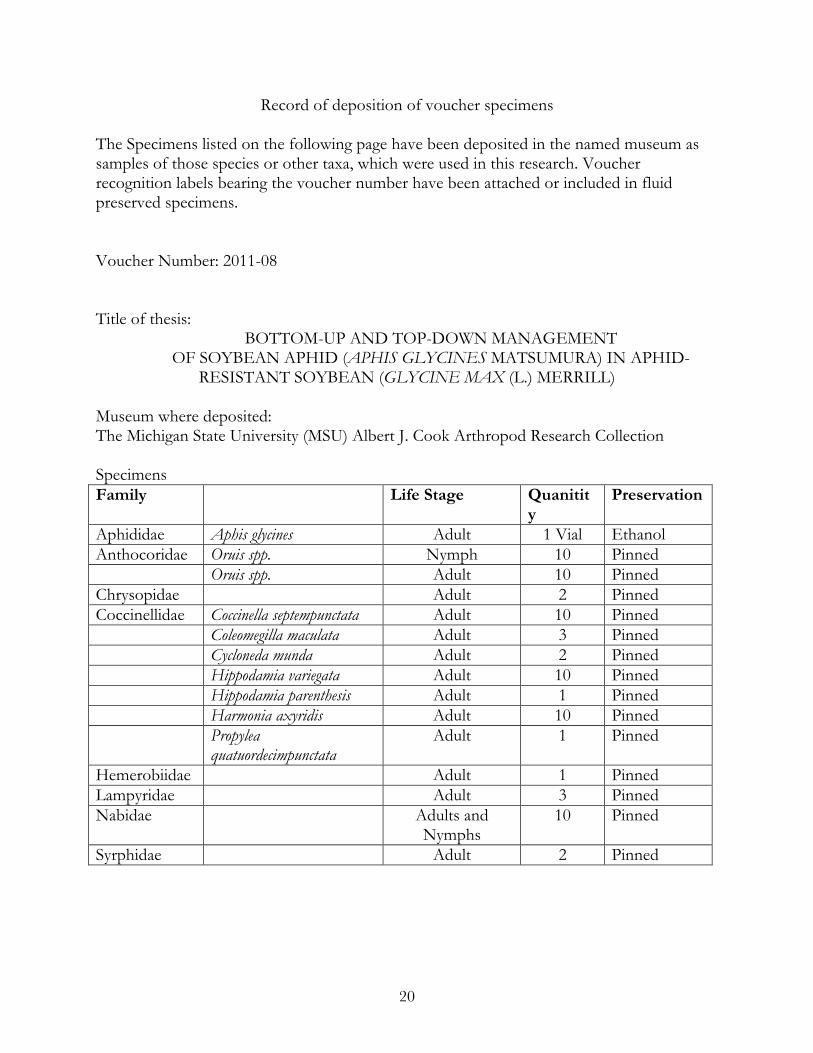
Record of deposition of voucher specimens
The Specimens listed on the following page have been deposited in the named museum as samples of those species or other taxa, which were used in this research. Voucher recognition labels bearing the voucher number have been attached or included in fluid preserved specimens. Voucher Number: 2011-08 Title of thesis:
BOTTOM-UP AND TOP-DOWN MANAGEMENT OF SOYBEAN APHID (APHIS GLYCINES MATSUMURA) IN APHID-
RESISTANT SOYBEAN (GLYCINE MAX (L.) MERRILL) Museum where deposited: The Michigan State University (MSU) Albert J. Cook Arthropod Research Collection Specimens Family Life Stage Quanitit
y Preservation
Aphididae Aphis glycines Adult 1 Vial Ethanol Anthocoridae Oruis spp. Nymph 10 Pinned Oruis spp. Adult 10 Pinned Chrysopidae Adult 2 Pinned Coccinellidae Coccinella septempunctata Adult 10 Pinned Coleomegilla maculata Adult 3 Pinned Cycloneda munda Adult 2 Pinned Hippodamia variegata Adult 10 Pinned Hippodamia parenthesis Adult 1 Pinned Harmonia axyridis Adult 10 Pinned Propylea
quatuordecimpunctata Adult 1 Pinned
Hemerobiidae Adult 1 Pinned Lampyridae Adult 3 Pinned Nabidae Adults and
Nymphs 10 Pinned
Syrphidae Adult 2 Pinned

21
REFERENCES
22
REFERENCES
Barbier, B., and G. Heal. 2006. Valuing ecosystem services. Econ. Voice. Aug 2006. 3(2): 1-6.
Bozsik, A. 2006. Susceptibility of adult Coccinella septempunctata (Coleoptera: Coccinellidae) to
insecticides with different modes of action. Pest Manag. Sci. 62: 651-654. Chiozza, M., G. MacIntosh and M. O’Neal. 2008. Exploring soybean germplasm for
resistance to Aphis glycines. Poster presentation, Entomological Society of America, Annual Meeting. 17 November. Reno, Nevada.
Costamagna, A., and D. Landis. 2006. Predators exert top-down control of soybean aphid
across a gradient of agricultural management systems. Ecol. Appl. 16(4): 1619-1628. Costamagna A., D. Landis, and C. DiFonzo. 2007. Suppression of soybean aphid by
generalist predators results in a trophic cascade in soybeans. Ecol. Appl. 17(2): 441-451.
Daily, G., S. Polasky, J. Goldstein, P. Kareiva, H. Mooney, L. Pejchar, T. Ricketts, J.
Salzman, and R. Shallenberger. 2009. Ecosystem services in decision making. Front. Econ. Environ. 7(1): 21-28.
Daily, G., T. Soderqvist, S. Aniyar, K. Arrow, P. Dasgupta, P. Ehrlich, C. Folke, A. Jansson,
B. Jannson, N. Kautsky, S. Levin, J. Lubchenco, K. Moler, D. Simpson, D. Starrett, D. Tilman, and B. Walker. 2000. The value of nature and the nature of value. Science. 289(5478): 395-396.
Desneux, N., A. Decourtye, and J. Delpuech. 2007. The sublethal effects of pesticides on
beneficial arthropods. Annu. Rev. Entomol. 52: 81-106. Desneux, N., R. O'Neil, and H. Yoo. 2006. Suppression of population growth of the
soybean aphid, Aphis glycines Matsumura, by predators: The identification of a key predator and the effects of prey dispersion, predator abundance, and temperature. Environ. Entomol. 35(5): 1342-1349.
DiFonzo, C. 2009. Tiny terrors: the soybean aphid. Am. Entom. 55(1): 16-18. Dixon, A. 1998. Aphid Ecology. Chapman and Hall, London. Donaldson, J., S. Myers, and C. Gratton. 2007. Density-dependent responses of soybean
aphid (Aphis glycines Matsumura) populations to generalist predators in mid to late season soybean fields. Biol. Control. 34: 111-118.
23
Dreyer, D., and B. Campbell. 1987. Chemical basis of host-plant resistance to aphids. Plant Cell Environ. 10: 353-361.
Elliott, N., and R. Kieckhefer. 2000. Response by coccinellids to spatial variation in cereal
aphid density. Popul. Ecol. 42:81-90. Elzen, G., 2001. Lethal and sublethal effects of insecticide residues on Orious insidiosus
(Hemiptera: Anthocoridae) and Geocoris punctipes (Hemiptera: Lygaeidae). J. Econ. Entomol. 94(1): 55-59.
Evans, E., and N. Youssef. 1992. Numerical responses of aphid predators to varying prey
density among Utah alfalfa fields. J. Kan. Entomol. Soc. 65(1): 30-38. Gardiner, M., D. Landis, C. Gratton, C. DiFonzo, M. O'Neal, J. Chacon, M. Wayo, N.
Schmidt, E. Mueller, and G. Heimpel. 2009. Landscape diversity enhances biological control of an introduced crop pest in the north-central USA. Entomol. App. 19(1): 143-154.
Hemptine, J., A. Dixon, and J, Coffin. 1992. Attack strategies of ladybird beetles
(Coccinellidae): factors shaping their numerical response. Oecologia 90: 238-245. Hill, C., L. Crull, T. Herman, D. Voegtlin, and G. Hartman. 2010. A new soybean aphid
(Hemiptera: Aphididae) biotype identified. J. Econ. Entomol. 103(2): 509-515. Hill, C., Y. Li, and G. Hartman. 2004. Resistance to the soybean aphid in soybean
germplasm. Crop Sci. 44: 98-106. Hill, C., Y. Li, and G. Hartman. 2006. A single dominant gene for resistance to the soybean
aphid in the soybean cultivar Dowling. Crop Sci. 46: 1601-1605. Ives, A., P. Kareiva, and R. Perry. 1993. Response of a predator to variation in prey density
at three hierarchical scales: lady beetles feeding on aphids. Ecol. 74(7): 1929-1938. Johnson, K., M. O'Neal, D. Ragsdale, C. DiFonzo, S. Swinton, P. Dixon, B. Potter, E.
Hodgson, and A. Costamagna. 2009. Probability of cost-effective management of soybean aphid (Hemiptera: Aphididae) in north America. J. Econ. Entomol. 102(6): 2101-2106.
Kim, K., C. Hill, G. Hartman, R. Mian, and B. Diers. Discovery of soybean aphid biotypes.
Crop. Sci. 48: 923-928. Koch, R. 2003. The multicolored Asian lady beetle, Harmonia axyridis: a review of its biology,
used in biological control, and non-target impacts. J. Insect Sci. 3:32-33.
24
Landis, D., T. Fox, and A. Costamagna. 2004. Impact of multicolored asian lady beetle as a biological control agent. Amer. Entomol. 50(3): 153-154.
Losey, J. and M. Vaughan. 2006. The economic value of ecological services provided by
insects. BioScience 56(4): 311-323. Li, Y., C. Hill, S. Carlson, B. Diers, and G. Hartman. 2007. Soybean aphid resistance genes in the soybean cultivars Dowling and Jackson map to linkage group M. Mol. Breed. 19: 25-34.
Mensah, C., C. DiFonzo, R. Nelson, and D. Wang. 2005. Resistance to soybean aphid in
early maturing soybean germplasm. Crop Sci. 45: 2228-2233. Mensah, C., C. DiFonzo, and D. Wang. 2008. Inheritance of soybean aphid resistance in
PI567541B and PI567598B. Crop Sci. 48: 1759-1763. Mian, M., S. Kang, S. Beil, and R. Hammond. 2008. Genetic linkage mapping of the soybean
aphid resistance gene in PI243540. Theor. Appl. Genet. 117: 955-962. Myers, S., D. Hogg, and J. Wedberg. 2005. Determining the optimal timing of foliar
insecticide applications for control of soybean aphid (Hemiptera: Aphididae) on soybean. J. Econ, Entomol. 98(6): 2006-2012.
Miao, J., K. Wu, K. Hopper, and G. Li. 2007. Population dynamics of Aphis glycines
(Homoptera: Aphididae) and impact of natural enemies in northern China. Environ. Entomol. 36(4): 840-848.
(NCSRP) North Central Soybean Research Program. 2004. Soybean aphid research update.
Plane Health Initiative NCSRP, Ankeny, IA. Nelson, E., G. Mendoza, J. Regetz, S. Polasky, H. Tallis, D. Cameron, K. Chan, G. Daily, J.
Goldstein, P. Kareiva, E. Lonsdorf, R. Naidoo, T. Ricketts, and M. Shaw. 2009. Modeling multiple ecosystem services, biodiversity conservation, commodity production and tradeoffs at landscape scales. Front. Ecol. Environ. 7(1): 4-11.
Ohnesorg, W., K. Johnson, and M. O'Neal. 2009. Impact of reduced-risk insecticides on
soybean aphid and associated natural enemies. J. Econ. Entomol. 102(5): 1816-1826. Orr, D., and D. Boethel. 1986. Influence of plant antibiosis through four trophic levels.
Oecologia 70: 242-249. Ragsdale, D., B. McCornack, R. Venette, B. Potter, I. Macrae, E. Hodgson, M. O'Neal, K.
Johnson, R. O'Neil, C. DiFonzo, T. Hunt, P. Glogoza, and E. Cullen. 2007. Economic threshold for soybean aphid. J. Econ. Entomol. 100(4): 1258-1267.
25
Ragsdale, D., D. Voegtlin, and R. O'Neil. 2004. Soybean aphid biology in North America. Ann Entomol. Soc. Am. 97(2): 204-208.
Rutledge, C., R. O'Neil, T. Fox, and D. Landis. 2004. Soybean aphid predators and their use
in integrated pest management. Popul. Ecol. 47: 71-76. SAS Institute. 2009. SAS Version 9.1. Gary, NC. Schellhorn, N., and D. Andow. 2005. Response of coccinellids to their aphid prey at
different spatial scales. Popul. Ecol. 47: 71-76. Song, F., S. Swinton, C. DiFonzo, M. O'Neal, and D. Ragsdale. 2006. Profitability analysis of
soybean aphid control treatments in three north-central states. Michigan State University, Department of Agricultural Economics, Staff Paper 2006-25.
26
CHAPTER 2: HOST PLANT RESISTANCE TO SOYBEAN APHID (APHIS GLYCINES
MATSUMURA) IN POTASSIUM DEFICIENT SOILS
Abstract
When soybean aphids were first discovered in the United States in 2000, researchers
and growers noticed the damage associated with large aphid numbers and soils that were low
in potassium. Researchers observed that aphids on potassium deficient plants had higher
fecundity, survivorship, and population density than aphids on plants with sufficient
potassium. Plant breeders quickly identified several aphid resistance genes that significantly
suppress the number of aphids. How effective these aphid-resistance genes were in plants
grown in potassium deficient soils was unknown. Soybean plants with single gene resistance
(Rag1), double gene resistance (rag1b and rag3, and rag1c and rag4), as well as susceptible
soybean were planted in aphid and predator-proof cages in a potassium deficient field. Half
of the cages were amended with potash while the other half remained potassium deficient.
Plants were infested with aphids and monitored through the growing season. No significant
difference in aphid populations was detected between plants grown in potassium deficient
and potassium amended soil. Resistant plants had significantly lower aphid populations than
susceptible plants in both potassium deficient and potassium-amended cages.
27
Introduction
The soybean aphid (Aphis glycines Matsumura) is an important pest of soybean (Glycine
max (L.) Merrill) in North America and East Asia. The soybean aphid was first identified in
the United States in 2000 (Venette and Ragsdale 2004). By 2003, it was established in 21
states and 3 Canadian provinces (NCSRP 2004). Its introduction resulted in an estimated
$1.7 billion in annual soybean crop loss (NCSRP 2004) and a 130-fold increase in the
amount of insecticides applied to soybean between 2000 and 2006 (Ragsdale et al. 2010).
Aphids feed by tapping into the plant phloem and suck sap from soybean plants. This
inhibits photosynthesis (Macedo et al. 2003, Diaz-Montano et al. 2007) and during outbreaks,
soybean aphids can reduce seed size, yield, and oil content (Ragsdale et al. 2007, Beckendorf
et al. 2008). Soybean aphid vectors viruses of soybean (Pederson et al. 2007, Wang et al. 2006,
Burrows et al. 2005, Wang and Ghabrial 2002) and other important crops, including dry
beans (DiFonzo and Agle 2008), snap beans (Larsen et al. 2008) and potato (Davis et al. 2005,
Wang et al. 2006, Davis and Radcliffe 2008).
In 2000, when soybean aphid was discovered in the US, growers in southwest
Michigan reported yellowing of soybean leaves in aphid-infested fields. Foliar tissue analysis
revealed that these plants were potassium deficient and field observations suggested that
aphid numbers were elevated in these fields (DiFonzo and Hines 2001). In laboratory studies
Myers et al. (2005) determined that aphids on leaves from potassium deficient plants had a
significantly greater intrinsic and finite rate of increase as well as in increased net
reproductive rate. Myers and Gratton (2006) demonstrated that aphids on plants growing in
low potassium soil in a laboratory had a greater rate of population increase when compared
28
to aphids on plants growing in soil with higher levels of potassium. Walter and DiFonzo
(2007) showed that aphids on potassium deficient plants had s shorter time to first
reproduction and greater production of nymphs per day. They also recorded that aphid
density was greater on plants in potassium-deficient soybean fields.
Plant phloem is rich in sugar but is an otherwise poor source of nutrients. Nitrogen is
a limiting factor in aphid population growth (Dixon 1998). The most efficient source of
nitrogen for aphids is free amino acids in plant sap, which are either essential or can be
converted to essential amino acids by symbiotic bacteria within the aphid (Dixon 1998).
Walter and DiFonzo (2007) found that the sap of potassium deficient plants had an elevated
percentage of asparagine, one such free amino acid. The increased concentration of free
amino acids, such as asparagine, could account for the increased fecundity of soybean aphids
on potassium deficient plants. In a region-wide survey of ecological factors Noma et al.
(2010) found negative correlation between soil potassium level and soybean aphid
populations across the midwest. The link between soybean aphid population growth and soil
potassium level is now generally accepted.
Shortly after the discovery of soybean aphid in North America, soybean breeders
began to screen for host plant resistance. Hill et al. (2006) reported the first aphid resistance
gene, Rag1 (Resistance Aphis glycines 1); a second gene, Rag2 was reported by Mian et al
(2012). In Michigan, Mensah et al. (2005) screened over 2,000 plant introductions (PIs) for
aphid resistance, and found two expressing recessive two-gene epistatic (synergistic)
resistance. These genes were named rag1b and rag3, and rag1c and rag4 (Mensah et al. 2005).
Commercial varieties of soybean with Rag1 genes have been available since 2010 and the
29
introduction of additional aphid resistance genes is expected. The ultimate goal of aphid-
resistant soybean is to reduce environmental and economic cost of insecticide use, making
soybean production more profitable and sustainable.
Currently identified aphid-resistance genes negatively impact soybean aphid
populations through antibiosis, although the exact mechanism is not yet fully understood.
Chiozza et al. (2010) determined that aphid-resistant Rag1 soybean had significantly lower
concentrations of several free amino acids, including asparagine, than aphid susceptible
plants and that the concentration of free amino acids strongly correlated with aphid density
on plants. The antibiotic effects of some or all soybean aphid resistance genes could be a
product of the nutritional quality of resistant plants. If this is the case, the efficacy of aphid
resistant soybean in potassium deficient soils is questionable.
The use of host plant resistance to manage soybean aphid is still new and relatively
untested. How aphid-resistant soybean lines perform under varying conditions is not known.
The objective of this study was to determine if soybean aphid resistance is maintained under
potassium deficient conditions.
Materials and Methods
This study was conducted in 2009, 2010, and 2011 in a potassium deficient field in
Montcalm County, Michigan. The specific location of the study within the field shifted each
year to avoid working on the same place. Preliminary soil tests of the field averaged between
44 and 62 parts per million potassium, approximately 50-70 parts per million below
optimum levels (Staton and Wylie 2009). In all years, square (1m x 1m x 1m) or rectangular
30
(1m x 1m x 2m) predator-proof cages (Lumite Inc., Gainsville GA. 32 x 32 amber mesh)
were and assigned one of two treatments, not-fertilized (K-) or fertilized (K+), by adding 0-
0-62 potash (Northern Star Minerals, Okemos, MI). The amount of potash applied was
based on soil test results and the recommendations from the Michigan State University
(MSU) Soil Testing Lab, East Lansing, MI. The potash was spread by hand evenly across the
soil surface in the cage and incorporated using a hand cultivator. After fertilization, soybean
seeds were planted in each cage. Soil and tissue samples from each cage were taken and
analyzed at the MSU Soil Testing Lab (Table 2.1). After emergence plants were thinned to
predetermined numbers and infested with aphids collected from susceptible soybean at the
MSU Entomology Research Farm, East Lansing, MI. To sample soybean aphid numbers, ten
plants per line in each cage were randomly selected and counted until the average number of
aphids per plant was above 1,000 on the line with the most aphids. Between 1,000 and 5,000
aphids per plant, five plants per line were counted, above 5,000 aphids per plant, three plants
per line were counted.
In 2009, eight square cages were erected. Four cages were fertilized with 0.07 kg of
potash on 17 June and the remaining four cages were not treated. On 24 June, 120 seeds of
an aphid-resistant line, E06902 (rag1b and rag3), were hand planted in each cage. On 15 July,
plants were thinned to 80 plants per cage. On 22 July, each plant in every cage was infested
with 5 aphids. Beginning seven days after infestation, plants were destructively sampled
every seven days for 35 days. Soil samples were taken from each cage 29 July. Tissue samples
were taken on 5 Aug, dried, and submitted to the MSU Soil Testing Laboratory for foliar
potassium levels.
31
In 2010, the study was repeated with more aphid resistant lines. On 7 June, ten
rectangular cages were erected. On 9 June, five cages were fertilized with 0.1kg of potash
while the remaining five cages remained untreated. Fertilized cages received an additional
0.05 Kg of potash 9 July. On 17 July soil was re-tested to determine if the fertilization
successfully increased soil K levels to optimum levels. On 17 June, 60 seeds from three
soybean aphid-resistant lines, LD16060 (Rag1), E06902 (rag1b and rag3), and E07906-2 (rag1c
and rag4) were planted in randomly assigned blocks within each cage. On 15 July each plant
in every cage received was infested with 5 aphids. On 26 July, plant samples were collected
from each cage, dried and submitted for analysis. Beginning seven days after the infestation
of replications, plants were destructively sampled every seven days for 42 days.
In 2011, the study was repeated with the inclusion of an aphid-susceptible line to
compare the numbers of aphids on aphid-resistant soybean to susceptible soybean. Twenty-
four square cages were erected on 24 and 25 May. Twelve cages were fertilized 31 May with
0.07 kg of potash. Each cage was planted to one of three soybean lines, SD01-76R (aphid-
susceptible), LD016060 (Rag1), or E06902 (rag1b and rag3). On 31 May, 30 soybean seeds
were planted in each cage. On 29 June, every plant in each cage was infested with a single
aphid. Beginning three days after infestation, whole-plant nondestructive counts were taken
every 3-4 days for 42 days. Soil samples from each cage were taken 1 July. Plant tissue
samples were taken 19 July.
In 2010, several E06902 plants had high aphid populations. To determine if a rag1c
and rag3 virulent biotype was present, samples of these aphids were collected and placed in
an incubator (16:8 light: dark, 25°C day, 20°C night) and maintained on susceptible soybeans
32
(Pioneer 92M33). Aphids collected from this colony as well as aphids from a colony
maintained in the MSU Field Crop Entomology greenhouses were placed on susceptible
soybean leaves in Petri dishes (100mm x 20mm, Corning Inc., Corning, NY) with wet filter
paper substrate. Soybean leaf stems were wrapped in damp gauze to prevent desiccation.
Petri dishes were placed in an incubator for 24 hours. Single, newly deposited nymphs were
removed with a damp camelhair brush and placed on the upper trifoliate of V1 susceptible
(Pioneer 93M33) and aphid resistant (E06902) soybeans. Ten susceptible plants received
aphids from the field colony and another ten received single aphids from the lab colony.
This was repeated with resistant plants making four treatments; field colony on susceptible,
field colony on resistant, lab colony on susceptible, and lab colony on resistant. Each plant
was covered with a clear plastic dome made by cutting off the bottom of a clear, 20 oz soda
bottle. Aphids were counted every two to three days for fourteen days.
Data from each year were analyzed separately using SAS 9.1 and JMP 8.0.2 (SAS
Institute, Inc. Cary, North Carolina). For all analyses, a 95% confidence interval was used.
Differences in foliar and soil potassium levels were compared using Students t-Test (proc
ttest). Repeated measures analysis (proc glm) was conducted on aphid numbers. This
including analysis of covariance (mancova) and allowed us to directly compare the difference
between aphid populations on fertilized and unfertilized plants, as well as the interaction
between fertilization time to determine if the rate of change of aphid populations (slope) was
significantly different between fertilized and unfertilized soybean plots.
33
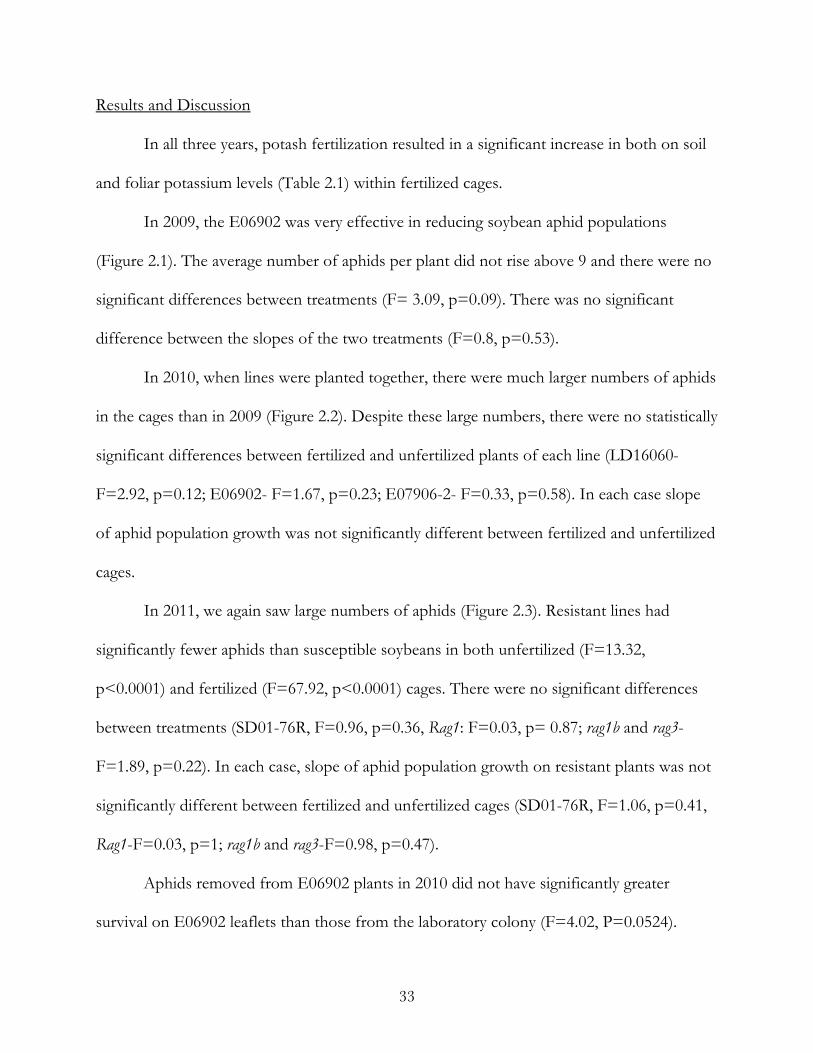
Results and Discussion
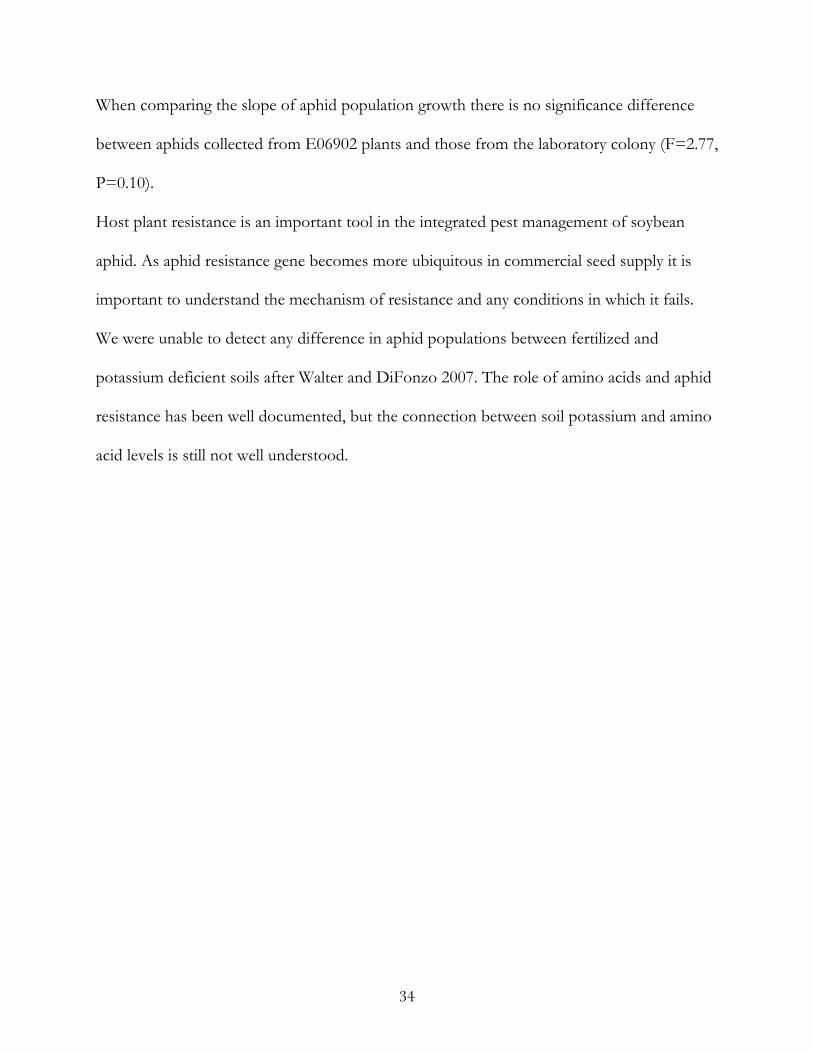
In all three years, potash fertilization resulted in a significant increase in both on soil
and foliar potassium levels (Table 2.1) within fertilized cages.
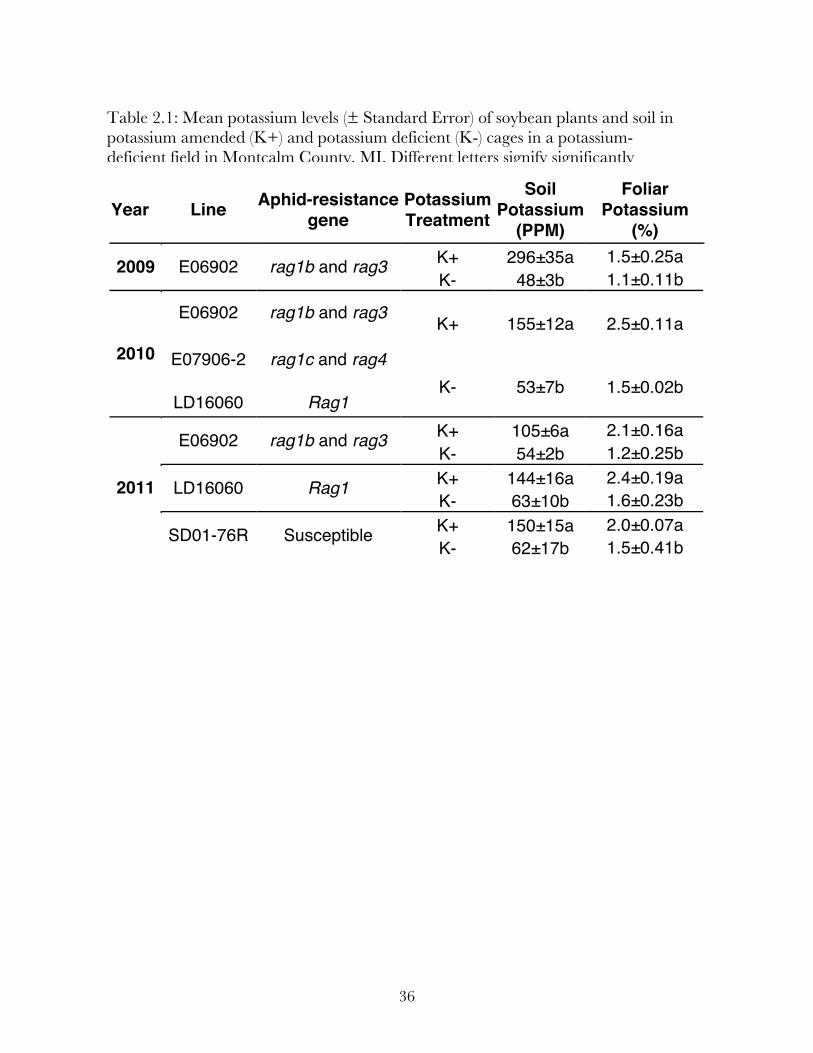
In 2009, the E06902 was very effective in reducing soybean aphid populations
(Figure 2.1). The average number of aphids per plant did not rise above 9 and there were no
significant differences between treatments (F= 3.09, p=0.09). There was no significant
difference between the slopes of the two treatments (F=0.8, p=0.53).
In 2010, when lines were planted together, there were much larger numbers of aphids
in the cages than in 2009 (Figure 2.2). Despite these large numbers, there were no statistically
significant differences between fertilized and unfertilized plants of each line (LD16060-
F=2.92, p=0.12; E06902- F=1.67, p=0.23; E07906-2- F=0.33, p=0.58). In each case slope
of aphid population growth was not significantly different between fertilized and unfertilized
cages.
In 2011, we again saw large numbers of aphids (Figure 2.3). Resistant lines had
significantly fewer aphids than susceptible soybeans in both unfertilized (F=13.32,
p<0.0001) and fertilized (F=67.92, p<0.0001) cages. There were no significant differences
between treatments (SD01-76R, F=0.96, p=0.36, Rag1: F=0.03, p= 0.87; rag1b and rag3-
F=1.89, p=0.22). In each case, slope of aphid population growth on resistant plants was not
significantly different between fertilized and unfertilized cages (SD01-76R, F=1.06, p=0.41,
Rag1-F=0.03, p=1; rag1b and rag3-F=0.98, p=0.47).
Aphids removed from E06902 plants in 2010 did not have significantly greater
survival on E06902 leaflets than those from the laboratory colony (F=4.02, P=0.0524).
34
When comparing the slope of aphid population growth there is no significance difference
between aphids collected from E06902 plants and those from the laboratory colony (F=2.77,
P=0.10).
Host plant resistance is an important tool in the integrated pest management of soybean
aphid. As aphid resistance gene becomes more ubiquitous in commercial seed supply it is
important to understand the mechanism of resistance and any conditions in which it fails.
We were unable to detect any difference in aphid populations between fertilized and
potassium deficient soils after Walter and DiFonzo 2007. The role of amino acids and aphid
resistance has been well documented, but the connection between soil potassium and amino
acid levels is still not well understood.

35
APPENDIX
36
Year Line Aphid-resistance gene
Potassium Treatment
Soil Potassium
(PPM)
Foliar Potassium
(%) K+ 296±35a 1.5±0.25a 2009 E06902 rag1b and rag3 K- 48±3b 1.1±0.11b
E06902 rag1b and rag3 K+ 155±12a 2.5±0.11a
E07906-2 rag1c and rag4 2010
LD16060 Rag1 K- 53±7b 1.5±0.02b
K+ 105±6a 2.1±0.16a E06902 rag1b and rag3 K- 54±2b 1.2±0.25b K+ 144±16a 2.4±0.19a LD16060 Rag1 K- 63±10b 1.6±0.23b K+ 150±15a 2.0±0.07a
2011
SD01-76R Susceptible K- 62±17b 1.5±0.41b
Table 2.1: Mean potassium levels (± Standard Error) of soybean plants and soil in potassium amended (K+) and potassium deficient (K-) cages in a potassium-deficient field in Montcalm County, MI. Different letters signify significantly different means.
37
Figure 2.1: Mean population size (± Standard Error) of soybean aphid on aphid-resistant soybean on potassium deficient and potassium amended soil during 2009.

38
Figure 2.2: Mean population size (± Standard Error) of soybean aphid on aphid-resistant soybean lines on potassium deficient and potassium amended soil during 2010.
39
Figure 2.3: Mean population size (± Standard Error) of soybean aphid on resistant and susceptible soybean lines on potassium deficient and potassium amended soil during 2011.

40
REFERENCES
41
REFERENCES
Beckendorf, E., M. Catangui, and W. Riedell. 2008. Soybean aphid feeding injury and soybean yield, yield components, and seed composition. Agron. J. 100: 237-446.
Burrows, M., C. Boerboom, J. Gaska, and C. Grau. 2005. The relationship between Aphis glycines and soybean mosaic virus incidence in different pest management systems. Plant Dis. 89: 926-934.
Chiozza, M., M. O'Neal, and G. MacIntosh. 2010. Constitutive and induced differential
accumulation of amino acid in leaves of susceptible and resistant soybean plants in response to the soybean aphid (Hemiptera: Aphididae). Environ. Entomol. 39(3): 856-864.
Davis, J., E. Radcliffe, and D. Ragsdale. 2005. Soybean aphid, Aphis glycines Matsumura, a
new vector of potato virus Y in potato. Am. J. Potato. Res. 82: 197-201.
Davis, J., and E. Radcliffe. 2008. The importance of an invasive aphid species in vectoring a persistently transmitted potato virus: Aphis glycines is a vector of potato leafroll virus. Plant Dis. 92:1515-1523
Diaz-Montano, J., J. Reese, W. Shapaugh, and L. Campbell. Chlorophyll loss caused by soybean aphid (Hemiptera: Aphididae) feeding on soybean. J. Econ. Entomol. 100(5): 1657-1662.
DiFonzo, D., and R. Hines. 2001. Soybean aphid in Michigan. Extension Bulletin E-2748. Michigan State University, East Lansing, MI. 4 pp.
DiFonzo, C., and K. Agle. 2008. Soybean aphid development on, and BCMV transmission to, Otebo dry bean. Crop Manag. 16 September 2008.
Dixon, A. 1998. Aphid Ecology. Chapman and Hall, London. Hill, C., Y. Li, and G. Hartman. 2004. Resistance to the soybean aphid in soybean
germplasm. Crop Sci. 44: 98-106.
42
Hill, C., Y. Li, and G. Hartman. 2006. A single dominant gene for resistance to the soybean aphid in the soybean cultivar Dowling. Crop Sci. 46: 1601-1605.
Larsen, R., P. Miklas, K. Eastwell, and C. Grau. 2008. A strain of clover yellow vein virus
that causes severe pod necrosis disease in snap bean. Plant Dis. 92: 1026-1032. Macedo, T., C. Bastos, L. Higley, K. Ostle, and S. Madhavan. 2003. Photosynthetic
responses of soybean to soybean aphid (Homoptera: Aphididae) injury. J. Econ. Entomol. 95(1): 188-193.
Mensah, C., C. DiFonzo, and D. Wang. 2008. Inheritance of soybean aphid resistance in
PI567541B and PI567598B. Crop Sci. 48: 1759-1763. Mensah, C., C. DiFonzo, R. Nelson, and D. Wang. 2005. Resistance to soybean aphid in
early maturing soybean germplasm. Crop Sci. 45: 2228-2233. Mian, M., S. Kang, S. Bell, and R. Hammond. 2008. Genetic linkage mapping of the soybean
aphid resistance gene in PI243540. Theor. Appl. Genet. 117: 955-962. Myers, S., and C. Gratton. 2006. Influence of potassium fertility on soybean aphid, Aphis
glycines Matsumura (Hemiptera: Aphididae), population dynamics at a field and regional scale. Environ. Entomol. 35(2): 219-227.
Myers, S., C. Gratton, R. Wolkowski, D. Hogg, and J. Wedburg. 2005. Effect of soil
potassium availability on soybean aphid (Hemiptera: Aphididae) populations dynamics and soybean yield. J. Econ. Entomol. 98(1): 113-120.
(NCSRP) North Central Soybean Research Program. 2004. Soybean aphid research update.
Plant Health Initiative, NCSRP, Ankeny, IA. Noma, T., C. Gratton, M. Colunga-Garcia, M. Brewer, E. Mueller, K. Wyckhuys, G.
Heimpel, and M. O'Neal. Relationship of soybean aphid (Hemiptera: Aphididae) to soybean plant nutrients, landscape structure, and natural enemies. Environ. Entomol. 39(1): 31-41.
Pedersen, P., C. Grau, E. Cullen, N. Koval, and J. Hill. 2007. Potential for integrated
management of soybean virus disease. Plant Dis. 91: 1255-1259. Ragsdale, D., D. Landis, J. Brodeur, G. Heimpel, and N. Desneux. 2010. Ecology and
management of the soybean aphid in North America. Annu. Rev. Entomol. 56: 374-399.
43
Ragsdale, D., B. McCornack, R. Venette, B. Potter, I. Macrae, E. Hodgson, M. O'Neal, K. Johnson, R. O'Neil, C. DiFonzo, T. Hunt, P. Glogoza, and E. Cullen. 2007. Economic threshold for soybean aphid. J. Econ. Entomol. 100(4): 1258-1267.
SAS Institute. 2009. SAS Version 9.1. Gary, NC. Venette R. and D. Ragsdale. 2004. Assessing the invasion by soybean aphid (Homoptera:
Aphididae): where will it end? Ann. Entomol. Soc. Am. 97(2): 219-226. Walter, A., and C. DiFonzo. 2007. Soil potassium deficiency affects soybean phloem
nitrogen and soybean aphid populations. Environ. Entomol. 36(1): 26-33. Wang, R., and S. Ghabrial. 2002. Effect of aphid behavior on efficiency of transmission of
soybean mosaic virus by the soybean-colonizing aphid, Aphis glycines. Plant Dis. 86: 1260-1264.
Wang, R., A. Kritzman, D. Hershman, and S. Ghabrial. 2006. Aphis glycines as a vector of
persistently and non-persistently transmitted viruses and potential risks for soybean and other crops. Plant Dis. 90: 920-926.
44
CHAPTER 3: MOLECULAR MARKER PROFILES OF SOYBEAN APHID (APHIS
GLYCINES MATSUMURA) ON APHID-RESISTANT AND SUSCEPTIBLE SOYBEAN
Abstract
Soon after soybean aphids were discovered in North America in 2000, molecular
techniques were adapted for investigating population dynamics. Around the same time,
aphid biotypes were observed that colonized aphid-resistant plants. We used 7 molecular
markers to compare populations of aphids from one susceptible and two aphid-resistant
soybean lines from two locations in Michigan. We found that aphids collected from both
locations were significantly different each other. We also found that the populations of
aphids from each resistant line were significantly different from the other resistant line.
Aphids collected from Rag1 plants in Frankenmuth were significantly different from
susceptible plants.
45
Introduction
The soybean aphid (Aphis glycines Matsumura) is an important pest of soybean (Glycine
max (L.) Merrill) in North America and East Asia. The soybean aphid was first identified in
the United States in 2000 (Venette and Ragsdale 2004). By 2003 it was established in 21
states and 3 Canadian provinces (NCSRP 2004), resulting in an estimated $1.7 billion in
annual soybean crop loss (NCSRP 2004) and a 130-fold increase in insecticides applied to
soybean between 2000 and 2006 (Ragsdale et al. 2010). Soybean aphids suck sap from
soybean plants and inhibit photosynthesis (Macedo et al. 2003, Diaz-Montano et al. 2007).
During outbreaks, large numbers of soybean aphids significantly reduce seed size, yield, and
oil content (Ragsdale et al. 2007, Beckendorf et al. 2008). Soybean aphids vector viruses of
soybean (Pederson et al. 2007, Wang et al. 2006, Burrows et al. 2005, Wang and Ghabrial
2002) and other important crops, including dry beans (DiFonzo and Agle 2008), snap beans
(Larsen et al. 2008) and potato (Davis et al. 2005, Wang et al. 2006, Davis and Radcliffe 2008).
Shortly after the discovery of soybean aphid in North America, breeders began
screening soybean germplasm for host-plant resistance. Several dominant Rag genes
(Resistance to Aphis glycines) were identified by Hill et al. (2004, 2006 - Rag and Rag1), Mian
et al. (2008 - Rag2) and Zhang et al. (2010 - Rag3). Mensah et al. (2005) described two plant
introductions (PIs) from China, PI 567541B and PI 567598B, each with two recessive aphid-
resistance genes (Zhang et al. 2009), rag1b and rag3, rag1c and rag4, respectively. In a multi-
state field screen, Chiozza et al. (2008) reported that soybean lines with these genes were
extremely effective in limiting aphid populations. Rag1 was the first gene licensed for
incorporation in commercial soybean lines, with other genes to follow.

46
The ability of aphids to overcome host-plant resistance is well documented (Dixon
1998, Dreyer and Campbell 1987). Aphids are relatively unique in their ability to reproduce
asexually, through parthenogenesis, or sexually, alternate hosts, and rely on gut symbionts to
augment poor diets. These aspects of aphid biology enhance the ability of aphids to adapt
quickly to new selection pressures; soybean aphids are no exception (Michel et al. 2011). At
least three biotypes of soybean aphid have been identified. Biotype-1 populations do not
colonize known aphid-resistant sources. Biotype-2 populations are virulent on Rag1 soybean
(Hill et al. 2009, Kim et al. 2008), and biotype-3 populations are virulent on Rag2 soybean
(Hill et al. 2010). These biotypes were found in research and breeding trials before the
widespread commercial planting of aphid-resistant soybean. There is no known biotype that
is virulent on rag1b and rag3 or rag1c and rag4 soybean. However, due to the suspected
variability of virulence within aphid populations, the potential exists for a biotype that is
virulent on rag1b and rag3 or rag1c and rag4 soybean to be discovered.
Because soybean aphid multiplies during the summer by parthenogenesis and no
sexual reproduction and genetic recombination occurs until the fall, the genetic makeup of
soybean aphid populations is fixed until the fall. The maximum overall genetic diversity of a
soybean aphid population is highest in the spring when fundatricies hatch from eggs on
buckthorn, and decreases until mating occurs in the fall. Within this system soybean aphid
evolution occurs in discreet periods of genetic reproduction (mating in the fall) and selection
(the summer months).
Molecular markers provide a tool to understand population dynamics of soybean
aphid in North America and the relationships of aphid populations on a landscape scale. By
47
comparing genetic markers in soybean aphid populations, the effects of geography and
selection can be determined. Michel et al. (2009), using molecular markers, compared the
diversity of Asian and North American soybean aphid populations and how aphid
populations interact on a landscape scale (Michel et al. 2009, Michel et al. 2009 Michel et al.
2009). The use of these same molecular techniques can be used to discover how aphid
populations are impacted by aphid resistant soybean. Hill et al. (2010) suggested that a wide
range of virulence existed within soybean aphid populations in North America based on the
fact that biotypes were quickly identified on Rag1 and Rag2 soybean.
The objective of this study was to use single nucleotide polymorphisms (SNPs) to
examine the diversity and relationships of soybean aphid populations on resistant and
susceptible soybean. We expected to find distinctly different populations of soybean aphids
on resistant plants than on susceptible plants.
Materials and Methods
Soybean Lines
Three soybean lines representing three levels of resistance to soybean aphid were
planted in blocks at the Michigan State University (MSU) Entomology Field Station in East
Lansing, Ingham County, MI (42°41'26.12"N, 84°29'38.92"W) and at the MSU Saginaw
Valley Research and Extension Center in Frankenmuth, Saginaw County, MI (
43°23'54.81"N, 83°41'44.76"W). These lines were aphid-susceptible SD01-76R, single gene
resistant LD16060 (Rag1), and multi-gene resistant E06902 (rag1b and rag3). Plots were 0.1 ha
48
and replicated four times in a randomized complete block design. Plots were maintained
using conventional weed control and agronomic practices.
Aphid Populations
Soybean aphids were initially detected on 15 June in East Lansing and 1 July in
Frankenmuth. Aphids were sampled weekly beginning early July. Infested trifoliates were
collected 10 August (East Lansing) and 12 and 19 August (Frankenmuth). Trifoliates were
returned to the laboratory, where one aphid was removed from each infested trifoliate with a
camelhair brush, and placed individually in a 2ml microfuge tube. Tubes were stored in a
−20ºC freezer until analysis. A minimum of 32 aphids were collected from each plot with
the exception of two E06902 plots at Frankenmuth. Due to the extremely low aphid
numbers, only 19 aphids were collected from these plots.
Aphid Genotyping
Genotyping of aphids was conducted at The Ohio State University Ohio Agriculture
Research and Development Center (OARDC) in Wooster, OH. Individual aphids were
placed in PCR plates with 100 µl of QuickExtract Seed DNA Extraction Solution (Epicentre
Biotechnologies, Madison WI) for DNA extraction. Each aphid was crushed with a
micropipette tip to ensure that DNA was suspended in the extraction solution. Separate tips
were used for each aphid to avoid cross contamination. PCR plates were vortexed and
placed in an PCR cycler (Eppendorf Mastercycler, Eppendorf, Hamburg, Germany) for a
single cycle of 65º C for 6 minutes followed by 98º C for 2 minutes.
After extraction, one µl of DNA suspension from each sample was transferred to a
96 well PCR plate. Twenty-five µl of Qiagen Multiplex PCR solution (Qiagen, Valencia CA),
49
five µl of primer mix (See Table 1), and 18 µl of RNAase-free water (Qiagen, Valencia CA)
were added to the DNA to bring the total volume in each well to 50 µl. Plates were vortexed
then centrifuged for one minute at 1,000 rpm then returned to the PCR cycler. Samples were
held at 95º C for 15 minutes for enzyme activation and cycled for 30 seconds at 94º C, 55-
58.5º C for 30 seconds, and 72ºC for 30 seconds. This cycle was repeated 35 times, then
samples were held at 4ºC until processing. Samples were again vortexed and centrifuged for
one minute at 1,000 RPM. Three µl of the PCR products to 96 well PCR plates and
ExoSAP-it PCR product cleaner (1.2 µl, Affymetrix, Santa Clara, CA) was added to each
well. Each plate was vortexed then centrifuged for one minute at 1,000 rpm. The samples
were incubated at 37ºC for 30 minutes and inactivated by heating to 80ºC for 15 minutes.
An allele-specific primer extension (ASPE) assay was then conducted using ASPE
primer mix (Orantes 2011). dNTP-dCTP (Invitrogen Corporation, Carlsbad, CA) was added
to the products of the Multiplex PCR reaction, bringing each sample to 10 µl of solution.
Samples were vortexed and centrifuged for 1 minute at 1,000 rpm and placed in a PCR
cycler. Samples were held at 96ºC for two minutes and followed by 30 30-second cycles at
94ºC, 58ºC-60ºC for one minute, and 74ºC for 2 minutes, then held at 4ºC.
Each ASPE reaction mixture was then hybridized with 40 µl of FlexMAP
microsphere mixture (Millipore Corporation, Billerice, MA) to create a total volume of 50 µl.
Plates were mixed at 700 rpm for 1 minute. Samples were heated to 96ºC for 90 seconds to
denature DNA, then samples were held at 37ºC for 60 minutes to allow for hybridization.
Samples were placed in a centrifuge to pellet the beads and hybridized DNA. Supernatant
was removed by turning the plate upside down, allowing the liquid to be absorbed by a
50
KimWipe (Kimberly-Clark, Dallas, TX). Each sample was washed with 75 µl of TX
Hybridization buffer, centrifuged, and inverted on a KimWipe. This was repeated twice. The
pelleted beads were resuspended in 40 µl of TM Hybridization buffer containing 2 µl/ml
Streptavidin-R-phycoerythrin and incubated for 30 minutes at 37ºC. Plates were vortexed for
1 minute at 700 rpm. Each sample was analyzed using a Luminex 100 analyzer (Millipore
Corporation, Billerice, MA).
Genetic distance among the six populations was calculated using GenAlEx 6.4
(Peakall and Smouse 2006). Genetic distances were used to conduct principal component
analysis. The relationship between the six populations was calculated using Fst values
generated by FSTAT 2.9.3 (Goudet 2002).
Results
Aphid numbers at both locations were low, never reaching the economic threshold of
250 aphids per plant (Ragsdale et al. 2007). Despite the low aphid population, there were
significantly fewer aphids per plant on resistant soybean lines than on susceptible lines (Data
not shown). In each location, the resistant lines had fewer aphids than susceptible soybean
lines (Frankenmuth, F=36.4, p<0.0001; MSU, F=17.7, p<0.0001).
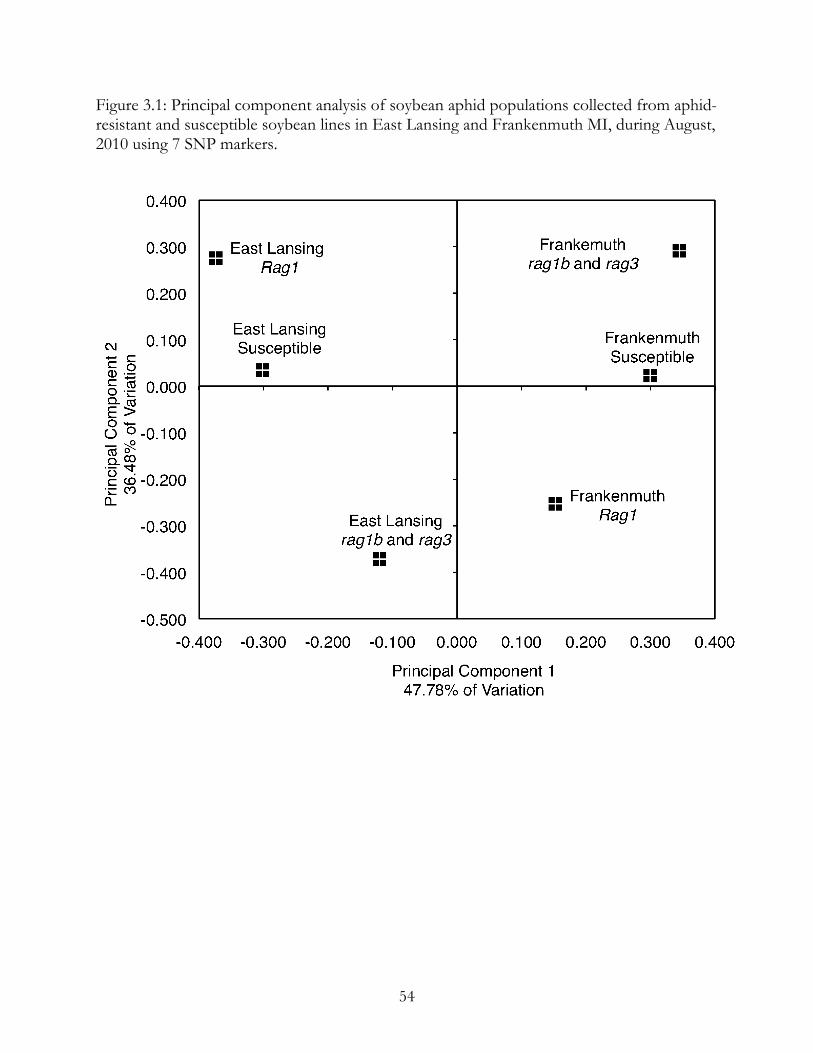
Principal component analysis (Figure 3.1) showed that the populations separated
along both principal component one and two. The populations separated by location (East
Lansing and Frankenmuth) along component one (47.78% of variation). Populations
separated by line along component two (36.48% of variation).
51
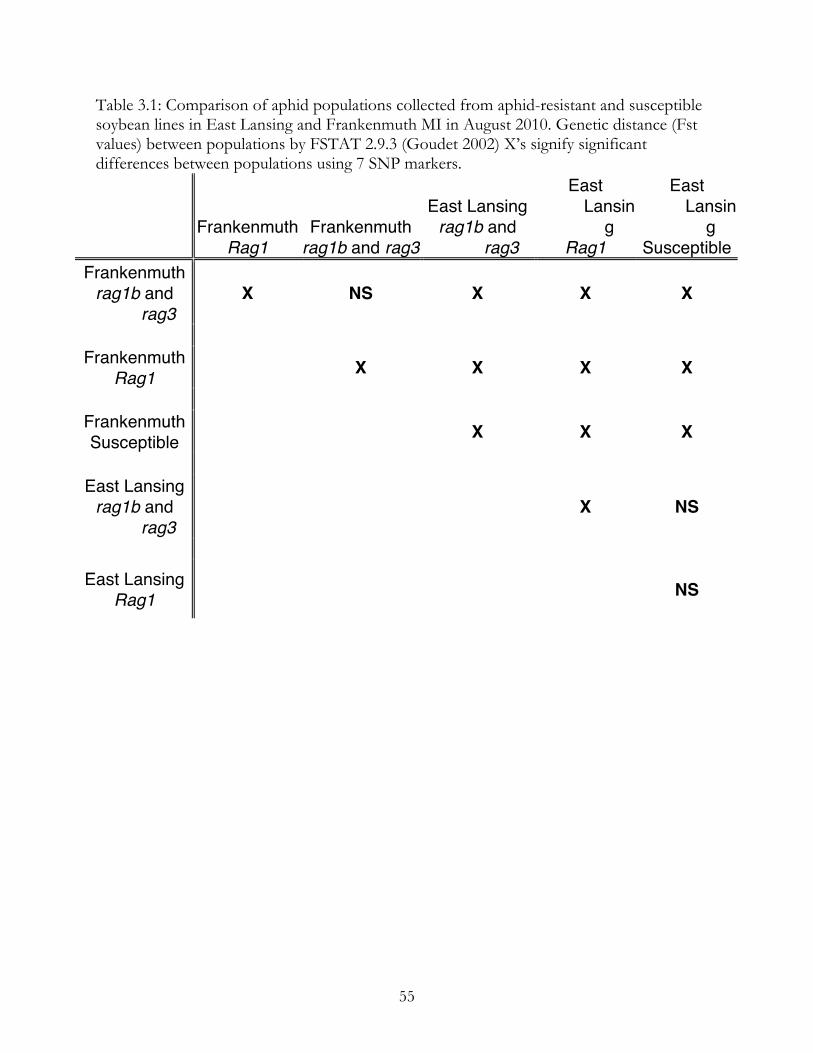
According to Fst values (Table 3.1), there was a significant difference among
populations by location. Populations from Frankenmuth and East Lansing were not similar.
Within locations, there were significant differences in populations collected from different
lines. Aphids collected from Rag1 and rag1b and rag3 lines were significantly different from
each other at both locations. However, aphids collected from rag1b and rag3 plants were
similar to aphids from susceptible plants. In East Lansing, aphids from Rag1 plants were not
significantly different from susceptible plants. In Frankenmuth, aphids from Rag1 plants
were significantly different than aphids from both susceptible and rag1b and rag3 aphid
resistant plants.
Discussion
Using molecular markers, we are able to examine how aphid-resistance genes effect
aphid populations. The aphids that are able to persist on these resistant lines represent a
small but highly virulent subset of the entire aphid population. Our results indicate two
distinctly different populations in the two locations. The aphids collected at East Lansing
and those collected from Frankenmuth were significantly different. This goes against current
thought about soybean aphid biology. The difference between populations collected at both
locations is not consistent with past studies that found no correlation between genetic
distance and geographical distance (Michel et al. 2009). We expected soybean line to be the
primary factor in differentiating populations with no significant difference between aphids
collected from both locations on the same soybean line. Not only did this not occur, but
populations graphed to the opposite quadrants of the principal component analysis. This
52
signifies a large impact of geography on genetics of soybean aphid in this study. A possible
explanation for this result is the low numbers of soybean aphid in Michigan soybean fields.
In a year with heavy aphid pressure there is an increased production of winged aphids when
aphid populations reach high densities (Ragsdale et al. 2004, Hodgson et al. 2005, Ragsdale et
al. 2010). The movement of these alates from field to field would contribute to homogeneity
of aphid populations. The low density of aphids in soybean fields leading to a smaller
number of highly mobile alates could contribute to the differences in populations between
the two locations.
The overlap between aphids collected on resistant and susceptible plants was
expected; aphid biotypes that are virulent on resistant plants will also be virulent on
susceptible plants. The significantly different populations of aphids on the two resistant lines
suggest that selection is occurring. Because different resistant genes are present in LD16060
and E06902, the probability of an aphid being virulent to both sources of resistance is low.
This study has significant implications for the management of soybean aphid. One of
the goals of implementing these genes is to prolong the efficacy of the resistance. Our
findings indicate that there could be a spatial component to developing aphid biotypes.
These results may only be valid in years when aphid numbers are low and aphid flights are
reduced. In years with higher soybean aphid pressure and substantial flights, the effect of
location may be lessened.

53
APPENDIX
54
Figure 3.1: Principal component analysis of soybean aphid populations collected from aphid-resistant and susceptible soybean lines in East Lansing and Frankenmuth MI, during August, 2010 using 7 SNP markers.
55
Table 3.1: Comparison of aphid populations collected from aphid-resistant and susceptible soybean lines in East Lansing and Frankenmuth MI in August 2010. Genetic distance (Fst values) between populations by FSTAT 2.9.3 (Goudet 2002) X’s signify significant differences between populations using 7 SNP markers.
Frankenmuth
Rag1 Frankenmuth
rag1b and rag3
East Lansing rag1b and
rag3
East Lansin
g Rag1
East Lansin
g Susceptible
Frankenmuth rag1b and
rag3 X NS X X X
Frankenmuth
Rag1 X X X X
Frankenmuth Susceptible X X X
East Lansing
rag1b and rag3
X NS
East Lansing
Rag1 NS

56
REFERENCES

57
REFERENCES Burrows, M., C. Boerboom, J. Gaska, and C. Grau. 2005. The relationship between Aphis
glycines and soybean mosaic virus incidence in different pest management systems. Plant Dis. 89: 926-934.
Chiozza, M., G. MacIntosh and M. O’Neal. 2008. Exploring soybean germplasm for
resistance to Aphis glycines. Poster presentation, Entomological Society of America, Annual Meeting. 17 November. Reno, Nevada.
Davis, J., E. Radcliffe, and D. Ragsdale. 2005. Soybean aphid, Aphis glycines Matsumura, a
new vector of potato virus Y in potato. Am. J. Potato. Res. 82: 197-201. Davis, J., and E. Radcliffe. 2008. The importance of an invasive aphid species in vectoring a
persistently transmitted potato virus: Aphis glycines is a vector of potato leafroll virus. Plant Dis. 92:1515-1523
Diaz-Montano, J., J. Reese, W. Shapaugh, and L. Campbell. Chlorophyll loss caused by
soybean aphid (Hemiptera: Aphididae) feeding on soybean. J. Econ. Entomol. 100(5): 1657-1662.
DiFonzo, C., and K. Agle. 2008. Soybean aphid development on, and BCMV transmission
to Otebo dry bean. Crop Manag. 16 September 2008. Dixon, A. 1998. Aphid Ecology. Chapman and Hall, London. Dreyer, D., and B. Campbell. 1987. Chemical basis of host-plant resistance to aphids. Plant
Cell Environ. 10: 353-36. Goudet, J. 2003. Fstat Version 2.9.3. Lausanne, Switzerland. Hill, C., Y. Li, and G. Hartman. 2004. Resistance to the soybean aphid in soybean
germplasm. Crop Sci. 44: 98–106. Hill, C., L. Crull, T. Herman, D. Voegtlin, and G. Hartman. 2010. A new soybean aphid
(Hemiptera: Aphididae) biotype identified. J. Econ. Entomol. 103(2): 509-515. Hodgson, E., R. Venette, M. Abrahamson, and D. Ragsdale. 2005. Alate production of
soybean aphid (Homoptera: Aphididae) in Minnesota. Environ. Entomol. 34(6): 1456-1465.
Kim, K., C. Hill, G. Hartman, R. Mian, and B. Diers. 2008. Discovery of soybean aphid
biotypes. Crop Sci. 48: 923-928.
58
Larsen, R., P. Miklas, K. Eastwell, and C. Grau. 2008. A strain of clover yellow vein virus that causes severe pod necrosis disease in snap bean. Plant Dis. 92: 1026-1032.
Macedo, T., C. Bastos, L. Higley, K. Ostlie, and S. Madhavan. 2003. Photosynthetic
responses of soybean to soybean aphid (Homoptera: Aphididae) injury. J. Econ. Entomol. 96: 188-193.
Mensah, C., C. DiFonzo, and D. Wang. 2008. Inheritance of soybean aphid resistance in
PI567541B and PI567598B. Crop Sci. 48: 1759-1763. Mensah, C., C. DiFonzo, R. Nelson, and D. Wang. 2005. Resistance to soybean aphid in
early maturing soybean germplasm. Crop Sci. 45: 2228-2233. Mian, M., S. Kang, S. Bell, and R. Hammond. 2008. Genetic linkage mapping of the soybean
aphid resistance gene in PI243540. Theor. Appl. Genet. 117: 955-962. Michel, A., W. Zhang, J. Jung, S. Kang, and R. Mian. 2009. Population genetic structure of
Aphis glycines. Environ. Entomol. 38(4): 1301-1311. Michel, A., O. Mittapalli, and M. Mian. 2011. Evolution of soybean aphid biotypes:
understanding and managing virulence to host-plant resistance. In A. Sudaric (ed.), Soybean, Molecular Aspects of Breeding. Intech, 514 pp.
(NCSRP) North Central Soybean Research Program. 2004. Soybean aphid research update.
Plant Health Initiative, NCSRP, Ankeny, IA. Pedersen, P., C. Grau, E. Cullen, N. Koval, and J. Hill. 2007. Potential for integrated
management of soybean virus disease. Plant Dis. 91: 1255-1259. Venette, R., and D. Ragsdale. 2004. Assessing the invasion by soybean aphid (Homoptera:
Aphididae): where will it end? Ann. Entomol. Soc. Am. 97(2): 219-226. Wang, R., A. Kritzman, D. Hershman, and S. Ghabrial. 2006. Aphis glycines as a vector of
persistently and non-persistently transmitted viruses and potential risks for soybean and other crops. Plant Dis. 90: 920-926.
Wang, R., and S. Ghabrial. 2002. Effect of aphid behavior on efficiency of transmission of
soybean mosaic virus by the soybean-colonizing aphid, Aphis glycines. Plant Dis. 86: 1260-1264.
Wu, Ni, and Liu. 1999. Occurrence and the control of the soybean aphid Aphis glycines
Matsumura. Chinese Journal of Biological Control. 6: 20. Translated by Z. Wu. Edited by G. Heimpel
59
Zhang, G., C. Gu, and D. Wang. 2009. Molecular mapping of soybean aphid resistance genes in PI567541B. Theor. Appl. Genet. 118: 473-482.