gbihc208mr sales force effectiveness in … force effectiveness in pharmaceuticals, kam process, ......
TRANSCRIPT

Sales Force Effectiveness in Pharmaceuticals Targeted Sales Models such as Enhanced Key Account Management (KAM) and Closed-Loop Marketing (CLM) Strategies Drives Sales Force Efficiency

GBI Research Report Guidance
GBIHC208MR / Published JUL 2012 Page 2
© GBI Research. This is a licensed product and is not to be photocopied
GBI Research Report Guidance
The report discusses the current state of sales force effectiveness in the pharmaceutical industry. It also discusses various models that are currently followed in the industry. The report also includes an analysis of case studies to identify the best sales force practices.
Chapter three overviews the significance of sales force effectiveness in the pharmaceutical industry. It discusses recent challenges in the pharmaceutical industry and explains why a company should have a strong and effective sales force.
Chapter four analyzes the new sales models. The models discussed in this chapter have proven to be industry standards for sales force effectiveness.
Chapter five describes how information technology (IT) enables sales models and strategies, and its impact on sales force effectiveness.
Chapter six provides insight into sales force sizing models, sales force recruitment strategies and the best practices that are followed to recruit a sales force. It also provides insight into the training and compensation strategies used to retain and motivate sales staff.
Chapter seven discusses the competitive landscape, provides the profiles of leading pharmaceutical companies and analyzes the selling, general and administrative (SG&A) expenses of these companies and their sales and marketing efficiency

GBIHC208MR / Published JUL 2012
Page 3 © GBI Research. This is a licensed product and is not to be photocopied
Executive Summary
Executive Summary
Sales Force Training and Incentive Management Systems Play an Important Role in Increasing Sales and Improving Productivity
Sales force training is the most important success factor to generate higher sales revenues. Many companies have realized the importance of this training and have established internal training for their sales forces. Large pharmaceutical companies have also implemented advanced training techniques and invest significant amounts in their training. In addition, some companies choose to use external training consultants. The short term motive behind sales force training is to increase sales and improve productivity. However, the long term motive is to motivate the sales force, build better customer relations and effectively improve employee retention rates.
Incentive management is a significant tool that encourages sales activities and helps to better sales force effectiveness. In the past, incentive management has not been implemented as the highest priority and was not properly integrated into the whole sales management process. However, a large number of companies are now implementing an incentive management solution that provides the flexibility to quickly change compensation plans to improve sales force behavior. This solution has the ability to adjust to specific company needs and allows for the integration of existing processes and systems.
Large and Medium Sized Pharmaceutical Companies are Implementing Key Account Management (KAM) Strategies to Enhance Effectiveness
In recent years, there has been a paradigm shift in the pharmaceutical industry regarding methods for effective selling, and this is reflected in the effectiveness of sales forces. In the US and Europe, the industry has recorded sales job reductions, and therefore sales force numbers have fallen. This reduction has encouraged pharmaceutical companies to realign the size, structure and sales strategies of their sales forces. In line with this development, pharmaceutical companies are now pressurized to generate higher profits with lower sales resources. KAM does so by creating strategic relationships with customers to deliver long term profitable sales growth and to achieve short term sales targets.
Sales Force Effectiveness in Pharmaceuticals, KAM Process, 2011
Key account identification and prioritization
Understanding needs and developing customer insights
Forming the virtual account team
Developing the strategic plan
Communicating and implementing the plan
Reviewing the results
Source: GBI Research
Incentive management is a significant tool that encourages sales activities and helps to better sales force effectiveness

GBIHC208MR / Published JUL 2012
Page 5 © GBI Research. This is a licensed product and is not to be photocopied
Table of Contents
1 Table of Contents
1 Table of Contents................................................................................................................................. 5 1.1 List of Tables............................................................................................................................. 7 1.2 List of Figures............................................................................................................................ 7
2 Introduction......................................................................................................................................... 9 3 Sales Force Effectiveness in Pharmaceuticals - An Overview.................................................................10
3.1 Sales Force Effectiveness Required...........................................................................................10 3.1.1 Declining Return on Investment (ROI) for R&D Expenditure................................................10 3.1.2 Pharmaceutical Company Staff Reductions .......................................................................12 3.1.3 Changing Product Portfolios .............................................................................................13 3.1.4 Difficulty Attaining Regulatory Approval ...........................................................................13 3.1.5 Specialty Care Focus.........................................................................................................13 3.1.6 Industry Consolidation and Changing Competition ............................................................13 3.1.7 IT Increasingly Applied to Sales Models.............................................................................13
4 Sales Force Effectiveness in Pharmaceuticals - Role of New Sales Models and Strategies ......................14 4.1 Implementation of Strategies in Pharmaceutical Companies .....................................................14
4.1.1 Implemented Sales Force Effectiveness Strategies .............................................................14 4.1.2 Future Implementation of Sales Force Effectiveness Strategies ..........................................15
4.2 Current Sales Models for Enhancing Sales Force Effectiveness ..................................................16 4.2.1 KAM Process ....................................................................................................................16 4.2.2 Types of KAM...................................................................................................................23 4.2.3 Case Studies.....................................................................................................................24
4.3 Contract Sales Outsourcing ......................................................................................................29 4.3.1 Contract Sales Representatives.........................................................................................30 4.3.2 Sales Team Recruitment and Training ...............................................................................30 4.3.3 Sales Data Analytics and Management.............................................................................30 4.3.4 Shared Sales Teams and Telesales ....................................................................................31 4.3.5 MSLs................................................................................................................................31 4.3.6 Deployment Sales Force Across Product Lifecycle ..............................................................32 4.3.7 The Evolving Model ..........................................................................................................34 4.3.8 Case Study .......................................................................................................................35
5 Sales Force Effectiveness in Pharmaceuticals - IT Applications in Sales Models .....................................36 5.1 Customer Relationship Management (CRM) .............................................................................36 5.2 Sales Force Automation (SFA)...................................................................................................36
5.2.1 Pharmaceutical CRM Vendors...........................................................................................36 5.3 Closed Loop Marketing (CLM) Systems .....................................................................................37
5.3.1 Benefits for Sales and Physicians.......................................................................................38 5.3.2 Benefits for Analytics........................................................................................................38 5.3.3 Benefits for Legal and Regulatory Departments ................................................................38 5.3.4 Benefits for Marketing .....................................................................................................38 5.3.5 CLM Vendors....................................................................................................................38 5.3.6 Case Studies.....................................................................................................................39
5.4 Predictive Modeling in Sales and Marketing..............................................................................43 5.4.1 Case Studies.....................................................................................................................45
5.5 Examining Strategies................................................................................................................46 5.5.1 Promotional Response Model ...........................................................................................47
5.6 Sales Force Effectiveness Dashboards.......................................................................................47 6 Sales Force Effectiveness in Pharmaceuticals - Sales Force Planning and Strategy .................................49
6.1 Sales Force Sizing.....................................................................................................................49 6.1.1 Affordability and Breakdown Method ...............................................................................49 6.1.2 Workload Build-up Technique...........................................................................................49
GBIHC208MR / Published JUL 2012
Page 6 © GBI Research. This is a licensed product and is not to be photocopied
Table of Contents
6.1.3 Competitive Benchmarking...............................................................................................51 6.1.4 Promotion Response Modeling .........................................................................................52
6.2 Sales Force Recruitment...........................................................................................................53 6.2.1 Introduction.....................................................................................................................53 6.2.2 Sales Force Recruitment Strategy......................................................................................53 6.2.3 Recruitment Process Outsourcing (RPO)............................................................................55 6.2.4 Case Studies.....................................................................................................................55
6.3 Sales Force Training and Compensation....................................................................................57 6.3.1 Introduction.....................................................................................................................57 6.3.2 Behavioral Coaching and the Five Step Model ...................................................................57 6.3.3 Specialty Care Training.....................................................................................................60 6.3.4 Continuous Assessments...................................................................................................61 6.3.5 Incentive Management ....................................................................................................62
7 Sales Force Effectiveness in Pharmaceuticals - Competitive Landscape.................................................65 7.1 Efficiency Analysis....................................................................................................................65 7.2 Company Profiles.....................................................................................................................67
7.2.1 Teva Pharmaceutical Industries Ltd. (Teva) .......................................................................67 7.2.2 Bristol-Myers Squibb (BMS) ..............................................................................................69 7.2.3 Sanofi ..............................................................................................................................71 7.2.4 Novartis AG (Novartis)......................................................................................................74 7.2.5 Merck & Co., Inc. (Merck) .................................................................................................75 7.2.6 Pfizer Inc. (Pfizer) .............................................................................................................78 7.2.7 Takeda Pharmaceutical Company Limited (Takeda)...........................................................79 7.2.8 GlaxoSmithKline plc (GSK).................................................................................................81 7.2.9 Johnson & Johnson (J&J)...................................................................................................84 7.2.10 Eli Lilly and Company (Lilly)...............................................................................................85 7.2.11 Abbott Laboratories (Abbott)............................................................................................88 7.2.12 AstraZeneca Plc (AstraZeneca)..........................................................................................90
8 Sales Force Effectiveness - Appendix ...................................................................................................93 8.1 Market Definitions...................................................................................................................93 8.2 Abbreviations ..........................................................................................................................93 8.3 Bibliography ............................................................................................................................94 8.4 Research Methodology ............................................................................................................95
8.4.1 Coverage .........................................................................................................................95 8.4.2 Secondary Research .........................................................................................................95 8.4.3 Primary Research .............................................................................................................95 8.4.4 Expert Panel Validation ....................................................................................................96
8.5 Contact Us...............................................................................................................................96 8.6 Disclaimer................................................................................................................................96

GBIHC208MR / Published JUL 2012
Page 7 © GBI Research. This is a licensed product and is not to be photocopied
Table of Contents
1.1 List of Tables
Table 1: Sales Force Effectiveness in Pharmaceuticals, Pharmaceutical and Biotech R&D Expenditure ($billion) v/s Number of NME/BLA Approvals, the US, 1995-2009.............................................11
1.2 List of Figures
Figure 1: Sales Force Effectiveness in Pharmaceuticals, Pharmaceutical and Biotech R&D Expenditure ($bn) v/s Number of NME/BLA Approvals, The US, 1995-2009 .................................................10
Figure 2: Sales Force Effectiveness in Pharmaceuticals, Global, Layoffs by Pharmaceutical Companies, 2010.......................................................................................................................................12
Figure 3: Sales Force Effectiveness in Pharmaceuticals, Global, Implemented Sales Strategies in Pharmaceutical Companies (%), 2011......................................................................................14
Figure 4: Sales Force Effectiveness in Pharmaceuticals, Global, Sales Strategies to be Implemented in the Future (%), 2011 .....................................................................................................................15
Figure 5: Sales Force Effectiveness in Pharmaceuticals, KAM Process, 2011 ............................................16 Figure 6: Sales Force Effectiveness in Pharmaceuticals, Identification and Prioritization of Key Accounts,
Risk vs. Potential .....................................................................................................................17 Figure 7: Sales Force Effectiveness in Pharmaceuticals, Key Accounts Identification and Prioritization, Skill
vs. Will....................................................................................................................................18 Figure 8: Sales Force Effectiveness in Pharmaceuticals, Key Accounts Primary Selection Criteria .............19 Figure 9: Sales Force Effectiveness in Pharmaceuticals, Understanding Needs and Developing Customer
Insights...................................................................................................................................20 Figure 10: Sales Force Effectiveness in Pharmaceuticals, Forming the Account Team................................21 Figure 11: Sales Force Effectiveness in Pharmaceuticals, Developing Key Account Strategic Plan...............21 Figure 12: Sales Force Effectiveness in Pharmaceuticals, Communicating and Implementing the Key
Account Strategic Plan ............................................................................................................22 Figure 13: Sales Force Effectiveness in Pharmaceuticals, Reviewing KAM Results......................................22 Figure 14: Sales Force Effectiveness in Pharmaceuticals, Lundbeck and the KAM Principle, 2010...............24 Figure 15: Sales Force Effectiveness in Pharmaceuticals, Abbott’s Sales Force Optimization......................25 Figure 16: Sales Force Effectiveness in Pharmaceuticals, Abbott’s Account Strategy, 2010........................25 Figure 17: Sales Force Effectiveness in Pharmaceuticals, Abbott’s Segmentation and Targeting Strategy,
2010.......................................................................................................................................26 Figure 18: Sales Force Effectiveness in Pharmaceuticals, Calculating Account Value, 2010 ........................27 Figure 19: Sales Force Effectiveness in Pharmaceuticals, Positioning the Key Accounts .............................28 Figure 20: Sales Force Effectiveness in Pharmaceuticals, CSOs, Major Services, 2010 ................................29 Figure 21: Sales Force Effectiveness in Pharmaceuticals, Modern CSO Applications, Deployment of Sales
Force Across Product Lifecycle, 2011 .......................................................................................32 Figure 22: Sales Force Effectiveness in Pharmaceuticals, CSOs and Evolving Sales Model ..........................34 Figure 23: Sales Force Effectiveness in Pharmaceuticals, CLM-enabled Commercial Organization..............37 Figure 24: Sales Force Effectiveness in Pharmaceuticals, Wyeth’s Target Selection Model, 2010 ...............39 Figure 25: Sales Force Effectiveness in Pharmaceuticals, Wyeth’s Segmentation Model, 2010...................40 Figure 26: Sales Force Effectiveness in Pharmaceuticals, Benefits of CLM for Wyeth, 2010........................40 Figure 27: Sales Force Effectiveness in Pharmaceuticals, Customer Response Framework for CLM, Wyeth,
2010.......................................................................................................................................41 Figure 28: Sales Force Effectiveness in Pharmaceuticals, Customer Response Success Rate for CLM, Wyeth,
2010.......................................................................................................................................41 Figure 29: Sales Force Effectiveness in Pharmaceuticals, Wyeth and its CLM Process, 2010.......................42 Figure 30: Sales Force Effectiveness in Pharmaceuticals, Predictive Modeling Data Integration.................44 Figure 31: Sales Force Effectiveness in Pharmaceuticals, Predictive Modeling...........................................44 Figure 32: Sales Force Effectiveness in Pharmaceuticals, Predictive Modeling Process ..............................45 Figure 33: Sales Force Effectiveness in Pharmaceuticals, Sales Index vs. Sales Strategy .............................46 Figure 34: Sales Force Effectiveness in Pharmaceuticals, Promotional Response Model on Sales...............47 Figure 35: Sales Force Effectiveness in Pharmaceuticals, Workload Build-up Model Case Study, 2011 .......50 Figure 36: Competitive Benchmarking Model Case Study, 2011................................................................51 Figure 37: Promotion Response Model, 2011...........................................................................................52 Figure 38: Optimal Promotion Response Model, 2011..............................................................................53 Figure 39: Advantages of RPO, 2011 ........................................................................................................55

GBIHC208MR / Published JUL 2012
Page 8 © GBI Research. This is a licensed product and is not to be photocopied
Table of Contents
Figure 40: Sales Force Effectiveness in Pharmaceuticals, Sales Force Strategy, Incentive Compensation Functionality, Global, 2010......................................................................................................63
Figure 41: Sales Force Effectiveness in Pharmaceuticals, Sales Force Strategy, Oracle Incentive Compensation Solution, 2010..................................................................................................64
Figure 42: Sales Force Effectiveness in Pharmaceuticals, Efficiency Analysis, 2011 ....................................65 Figure 43: Sales Force Effectiveness in Pharmaceuticals, Efficiency Analysis, 2010 ....................................66 Figure 44: Sales Force Effectiveness in Pharmaceuticals, Efficiency Analysis, 2009 ....................................66 Figure 45: Teva Pharmaceutical Industries, Global, SG&A Expenses (%), 2011...........................................68 Figure 46: Teva Pharmaceutical Industries, Global, SG&A Expenses by Year ($m) and Growth Rate (%),
2009-2011 ..............................................................................................................................69 Figure 47: Bristol-Myers Squibb, Global, SG&A Expenses (%), 2011 ..........................................................70 Figure 48: Bristol-Myers Squibb, Global, SG&A Expenses by Year ($m) and Growth Rate (%), 2009-2011...71 Figure 49: Sanofi, Global, SG&A Expenses (%), 2011.................................................................................72 Figure 50: Sanofi, Global, SG&A Expenses by Year ($m) and Growth Rate (%), 2009-2011 .........................73 Figure 51: Novartis, Global,, SG&A Expenses (%), 2011.............................................................................74 Figure 52: Novartis, Global, SG&A Expenses by Year ($m) and Growth Rate (%), 2009-2011......................75 Figure 53: Merck, Global, SG&A Expenses (%), 2011.................................................................................76 Figure 54: Merck, Global, SG&A Expenses by Year ($m) and Growth Rate (%), 2009-2011.........................77 Figure 55: Pfizer, Global, SG&A Expenses (%), 2011..................................................................................78 Figure 56: Pfizer, Global, SG&A Expenses by Year ($m) and Growth Rate (%), 2009-2011..........................79 Figure 57: Takeda Pharmaceutical Company, Global, SG&A Expenses (%), 2011........................................80 Figure 58: Takeda Pharmaceutical Company, Global, SG&A Expenses by Year ($m) and Growth Rate (%),
2009-2011 ..............................................................................................................................81 Figure 59: GlaxoSmithKline, Global, SG&A Expenses (%), 2011 .................................................................82 Figure 60: GlaxoSmithKline, Global, SG&A Expenses by Year ($m) and Growth Rate (%), 2009-2011..........83 Figure 61: Johnson & Johnson, Global, SG&A Expenses (%), 2011.............................................................84 Figure 62: Johnson & Johnson, Global, SG&A Expenses by Year ($m) and Growth Rate (%), 2009-2011 .....85 Figure 63: Eli Lilly, Global, SG&A Expenses (%), 2011................................................................................86 Figure 64: Eli Lilly, Global, SG&A Expenses by Year ($m) and Growth Rate (%), 2009-2011 ........................87 Figure 65: Abbott, Global, SG&A Expenses (%), 2011................................................................................88 Figure 66: Abbott, Global, SG&A Expenses by Year ($m) and Growth Rate (%), 2009-2011........................89 Figure 67: AstraZeneca, Global, SG&A Expenses (%), 2011 .......................................................................91 Figure 68: AstraZeneca, Global, SG&A Expenses by Year ($m) and Growth Rate (%), 2009-2011................92

GBIHC208MR / Published JUL 2012
Page 9 © GBI Research. This is a licensed product and is not to be photocopied
Introduction
2 Introduction
A sales force is a company’s most expensive promotional source. Sales force effectiveness begins by developing an effective sales strategy, sizing and structuring the sales force, designing incentive compensation plans, establishing goals, managing sales performance, recruiting sales people, motivating the sales force, building an effective sales force culture and coordinating sales and marketing.
Pharmaceutical companies need the most effective sales force to generate sales. The sales force should also know how to integrate strategic business objectives with selection program strategies. As the current pharmaceutical market environment is dynamic, the role of the sales force is changing. Sales representatives in leading pharmaceutical companies are now responsible for delivering the company’s marketing message and offering physician information and educational opportunities This helps in enhancing relationship between sales representatives and physicians thus helping change their beliefs and behavior. In addition to this, physicians require more detailed, comparative and customized information from pharmaceutical sales representatives. As a result, a new sales representative should have the correct set of skills to fulfill these roles. Pharmaceutical companies should also employ an effective recruitment strategy in order to have the best sales force.
Sales force training is the most important factor for success in order to generate higher sales revenues. Many companies have started realizing this, and have established various internal training processes for their sales forces. Large pharmaceutical companies have invested significant amounts on sales force training, implementing advanced techniques. Some pharmaceutical companies also employ external training consultants. The interim motive behind sales force training is to increase sales and improve productivity. However, the long term goal is to motivate the sales force, build customer relations and improve employee retention.
In recent years, there has been a paradigm shift in the pharmaceutical industry regarding effective selling methods, and this is reflected in the performance of sales forces. In the US and Europe, the pharmaceutical industry has recorded sales job cuts, and therefore the size of sales forces have reduced drastically. This reduction has encouraged pharmaceutical companies to realign the size, structure and sales strategies of their sales forces. As a result, pharmaceutical companies must now generate higher profits with lower sales resources. For this to be achieved, pharmaceutical companies are adopting various strategies to remain competitive in the market.

GBIHC208MR / Published JUL 2012
Page 14 © GBI Research. This is a licensed product and is not to be photocopied
Sales Force Effectiveness in Pharmaceuticals – Role of New Sales Models and Strategies
4 Sales Force Effectiveness in Pharmaceuticals - Role of New Sales Models and Strategies
4.1 Implementation of Strategies in Pharmaceutical Companies
4.1.1 Implemented Sales Force Effectiveness Strategies
As a result of the change from primary care to specialty care, many pharmaceutical companies have already implemented new sales and marketing strategies.
Figure 3: Sales Force Effectiveness in Pharmaceuticals, Global, Implemented Sales Strategies in Pharmaceutical Companies (%), 2011
Dropping PC promotion
KAM
Customized training
Resizing sales force
More detailing
Enterprise marketing
Closed loop marketing
Centralized team
Others
None
Source: GBI Research
Note: KAM - Key Account Management
PC - Primary Care
Dropping primary care promotion and KAM were the main strategies implemented by the pharmaceutical companies accounted for XX% and XX%, respectively in 2011..
GBIHC208MR / Published JUL 2012
Page 73 © GBI Research. This is a licensed product and is not to be photocopied
Sales Force Effectiveness in Pharmaceuticals – Competitive Landscape
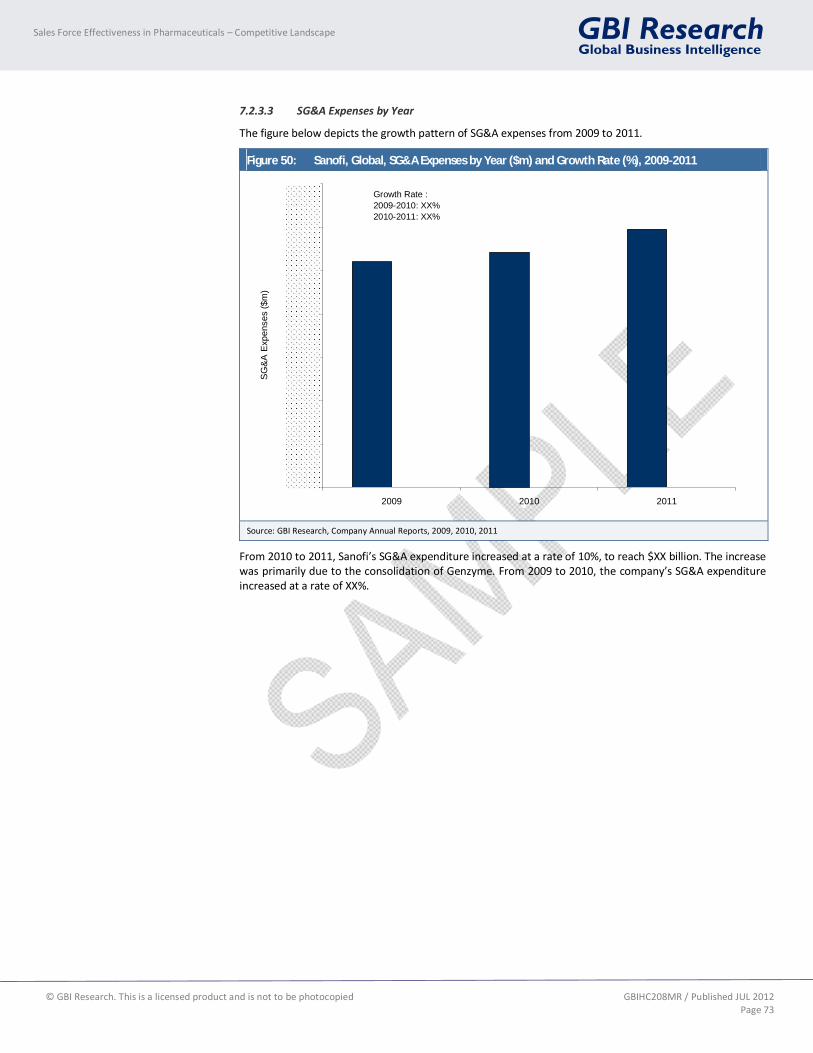
7.2.3.3 SG&A Expenses by Year
The figure below depicts the growth pattern of SG&A expenses from 2009 to 2011.
Figure 50: Sanofi, Global, SG&A Expenses by Year ($m) and Growth Rate (%), 2009-2011
2009 2010 2011
SG&A
Exp
ense
s ($
m)
Growth Rate : 2009-2010: XX%2010-2011: XX%
Source: GBI Research, Company Annual Reports, 2009, 2010, 2011
From 2010 to 2011, Sanofi’s SG&A expenditure increased at a rate of 10%, to reach $XX billion. The increase was primarily due to the consolidation of Genzyme. From 2009 to 2010, the company’s SG&A expenditure increased at a rate of XX%.

GBIHC208MR / Published JUL 2012
Page 93 © GBI Research. This is a licensed product and is not to be photocopied
Sales Force Effectiveness – Appendix
8 Sales Force Effectiveness - Appendix
8.1 Market Definitions
Sales force effectiveness - This involves developing an effective sales strategy, sizing and structuring the sales force, designing incentive compensation plans, setting goals, managing sales performance, recruiting sales people, motivating the sales force, building a potent sales force culture, and coordinating sales and marketing.
CSOs - These are organizations that provide sales force outsourcing solutions to pharmaceutical companies. Solutions include the provision of contract sales representatives, sales force recruitment, training and management, and other value added services.
e-detailing - This is the process of detailing physicians, which uses digital technology instead of traditional sales calls or face-to-face communication.
MSL - A person or a group that communicates between biopharmaceutical companies and clinical medicine professionals. They are scientists employed by pharmaceutical companies to provide medical information, discuss disease states, and provide therapeutic options and scientific exchange.
8.2 Abbreviations
BLA: Biologics License Application
CAGR: Compound Annual Growth Rate
CEO: Chief Executive Officers
CLM: Closed Loop Marketing
CRM: Customer Relationship Management
CSO: Contract Sales Organization
D&I: Development and Implementation
ERG: Establishing Employee Resource Groups
EU: European Union
FDA: The Food and Drug Administration
FTE: Full Time Employees
GSK: GlaxoSmithKline
HR: Human Resources
HSR: Hospital Specialist Representatives
KAM: Key Account Management
KOL: Key Opinion Leaders
KPI: Key Performance Indicators
LSD: Lysosomal Storage Disorders
M&A: Mergers and Acquisitions
MSL: Medical Science Liaison
NDA: New Drug Application
NHS: National Health Services
NME: New Molecular Entity
OAD: Oral Anti-Diabetic
OIC: Oracle Incentive Compensation
PCT: Primary Care Trust

GBIHC208MR / Published JUL 2012
Page 94 © GBI Research. This is a licensed product and is not to be photocopied
Sales Force Effectiveness – Appendix
QOF: Quality Outcome Frame Work
R&D: Research and Development
RFP: Request for Proposal
ROI: Return on Investment
Rx: Prescription
SFA: Sales Force Automation
SG&A: Sales, General and Administration
SOV: Share of Voice
8.3 Bibliography
The following sources were referred to in addition to company reports and websites:
Abbott Laboratories (2011), Annual Report. Available from http://media.corporate-ir.net/media_files/irol/94/94004/Proxy_Page/AR2011.pdf. [Accessed April 16, 2012]
AstraZeneca Plc (2011), Annual Report. Available from http://www.astrazeneca-annualreports.com/2011/documents/pdfs/annual_report_pdf_entire.pdf. [Accessed April 16, 2012]
Bristol-Myers Squibb (2011), Annual Report. Available from http://investor.bms.com/phoenix.zhtml?c=106664&p=irol-reportsAnnual. [Accessed April 9, 2012]
CDER (2011), CDER New Molecular Entity and New Biologic Entity Fillings and Approvals, Available from http://www.fda.gov/ucm/groups/fdagov-public/@fdagov-afda-orgs/documents/document/ucm302577.pdf. [Accessed March 13, 2012]
Eli Lilly and Company (2011), Annual Report. Available from http://files.shareholder.com/downloads/LLY/1918723280x0x548541/E8FFDA89-5EC1-4D08-AB37-CD85F4C0863D/English.PDF. [Accessed April 13, 2012]
GlaxoSmithKline plc (2011), Annual Report. Available from http://www.gsk.com/investors/reps11/GSK-Annual-Report-2011.pdf. [Accessed April 12, 2012]
Johnson & Johnson (2011), Annual Report. Available from http://files.shareholder.com/downloads/JNJ/1360831491x0x552947/211DF99C-D473-47DA-B3AF-8EE1A05361D6/2011-Annual-Report_Final.pdf. [Accessed April 13, 2012]
Merck & Co., Inc. (2011), Annual Report. Available from http://www.merck.com/investors/financials/form-10-k-2011.pdf. [Accessed April 11, 2012]
Novartis AG (2011), Annual Report. Available from http://www.novartis.com/downloads/investors/reports/novartis-annual-report-2011-en.pdf. [Accessed April 10, 2012]
Pfizer Inc. (2011), Annual Report. Available from http://www.pfizer.com/files/annualreport/2011/financial/financial2011.pdf. [Accessed April 11, 2012]
Pharmatimes (2010), Corporate profiles, Available from http://www.pharmatimes.com/corp_profiles/2010/pdfs/Lundbeck.pdf, [Accessed March 20, 2012]
Sanofi (2011), Annual Report. Available from http://annualreview2011.sanofi.com/flipbook/annual-review/index.htm?&lng=en. [Accessed April 10, 2012]
Takeda Pharmaceutical Company Limited (2011), Annual Report. Available from http://www.takeda.com/pdf/usr/default/ar2011e_42865_6.pdf. [Accessed April 12, 2012]
Teva Pharmaceutical Industries LTD (2011), Annual Report. Available from http://ir.tevapharm.com/phoenix.zhtml?c=73925&p=irol-reportsAnnual. [Accessed April 9, 2012]

GBIHC208MR / Published JUL 2012
Page 95 © GBI Research. This is a licensed product and is not to be photocopied
Sales Force Effectiveness – Appendix
8.4 Research Methodology
GBI Research’s dedicated research and analysis teams consist of experienced professionals with a pedigree in marketing, market research, consulting backgrounds in the medical devices industry and advanced statistical expertise.
GBI Research adheres to the codes of practice of the Market Research Society (www.mrs.org.uk) and the Strategic and Competitive Intelligence Professionals (www.scip.org).
All GBI Research databases are continuously updated and revised.
8.4.1 Coverage
The objective of updating GBI Research coverage is to ensure that it represents the most up to date vision of the industry possible.
Changes to the industry taxonomy are built on the basis of extensive research of company, association and competitor sources.
Company coverage is based on three key factors: market capitalization, revenues, and media attention/innovation/market potential.
GBI Research aims to cover all major news events and deals in the pharmaceutical industry, updated on a daily basis.
The coverage is further streamlined and strengthened with additional inputs from GBI Research’s expert panel (see below).
8.4.2 Secondary Research
Secondary research was carried out on internal and external sources to source qualitative and quantitative information in the report.
The secondary research sources that are referred in this report include, but are not limited to:
Company websites, annual reports, financial reports, investor presentations and SEC filings for the twelve companies covered in this report.
Industry trade journals, scientific journals and other technical literature.
Relevant patent and regulatory databases.
National government documents, statistical databases and market reports.
News articles, press releases and web-casts specific to the companies operating in the market.
8.4.3 Primary Research
GBI Research conducts hundreds of primary interviews a year with industry participants and commentators in order to validate its data and analysis. A typical research interview fulfills the following functions:
It provides first-hand information on the market trends, growth trends, the competitive landscape and future outlook.
Helps in validating and strengthening the secondary research findings.
Further develops the analysis team’s expertise and market understanding.
Primary research involves e-mail correspondence, telephone interviews and face-to-face interviews for each market, category, segment and sub-segment across geographies.
The participants who typically take part in such a process include, but are not limited to:
Industry participants: CEOs, VPs, marketing/product managers, market intelligence managers and national sales managers;
Hospital stores, laboratories, pharmacies, distributors and paramedics;
Outside experts: investment bankers, valuation experts, research analysts specializing in specific medical equipment markets; and

GBIHC208MR / Published JUL 2012
Page 96 © GBI Research. This is a licensed product and is not to be photocopied
Sales Force Effectiveness – Appendix
Key Opinion Leaders (KOLs): physicians and surgeons specializing in different therapeutic areas corresponding to different kinds of pharmaceutical drugs.
8.4.4 Expert Panel Validation
GBI Research uses a panel of experts to cross verify its databases and forecasts.
GBI Research’s expert panel comprises marketing managers, product specialists, international sales managers from medical device companies; academics from research universities, KOLs from hospitals, consultants from venture capital funds and distributors/suppliers of medical equipment and supplies.
Historic data and forecasts are relayed to GBI Research’s Expert Panel for feedback and adjusted in accordance with their feedback.
8.6 Disclaimer
All Rights Reserved.
No part of this publication may be reproduced, stored in a retrieval system or transmitted in any form by any means; electronic, mechanical, photocopying, recording or otherwise, without the prior permission of the publisher, GBI Research.