sales force effectiveness in pharmaceutical
TRANSCRIPT

Moch Kurniawan property all rights reserved.
Sales Force Effectiveness in Pharmaceutical
Moch Kurniawan

Moch Kurniawan property all rights reserved.
Globalization, consumerism and prosperity are the major trends that will impact healthcare in SEA
Globalization
ConsumerismProsperity
Globalization: • World is becoming smaller: cheap air- travel, connectivity, internet, medical tourism• Increased healthcare awareness because of multiple media
Consumerism: • Increased self medicating behaviour; ease of access (online)• Increased expression of consumer individuality through brand choices
Prosperity: • Increasing disposable income, financial independence leading to exploring more choices• Increased health awareness has led to consumers spending more on health prevention and OTC
2 3
1
Source: Frost & Sullivan
INFRASTRUCTURE

Moch Kurniawan property all rights reserved.
APAC among the fastest growing economies over the next 5 years
31.1
20.0
4.91.7 0.9 0.3
40.5
21.0
6.22.3 1.1
0.3
50.9
23.3
7.93.0
1.5
0.4
CAGR5.1%
CAGR1.5%
CAGR5.0%
CAGR5.7%
CAGR5.1%
CAGR2.5%
0
10
20
30
40
50
60
Singapore Brunei Malaysia Thailand Indonesia Vietnam
GD
P p
er c
ap
ita
(U
S$ t
ho
usa
nd
)
Southeast Asia
2006 2010 2016
CAGR3.3%
CAGR12.0%
CAGR5.5%
0
10
20
30
40
50
Hong Kong China India
GD
P p
er c
ap
ita
(U
S$ t
ho
usa
nd
)
Asia
2006 2010 2016
CAGR4.8%
CAGR0.7%
CAGR1.9%
CAGR-1.2%
CAGR1.7%
0
10
20
30
40
50
60
GD
P p
er c
ap
ita
(U
S$ t
ho
usa
nd
)
Developed Economies
2006 2010 2016
Source: Data in the above charts were based on GDP per capita data in the respective country’s national currency as sourced from the WEO online database. The data above was converted to US dollar based on the currency conversion rate for the respective years. Analysis by Frost & Sullivan
CAGR
2.9%

Moch Kurniawan property all rights reserved.
Diverse population structures with varying levels of purchasing power
1.3%
0.5%
1.2%
1.5%
2.7%
2.3%
0.5%1.6%
0.9%
-0.5%
1.0%
2.1%
-0.2%
2.6%
0.2%
3.9%
0.9%
-0.1%
-0.2%
0.7%
0.4%
0
200
400
600
800
1,000
1,200
1,400
Po
pu
lati
on
(m
illio
n)
2006 2010 2016
Asia Pacific Mature markets
CAGR (2006-2016F)
Sources: World Economic Outlook (WEO), World Bank and countries data. CAGR data is for 2006 to 2016
Increasing consumer power
•Rural population, low income, relies on government support. •Upwardly growing middle class, living in tier 2 cities, educated, can pay for some level of healthcare• High income category, first adopters of new technology, services, private HC

Moch Kurniawan property all rights reserved.
Patient Protection and Affordable Care Act (PPACA) Highlights
Source: Ernst & Young LLP

Moch Kurniawan property all rights reserved.
NEW GLOBAL CENTER IN ASIA-PAC
DOCTORS LESS CENTRAL IN HEALTH
GLOBAL SYSTEMS IN CRISIS
PAYERSFIRMLY
IN CONTROL
1 2 3 4
CUSTOMER
NEARUNIVERSAL IPAD ACCESS
HIRING THE
COMPETITION
FEAROF THE
CLOSING DOOR
5 6 7
TRENDS OVERVIEW
TALENT
STRATEGY
THE NEW REP-RELIANT BLOCKBUSTER
DISCONNECTED DIGITAL TOOL SET
DETAILING FOR THE
DOUBLE YES
WORKING WITH NEW PREFERENCES
8 9 10 11

Moch Kurniawan property all rights reserved.
Relevant Trends in Indonesia
• Middle class to rise from 19% of Asian population in 2009 to 30% by 2014
• Indonesia has a young population, where 44% are below 24 years old
Growing wealth of middle class to drive demand
Source: CLSA Mr & Mrs Asia Moving up the J-curves – Spring 2010

Moch Kurniawan property all rights reserved.
Toddler10%
Kids10%
Teens9%
Teens adult9%
Young adult8%
Early jobber
9%Young Parent
8%
Parenthood
8%
Mature18%
Ageing well11%
Age Group Population
Source: sp2010.bps.go.id
Indonesian population per 2010 national census grew at 1.1% YoY. The population pyramid has shown a shift to a bigger young to middle age group – which resulted to the increasing productive age group between 24 to 54 y.o. The split between Male:Female is almost equal, except a slightly higher in Female Ageing Well group
Population % based on total age group % based on Gender
Grouping Age Range # of Population Male Female ALL Male Female ALL
Toddler 0-4 22,678,702 10% 9% 10% 51% 49% 100%
Kids 5-9 23,253,480 10% 10% 10% 51% 49% 100%
Teens 10-14 22,671,081 10% 9% 10% 51% 49% 100%
Teens adult 15-19 20,880,734 9% 9% 9% 51% 49% 100%
Young adult 20-24 19,891,633 8% 8% 8% 50% 50% 100%
Early jobber 25-29 21,310,443 9% 9% 9% 50% 50% 100%
Young Parent 30-34 19,830,685 8% 8% 8% 50% 50% 100%
Parenthood 35-39 18,505,131 8% 8% 8% 50% 50% 100%
Mature 40-54 42,127,155 18% 18% 18% 50% 50% 100%
Ageing well 55+ 26,492,282 11% 12% 11% 48% 52% 100%
Total 237,641,326 100% 100% 100% 50% 50% 100%

Moch Kurniawan property all rights reserved.
Relevant Trends in Indonesia
Demographic
Indonesian population by Generation Group 2010-2016 (in ‘000)
40,988 41,118 41,247 41,377 41,498 41,595 41,673
103,127 103,233 103,317 103,369 103,353 103,271 103,311
49,305 50,294 51,251 52,192 53,103 53,997 54,893
40,058 41,686 43,360 45,076 46,862 48,708 50,461
-
50,000
100,000
150,000
200,000
250,000
300,000
2010 2011 2012 2013 2014 2015 2016
Gen Z (age 0 - 9) Gen Y (age 10 - 34) Gen X (age 35 - 49) Baby Boomers (age 50 - 75+)
2010 vs 2016 Growth
26.0%
11.3%
0.2%
1.7%
• From the chart above, baby boomers and retire (>54) population have the biggest growth until 2016 people’s life expectancy longer people’s health awareness higher
• Productive people (25 – 54) (gen X and partial gen Y) also growing around 11.3%
Source: Data Statistik Indonesia

Moch Kurniawan property all rights reserved.
Indonesia Socio Economic Class - Nielsen & BCG report
Nielsen, the leading global market data provider company, publishes yearly consumer segmentations, called Socio Economic Class (SEC) and the single measure/ criteria is heavily based on routine Monthly Household Expenditure (MHE). It’s widely used by consumer goods company or any marketer
which targeting consumer/ patient base. It shows the level of economic buying power, from the lowest E class (those who spends MHE below IDR 700K per month to the highest A class (> IDR 3mio per month). From the past 3 years consecutive data below, it tells us that Indonesian middle economic classes (AtoC1) are increasing at +6% average, correlates to the economic growth at +6% yoy. This is also aligned with the latest Boston Consulting
Group’s (BCG) report and World Bank’s report on Indonesian middle class
8% 8% 14%
18% 16%
25%
23% 23%
28%25% 27%
22%17% 14%
8%9% 12%3%
2010 2011 2012
Year
E IDR < 700.000
D IDR 700.001 -1.000.000
C2 IDR 1.000.001 -1.500.000
C1 IDR 1.500.001 -2.000.000
B IDR 2.000.001 -3.000.000
A IDR > 3.000.000
+6%
+9%
+5%
Nielsen’s SESBCG’s Report
World Bank’s Report –from the economist.com

Moch Kurniawan property all rights reserved.
Population in Indonesia, income demographics 2012 vs 2020
Source: Statistics Indonesia

Moch Kurniawan property all rights reserved.
Pharmaceutical and medical technology firms are not alone in the race

Moch Kurniawan property all rights reserved.
• Per capita healthcare expenditure is far below global average (lowest is Vietnam and Indonesia).
• Shortage of healthcare professionals in both countries.
• Efflux of medical tourists seeking treatment in other countries; 400,000 Indonesians patients travel annually.
Market Restraints
• Growing middle-class population in Indonesia;per capita income expected to grow from$2,580 in 2011 to $3,500 by 2015.
• Rise in non-communicable disease incidence,cardiovascular disease will account for 31percent of total number of deaths in Indonesiaby 2030, followed by other chronic diseases at28 percent.
• Vietnamese government intervention toenhance healthcare workforce by 2020.
Market Drivers
Total Indonesia Healthcare Market Size
Healthcare Industry: Revenue Forecast Indonesia 2011–2015
Source: Frost & Sullivan analysis.
0.0
2000.0
4000.0
6000.0
8000.0
10000.0
12000.0
2011 2012 2013 2014 2015
Indonesian Healthcare Market Size
Year
Indonesia 5549.30 6016.30 6515.90 7072.10 7742.50
$ (Billion)
CAGR8.7%

Moch Kurniawan property all rights reserved.
3,119
3,453
3,816
4,187
4,755
0
500
1,000
1,500
2,000
2,500
3,000
3,500
4,000
4,500
5,000
2009 2010 2011 2012 2013
Sale
s V
alu
e Tr
ade
OK
U Y
EN (
IDR
10
,58
3,3
33
,33
3/O
KU
YEN
)
Nutrition
OTC
ETHICAL
TOTAL MARKET42%
58% 61%
39%39%
61%
40%
+4%
+9%
+15%
+15% +11%
+13%
+11%
+11%
+14%
39%
61%
+15%
+11%
+12%
60%
Exchange rate: Constant IDR10,583,333,333/OKU YENSource: IMS Plus 2013-Q2
Indonesia Pharmaceutical Market – MAT 2013Q2• Indonesia is a big potential market for pharmaceutical industry, with total market size at OKU YEN 4,755 in MAT 2013Q2
• And the pharmaceutical market in Indonesia has grown rapidly at growth +12% in last year, driven by OTC sector growing +15% in 2013Q2 .
• In overall the pharmaceutical market growth is outperforming economic growth (6%). • The market growth is expected to continue at the same rate for 2012-2015.

Moch Kurniawan property all rights reserved.
Decrease new product launch in Indonesia
Source: IMS: ITMA-Ethical Only MAT 4Q10
0
50
100
150
200
250
1990 1991 1992 1993 1994 1995 1996 1997 1998 1999 2000 2001 2002 2003 2004 2005 2006 2007 2008 2009 2010
Number of Products Launch per Year
Foreign Ethical Foreign OTC Local Ethical Local OTC
Avg : 150
Avg : 63
Avg : 33
Avg : 9

Moch Kurniawan property all rights reserved.
Most companies have ambitious growth targets - combined with and increasing complexity in their business model
2013 – Commercial Excellence Forum

Moch Kurniawan property all rights reserved.
Indonesia—Healthcare System

Moch Kurniawan property all rights reserved.
Indonesia—Healthcare Indicators
Healthcare Indicators: Indonesia, 2007–2011
Key Features
• The population of the country as of 2010 stands at 238.0 million people. It is recorded as the fourth most
populous country in the world.
• The population of the country is expected to grow at a consolidated pace of 1.0 percent for the 2010‒2015
period.
• Life expectancy at birth has increased by 16 months per person from 2007 to 2011, and decreasing mortality
rates are a result of improving healthcare services.
Healthcare Indicators 2007 2008 2009 2010 2011
Population (Million) 226 229 232 238 245
Population Growth Rate (%) 1.3 1.3 1.3 1.07 1.04
Birth Rate (per 1,000) 19.65 19.24 18.84 18.10 17.76
Mortality Rate (per 1,000) 6.90 6.85 6.80 6.28 6.26
Life Expectancy (Female) (years) 72.7 73.1 73.4 74.0 74.3
Life Expectancy (Male) (years) 67.6 68.0 68.3 68.8 69.1
Source: IMF, CIA World Fact Book, Indonesian Department of Health, Frost & Sullivan analysis.

Moch Kurniawan property all rights reserved.
Disease Information – Major Causes of Death
Cardiovascular
31.0%
Cummunic
able13.0%Other
Chronic28.0%
Cancer
18.0%
Others10.0%
Major Causes of Death, 2030
Cardiovascular
30.0%
Cummunic
able25.0%
Other
Chronic21.0%
Cancer
13.0%
Others
11.0%
Major Causes of Death, 2010
Source: Indonesian Association of Medical Doctors (Ikatan Dokter Indonesia, or IDI)

Moch Kurniawan property all rights reserved.
Three dimensions of coverage
Increasing coverage of 41.7% (2005) to 63.2% (2012)
Comprehensive benefit package (2012)
No cost sharing (Jamkesmas)
Ahmad Fuady Health Economics, Policy and Law Erasmus University Rotterdam The Netherlands 2013

Moch Kurniawan property all rights reserved.
Three dimensions of coverage
• Less coverage, compared to neighboring countries
• A low coverage to formal workers group
3%
Ahmad Fuady Health Economics, Policy and Law Erasmus University Rotterdam The Netherlands 2013

Moch Kurniawan property all rights reserved.
Indonesia Social Security and Healthcare Programs Up Date
Member
• 142.711.701 (24/4/15)
Healthy Facilities
• Central of Healthy People 9798
• Army Clinic 750
• Police Clinic 570
• Basic Clinic 2712
• Hospital D Class 1675
• Primary Clinic 79
• Pharmacy 1679
• Optic 870
Doctor
• Dentist 1050
• Private Practice 4222

Moch Kurniawan property all rights reserved.
Indonesia—Health Care Delivery System
Healthcare System
Public Private
MOH Hospital
Provincial Hospital
District Hospital
Puskesmas Pustus and
Mobile Clinics
Specialty Private
Hospital
General Private
Hospital
Private Clinics
Source: Ministry of Health and Frost & Sullivan analysis

Moch Kurniawan property all rights reserved.
Indonesia—Hospital Categorization
Hospitals (General and Specialty)
Public Hospital
Private Hospital
Class A (>400 beds) = 10
Class B (100-400 beds) = 120
Class C (50-100 beds) = 250
Class D (<50 beds) = 126
Extensive specialist medical services + extensive sub specialists
Extensive specialist medical services + limited sub specialists
Has minimum of four basic specialist medical
services
Provides basic medical facilities
Priority
General medical services + specialists and sub-specialists
Madya
Pratama
Minimum four specialists medical services
General medical service
Source: Indonesian Department of Health, Frost & Sullivan analysis

Moch Kurniawan property all rights reserved.
Indonesia—Hospital Classification
Public (Ministry of
Health)
36%
Public (Military)
8%
Public (State or other govt dept-owned)
5%
Private51%
Percent of Hospitals by Type and Sector, Indonesia, 2010
Mental 15.3% Leprosy
6.6%Pulmonary
TB3.0%
Eye3.9%
Maternity 19.5%
Pediatric32.1%
Others19.5%
Percent of Specialist Hospitals Split by Specialty, Indonesia, 2010
Source: Indonesian Department of Health, Frost & Sullivan analysis
Hospital Classification by Type Hospital Classification by Specialty

Moch Kurniawan property all rights reserved.
Number of Hospitals: Regional Spread
Source: Ministry of Health, Indonesia
BaliNo. of hospitals:
34
Sumatra SelatanNo. of hospitals:
34
DKI JakartaNo. of hospitals:
124
Sumatra UtaraNo. of hospitals:
130
Sumatra BaratNo. of hospitals:
41
Sulawesi SelatanNo. of hospitals:
62
Jawa BaratNo. of hospitals:
144
Jawa TengahNo. of hospitals:
162
AcehNo. of hospitals:
35
Jawa TimurNo. of hospitals:
171
Hospitals are concentrated in major cities in the Sumatra and Java province, such as Jakarta, Surabaya, Medan.

Moch Kurniawan property all rights reserved.
Why look at hospital channel today
Know thy customer: Winning in the hospital channel, Copyright © April 2015 McKinsey & Company

Moch Kurniawan property all rights reserved.
three key actions a company must take to drive growth in this channel today
Develop a deeper understanding of the
changing hospital customer segments,
including their unique needs and willingness to
engage with pharmaceutical companies
Expand team/account-based sales model and
build new capabilities and supporting processes and tools to better meet the needs of select hospital
customers
Broaden and tailor your value propositions to
address hospitals’ evolving cost, quality/outcomes and patient satisfaction
priorities
Know thy customer: Winning in the hospital channel, Copyright © April 2015 McKinsey & Company

Moch Kurniawan property all rights reserved.
Pharmaceutical companies focus
Source: PricewaterhouseCoopers, Pharma Vision 2020

Moch Kurniawan property all rights reserved.
Availability
Availability of trained health care professionals and their salaries.
• Problem of data validity and reliability• Lack of health care professionals• Problem of deployment policy and unclear
decentralization policy• Without domestically competitive salary
Ahmad Fuady Health Economics, Policy and Law Erasmus University Rotterdam The Netherlands 2013

Moch Kurniawan property all rights reserved.
National Health Strategic Plan: Infrastructure Targets
• Aim to increase the number of community health centers from 9,133 in 2010 to 10,856 in 2014
• Develop hospitals to achieve a ratio of 1 bed per 1,000 population in 2014
• Indonesia also aims to achieve sufficient numbers of medical professionals:
Source: Indonesia Human Resource for Health; Development Plan, 2010 Regional Health Forum, 2006

Moch Kurniawan property all rights reserved.
Key mega trends impacting Indonesia
Low Probability of Success
De
gree
of
Imp
act
Low
Hig
h
High
Urbanization
Generation Y
Increase in Working Age Population
“She-conomy”
The Middle Bulge
Wealth Watchers
Future Economic Growth
Space Jam
Connectivity
Innovating to Zero
E-Mobility
Future Infrastructure
Top Industries of the Future
“Value for Many” Business Model
Health, Wellness and Well Being
Future Energy Power Generation
Private public partnerships
E-Governance
“Click-n-Connect”Mobile users
Moch Kurniawan property all rights reserved.
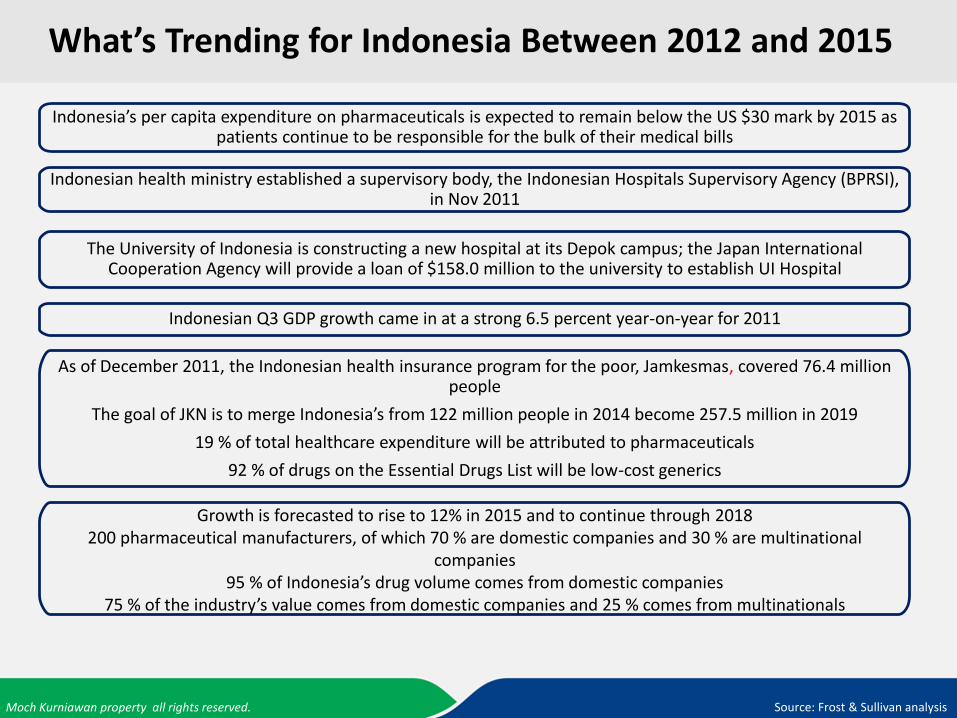
What’s Trending for Indonesia Between 2012 and 2015
Indonesia’s per capita expenditure on pharmaceuticals is expected to remain below the US $30 mark by 2015 as patients continue to be responsible for the bulk of their medical bills
Indonesian health ministry established a supervisory body, the Indonesian Hospitals Supervisory Agency (BPRSI), in Nov 2011
The University of Indonesia is constructing a new hospital at its Depok campus; the Japan International Cooperation Agency will provide a loan of $158.0 million to the university to establish UI Hospital
Indonesian Q3 GDP growth came in at a strong 6.5 percent year-on-year for 2011
As of December 2011, the Indonesian health insurance program for the poor, Jamkesmas, covered 76.4 million people
The goal of JKN is to merge Indonesia’s from 122 million people in 2014 become 257.5 million in 2019
19 % of total healthcare expenditure will be attributed to pharmaceuticals
92 % of drugs on the Essential Drugs List will be low-cost generics
Growth is forecasted to rise to 12% in 2015 and to continue through 2018200 pharmaceutical manufacturers, of which 70 % are domestic companies and 30 % are multinational
companies95 % of Indonesia’s drug volume comes from domestic companies
75 % of the industry’s value comes from domestic companies and 25 % comes from multinationals
Source: Frost & Sullivan analysis

Moch Kurniawan property all rights reserved.
Examples of investments into Indonesia
Philips supplied most of $140m in medical equipment for the first dedicated cancer research centre and the biggest hospital in Indonesia. Philips, which has group sales of $32bn and 120,000 employees, has set up a regional headquarters in Singapore with almost 300 staff with a view to increasing its share of the medical and home healthcare products in Indonesia, the Philippines and Vietnam.
Singapore-based Invida Group, a specialty biopharmaceutical company announced a joint venture with the local Indonesian drug manufacturer PT MUGI Laboratories. Under the terms of the agreement, Invida will seek to expand its operations in Indonesia to include the importation of raw materials and auxiliaries and the manufacture of pharmaceutical products.
A state pharmaceutical company PT Bio Farma announced that it is to spend USD 60 million on a facility to produce blood plasma products, including albumin and Factor IX. The plant will be the first of its kind in Indonesia and will be built using assistance from South Korean and Australian pharmaceutical companies, based on guidelines stipulated by the WHO.
Sources: Company websites, Frost & Sullivan
Siemens in Indonesia has provided support to public and private hospitals by installing computed tomography, magnetic resonance imaging systems, and angiographic systems, as well as conventional x-ray units and life support systems. Siemens supplied the first 128-slice computed tomography (CT) Somatom Definition AS+ in Indonesia.

Moch Kurniawan property all rights reserved.
Pharma 3.0 From drugs to healthy outcomes
Ernst & Young – Global Life Sciences Center, Pharma 3.0 Life Sciences Network Basel, 20 May 2010

Moch Kurniawan property all rights reserved.
We need to look at the situation from different perspectives…

Moch Kurniawan property all rights reserved.
…but at the same time make sure that we have a common focus

Moch Kurniawan property all rights reserved.
Our sales teams are faced with
Less physician face-to-face
time
Older products
Fewer new ‘blockbuster’
brands
Increasing competition –both generic and branded
Managed care and
market access challenges
Less ‘new’ clinical data
being provided by
their companies
Customers’ increasing
use of digital media to
source product
information
The 2014 Guide to Improving Your Field Force Coaching Process, www.acoach.net

Moch Kurniawan property all rights reserved.

Moch Kurniawan property all rights reserved.

Moch Kurniawan property all rights reserved.

Moch Kurniawan property all rights reserved.
The consumerization of business buying
More social
More real-time
More modular
Do you really understand how your business customers buy? Copyright © 2015 McKinsey & Company. All rights reserved

Moch Kurniawan property all rights reserved.
Three priorities for reshaping the sales organization
Charting decision journeys by customer segment and drilling down on customer
expectations and needs at each stage of the
journey
Tackling the difficult process of reallocating
sales and marketing resources to the
activities most likely to influence decisions
Changing organizational structures to ramp up collaboration between
marketing and sales
Do you really understand how your business customers buy? Copyright © 2015 McKinsey & Company. All rights reserved

Moch Kurniawan property all rights reserved.

Moch Kurniawan property all rights reserved.

Moch Kurniawan property all rights reserved.

Moch Kurniawan property all rights reserved.
Insight in customer needs makes it possible for us to identify the right actions and target the execution
2013 – Commercial Excellence Forum

Moch Kurniawan property all rights reserved.
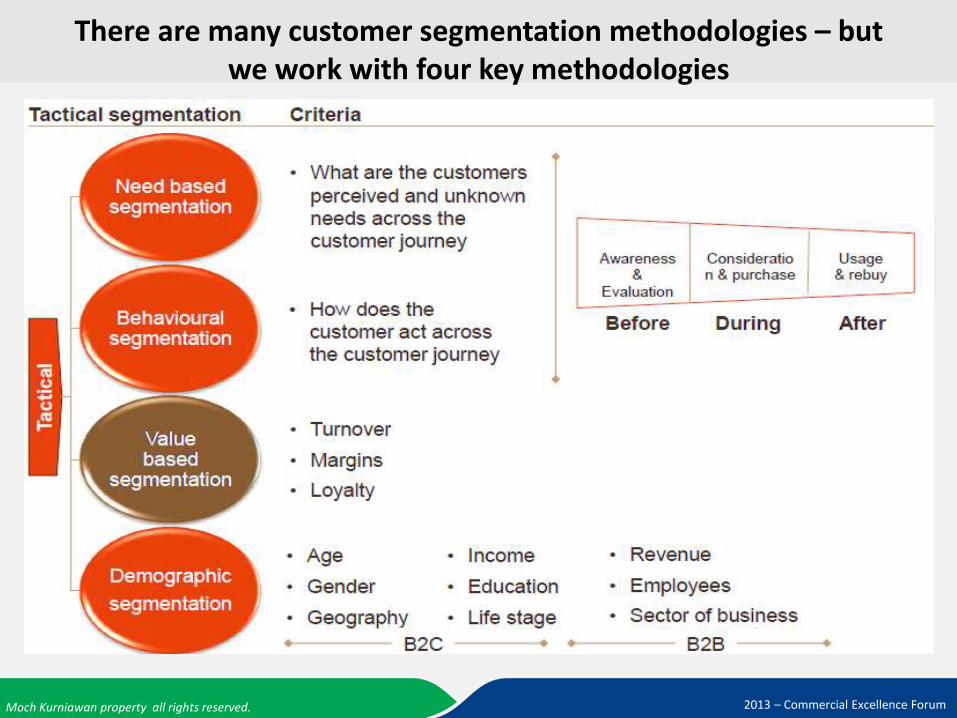
There are many customer segmentation methodologies – but we work with four key methodologies
2013 – Commercial Excellence Forum
Moch Kurniawan property all rights reserved.
There are many customer segmentation methodologies – but we work with four key methodologies
2013 – Commercial Excellence Forum

Moch Kurniawan property all rights reserved.
Customer insight is the driver for both customer segmentation and building your value proposition
2013 – Commercial Excellence Forum

Moch Kurniawan property all rights reserved.
Segmentation is needed to drive higher profitability through understanding customer needs and delivering on those needs
Meet Exceed
Relationship Development
Retain anddevelop
Manage
Customer Expectations
Cherish and tailor
Nu
mb
er o
f in
div
idu
als
Few
Many
Low HighValue per individual
Unprofitable Marginally profitable
More profitable
Very profitable
Segmentation is an important tool in becoming customer-centric. It is a key enabler of CRM.
“Recognise me, remember me, value me.”
Typically customers are not created equal ..and different “segments” need different customer strategies to exploit their value
20-30%
40-50%
20-30%

Moch Kurniawan property all rights reserved.
The operational segmentation help prioritization of time and resourcesand understand what to offer to who at what price/discount level
2013 – Commercial Excellence Forum

Moch Kurniawan property all rights reserved.
Yesterday: Today & Tomorrow:
Targeting Mass customisation Differentiation
Focus Acquisition Retention
Approach How big is my list? Test and learn
Company KPIs Volume targets Value targets
Marketing KPIs Sales volumes Segment objectives (KPIs)
Propositions Sell to all Customer-needs driven
Using segmentation for a ‘Customer Driven Organization’

Moch Kurniawan property all rights reserved.
Criteria for ABC Classification
The accumulated revenue of the customer within a defined period of time. By default, the period of time begins with the beginning of the previous year and
ends at the current date.
The total revenue of all customers within the same period of time
Defined percentages of the total revenue, which are used as thresholds
for the classification. By default, the thresholds
are defined as 80%, 15%, and 5%.
The classification is based to the following criteria:
PUBLIC © 2014 SAP SE or an SAP affiliate company. All rights reserved

Moch Kurniawan property all rights reserved.

Moch Kurniawan property all rights reserved.

Moch Kurniawan property all rights reserved.

Moch Kurniawan property all rights reserved.
Customer Behavior In Indonesia – 9 Trends
Marketeers Dinner Seminar|Customer Insight Tools | Feb 27-29 2012

Moch Kurniawan property all rights reserved.
The foundation for organic growth, is a strong value differentiation which is perceived valuable by the customers
2013 – Commercial Excellence Forum

Moch Kurniawan property all rights reserved.
The value curve can be used to design the customer experience
Finding the Consumer value Curve

Moch Kurniawan property all rights reserved.

Moch Kurniawan property all rights reserved.

Moch Kurniawan property all rights reserved.

Moch Kurniawan property all rights reserved.

Moch Kurniawan property all rights reserved.

Moch Kurniawan property all rights reserved.
The key metrics for measuring FFE effectively
understand demand
master product knowledge
communicate business benefits
use account plans
use differentiated metrics
www.mentorgroup.co.uk

Moch Kurniawan property all rights reserved.
Business Challenges: The Selling Environment
Competition is intense
Customers are more sophisticated, knowledgeable and demanding
Acquiring new customers and opening new channels were reported as increasingly important to growth strategies
Profitability has replaced revenue growth as a critical focus of sales organizations
Commoditization/shrinking markets was a theme in most industries
The roles of sales representative and sales manager are described as more complex and demanding
How Sales Forces Sustain Competitive Advantage Research Report© 2008 IIR Holdings, Ltd

Moch Kurniawan property all rights reserved.
3 sales skills correlated significantly with performance
Sales Skills
How Sales Forces Sustain Competitive Advantage Research Report© 2008 IIR Holdings, Ltd

Moch Kurniawan property all rights reserved.
The correlations of the three sales management skills with performance
Sales Management Skills
How Sales Forces Sustain Competitive Advantage Research Report© 2008 IIR Holdings, Ltd

Moch Kurniawan property all rights reserved.
Sales Effectiveness Landscape
How Sales Forces Sustain Competitive Advantage Research Report© 2008 IIR Holdings, Ltd

Moch Kurniawan property all rights reserved.
Sales Force Effectiveness Metrics

Moch Kurniawan property all rights reserved.
5 Steps to Pharmaceutical Sales Force Effectiveness
Performance Measurement & Management

Moch Kurniawan property all rights reserved.
Sales Performance Metrics – Current and Future State Example
Source: L.E.K. Consulting
Moch Kurniawan property all rights reserved.
Moch Kurniawan property all rights reserved.
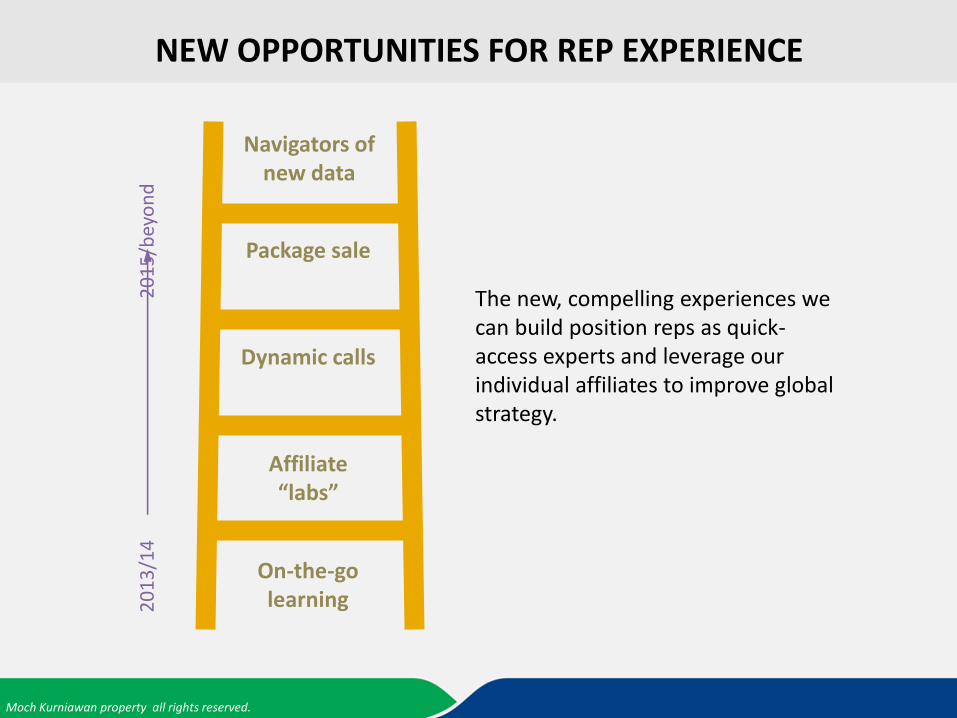
Package sale
Dynamic calls
Affiliate “labs”
20
13
/14
20
15
/bey
on
d
On-the-go learning
Navigators of new data
NEW OPPORTUNITIES FOR REP EXPERIENCE
The new, compelling experiences we can build position reps as quick-access experts and leverage our individual affiliates to improve global strategy.

Moch Kurniawan property all rights reserved.
All the
answers (in best-fit
media)
Influencer
call plans
and content
Flexible
contact
model
Reconnect
marketing
and sales
Feature-rich
engagement
s
REP EXPERIENCE 2015 BEST PRACTICES
Tools, experiences, and expectations designed to stand out in a crowded marketplace—or even just a crowded waiting room

Moch Kurniawan property all rights reserved.
Summary and Conclusions
It takes an organization, not just skilled individuals
How Sales Forces Sustain Competitive Advantage Research Report© 2008 IIR Holdings, Ltd

Moch Kurniawan property all rights reserved.
How loyal are your customers?

Moch Kurniawan property all rights reserved.

Moch Kurniawan property all rights reserved.

Moch Kurniawan property all rights reserved.

Moch Kurniawan property all rights reserved.
Roles & responsibilities
Know thy customer: Winning in the hospital channel, Copyright © April 2015 McKinsey & Company

Moch Kurniawan property all rights reserved.