gaussian beams stimulated brillouin scattering with ... · a simple estimate of the length of the...
TRANSCRIPT
Full Terms & Conditions of access and use can be found athttp://www.tandfonline.com/action/journalInformation?journalCode=tmop20
Journal of Modern Optics
ISSN: 0950-0340 (Print) 1362-3044 (Online) Journal homepage: http://www.tandfonline.com/loi/tmop20
Measurement of the power distribution duringstimulated brillouin scattering with focusedgaussian beams
Thomas R. Moore , George L. Fischer & Robert W. Boyd
To cite this article: Thomas R. Moore , George L. Fischer & Robert W. Boyd (1998) Measurementof the power distribution during stimulated brillouin scattering with focused gaussian beams, Journalof Modern Optics, 45:4, 735-745, DOI: 10.1080/09500349808230617
To link to this article: https://doi.org/10.1080/09500349808230617
Published online: 03 Jul 2009.
Submit your article to this journal
Article views: 46
Citing articles: 5 View citing articles

JOURNAL OF MODERN OPTICS, 1998, VOL. 45, NO. 4, 735-745
Measurement of the power distribution during stimulated Brillouin scattering with focused Gaussian beams
T H O M A S R. MOORE?, G E O R G E L. FISCHERS and ROBERT W. BOYD T h e Institute of Optics, University of Rochester, Rochester, New York, USA
(Received 28 May 1997)
Abstract. We show both theoretically and experimentally that, when stimulated Brillouin scattering (SBS) is produced using focused Gaussian beams, the spatial extent of the pump depletion region changes significantly with the input power. We also show that the location of the SBS interaction region depends on the ratio of the input power to the SBS threshold power. Only below and near SBS threshold is the interaction region largely located within several confocal parameters of the beam waist, as is often assumed in simplified treatments of the SBS process.
1. Introduction Stimulated Brillouin scattering (SBS) has been the subject of numerous
research efforts in the past, and there are several excellent reviews of the process [l-31. Understanding the SBS process when using focused Gaussian beams in bulk media is of particular interest, since this is the configuration often used when phase conjugation of high-power laser pulses is desired. Much work has been published concerning this particular SBS configuration; however, there are still many aspects of SBS with focused Gaussian beams that have yet to be thoroughly investigated. For example, one may surmise that it is of paramount importance to know how the laser power is distributed in the interaction region before a clear understanding of the SBS process and its limitations can be obtained; yet this is still the subject of investigation by many researchers.
Knowledge of the distribution of the laser power within the SBS interaction region is especially important if we are to understand how and why SBS sometimes fails to create the phase conjugate of the incident wave. Additionally, this knowledge can be used to help to understand the importance of such parameters as the length of the Brillouin medium relative to the Rayleigh range, as well as assisting in understanding how very high powers may be used in some Brillouin interactions without evidence of competing nonlinear processes. Here we report a theoretical and experimental investigation of the distribution of the power in the SBS interaction region, utilizing a computer model previously reported [4], and confirming some previously hypothesized but unproven aspects of SBS.
t Present address: Department of Physics, US Military Academy, West Point, New
1 Present address: Rome Laboratory - ERXO, Hanscom Air Force Base, Massachusetts York 10996, USA.
01731, USA.
0950-0340/98 $12.00 0 1998 Taylor & Francis Ltd.

736 T. R. Moore et al.
2. Background As important as a detailed knowledge of the distribution of the light in the
interaction region is to understand SBS and the associated phenomenon of phase conjugation: there has been surprisingly little published research on the subject of the distribution of the optical power in the interaction region. In fact, we can find only one published instance that addresses the issue of the distribution of the power during SBS in the focused geometry [5]. One of the reasons for this lacuna in the literature is the difficulty in simultaneously addressing the issues of complex geometry in three spatial dimensions and pump depletion. Another reason may be that many researchers in the field believe that they already know qualitatively where the power is during SBS using focused beams.
While there are a few published reports that indicate the importance of the regions far from the focus in the process of phase conjugation [S-81, a case can be made that, when using focused beams, the entire process of SBS is confined to a region that extends approximately three Rayleigh ranges on either side of the focus. This restriction of the interaction region to approximately three confocal parameters is thought to be strictly true close to SBS threshold, but even above threshold one may believe it to be an acceptable approximation.
A simple estimate of the length of the interaction region is based on a calculation of the on-axis Brillouin gain parameter for focused Gaussian beams. The undepleted pump solution for the Stokes wave in terms of the intensity is given by
where the Brillouin gain parameter is defined as
Here g is the Brillouin gain of the medium, Ip(z) is the intensity of the pump wave, and 10 is the intensity of the spontaneous scattering in the medium at the appropriate frequency.
For a Gaussian beam focused into a medium of infinite extent, the on-axis Brillouin gain parameter, integrated symmetrically about the focus, is given by
where ZR is the Rayleigh range. When the limits of integration are from --oo to 00
the value of the integral is simply X(2g/zR). When the limits of integration are only three Rayleigh ranges on either side of the focal point, the value of the integral is (0.8x)(2g/z~). Since fully 80% of the value of the undepleted gain occurs within three Rayleigh ranges of the focus, it is conventional to infer that the interaction region has an extent of approximately six Rayleigh ranges (or three confocal parameters). As long as the focal point of the system is well within the Brillouin medium, it is often assumed that this approximation is valid. Exceptions to this rule due to short coherence length and limited medium length have been investigated experimentally [9].
Although the analysis leading to the effective limitation of the extent of the interaction region is carried out within the undepleted pump approximation, the intensity of the pump beam is an order of magnitude smaller three Rayleigh ranges

Power distribution measurement during SBS 737
from the focus than at the focus. Therefore it is not unreasonable to assume that, while the longitudinal intensity profile within three confocal parameters of the focus may be complicated during the SBS process, regions outside a few confocal parameters play an insignificant role in the formation of the Stokes wave. T h e work in [9] appears to confirm this conjecture, and some researchers have even proposed that the interaction length of the SBS process is less than one Rayleigh range when the pump power is close to SBS threshold, and approximately three Rayleigh ranges in length far above threshold [lo].
In the rest of this article we shall report an investigation into the distribution of the power in a Brillouin medium both experimentally and theoretically. We shall show that, contrary to the simple heuristic arguments presented above, regions well outside the focal region play a significant role in the formation of the Stokes wave, even when the intensity is several orders of magnitude below that at the focus.
3. Simulations of stimulated Brillouin scattering using focused beams The physical geometry that we have used to investigate the SBS interaction
region is shown in figure 1. A zero-order Gaussian beam is focused into a bulk Brillouin medium of length L by a lens. The lens is in contact with the beginning of the Brillouin medium, and the focal point of the lens is inside the medium and defined as z = 0.
Assuming that the coherence length of the beam is significantly longer than the length of the Brillouin medium, there are three parameters that characterize the interation region during SBS using focused Gaussian beams. The first is the Rayleigh range, the second is the length of the medium, and the third is the position of the focal point inside the medium. In [4] we investigated the devel- opment of the Stokes wave when the incident beam is a focused Gaussian and have shown that the region more than a few Rayleigh ranges past the focus (zs - 3 2 ~ ) is of little importance in determining the amplitude of the Stokes wave. Therefore, provided that the Rayleigh range is significantly shorter than the length of the medium, one can usually characterize the Brillouin interaction region by the distance from the focus to the front of the medium and the Rayleigh range. T h e only other parameter necessary to characterize completely the Brillouin interaction is the incident power of the pump wave relative to SBS threshold, For the purposes of this article, we define the SBS threshold as the pump power necessary for the Stokes power, leaving the medium, to have 10% of the value of the incident beam power.
Brillouin medium
4- laserbeam - L lens with effective focal length of L/2
Figure 1. Physical geometry for modelling.
738 T , R. Moore et al.
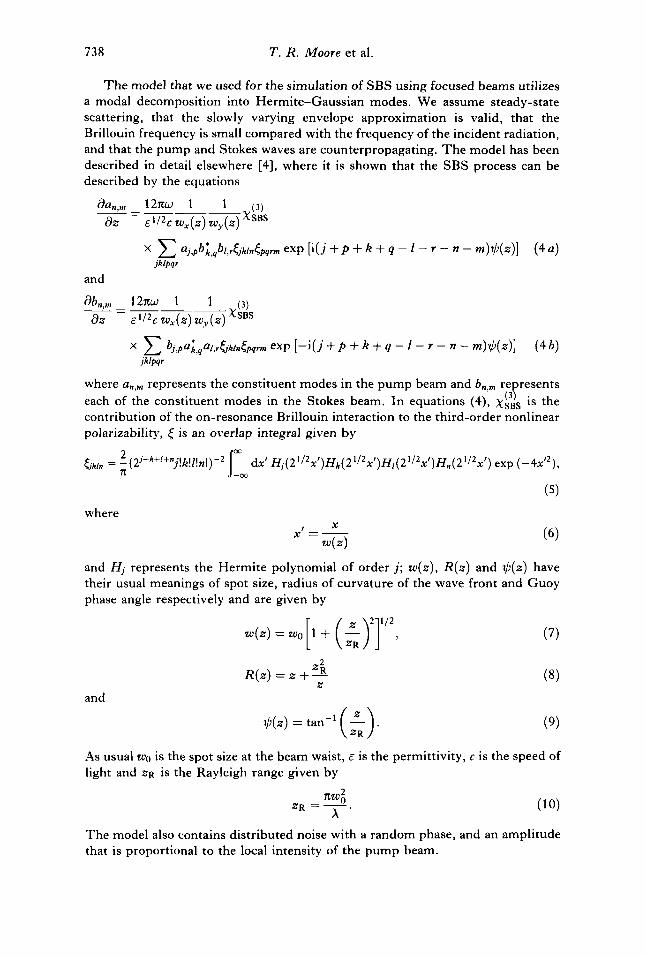
The model that we used for the simulation of SBS using focused beams utilizes a modal decomposition into HermiteGaussian modes. We assume steady-state scattering, that the slowly varying envelope approximation is valid, that the Brillouin frequency is small compared with the frequency of the incident radiation, and that the pump and Stokes waves are counterpropagating. The model has been described in detail elsewhere [4], where it is shown that the SBS process can be described by the equations
x b j , p a ; , q a / , , ~ j k l ~ ~ p ~ , m exP [ - i ( j + p + k + 4 - 1 - r - - m)$(z)] ( 4 b ) jklpqr
where an,m represents the constituent modes in the pump beam and b,!, represents
contribution of the on-resonance Brillouin interaction to the third-order nonlinear polarizability, [ is an overlap integral given by
each of the constituent modes in the Stokes beam. In equations (4), xsBs (3) is the
where
and Hj represents the Hermite polynomial of order j ; w ( z ) , R ( z ) and $(z) have their usual meanings of spot size, radius of curvature of the wave front and Guoy phase angle respectively and are given by
w ( z ) = wg [l + (IzK)l]l/*, R ( z ) = z + - 2;
z and
(7)
As usual wo is the spot size at the beam waist, E is the permittivity, c is the speed of light and ZR is the Rayleigh range given by
The model also contains distributed noise with a random phase, and an amplitude that is proportional to the local intensity of the pump beam.

Power distribution measurement during SBS 739
1 -
0.8
0.6
0.4
0.2
0 -
Equations (4) can be solved simultaneously for a small number of modes (less than ten) in a reasonable amount of time on a computer workstation. Provided that the pump beam approximates a zero-order Gaussian mode, spatial information in all three dimensions can be predicted by the model. In our laboratory, the pump beam is very well approximated by a zero-order Gaussian, and the Stokes beam is very close to a phase conjugate of the pump. Therefore, accurate predictions is the intensity profile of the Stokes and pump beams may be made in all three dimensions using only a limited number of modes in the basis set.
We have performed numerous simulations of the process of SBS with focused beams using this model and we find that, contrary to the naive argument presented in section 2, a significant portion of the Stokes wave is generated in the region far away from the focus. Furthermore, in situations similar to those often encountered in the laboratory, much of the energy is extracted from the pump beam in regions where the pump intensity is more than 100 times lower than at the focal region.
SBS geometries may conveniently be divided into two categories. The first situation, when the medium is several hundred Rayleigh ranges in length, we refer to as the long medium case. The second geometry of interest, the short medium case, is characterized by a Brillouin medium of a few tens of Rayleigh ranges in length.
Results of the simulation of SBS in a Brillouin medium that is considerably longer than the Rayleigh range is shown in figure 2. In figure 2 the normalized power in the Stokes wave is plotted as a function of distance in the medium for a variety of incident pulse powers. Note from figure 2 that, at ten times SBS threshold, half the power is transferred to the Stokes wave (and therefore is extracted from the pump wave) at points greater than 50 Rayleigh ranges from the focus. This means that, at only ten times above threshold, half the energy is extracted by SBS at positions where the undepleted pump intensities range from 2500 to 160 000 times lower than the intensity at the focus.
-
-
-
-
-200 -100 0 100 200 300 400
distance from focus (z/z,)
T h e power in the Stokes wave plotted as a function of position in the medium for four different pump powers: (a) at SBS threshold; ( b ) five times above threshold; ( c ) ten times above threshold; ( d ) 15 times above threshold. The power in each case is normalized to the total power in the Stokes beam exiting the medium.
Figure 2.

740
1 oo
T. R. Moore et al.
1 0 ' 2
-200 -100 0 100 200 300 400
distance from focus (z/z,)
The same as figure 2 plotted on a semilogarithmic scale. Note that in all cases the majority of the amplification occurs near the focus, even though figure 2 shows that the energy transfer occurs over a more extended region.
Figure 3.
While the extraction of the majority of the pump power is at points far from the intensity maximum, the majority of the amplification of the spontaneous noise still occurs near the focal region. This point can be seen from figure 3 , which is the same plot as shown in figure 2, but plotted on a semilogarithmic scale. At all values of pump power, almost all the amplification of the Stokes wave occurs in the region near the focus.
While it is not uncommon to find a long Brillouin medium, it is much more usual in the laboratory to find a short Brillouin medium. That is, the length of the Brillouin medium is of the order of tens of Rayleigh ranges rather than hundreds. When the length of the Brillouin medium is of the order of tens rather than hundreds of Rayleigh ranges, the length of the medium becomes a factor in the distribution of power within the medium. Thus for a short medium the form of the power distribution in the Stokes beam can change from a convex slope, as shown in figure 2, to a concave slope. This change in the nature of the curve arises because, once the portion of the Brillouin medium in contact with the front of the cell has become important, there is no more medium in the positive z direction to affect the process. T o maintain the Brillouin gain parameter at G M 25-30 it is necessary for the pump to be depleted in a shorter distance. The results of a simulation of this situation are presented in figure 4.
As a general rule, the power distribution in the Stokes beam in a short medium begins to resemble the power distribution in a long medium for values of the incident pump near or below SBS threshold. Likewise, the power distribution in a long medium begins to resemble the power distribution in a short medium for values of the incident pump greatly exceeding SBS threshold.
Once the power distribution in the Brillouin interaction region has been determined, it is important to examine the intensity distribution within the medium. This is important not only because SBS is an intensity-dependent process, but also because competing intensity-dependent nonlinear processes are often present during SBS of focused beams [l l-141. Figure 5 shows a plot of the

Power distribution measurement during SBS 741
s v)
Q Y
9
-15 -10 -5 0 5 10 15 distance from focus (z/z,)
T h e normalized power in the Stokes wave plotted as a function of position for a short medium for four different pump powers: ( a ) at SBS threshold; ( b ) five times above threshold; (c) ten times above threshold; ( d ) 1 5 times above threshold. T h e power in each case is normalized to the total power in the Stokes beam exiting the medium.
Figure 4.
10.’ -15 -10 -5 0 5 10 15
distance from focus (zk,)
On-axis intensity of the focused pump beam as a function of position in the Brillouin medium for four incident pump powers: (a) at threshold; ( b ) five times above threshold; (c) ten times above threshold; ( d ) 15 times above threshold.
Figure 5.
on-axis intensity of the pump beam as a function of position through the medium for the same situation in figure 4. Note that the maximum intensity of the pump beam always occurs at the focus. Furthermore note that increasing the input intensity from threshold to 15 times above threshold only slightly increases intensity at the focus (the actual increase is about 10%). While the process of SBS keeps most of the power away from the focal region, the maximum intensity is still at z = 0. Therefore the process of SBS does not create secondary intensity maxima away from the focus, while still shielding the focus from very high intensities that may lead to competing nonlinear effects, such as self-focusing or

742 T. R . Moore et al.
Brillouin medium -
breakdown of the material. Naturally, at some level of input power very high above threshold, the formation of an intensity maximum near the front of the medium on the order of that within the focal region is possible. However, we estimate this will occur at pump energies greater than 200 times SBS threshold for a medium 30 Rayleigh ranges in length.
The ability of the SBS process to reduce the intensity in the focal region, by reflecting a significant amount of light before it reaches the focus, has been proposed in the past by some experimentalists. This seemed the only logical explanation for the high-quality SBS phase conjugation that can be achieved with pump beams having power far in excess of the critical power for self-focusing [15- 181. Our modelling work has shown that this process is indeed predicted by theory. We now turn to the experimental verification of our model to confirm the predictions presented in this section.
I\ , 1.06 pm
50 ns /
J
4. Experimental investigation of the power distribution The apparatus used to determine experimentally the distribution of the power
in the interaction region during stimulated Brillouin scattering is shown schematically in figure 6. Single 50 ns pulses from a transform-limited single- transverse-mode, Nd-doped yttrium aluminium garnet laser were directed through a lens and into a rectangular glass cell. Inside the cell was a liquid Brillouin medium and a beam splitter positioned to reflect a portion of the Stokes radiation out the side of the cell. The beam splitter could traverse the length of the cell, had a thickness of about 100pm, and the reflectivity was less than 0.005 to ensure that the presence of the beam splitter inside the medium did not significantly perturb the SBS process. Outside the cell an energy detector was mounted on an optical rail parallel to the cell and positioned such that any Stokes light reflected from the beam splitter within the cell was detected by the device.
Simultaneous measurements were made of the incident energy and the energy reflected from the beam splitter inside the medium. These measurements were taken with the beam splitter placed in several positions within the cell. Various incident energy levels and lens focal lengths were investigated as well as several
Brillouin medium - I\ , 1.06 pm
50 ns /
J
Stokes energy detector
pump energy detector
Figure 6. Experimental arrangement for measuring the energy in the Stokes beam as a function of the distance within the medium.

Power distribution measurement during SBS 743
Figui
I
0.8
0.6
0.4
0.2
0
0 9 x threshold
0 2 4 6 8 10 distance from focus (z/z,)
-e 7. Dependence of the energy in the Stokes beam as a function of position in the medium: (0), ( O ) , experiment; (-) computer simulations. The model is completely specified by the experiment and there are no free parameters.
different Brillouin media. Typical experimental results are shown in figure 7. T h e data shown in figure 7 are for a case in which the Brillouin medium used was acetone. Also plotted in figure 7 are the predictions of the model described in section 3 for the physical geometry of the experiment. Note the excellent agreement between the model and the data. The model is completely specified by the experiment and there are no free parameters.
5. Discussion It is clear from both theory and experiment that, when focused pump beams
are used, there is indeed a shielding of the focal region by the SBS process when the incident power exceeds SBS threshold. The elongation of the interaction region with increased power, from being confined near the focus to extending all the way to the front of the medium, ensures that the intensity at any point in the medium is effectively clamped. This confirms past speculation on the reasons behind the apparent ability to exceed by far the threshold for damage of some Brillouin media and agrees qualitatively with the simulations reported in [5].
Knowledge of the shielding effects of using focused beams during SBS also confirms previous speculation that the reasons beams with long rise times produce better phase conjugation than those with short rise times [19]. If the rise time of the pulse is slow compared with the characteristic response time of the SBS process, usually assumed to be of the order of the phonon lifetime of the medium, the shielding of the focal region from very high intensities keeps competing nonlinear processes from occurring, provided that the threshold for those processes is above the SBS threshold. On the other hand, a pulse that has a rise time much faster than the phonon lifetime will produce very high intensities within the focal region until the SBS process becomes well established. Thus, if a competing nonlinear process has a response time of the order of or shorter than the
744 T. R. Moore et al.
phonon lifetime, these competing processes will occur before the SBS process begins to reduce the intensity in the focal region.
6. Conclusions We have shown that the distribution of the power within the interaction region
during SBS with a focused pump geometry changes with the pump power. For a pump beam with power far exceeding the SBS threshold, most of the power of the pump wave is transferred to the Stokes wave significantly away from the focal region of the lens. From the results of experiments and simulations we conclude that it is not valid to use the criteria of three confocal parameters to estimate the length of the SBS interaction region as is sometimes thought; the characteristic length of the pump depletion region when using focused Gaussian beams can extend all the way to the front of the medium. This extension of the interaction region towards the entrance to the medium can in some instances shield the focal region from excessively high intensities.
The shielding of parts of the medium from excessively high intensities by SBS has been postulated before. However, to our knowledge the extent of the effect has never before been confirmed by experiment. The mapping of the power and intensity distribution of the SBS interaction region reported here confirms the existence of the shielding effect. Our work also adds weight to previous speculation about the reasons for the superior phase-conjugating ability of SBS when the rise time of the pulses are longer than the phonon lifetime of the medium. From a practical standpoint, our work demonstrates that increasing the focal length of the lens in a focused geometry will in many instances reduce the effects of competing nonlinear effects that sometimes affect the SBS process.
Acknowledgments This work was supported by the National Science Foundation and the US
Army Research Office. One of us (George Fischer) acknowledges support from the US Air Force through the Palace Knight Program.
References [l] BOYD, R. W., 1992, Nonlinear Optics (California: Academic Press, San Diego). [2] ZEL’DOVICH, B. YA., PILIPETSKY, N. F., and SHKKUNOV, V. V., 1985, Principles of Phase
[3] HELLWARTH, R. W., 1983, Optical Phase Conjugation, edited by R. A. Fisher (New
[4] MOORE, T. R., and R. W. BOYD, 1996, J . Nonlinear O p t . Phys. Muter . , 5 , 387. [5] MENZEL, R., and EICHLER, H. J., 1993, Znt. J. nonlinear opt. Phys. , 2, 255. [6] OKLADNIKOV, N. V., BREKHOVSKIKH, G. L., SOKOLOVSKAYA, A. I., and GARMONOV, A. A.,
[7] SOKOLUVSKAIA, A. I., BREKHOVSKIKH, G. L., and KUDRIAVTSEVA, A. D., 1983, J. opt.
[8] GRATSIANOV, K. B., LYUBIMOV, V. V., PANKOV, V. G., and STEPANOV, A. I., 1988, O p t .
[9] MUNCH, J., WUERKER, R. F., and LEFEBVRE, M. J., 1989, Appl. Optics, 28, 3099.
Conjugation (New York: Springer).
York: Academic Press).
1981, Soviet tech. Phys. L e t t . , 7 , 159.
SOC. Am., 73, 554.
Spectrosc. (USSR), 64, 414.
[lo] RYSAKOV, V. M., Aitirrov, Yu. V., and KORTOKOV, V. I., 1979, Opt. Spectrosc. (USSR), 47, 41 2.

Power distribution measurement during SBS 745
[ l l ] L-r.rninrov, V. V., MAK, A. A., and YASI-IIN, V. E., 1987, Acad. Sci. USSR Bull., phys. Sci. , 51, 114.
[12] Mii,.ui, D., Vmcincw, C. L., and MOORE, T. R., 1989, Proceedings of the Conference on Lasers and Electro-Optics 1989 (Washington, DC: Optical Society of America), p. 26.
[13] Brii.orisov, V. N., Boi2’smv, L. A., ELKIN, N. N., KOVAL’SKII, N. G., NIZIEYKO, Yu. K., , M. I., 1987, Soviet. Phys. JETP, 65, 33. d YASHIN, V. E., 1989, Soviet J . quant. Electron., 17, 644.
[15] B.~sov, N. G.. 1988, Phase Conjugation of Laser Emission (Commack: Nova Science).
SHKI.OVSKII , E. I . , and YANOVSKII, V. P., 1983, Soviet J . quant. Electron., 13, 641. [17] LI:~NT’EV, V. M., NOVOSELOV, V. G., RUDNITSKII, Yu. P. , and CHERNYSHEVA, L. V.,
[16] ANI)[<EE\., N. F., PASMANIK, G. A,, PASHININ, P. P., SERGEEV, S. N.,SEROV, R. V.,
Soviet J . quant. Electron., 17, 220. V, V. N., GOLLIBEV, V. V., DMITRIEV, D. I . , ZHILIN, A. N., LYLIBI~IOV, V. V.,
M A K , A. A., RESHE‘I‘NIKOV, v. I . , SIRAZETDINOV, v. s., and STARIKOl‘, A. D., 1987, Soviet. J . quant. Electron., 17, 455.
[19] D i \ s ~ , C. B., NEUAIAN, W. A , , and HACKEL, L. A., 1992, Optics Lett . , 17, 1271.