game-theory based dynamic pricing strategies for demand ... · objective of the dynamic pricing...
TRANSCRIPT

lable at ScienceDirect
Energy 126 (2017) 132e143
Contents lists avai
Energy
journal homepage: www.elsevier .com/locate/energy
Game-Theory based dynamic pricing strategies for demand sidemanagement in smart grids
Dipti Srinivasan a, *, Sanjana Rajgarhia a, Bharat Menon Radhakrishnan a,Anurag Sharma a, H.P. Khincha b
a Department of Electrical and Computer Engineering, National University of Singapore 4, Engineering Drive 3, 117583, Singaporeb Department of Electrical Engineering, Indian Institute of Science, C V Raman Ave, Bengaluru, Karnataka, 560012, India
a r t i c l e i n f o
Article history:Received 5 May 2016Received in revised form29 November 2016Accepted 30 November 2016
Keywords:Demand-Side ManagementDynamic pricingGame theoryResidential smart grids
* Corresponding author.E-mail addresses: [email protected] (D. Srin
(A. Sharma).
http://dx.doi.org/10.1016/j.energy.2016.11.1420360-5442/© 2016 Elsevier Ltd. All rights reserved.
a b s t r a c t
With the increasing demand for electricity and the advent of smart grids, developed countries areestablishing demand side management (DSM) techniques to influence consumption patterns. The use ofdynamic pricing strategies has emerged as a powerful DSM tool to optimize the energy consumptionpattern of consumers and simultaneously improve the overall efficacy of the energy market. The mainobjective of the dynamic pricing strategy is to encourage consumers to participate in peak load reductionand obtain respective incentives in return. In this work, a game theory based dynamic pricing strategy isevaluated for Singapore electricity market, with focus on the residential and commercial sector. Theproposed pricing model is tested with five load and price datasets to spread across all possible scenariosincluding weekdays, weekends, public holidays and the highest/lowest demand in the year. Three pricingstrategies are evaluated and compared, namely, the half-hourly Real-Time Pricing (RTP), Time-of-Use(TOU) Pricing and Day-Night (DN) Pricing. The results demonstrate that RTP maximizes peak loadreduction for the residential sector and commercial sector by 10% and 5%, respectively. Moreover, theprofits are increased by 15.5% and 18.7%, respectively, while total load reduction is minimized to ensure arealistic scenario.
© 2016 Elsevier Ltd. All rights reserved.
1. Introduction
Electricity has grown to become an essential part of human life.A reliable and seamless supply is required to facilitate economicand industrial growth as well as to improve quality of life. Globalelectricity demand has been increasing exponentially and is ex-pected to double in value between 2002 and 2030 [1]. Electricity isa non-storable commodity; its wholesale price varies across timeperiods depending on demands [2]. In most cases however, theconsumer is charged a fixed price and the price fluctuations areborne by the utility company. Since consumers are unaffected bywholesale price changes, their demand shows drastic fluctuationswith low valleys at night and high peaks during the day. Thesefluctuations decrease supply reliability, system efficiency andreduce profits for utility companies. Moreover, many countries havealso chosen to restructure their power industry and introduce
ivasan), [email protected]
deregulation in their electricity markets. Hence, companies need toestablish Demand-Side Management (DSM) strategies to influenceuser consumption patterns and thereby achieve peak-load reduc-tion. The increasing penetration of renewables and market dereg-ulation has further bolstered the need for operational flexibility inthe grid and resulted in development of efficient DSM techniques[3e6]. It is noted that the availability of renewable generation willimpact the dynamic pricing strategy and thus, the DSM techniquesbased on its intermittency and cheaper generation cost.
Demand response techniques can control and modify userconsumption patterns through incentive based dynamic pricingtechniques. Demand response algorithms have been widely adop-ted in the literature as they result in significant electricity billsavings and avoid undesirable peaks in the daily load demand,thereby improving the efficiency of the system [7e14]. Today,several developed countries such as USA, Canada andmany parts ofEurope have successfully developed and implemented dynamicpricing strategies to perform DSM. A 2010 survey conducted by theFederal Energy Regulatory Commission of USA shows that demandresponse methods could lead to a 7.6% decrease in peak load

D. Srinivasan et al. / Energy 126 (2017) 132e143 133
demand and among various time based pricing techniques, TOUpricing is proved to be the most effective [15]. Project Intekellionconducted by the German Government shows that time-variabletariffs for households bring about a 6% energy saving [16].
The electricity demand in Singapore is growing at an annual rateof 5% approximately; 16% of the consumption comes from theresidential sector, 38% from the commercial and 46% from indus-trial sector [17]. Currently, 75% of its market is liberalized andmoving towards complete liberalization soon. The residentialsector is still considered non-contestable and has a flat pricing of256.5SGD/MWh throughout the year [18]. The peak period typicallyoccurs at mid-day especially during the afternoons (can beexplained by the tropical climate) and non-peak period is seenespecially at late night when the consumption is at its lowest. Withthe increasing standards of living, and the global city status thatSingapore now enjoys, it is essential that electricity supply iscontinuous and seamless. A dynamic pricing strategy is necessaryto manage electricity demand and supply patterns as it will helpmeet user demands, boost profits for generation companies andensure a reliable supply of electricity at all times of the day.
Dynamic pricing includes techniques such as Real-Time Pricing(RTP), Time-Of-Use pricing (TOU) and Critical-Peak Pricing (CPP).RTP refers to a strategy where prices change for every period of theday: utility companies forecast prices on a day-ahead or hour-ahead basis. TOU pricing divides the day into intervals andcharges fixed rates within each interval. These pricing strategieshave been studied using different approaches, and tested on aca-demic and practical systems across the world. Yang, Tang andNehorai proposed an interesting game-theoretic approach forimplementing TOU pricing in Ref. [19]. The study uses a multi-stageapproach and backward induction to develop a strategy thatmaximizes profits for both consumers as well as the utility com-pany. In Ref. [20], a RTP based demand response algorithm is pro-posed to determine the optimal power consumption pattern andpricing, and maximizing the comfort level of the consumers. Anequal-incremental cost rule is proposed as a rational solution todetermine the electricity pricing in Ref. [21]. It is noted that in-cremental cost rule refers to a pricing rule which determines theprofit maximization based on the incremental cost of powerrequired to satisfy any variation in load demand. The effectivenessof the method was tested with two types of simulated powermarkets. The price elasticity of the customers was not taken intoconsideration. A theoretical framework for RTP based on theswitched Markov chain model has been developed in Ref. [22].However most of the above mentioned algorithms and modelshave been tested using numerical simulations and have not beenevaluated using real and practical data sets.
Game Theory has been proven to be an essential tool incapturing the complex and strategic interactions among marketparticipants and for strategic analysis of situations involving mul-tiple independent players. In the previous studies, game theory hasbeen applied to various problems pertaining to electricity marketsand demand side management [23,24]. In this work, the main aimis to demonstrate the ability of the proposed game theory baseddynamic pricing strategy [19], to implement demand side man-agement, using the real and practical data sets of Singapore. Theproblem has been formulated based on the modified pricing modelto accommodate the Singapore load and market scenario. More-over, extensive case studies are implemented to evaluate dynamicpricing strategies for Singapore using half-hourly Real-Time Pricing(RTP), Time-of-Use (TOU) Pricing and Day-Night (DN) pricing forresidential, commercial and industrial sector (with special focus onthe residential and commercial sector). The pricing strategies aretested on practical load and price datasets from Singapore, and allpossible scenarios have been considered to accurately measure the
robustness of the proposed model. The use of practical data sets ofSingapore is essential in the case studies to make the test scenariosmore realistic. The results as demonstrated in the 5 case studies for5 different load and price data sets, including weekdays, weekends,public holidays and the highest/lowest demand in the year, validatethe use of proposed dynamic price strategy to encourage the resi-dential and commercial consumers in Singapore to opt for demandside management. It is noted that the data for load demand andmarket price are taken from Energy Market Company (EMC) ofSingapore [18], while the price elasticity of demand (PED) inSingapore is hypothesized from the USA data based on Ameren Il-linois studies [19,25e27]. The rest of the paper is organized asfollows: Section 2 introduces the proposed pricing model, Section 3discusses the data collected and methodologies used, Sections 4e6discuss the results obtained for the residential sector, commercialand industrial sectors respectively and the paper is concluded inSection 7.
2. The proposed pricing model
In this work, a game-theoretic based pricing model is developedto achieve an efficient demand response technique. A multi-stagegame approach is adopted to maximize benefits for both con-sumers and utility companies. The electricity demand, consump-tion patterns, and Price Elasticity Demand (PED) are observed tovary drastically for different sectors i.e. residential, commercial andindustrial sector. Hence, a single-sector approach has been adoptedin this work, where-in the sectors are optimized individually toensure that different strategies could be chosen for different sec-tors. The pricing model developed in this work defines RTP pricingas well as block pricing.
The utility company aims at maximizing profits while simulta-neously adhering to industry regulations and customers' demands.On the contrary, the customers aim at minimizing electricity billsand expect a reliable, uninterrupted power supply. The end result isexpected to be a matrix p consisting of electricity sales prices fordifferent sectors over N time intervals. These prices result inreduction of peak load leading to a flattened load curve l.
2.1. Variable and function definitions
2.1.1. Time period (N)The day is divided intoN time intervals to reflect different values
for each variable. The subscript k corresponds to a particular periodin the day and can take values from 1 to N.
2.1.2. Electricity cost (ck), price (pk) and price elasticity of demand(ek)
The marginal cost of electricity "ck" sis the cost paid by theelectricity company and varies depending on the time of day,electricity market and demand.
The unit sales price of electricity "pk" corresponds to the price theutility company will charge its customers and varies depending onthe time of the day. This price is fixed by the electricity companyand is obtained as a result of the mathematical simulations in thismodel.
The fixed price "nk" can be interpreted as the price the con-sumers are currently being charged for the electricity supplied andvaries according to the country/sector in picture. Both ck and nk areconsidered as input data for the pricing model developed.
The short-run price elasticity of demand (PED) "ek" is used torepresent responsiveness or sensitivity of the quantity demandedto the price change. It essentially provides the percentage change inquantity demanded for every 1% change in price. It helps to
D. Srinivasan et al. / Energy 126 (2017) 132e143134
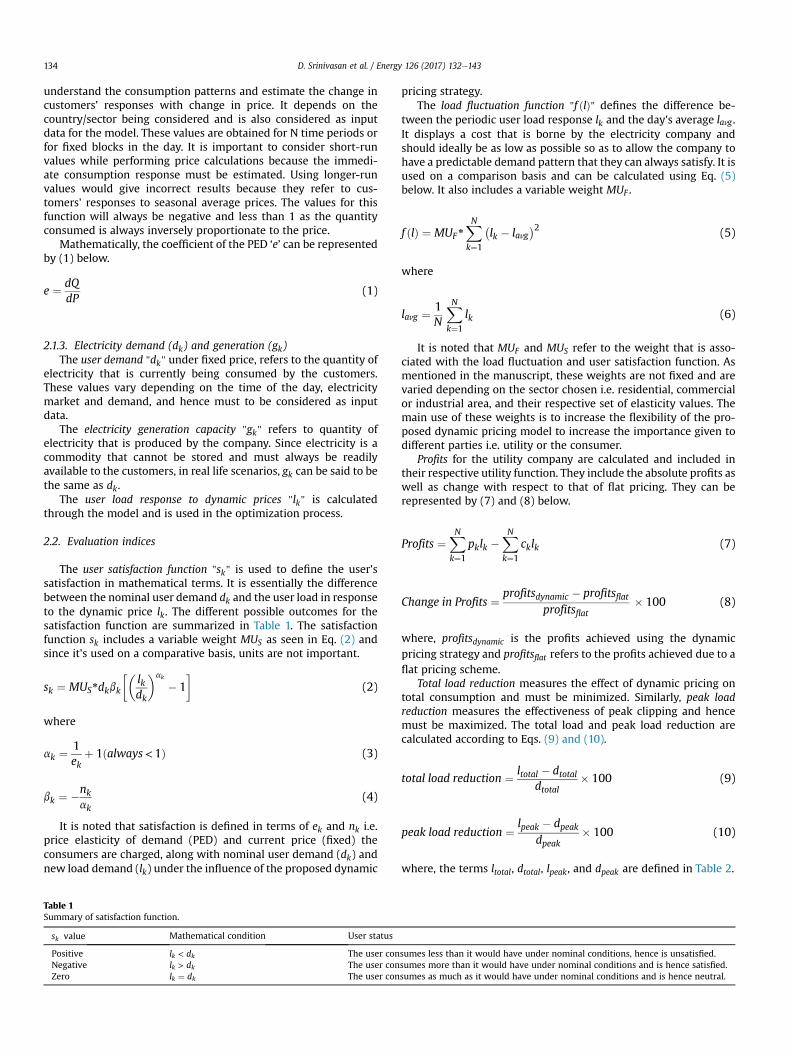
understand the consumption patterns and estimate the change incustomers' responses with change in price. It depends on thecountry/sector being considered and is also considered as inputdata for the model. These values are obtained for N time periods orfor fixed blocks in the day. It is important to consider short-runvalues while performing price calculations because the immedi-ate consumption response must be estimated. Using longer-runvalues would give incorrect results because they refer to cus-tomers' responses to seasonal average prices. The values for thisfunction will always be negative and less than 1 as the quantityconsumed is always inversely proportionate to the price.
Mathematically, the coefficient of the PED ‘e’ can be representedby (1) below.
e ¼ dQdP
(1)
2.1.3. Electricity demand (dk) and generation (gk)The user demand "dk" under fixed price, refers to the quantity of
electricity that is currently being consumed by the customers.These values vary depending on the time of the day, electricitymarket and demand, and hence must to be considered as inputdata.
The electricity generation capacity "gk" refers to quantity ofelectricity that is produced by the company. Since electricity is acommodity that cannot be stored and must always be readilyavailable to the customers, in real life scenarios, gk can be said to bethe same as dk.
The user load response to dynamic prices "lk" is calculatedthrough the model and is used in the optimization process.
2.2. Evaluation indices
The user satisfaction function "sk" is used to define the user'ssatisfaction in mathematical terms. It is essentially the differencebetween the nominal user demand dk and the user load in responseto the dynamic price lk. The different possible outcomes for thesatisfaction function are summarized in Table 1. The satisfactionfunction sk includes a variable weight MUS as seen in Eq. (2) andsince it's used on a comparative basis, units are not important.
sk ¼ MUS*dkbk
��lkdk
�ak
� 1�
(2)
where
ak ¼1ek
þ 1ðalways<1Þ (3)
bk ¼ �nkak
(4)
It is noted that satisfaction is defined in terms of ek and nk i.e.price elasticity of demand (PED) and current price (fixed) theconsumers are charged, along with nominal user demand (dk) andnew load demand (lk) under the influence of the proposed dynamic
Table 1Summary of satisfaction function.
sk value Mathematical condition User status
Positive lk < dk The user conNegative lk > dk The user conZero lk ¼ dk The user con
pricing strategy.The load fluctuation function "f ðlÞ" defines the difference be-
tween the periodic user load response lk and the day's average lavg .It displays a cost that is borne by the electricity company andshould ideally be as low as possible so as to allow the company tohave a predictable demand pattern that they can always satisfy. It isused on a comparison basis and can be calculated using Eq. (5)below. It also includes a variable weight MUF .
f ðlÞ ¼ MUF*XNk¼1
�lk � lavg
�2 (5)
where
lavg ¼ 1N
XNk¼1
lk (6)
It is noted that MUF and MUS refer to the weight that is asso-ciated with the load fluctuation and user satisfaction function. Asmentioned in the manuscript, these weights are not fixed and arevaried depending on the sector chosen i.e. residential, commercialor industrial area, and their respective set of elasticity values. Themain use of these weights is to increase the flexibility of the pro-posed dynamic pricing model to increase the importance given todifferent parties i.e. utility or the consumer.
Profits for the utility company are calculated and included intheir respective utility function. They include the absolute profits aswell as change with respect to that of flat pricing. They can berepresented by (7) and (8) below.
Profits ¼XNk¼1
pklk �XNk¼1
cklk (7)
Change in Profits ¼ profitsdynamic � profitsflatprofitsflat
� 100 (8)
where, profitsdynamic is the profits achieved using the dynamicpricing strategy and profitsflat refers to the profits achieved due to aflat pricing scheme.
Total load reduction measures the effect of dynamic pricing ontotal consumption and must be minimized. Similarly, peak loadreduction measures the effectiveness of peak clipping and hencemust be maximized. The total load and peak load reduction arecalculated according to Eqs. (9) and (10).
total load reduction ¼ ltotal � dtotaldtotal
� 100 (9)
peak load reduction ¼ lpeak � dpeakdpeak
� 100 (10)
where, the terms ltotal, dtotal, lpeak, and dpeak are defined in Table 2.
sumes less than it would have under nominal conditions, hence is unsatisfied.sumes more than it would have under nominal conditions and is hence satisfied.sumes as much as it would have under nominal conditions and is hence neutral.

Table 2Definition of load functions.
Terms Definition
ltotal It refers to the total load demand by the users in response tothe proposed dynamic pricing strategy
dtotal It refers to the total nominal load demand by the userslpeak It refers to the peak load demand by the users in response to
the proposed dynamic pricing strategydlpeak It refers to the peak nominal load demand by the users
D. Srinivasan et al. / Energy 126 (2017) 132e143 135
2.3. Utility functions and game theoretic approach
In this section, the utility functions considering the perspectiveof both the utility as well as the consumer is defined.
2.3.1. Utility function 1 (U1 for the company)The utility company wishes to maximize the profit, minimize
the deviation of load (hence the negative sign) as well as fulfill itsobligation to serve the public and satisfy the electricity users.Therefore the utility function of the company is its profit minus thesatisfaction cost of the users, i.e.
U1 ¼XNk¼1
pklk �XNk¼1
cklkeXNk¼1
sk � f ðlÞ (11)
2.3.2. Utility function 2 (U2 for the consumer)The consumers on the other hand are interested in maximizing
their satisfaction (negative sign before sk can be explained based onTable 1 i.e. negative sk means greater satisfaction) while simulta-neouslyminimizing their costs. Their utility function is the negativeof the company's cost function, and is denoted as U2 as representedbelow.
U2 ¼ �XNk¼1
pklk �XNk¼1
sk (12)
The goal is to maximize the utility function U1 and U2 undercertain constraints. The optimization problem is formulated as
�p*; l*
� ¼ argmax U1 (13)
l* ¼ argmax U2 (14)
Subject to; lk;min � lk � lk;max; k ¼ 1;2;…;Nck � pk; k ¼ 1;2;…;N
(15)
2.3.3. Game theory approachThe proposed game model adopts a multi-stage approach. The
utility company acts as the first mover by setting the price and theconsumer responds to it accordingly. The user response is consid-ered as a function p.
The proposed pricing strategy P is explained using Eqs. (16) and(17). The pricing model identifies the optimal price p*ε Р, andoptimal load response l*ε L in order to obtain a Nash equilibrium(p*, l*)ε Р x L , between the user and the utility company.
c p ε Р; psp* : u1ðp*; lÞ � u1ðp; l*Þ (16)
c l ε L ; lsl* : u2ðp; l*Þ � u2ðp*; lÞ (17)
Next, the principle of backward induction is implemented in thismodel to optimize the problem, and hence U2 is first maximized
with respect to flkgNk¼1 to identify the optimal load as l*k ¼�pkn
εk
dk.
The calculated optimal load is then plugged back into U1 which is
subsequently maximized w.r.t fpkgNk¼1 to obtain optimal dynamicprices.
In order to find a user's optimal demand response to the priceset by the utility company, we consider the electricity prices of
different time periods fpkgNk¼1 as given, and take the first and
second order derivatives of U2 with respect to flkgNk¼1,
vU2
vlk¼ �pk � akbk
�lkdk
�ak�1
(18)
Settingð17Þequal to zero; l*k ¼�� pkakbk
� 1ak�1
dk (19)
The second-order derivative of U2 is
v2U2
vlkvli¼
8>><>>:
�akbkðak � 1Þ lak�2k
dak�1k
when k ¼ i
0 when ksi
(20)
Since ak < 1 and akbk < 0, the diagonal elements of the Hessianmatrix are all negative, and the off-diagonal elements are all zero.
The Hessian matrix is negative definite, meaning that fl*kgNk¼1 is the
optimal user load given price p. Let
2k ¼ 1ak � 1
<0; k ¼ 1;2;…;N (21)
and nk ¼ akbk >0; k ¼ 1;2;…;N (22)
We can rewrite (19) as
l*k ¼�pknk
�2k
dk; k ¼ 1;2;…;N (23)
Optimal pricing based on l*kSubstituting (23) into the utility function U1 we determine its
value only in terms of p (earlier involved both p and l)
U1ðpÞ ¼XNk¼1
npk l
*kðpk Þ � ck l
*kðpk Þ � sk
hl*kðpk Þ; dk
io� f
l*ðpÞ�
(24)
The constraints on user loads can be rewritten as,
pk ¼�lkdk
� 12knk (25)
Since, (25) is a decreasing function of lk, the constraints onpricing can be written as
pk;min <pk <pk;max (26)
where, pk;min ¼ max
8><>:ck; ðlk;max=dkÞ
12k
9>=>; and pk;max ¼
8><>:ðlk;min=dkÞ
12knk
9>=>;. The optimization of U1 with respect to prices p
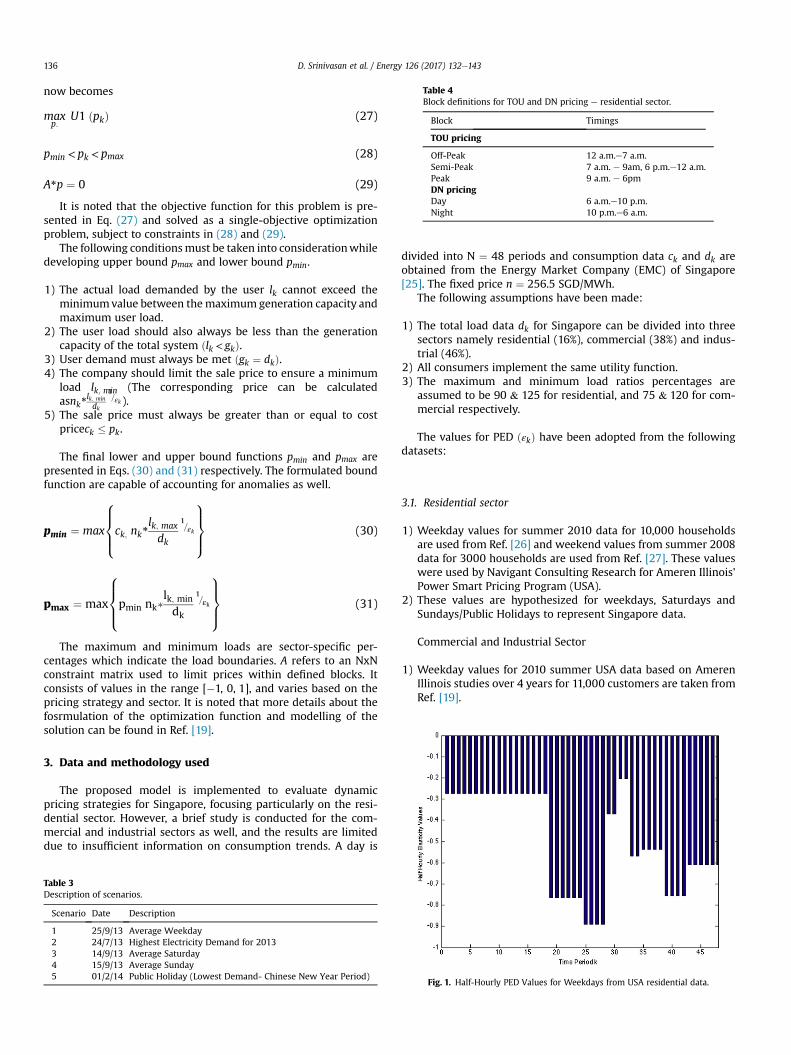
Table 4Block definitions for TOU and DN pricing e residential sector.
Block Timings
TOU pricing
Off-Peak 12 a.m.e7 a.m.Semi-Peak 7 a.m. e 9am, 6 p.m.e12 a.m.Peak 9 a.m. e 6pmDN pricingDay 6 a.m.e10 p.m.Night 10 p.m.e6 a.m.
D. Srinivasan et al. / Energy 126 (2017) 132e143136
now becomes
maxp:
U1 ðpkÞ (27)
pmin < pk < pmax (28)
A*p ¼ 0 (29)
It is noted that the objective function for this problem is pre-sented in Eq. (27) and solved as a single-objective optimizationproblem, subject to constraints in (28) and (29).
The following conditionsmust be taken into considerationwhiledeveloping upper bound pmax and lower bound pmin.
1) The actual load demanded by the user lk cannot exceed theminimumvalue between themaximum generation capacity andmaximum user load.
2) The user load should also always be less than the generationcapacity of the total system ðlk < gkÞ.
3) User demand must always be met ðgk ¼ dkÞ.4) The company should limit the sale price to ensure a minimum
load lk; min (The corresponding price can be calculatedasnk*
lk; min
dk
1=εk ).
5) The sale price must always be greater than or equal to costpriceck � pk.
The final lower and upper bound functions pmin and pmax arepresented in Eqs. (30) and (31) respectively. The formulated boundfunction are capable of accounting for anomalies as well.
pmin ¼ max
8>><>>:ck; nk*
lk; max
dk
1=εk
9>>=>>;
(30)
pmax ¼ max
8>><>>:pmin nk�
lk; min
dk
1=εk
9>>=>>;
(31)
The maximum and minimum loads are sector-specific per-centages which indicate the load boundaries. A refers to an NxNconstraint matrix used to limit prices within defined blocks. Itconsists of values in the range [�1, 0, 1], and varies based on thepricing strategy and sector. It is noted that more details about thefosrmulation of the optimization function and modelling of thesolution can be found in Ref. [19].
3. Data and methodology used
The proposed model is implemented to evaluate dynamicpricing strategies for Singapore, focusing particularly on the resi-dential sector. However, a brief study is conducted for the com-mercial and industrial sectors as well, and the results are limiteddue to insufficient information on consumption trends. A day is
Table 3Description of scenarios.
Scenario Date Description
1 25/9/13 Average Weekday2 24/7/13 Highest Electricity Demand for 20133 14/9/13 Average Saturday4 15/9/13 Average Sunday5 01/2/14 Public Holiday (Lowest Demand- Chinese New Year Period)
divided into N ¼ 48 periods and consumption data ck and dk areobtained from the Energy Market Company (EMC) of Singapore[25]. The fixed price n ¼ 256.5 SGD/MWh.
The following assumptions have been made:
1) The total load data dk for Singapore can be divided into threesectors namely residential (16%), commercial (38%) and indus-trial (46%).
2) All consumers implement the same utility function.3) The maximum and minimum load ratios percentages are
assumed to be 90 & 125 for residential, and 75 & 120 for com-mercial respectively.
The values for PED ðεkÞ have been adopted from the followingdatasets:
3.1. Residential sector
1) Weekday values for summer 2010 data for 10,000 householdsare used from Ref. [26] and weekend values from summer 2008data for 3000 households are used from Ref. [27]. These valueswere used by Navigant Consulting Research for Ameren Illinois'Power Smart Pricing Program (USA).
2) These values are hypothesized for weekdays, Saturdays andSundays/Public Holidays to represent Singapore data.
Commercial and Industrial Sector
1) Weekday values for 2010 summer USA data based on AmerenIllinois studies over 4 years for 11,000 customers are taken fromRef. [19].
Fig. 1. Half-Hourly PED Values for Weekdays from USA residential data.

Fig. 2. Half-Hourly PED Values for Weekends from USA residential data.
D. Srinivasan et al. / Energy 126 (2017) 132e143 137
2) The values from the above dataset are modified to representSingapore data consumption on weekdays.
The proposedmodel is tested on fivewide-spread scenarios thatprovide unique trends in consumption data as shown in Table 3.
Three pricing strategies have been implemented and evaluatedviz. Half-Hourly RTP Pricing, TOU Block Pricing and Day-NightPricing. The best combination of MUS and MUF values has beenchosen based on maximum peak-load reduction and minimumtotal-load reduction. The optimization for this problem is per-formed using the KNITROMATLAB software as it is considered to bevery reliable and provides stable and accurate results. The interioror direct optimization algorithm is used, as it is known to price thebest results especially in the cases where the Hessian andLagrangian are not considered.
4. Results and discussions e the residential sector
The proposed pricing model is initially implemented and eval-uated for the residential sector. The strategy-wise time-block def-initions for the residential sector are presented in Table 4. For TOUpricing, the peak period is identified to be during the day while theoff-peak period is mostly observed either during late night or earlymorning. The results are discussed using both the PED data of USAand the hypothesized data for Singapore.
Fig. 3. Half-Hourly hypothesized PED values for weekdays.
4.1. Using USA PED data
PED datasets from Navigant Consulting Research for bothweekday and weekend are presented in Fig. 1 and Fig. 2respectively.
4.1.1. WeekdaysResults with MUF ¼ 2 and MUS ¼ 1 provide the highest peak
load reduction and highest profits for all three cases, however theyalso cause a very high total load reduction. This is reflected in thesatisfaction function with a very high positive value (of the order106), thereby indicating that consumer demands are not met. It isevident that these values are not applicable for Singapore load data.Using MUF ¼ 3 and MUS ¼ 1:5, a very high peak load reduction isachieved, however the 7% decrease in total load consumption forRTP pricing appears unrealistic as reflected in high positive valuesfor the satisfaction function. The combination MUF ¼ 4, MUS ¼ 2 ischosen as the best combination that maximizes peak and minimizetotal load reduction. RTP pricing appears to be the most suitablestrategy as it provides a maximum peak load reduction of 7%, earnsmaximumprofits and achievesminimum fluctuation. Although thisdataset provides results for scenario 1, it is unable to model sce-nario 2 as block constraints (A matrix) could not be met. Forexample, the PED value is as low as �0.274 during the night andgoes up to a value of �0.891 during the day, especially in theafternoon.
4.1.2. Weekends and holidaysThe PED from USA data need to be adapted for Singapore
weekend data. Values during the day are high, implying a veryelastic condition whereas those during the night are extremely lowimplying an almost inelastic situation. The following impacts areseen on the results. Numerous simulations are completed in orderto find a suitable combination of values for MUF and MUS.
MUF ¼ 4 and MUS ¼ 2 (as used in the case for weekdays) leadsto erroneous results such as massive load reduction with no peak-trimming. The load curve after dynamic pricing follows the exacttrend as that before the change but scaled down drastically.
4.2. Using hypothesized PED data
Due to a large difference in the consumption patterns in USAand Singapore data, the PEDs for USA can not be applied onSingapore data. The elasticity values have therefore been hypoth-esized to represent the current trend for Singapore's residentialelectricity consumption using the actual load data. Two datasetshave been developed to reflect trends for weekdays and weekends,including public holidays as illustrated in Figs. 3 and 4.
4.2.1. WeekdaysThe hypothesized half-hourly PED values for average weekdays
in Singapore are presented in Fig. 3. The lowest PED is seen at thepeak afternoon time between 2 and 5 p.m. (k ¼ 29e34) and duringthe night due to the expected use air-conditioner. The highestelasticity is observed late in the night and early in the morning.MUF andMUS values are chosen based on simulations conducted ondata for any particular day and the results are presented. MUF ¼ 2and MUS ¼ 1 gives the highest peak load change of an averageof �9.67% across all different pricing strategies while an averagetotal load reduction of�1.67%. The profits are seen to be the highestas compared to any other combination of values as well. MUF ¼ 3and MUS ¼ 1:5 lead to a very minimal peak load change with anaverage of�1.67% and a very high change in total load consumptionwith an average of 7%. Profits are lower than in the case ofMUF ¼ 2and MUS ¼ 1 since the satisfaction function is highly negative

Fig. 4. Half-Hourly hypothesized PED values for weekends.
D. Srinivasan et al. / Energy 126 (2017) 132e143138
(approximately 106). This indicates that customers consume moreelectricity than they would without dynamic pricing, which is ahighly unlikely scenario.
MUF ¼ 4 and MUS ¼ 2 leads in 0% peak load change and veryhigh increase in total load consumption with an average of 8.67%.Satisfaction is higher in value than in the previous case that pushesprofits down even further. Hence, the final values chosen areMUF ¼2 and MUS ¼ 1.
Figs. 5e7 show the obtained results for the pricing and loadcurves for RTP, TOU and DN pricing respectively with MUF ¼ 2 andMUS ¼ 1 applied to Scenario 1. All three load curves show peaktrimming and valley filling indicating that the pricing strategieshave the desired impact on consumer consumption. The pricingtrends appear to be correct as they show higher prices for the peakperiods of the day (afternoons) making these PED values appearmore suitable for Singapore data. Block Pricing results show a sharpdrop at k ¼ 14 in the load curve that is caused by the change in theblock period and the sudden increase in the price. This is a sharptheoretical drop although in real-life this might not be the case. RTPpricing achieves the least load fluctuation of the order 104 ascompared to other strategies where fluctuations are of the order105.It is observed from Figs. 5 and 6 that the maximum peak loadreduction is 10%. TOU Pricing ensures no change in total loadconsumed and hence has the lowest (ideal) satisfaction functionvalue indicating that customers are the most satisfied. Other
Fig. 5. Pricing (left) and load (right) results for
strategies show minimal total load changes. RTP pricing shows themaximum profits because it has the lowest combination of satis-faction and fluctuation.
Thus, RTP Pricing is found to be most suitable for Singapore'sdata as it maximizes peak load reduction, profits and satisfaction,and minimizes total load reduction and fluctuation. It is observedthat the hypothesized elasticity values fit the Singapore data well.There is an average peak load reduction of 9.67% and a slightdecrease in average overall consumption at 1.67%.
4.2.2. Weekdays and holidaysThe chosen values are similar to those for weekdays except for a
few minor changes. Saturday in general is considered slightly lesselastic as more people are expected to be at home and usingmaximum electricity. Thus especially during the day, the values areslightly lower than that on a weekday. Figs. 8e10 show the ob-tained results for the pricing and load curves for RTP, TOU and DNpricing respectively withMUF ¼ 2 andMUS ¼ 1 applied to Scenario3.
The results are observed to have similar characteristics to thosepresented for weekdays. Successful peak trimming, valley fillingand correct pricing trends are achieved. A sharp drop in blockpricing (k ¼ 4) is observed as seen in Figs. 9 and 10. The lowestfluctuation, highest profits and maximum peak load reduction areobserved for RTP Pricing whereas the lowest peak load reduction isfor DN Pricing and lowest total load reduction is for TOU Pricingrespectively. The total load reduction is higher than in the case ofweekdays at an average of 3.33% across all sectors. This is reflectedwith generally higher satisfaction function values. Hence, perhapsthe PED values hypothesized for this scenario are not as accurate asthose presented for weekdays. Once again RTP Pricing is observedto be most suitable. Hypothesized PED values appear to fitSingapore data (average peak load reduction of 9% and average totalload change of �3.337%). These results are good, but not as good asthose during weekdays indicating that the values can be improved.Table 5 and Table 6 list out the various model parameters for Sce-nario 1(Weekday) and Scenario 3 (Weekend).
5. Results/discussions e commercial sector
This section presents and discusses the results obtained usingdynamic pricing strategies for the commercial sector using PEDvalues. The values for the weekdays are taken from the USA datathat is based on Ameren Illinois data for four years and 11,000
RTP pricing e Scenario 1 Residential sector.
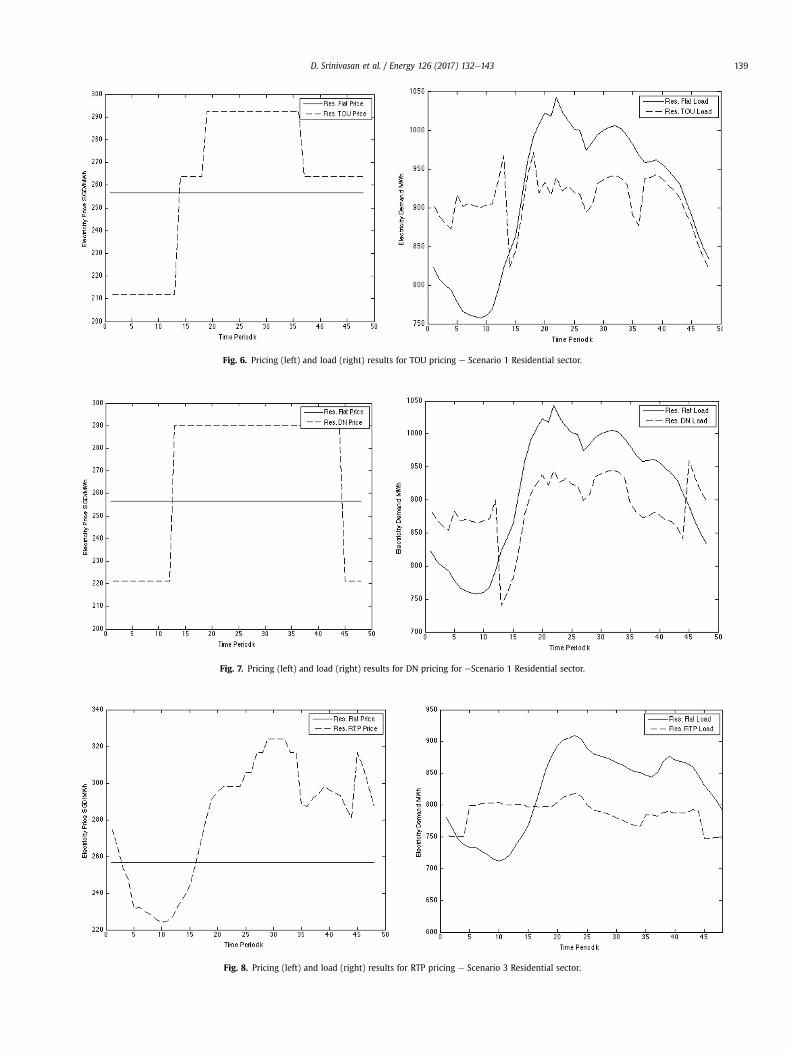
Fig. 6. Pricing (left) and load (right) results for TOU pricing e Scenario 1 Residential sector.
Fig. 7. Pricing (left) and load (right) results for DN pricing for eScenario 1 Residential sector.
Fig. 8. Pricing (left) and load (right) results for RTP pricing e Scenario 3 Residential sector.
D. Srinivasan et al. / Energy 126 (2017) 132e143 139

Fig. 9. Pricing (left) and load (right) results for TOU pricing e Scenario 3 Residential sector.
Fig. 10. Pricing (left) and load (right) results for DN pricing for e Scenario 3 Residential sector.
Table 5Model parameters for scenario 1 - residential sector.
Strategy MUF MUs Utility(*106 utils)
Profits(M SGD)
Satisfaction(*105)
Fluctuation(*105)
Total load change Peak load change
RTP 2 1 5.00 6.88 12.40 6.45 �10% �10%TOU 2 1 4.32 6.18 9.82 8.77 �8% �9%DN 2 1 4.15 5.56 7.71 6.33 �6% �9%RTP 3 1.5 4.17 5.87 1.26 4.40 �7% �10%TOU 3 1.5 3.57 4.63 5.95 4.66 �3% �9%DN 3 1.5 3.64 4.88 7.11 5.25 �4% �9%RTP 4 2 3.90 3.71 �3.87 1.96 3% �7%TOU 4 2 3.44 3.44 �4.54 4.51 3% �4%DN 4 2 3.28 4.36 3.77 7.09 �1% �6%
Table 6Model parameters for scenario 3 e residential sector.
Strategy Utilityð�106 utilsÞ Profits(M SGD)
Satisfaction(*105)
Fluctuation(*104)
Total load change Peak load change
RTP 4.40 4.94 5.06 3.73 �4% �10%TOU 4.27 4.57 2.45 5.87 �2% �9%DN 3.81 4.6 6.48 23.1 �4% �8%
D. Srinivasan et al. / Energy 126 (2017) 132e143140

Table 7Block definitions for TOU and DN pricing e residential sector.
Block Timings
TOU pricing
1 10pm e 7am2 7 a.m. �10 a.m., 8 p.m.e10 p.m.3 10 a.m.e1 p.m., 5 p.m. e 8pm4 1 p.m.e5 p.m.DN pricingDay 8 a.m.e8 p.m.Night 8 p.m.e8 a.m.
Fig. 11. Half hourly hypothesized PED values for weekdays.
D. Srinivasan et al. / Energy 126 (2017) 132e143 141
customers [12]. Hypothesized values are obtained by modifyingthis data in order to reflect peak period during the afternoon. Theblock definitions for TOU and DN pricing strategies are definedbelow in Table 7. Since the hypothesized data is obtained by slightly
Table 8Model parameters for scenario 1 e commercial sector.
Strategy MUF MUS Utilityð106 utilsÞ Profits(MSGD)
Increase in profits
RTP 2 2 11.1 12.2 18.7%TOU 2 2 9.68 11.1 7.97%DN 2 2 8.15 9.69 �5.74%
Fig. 12. Pricing (left) and load (right) results for D
modifying the US PED data, the results are discussed directly for thehypothesized data only. Since we are dealing with the commercialsector, only the weekday scenario is taken into consideration. Thehalf-hourly commercial data for weekdays is shown in Fig. 11.MUF ¼ 2 and MUS ¼ 2 are chosen as they give the best results.
Table 8 and Figs. 12e14 show the results obtained when thedeveloped pricing model is applied to Scenario 1. It is clearlyobserved that the new PED dataset now fits the Singapore patterand favourable results are obtained with the expected price/loadtrends. RTP Pricing is indeed the most suitable as it provides thehighest peak load reduction and highest increase in profits. Overall,a peak load reduction of 4.44% and an increase in profits of 7% areobtained.
6. Results/discussions e industrial sector
This section presents PED values from USA data for weekdaysand attempts to use it to model Singapore's industrial sector. Sec-tion 2.1 uses values from 2010 Ameren Illinois data that is pre-sented in Ref. [12] and Section 2.2 uses values from 2005 USA datafrom Ref. [21]. The PED values could not be hypothesized success-fully because there isn't enough information on the trend of con-sumption patterns in Singapore. There are no results to bepresented because neither of the dataset was suitable forSingapore. Figs. 15 and 16 represent the PED datasets used for theindustrial sector in USA.
6.1. Using 2010 USA PED data from Ref. [12]
This dataset presents very high PED values indicating a unitelastic situation inmost cases. PED values are unexpectedly high forexpected peak periods, and minimal variation throughout the daymakes it harder to identify distinct peak/non-peak periods. This is avery futuristic scenariowhere loads can be shifted to any part of the
(%) Satisfaction(*105)
Fluctuation(*106)
Total load change Peak load change
4.53 0.63 0.27% �5.00%1.02 1.27 0.60% �5.00%�4.73 2.02 1.34% �3.32%
N pricing for eScenario 3 Commercial sector.

Fig. 13. Pricing (left) and load (right) results for DN pricing for eScenario 1 Commercial sector.
Fig. 14. Pricing (left) and load (right) results for TOU pricing e Scenario 1 Commercial sector.
Fig. 15. Half-Hourly hypothesized PED values for weekdays in 2010. Fig. 16. Half-Hourly hypothesized PED values for weekends in 2010.
D. Srinivasan et al. / Energy 126 (2017) 132e143142
D. Srinivasan et al. / Energy 126 (2017) 132e143 143
day and consumption is almost perfectly elastic. However, consid-ering the current load/price data and the assumption that industrialload is 46% of the total at all times of the day, Singapore's load is notas elastic and cannot be modelled with this dataset.
6.2. Using 2005 USA PED data from Ref. [21]
This dataset presents very low PED values indicating an almostinelastic situation where consumption is not flexible. Since thestudy was published in 2005, the values can be considered obso-lete, as the advent of smart grids has made load shifting far moreconvenient. Results show unrealistically high prices in the order of~104 with normally used values of MUF andMUS. It is also observedthat increasing the weights results in negative values for the utility.
7. Conclusion
This work proposes a game-theoretic study of dynamic pricingstrategies for the electricity market in Singapore. The pricingmodels are developed and tested on data obtained from EMC,Singapore. The residential and commercial models are testedextensively to obtain the best pricing strategy. Many load/pricedatasets from real and practical Singapore consumption dataincluding weekdays, weekends and public holidays are used, andthree pricing strategies namely half hourly RTP Pricing, TOU Pricingand DN Pricing are evaluated. Results obtained are very promising:RTP Pricing is identified as the best strategy with a 10% and 5% peakload reduction and a 15.5% and 18.8% increase in profits for theutility company in the residential and commercial sectors respec-tively. These results indicate that the game-theoretic based dy-namic pricing model is indeed a promising strategy for demandside management. With capable and universal energy intelligencesystems, this pricing strategy would be very useful for the elec-tricity market.
The model is considerably robust, as it can be used to developnumerous pricing strategies, model multiple sectors, shift focusbetween the consumer and company's utility by changing thevalues of MUF and MUSÞ and simultaneously be applied to a widerange of price/load data. The industrial sector is also tested with themodel; however, results are limited owing to the insufficient in-formation on Singapore's consumption trends. Future work willinclude testing on different satisfaction functions, including mul-tiple user types in the case studies, understand the impact ofrenewable generation sources on DSM considering dynamic pricingtechnique, and to understand the impact of the dynamic pricing onshort-term PEDs for long term. Although the testing and compar-ison are conducted only using Singapore data, the proposed modelcan be used to develop pricing strategies for other countries as well.
Acknowledgment
This work was supported by the National Research Foundationunder the Grant No. R-263-A66-279.
References
[1] Bobmann T, Staffell I. WN Association. The shape of future electricity demand:exploring load curves in 2050s Germany and Britain. Energy October2015;90(2):1317e33.
[2] Asawari M, Powsiri K, Ali F. Effects of dynamic pricing on residential electricitybill. IEEE PES 2004;2:1030e5.
[3] Strbac Goran. Demand side management: benefits and challenges. EnergyPolicy December 2008;36(12):4419e26.
[4] Yao E, Samadi P, Wong VWS, Schober R. Residential demand side manage-ment under high penetration of rooftop photovoltaic units. IEEE Trans SmartGrid May 2016;7(3):1597e608.
[5] Chiu TC, Shih YY, Pang AC, Pai CW. Optimized day-ahead pricing withrenewable energy demand-side management for smart grids. IEEE InternetThings J 2016;PP(99):1e10.
[6] Thakur Jagruti, Chakraborty Basab. Demand side management in developingnations: a mitigating tool for energy imbalance and peak load management.Energy November 2016;114(1):895e912.
[7] Mohsenian-Rad AH, Wong VWS, Jatskevich J, Schober R, Leon-Garcia A.Autonomous demand-side management based on game-theoretic energyconsumption scheduling for the future smart grid. IEEE Trans Smart Grid Dec.2010;1(3):320e31.
[8] Logenthiran Thillainathan, Srinivasan Dipti, Shun Tan Zong. Demand sidemanagement in smart grid using heuristic optimization. IEEE Trans Smart Grid2012;3.3:1244e52.
[9] Logenthiran T, et al. Multi-Agent System (MAS) for short-term generationscheduling of a microgrid. In: 2010 IEEE international conference on sus-tainable energy technologies (ICSET). IEEE; 2010.
[10] Ghazvini MAF, Faria P, Ramos S, Morais H, Vale Z. Incentive-based demandresponse programs designed by asset-light retail electricity providers for theday-ahead market. Energy March 2015;82:786e99.
[11] Benefits of demand response in electricity markets and recommendations forachieving them. U.S. Department of Energy; 2006.
[12] Boisvert R, Cappers P, Neenan B. The benefits of customer participation inwholesale electricity markets. Electricity 2002;15(3):44e51.
[13] Hong SH, Yu M, Huang X. A real-time demand response algorithm for het-erogeneous devices in buildings and homes. Energy 2015;80:123e32.
[14] Gao D, Sun Y, Lu Y. A robust demand response control of commercial buildingsfor smart grid under load prediction uncertainty. Energy 2015;93(1):275e83.
[15] Federal Energy Regulatory Commission. Assessment of demand response andadvanced metering. Federal Energy Regulatory Commission; 2011. Report.
[16] Intelliekon. Achieving sustainiable energy consumption with snart metering,comminication and tariff systems. Results. Freiburg: Federal Ministry of Ed-ucation and Research; 2011. Results.
[17] Energy Market Authority. Energising our nation: Singapore electricity statis-tics. Singapore: Energy Market Authority; 2012. Annual Report.
[18] Energy Market Authority. (2014, Mar.) Singapore Electricity Market. [Online],www.ema.gov.sg.
[19] Yang P, Tang G, Nehorai A. A game-theoretic approach for optimal time-of-useelectricity pricing. IEEE Trans Power Syst 2013;28(2):884e92.
[20] Yang J, Zhang G, Ma K. Matching supply with demand: a power control andreal time pricing approach. Int J Electr Power & Energy Syst 2014;61:111e7.
[21] Schreiber M, Wainstein ME, Hochloff P, Dargaville R. Power and energy pricesignals designed for a smater grid. Energy 2015;93(2):2568e81.
[22] Kobayashi K, Hiraishi K. Algorithm for optimal real-time pricing based onswitched Markov chain models. Innovative Smart Grid Technologies Confer-ence (ISGT). IEEE Power & Energy Soc 2015:1e5.
[23] W. Saad, H. Zhu, H V. Poor, T.Basar, Game-theoretic methods for the smartgrid: an overview of microgrid systems, demand-side management, andsmart grid communications. IEEE Signal Process Mag, 29(586e105).
[24] Min CG, Kim MK, Park JK, Yoon YT. Game-theory based generation mainte-nance scheduling in electricity markets. Energy 2013;55:310e8.
[25] Energy Market Company, (2014, Mar.), EMC Homepage, [Online], https://www.emcsg.com/MarketData/PriceInformation.
[26] Navigant Consulting Inc, Power Smart Pricing 2010 Annual Report, AmerenIllinois, Verona, Wi. Annual Report 2010.
[27] Navigant Consulting Inc. In: Residential demand in a real-time pricing. Pro-gram in behavior, energy and climate change conference; 2010. p. 14e6.