future climate projection and using future climate data to ... · as stress test to test robustness...
TRANSCRIPT
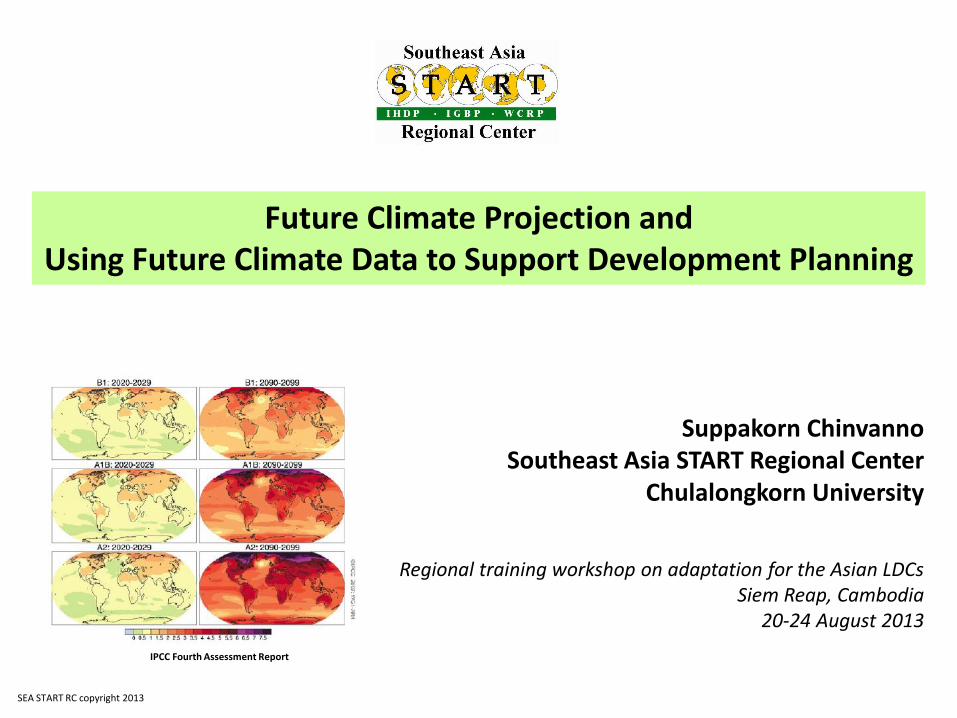
Future Climate Projection and Using Future Climate Data to Support Development Planning
Suppakorn Chinvanno Southeast Asia START Regional Center
Chulalongkorn University
Regional training workshop on adaptation for the Asian LDCs Siem Reap, Cambodia
20-24 August 2013
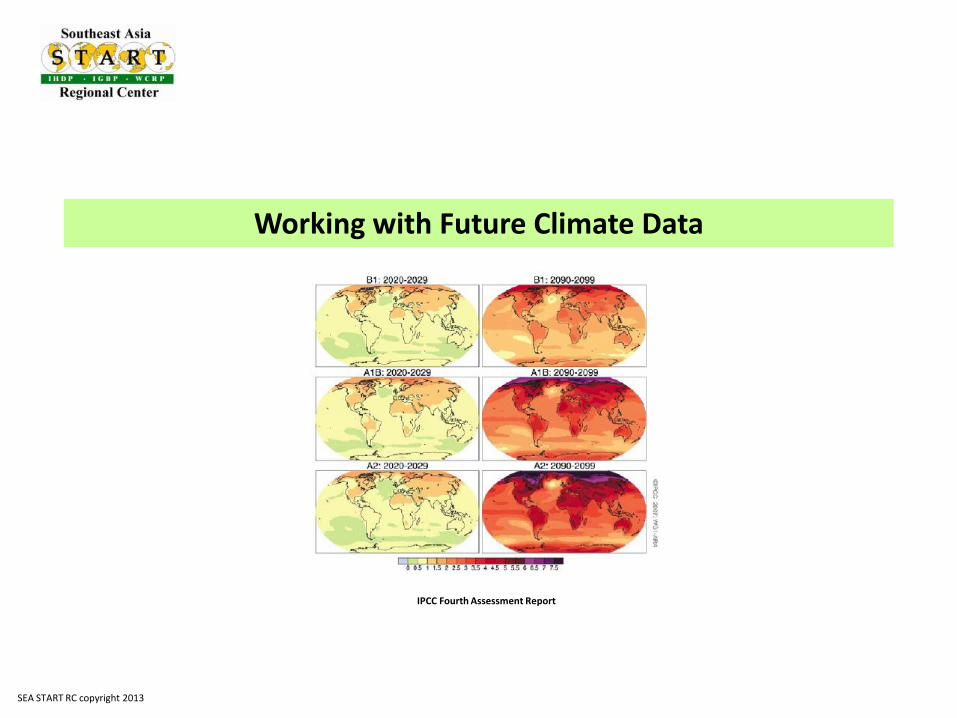
IPCC Fourth Assessment Report
SEA START RC copyright 2013

• Future climate projection and dataset for Southeast Asia
• Working with future climate data
• Examples: Using future climate data to support development planning
Topics
IPCC Fourth Assessment Report SEA START RC copyright 2013
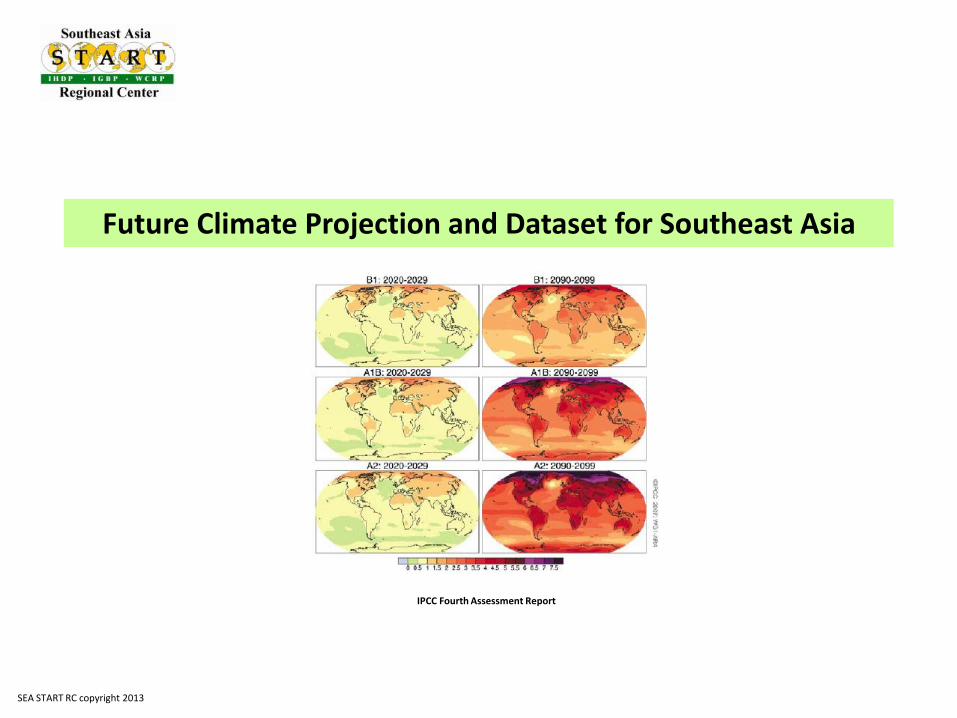
Future Climate Projection and Dataset for Southeast Asia
IPCC Fourth Assessment Report
SEA START RC copyright 2013

We can observe that climate change has occurred in the 20th century.
How can we know what the future holds
Future climate projection and dataset for Southeast Asia
Climate change is slow and complex process Study on climate change is based on scenarios from
future climate projection
SEA START RC copyright 2013

Future GHG Scenario
Future climate Scenario
Climate model - simulation
Future climate projection and dataset for Southeast Asia
SEA START RC copyright 2013

Global Climate Model – concern on scale resolution
• Projecting future climate scenario needs to simulate the whole globe – single system at the global scale
• Very time and resource consuming process
• Compromise with details loss – to recalculate to regain more details later
• Downscale process using regional climate model to add more details
Future climate projection and dataset for Southeast Asia
SEA START RC copyright 2013
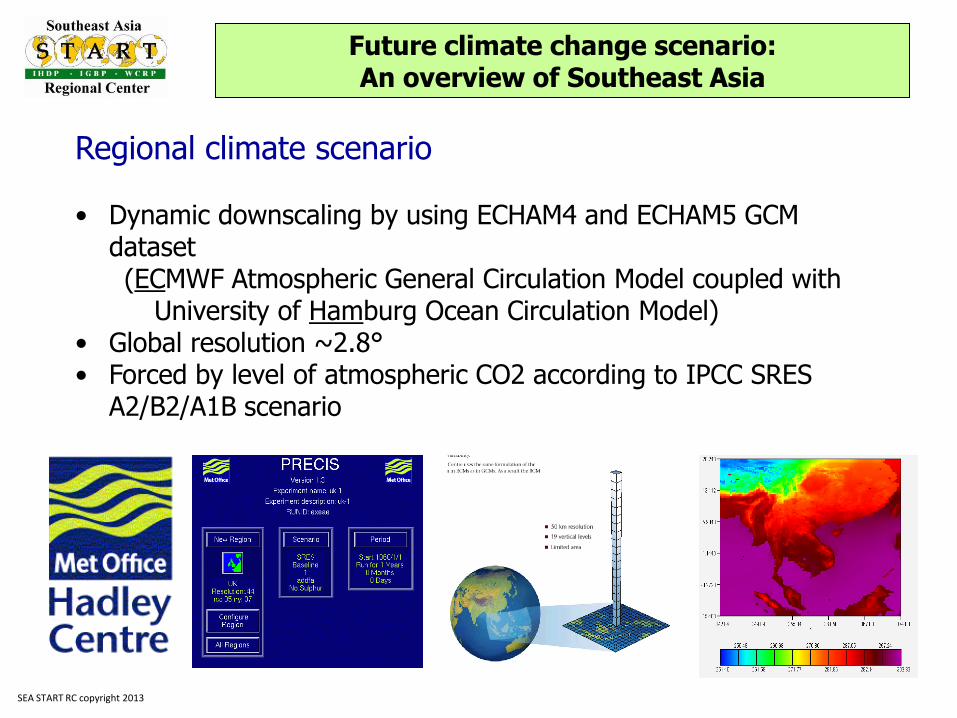
Regional climate scenario • Dynamic downscaling by using ECHAM4 and ECHAM5 GCM
dataset (ECMWF Atmospheric General Circulation Model coupled with
University of Hamburg Ocean Circulation Model) • Global resolution ~2.8° • Forced by level of atmospheric CO2 according to IPCC SRES
A2/B2/A1B scenario
Future climate change scenario: An overview of Southeast Asia
SEA START RC copyright 2013

Regional climate scenario for mainland Southeast Asia
• Resolution - geographic: 0.22 degree (approx. 25x25 km.)
• Resolution - temporal: daily
• GCM dataset:
• ECHAM4 (A2&B2) & ECHAM5 (A1B) Max-Planck-Institute for Meteorology / HadCM3 (A1B) – Hadley Center
• Timeframe
• 1970 - 2099 (ECHAM4)
• 1980 – 2069 (ECHAM5)
• 1980 – 2069 (HadCM3)
• Coverage
• Lat. 0-35ºN
• Lon. 90º-112ºE
Future climate projection and dataset for Southeast Asia
SEA START RC copyright 2013
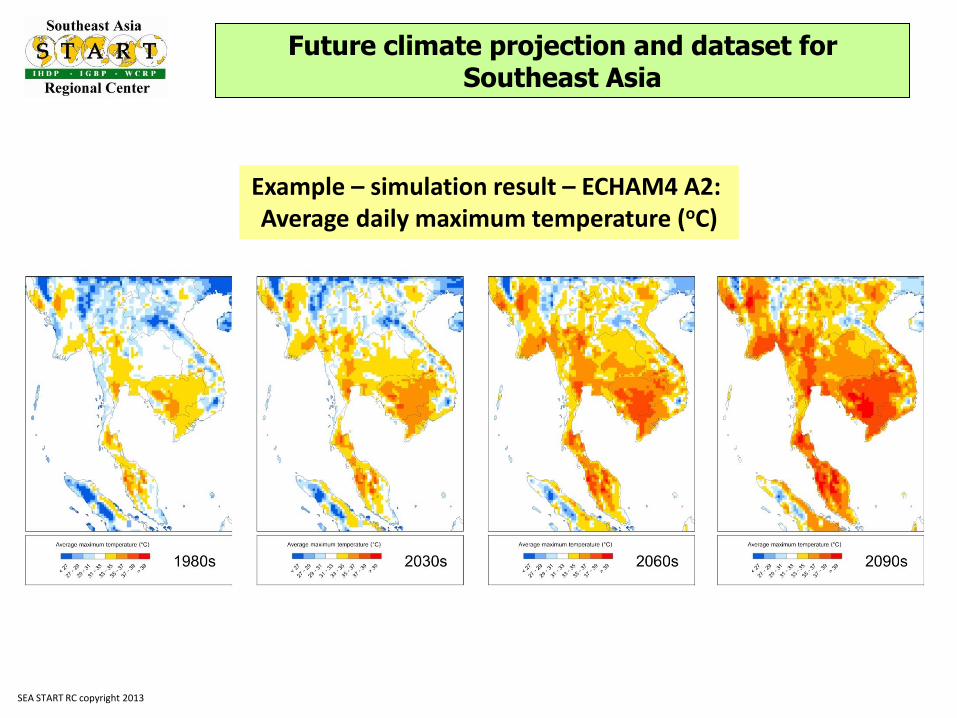
Example – simulation result – ECHAM4 A2: Average daily maximum temperature (oC)
Future climate projection and dataset for Southeast Asia
SEA START RC copyright 2013
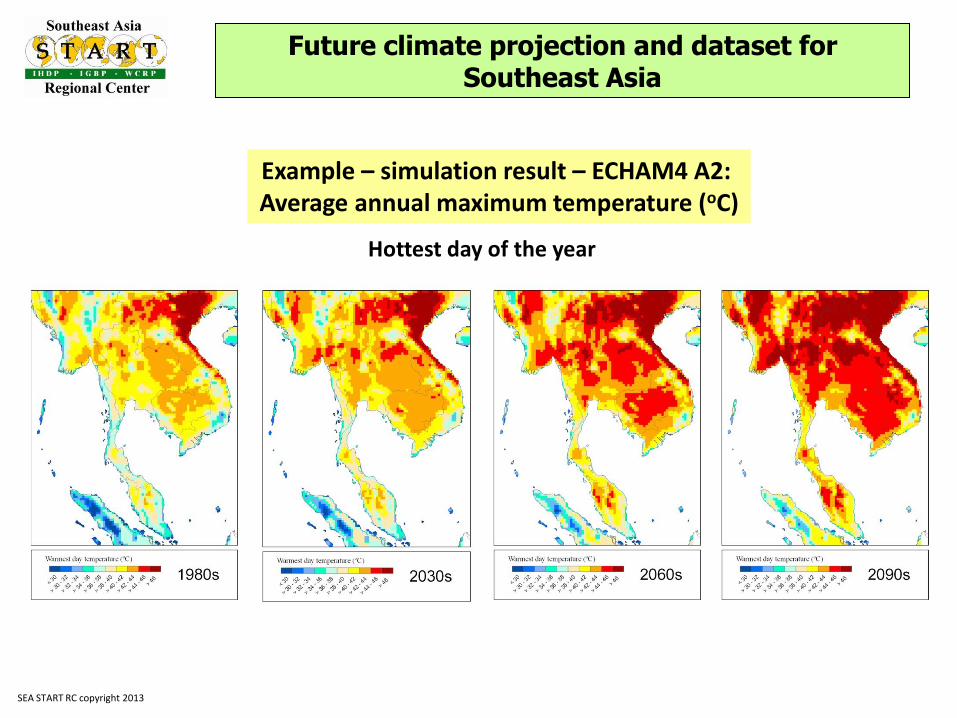
Example – simulation result – ECHAM4 A2: Average annual maximum temperature (oC)
Hottest day of the year
Future climate projection and dataset for Southeast Asia
SEA START RC copyright 2013
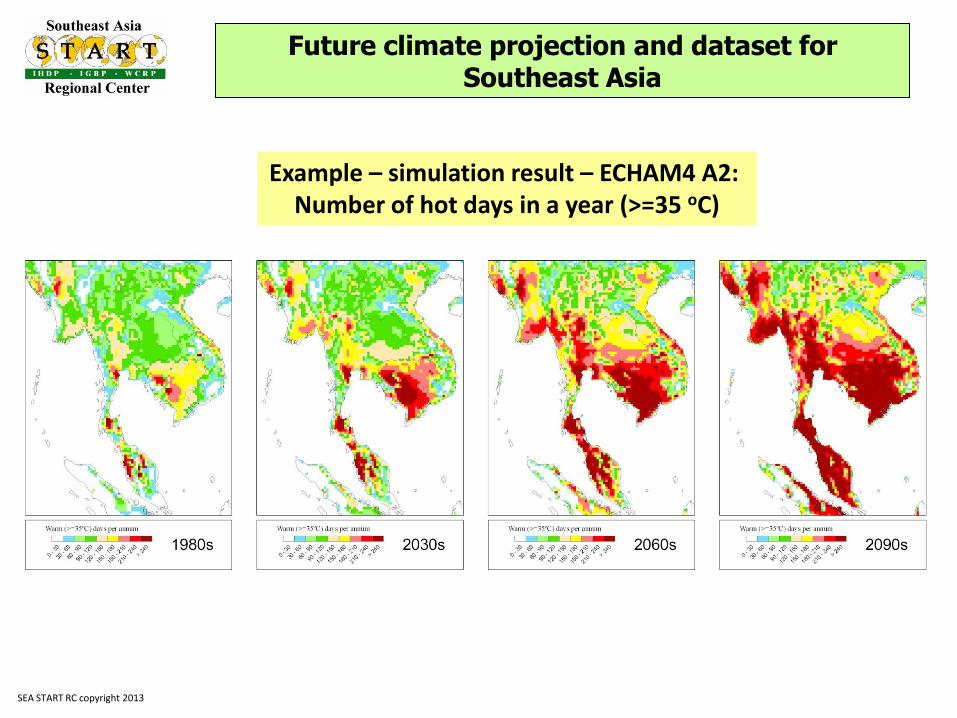
Example – simulation result – ECHAM4 A2: Number of hot days in a year (>=35 oC)
Future climate projection and dataset for Southeast Asia
SEA START RC copyright 2013
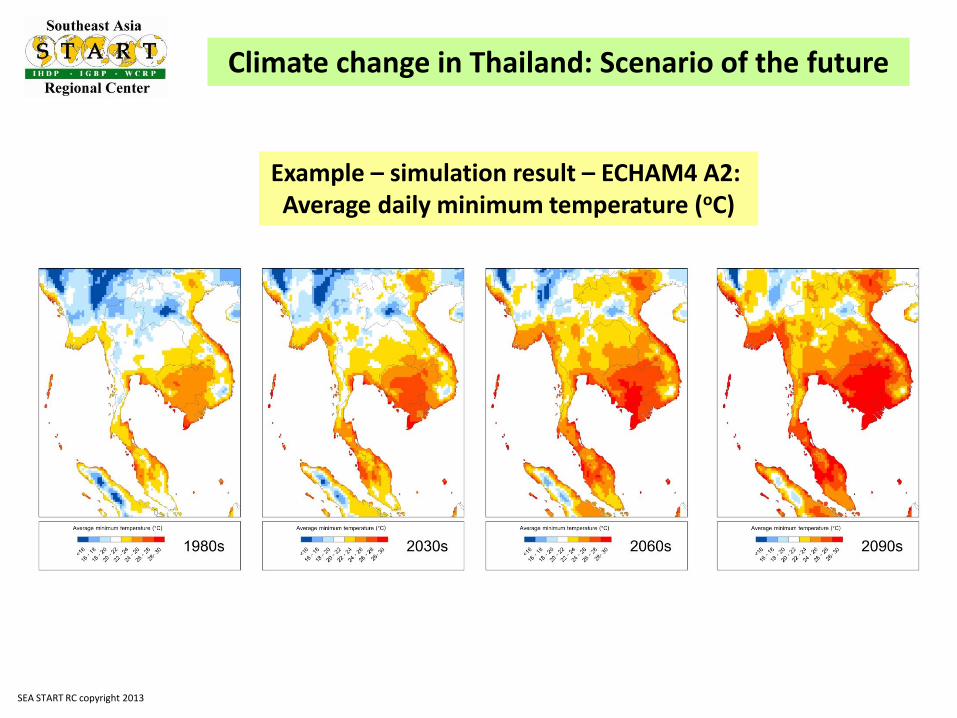
Example – simulation result – ECHAM4 A2: Average daily minimum temperature (oC)
Climate change in Thailand: Scenario of the future
SEA START RC copyright 2013

Coolest day of the year
Example – simulation result – ECHAM4 A2: Average annual minimum temperature (oC)
Future climate projection and dataset for Southeast Asia
SEA START RC copyright 2013

Example – simulation result – ECHAM4 A2: Number of cool day in a year (<=16 oC)
Future climate projection and dataset for Southeast Asia
SEA START RC copyright 2013

Example – simulation result – ECHAM4 A2: Change in annual precipitation compare to 1980’s (%)
Future climate projection and dataset for Southeast Asia
SEA START RC copyright 2013

Note: Climate change is not uniform across space and time – multi-dimensions of change
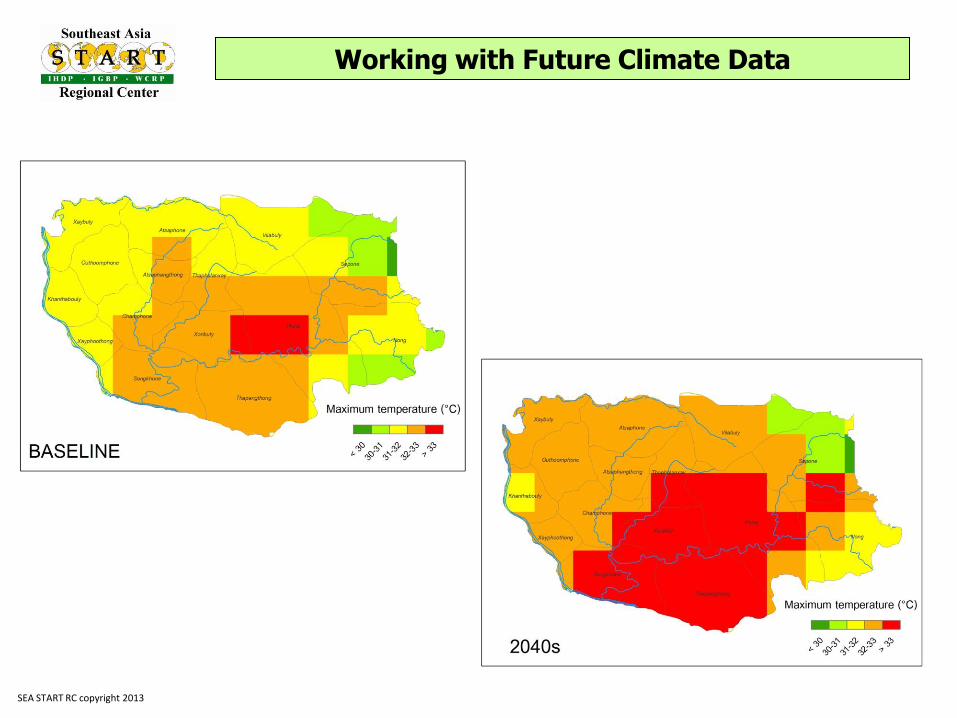
Change in average maximum temperature
Change in hot period over the year
Working with Future Climate Data
SEA START RC copyright 2013

Climate change in SEA at a glance
• SEA tends to be slightly warmer, but the hot area will be much wider
• Hot period of the year will be much warmer and longer
• Summertime will expand into winter
• Higher precipitation, increasing intensity as the length of rainy season tend to be more or less the same
Warmer and wetter
Different systems have different concern on the climate change
Future climate projection and dataset for Southeast Asia
SEA START RC copyright 2013
Working with Future Climate Data
IPCC Fourth Assessment Report
SEA START RC copyright 2013
Issues of concern about climate scenario:
• Climate scenario is only a plausible future – NOT forecast
• Need to use these data in climate context – NOT weather – consider climate pattern over period of time
• Data from climate scenario is not “truth” – need to be interpreted with care – it indicates direction and magnitude of future change in a broad sense, limitation on pinpoint accuracy
• Good and less good information, never perfect information
• Uncertainty – need for multiple scenarios
• New and/or improved method and technique for generating climate scenario is yet to come
Working with Future Climate Data
SEA START RC copyright 2013
Frequently asked question:
1. What climate model is best?
2. If we cannot be certain about result of climate models, how can we justify climate change adaptation plan?
These questions are not relevant!
Change in thinking paradigm
Dealing with Uncertainty of Climate Model
What could be risk from consequences of future change?
To what extent can we accept such risk?
Work with multiple scenarios to increase robustness of adaptation/development plan
Working with Future Climate Data
SEA START RC copyright 2013
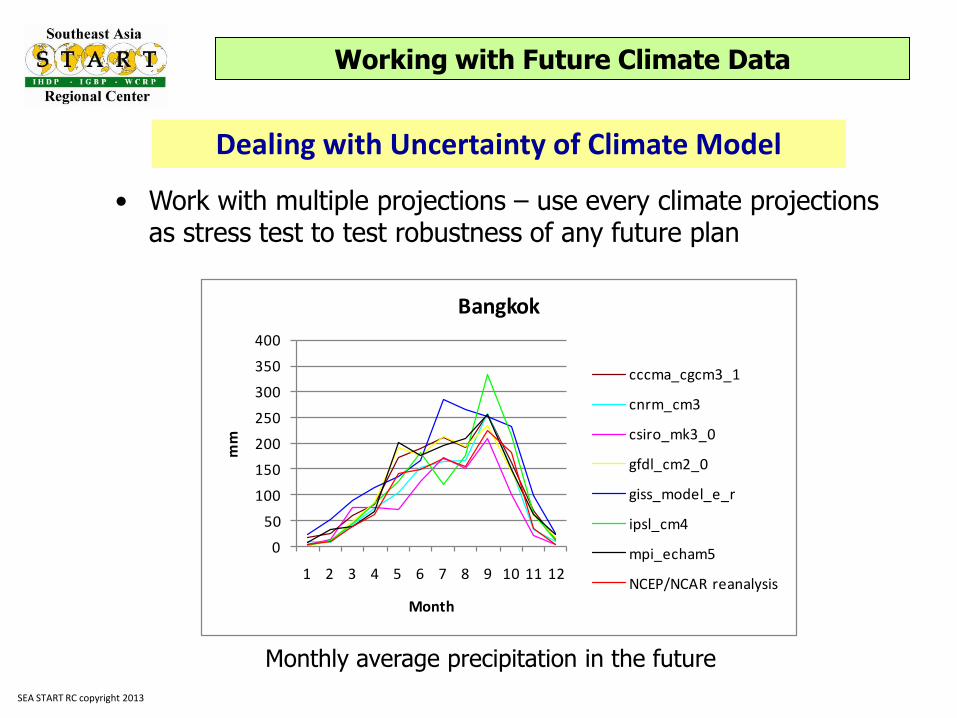
• Work with multiple projections – use every climate projections as stress test to test robustness of any future plan
0
50
100
150
200
250
300
350
400
1 2 3 4 5 6 7 8 9 10 11 12
mm
Month
Bangkok
cccma_cgcm3_1
cnrm_cm3
csiro_mk3_0
gfdl_cm2_0
giss_model_e_r
ipsl_cm4
mpi_echam5
NCEP/NCAR reanalysis
Monthly average precipitation in the future
Dealing with Uncertainty of Climate Model
Working with Future Climate Data
SEA START RC copyright 2013
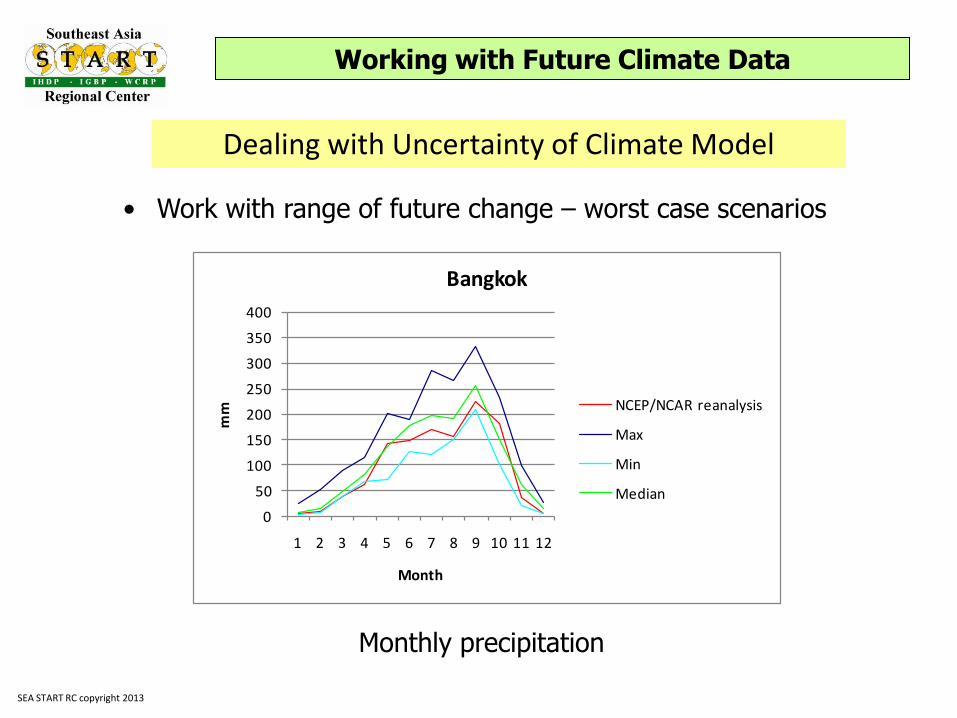
• Work with range of future change – worst case scenarios
0
50
100
150
200
250
300
350
400
1 2 3 4 5 6 7 8 9 10 11 12
mm
Month
Bangkok
NCEP/NCAR reanalysis
Max
Min
Median
Monthly precipitation
Dealing with Uncertainty of Climate Model
Working with Future Climate Data
SEA START RC copyright 2013
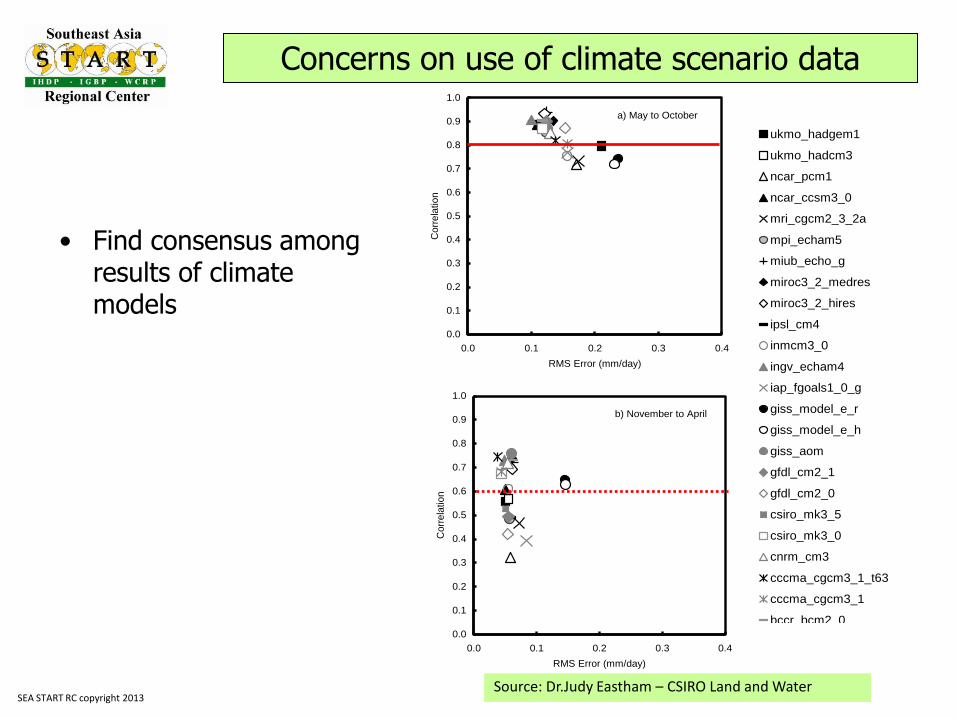
• Find consensus among results of climate models
a) May to October
0.0
0.1
0.2
0.3
0.4
0.5
0.6
0.7
0.8
0.9
1.0
0.0 0.1 0.2 0.3 0.4
RMS Error (mm/day)
Corr
ela
tion
b) November to April
0.0
0.1
0.2
0.3
0.4
0.5
0.6
0.7
0.8
0.9
1.0
0.0 0.1 0.2 0.3 0.4
RMS Error (mm/day)
Corr
ela
tion
ukmo_hadgem1
ukmo_hadcm3
ncar_pcm1
ncar_ccsm3_0
mri_cgcm2_3_2a
mpi_echam5
miub_echo_g
miroc3_2_medres
miroc3_2_hires
ipsl_cm4
inmcm3_0
ingv_echam4
iap_fgoals1_0_g
giss_model_e_r
giss_model_e_h
giss_aom
gfdl_cm2_1
gfdl_cm2_0
csiro_mk3_5
csiro_mk3_0
cnrm_cm3
cccma_cgcm3_1_t63
cccma_cgcm3_1
bccr_bcm2_0
Source: Dr.Judy Eastham – CSIRO Land and Water
Concerns on use of climate scenario data
SEA START RC copyright 2013

Working with Future Climate Data
SEA START RC copyright 2013
http://cc.start.or.th/

Climate data for distribution
• Daily maximum temperature (º C)
• Daily minimum temperature (º C)
• Daily precipitation (mm)
• Solar radiation (watt/m2)
• Wind speed (m / sec)
• Wind direction (degree from north)
• Relative humidity
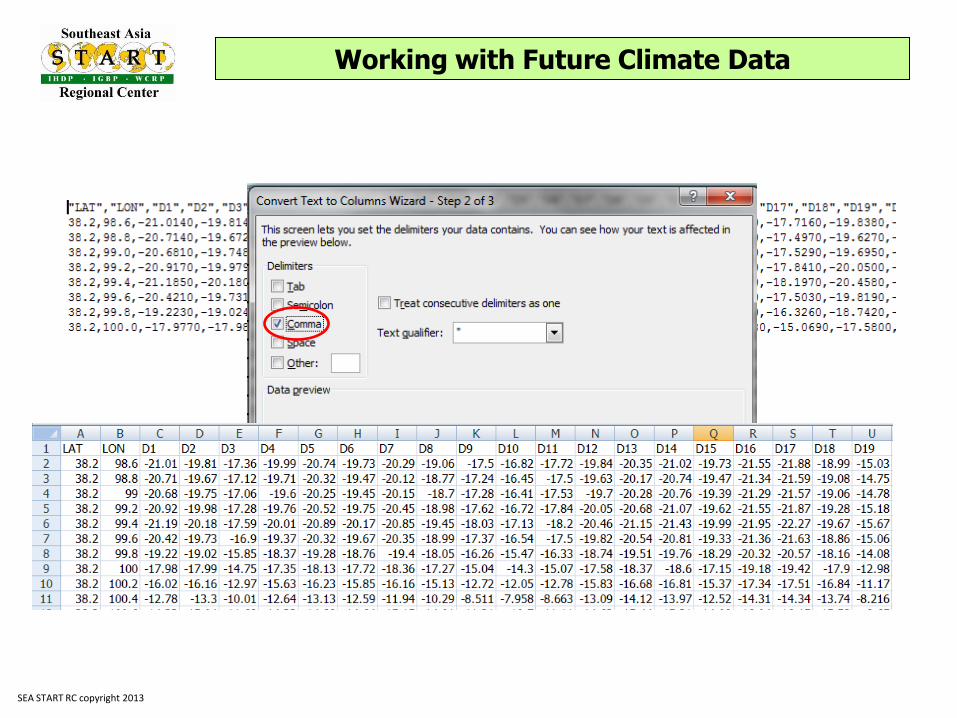
Available in text file format for ease of use
Each file = 1 variable / 1 year
Total data size (A2/B2) approx. 100GB
Working with Future Climate Data
SEA START RC copyright 2013
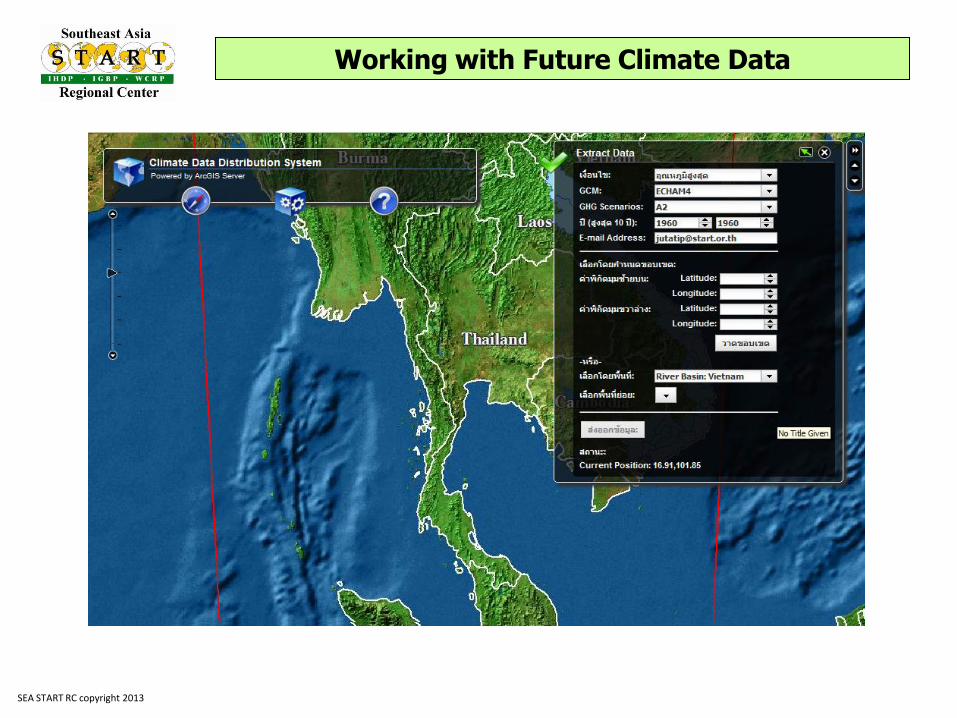
• CC Distribution http://cc.start.or.th/
Working with Future Climate Data
SEA START RC copyright 2013
• CC Distribution http://cc.start.or.th/
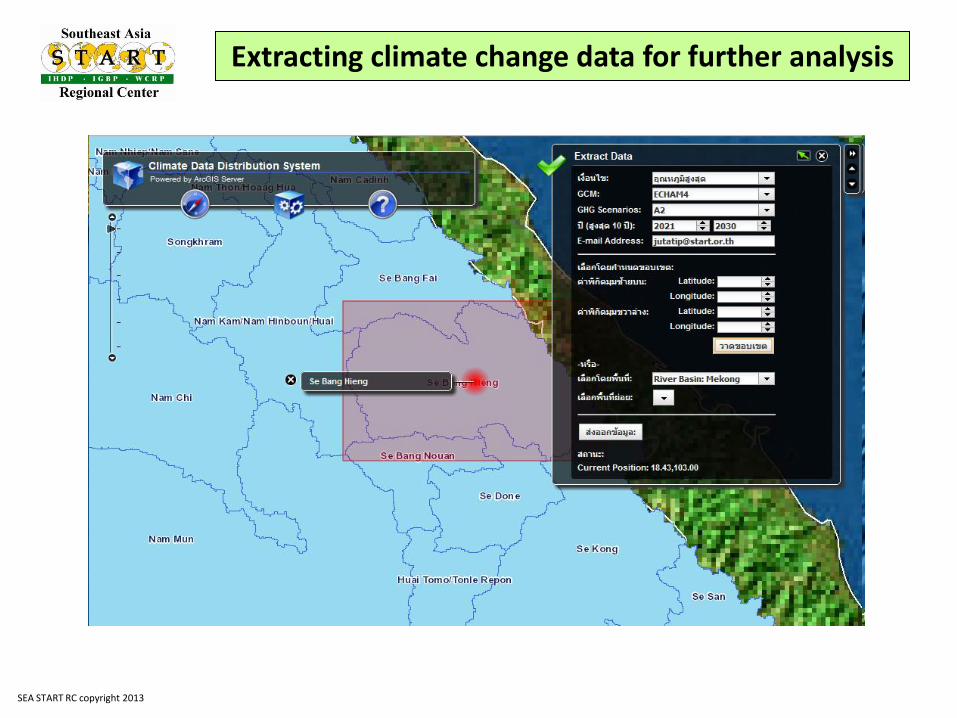
Extracting climate change data for further analysis
SEA START RC copyright 2013

Data represents centroid of the grids
Data be distributed to users in smaller domain of focus: • Watershed • Administrative boundary • Freehand selection
Data structure
Working with Future Climate Data
SEA START RC copyright 2013
Working with Future Climate Data
SEA START RC copyright 2013
Selecting data from relevant grids(s) for further analysis
• Selecting data from multiple grids for area analysis
(large area – using GIS tool to select data)
• Selecting data from selected grid(s) for analysis
(small area – hand pick grid(s) to select data based on lat./lon. coordinate)
How to conduct climate change risk assessment with limited dataset
Working with Future Climate Data
SEA START RC copyright 2013
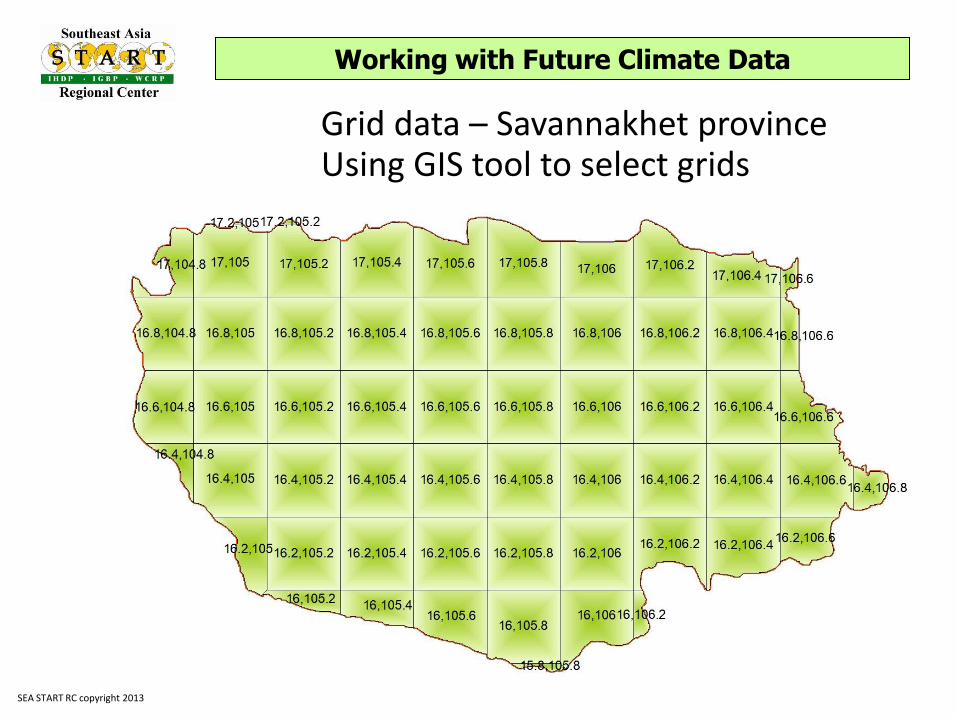
Grid data – Savannakhet province Using GIS tool to select grids
Working with Future Climate Data
SEA START RC copyright 2013
Working with Future Climate Data
SEA START RC copyright 2013
Working with Future Climate Data
SEA START RC copyright 2013

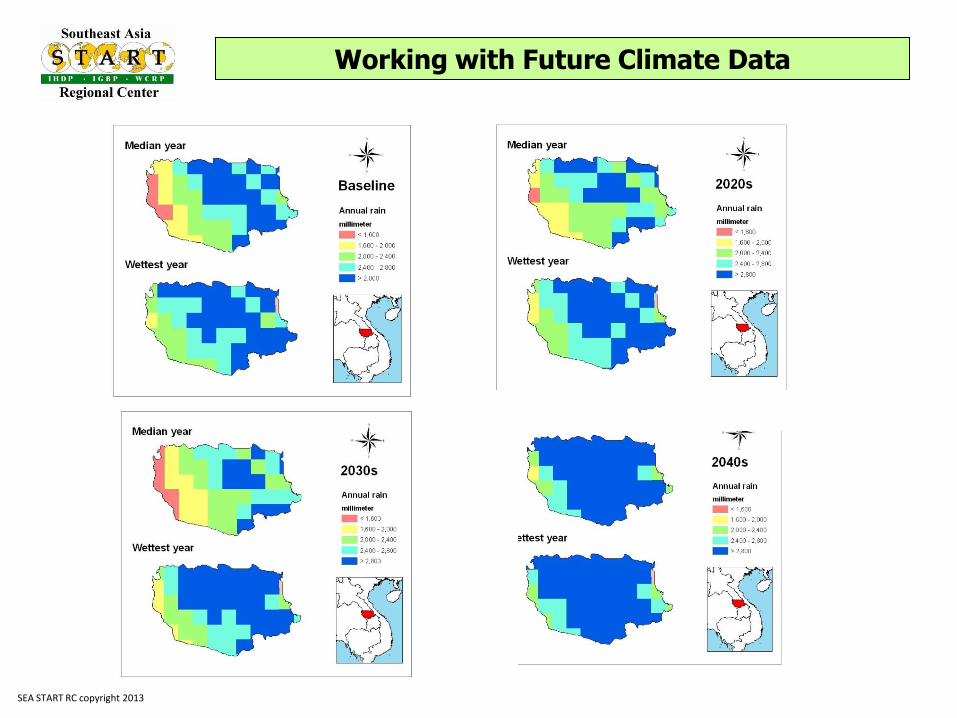
Using climate change data to analyze change in future trend
Working with Future Climate Data
SEA START RC copyright 2013
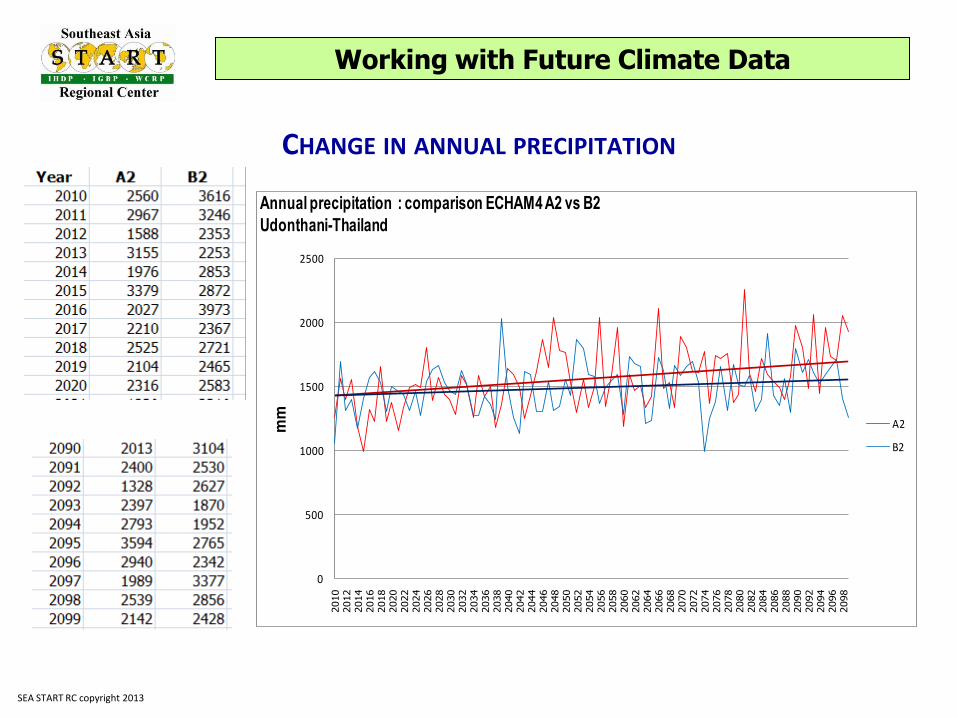
CHANGE IN ANNUAL PRECIPITATION
0
500
1000
1500
2000
2500
mm
Annual precipitation : comparison ECHAM4 A2 vs B2
Udonthani-Thailand
A2
B2
Working with Future Climate Data
SEA START RC copyright 2013
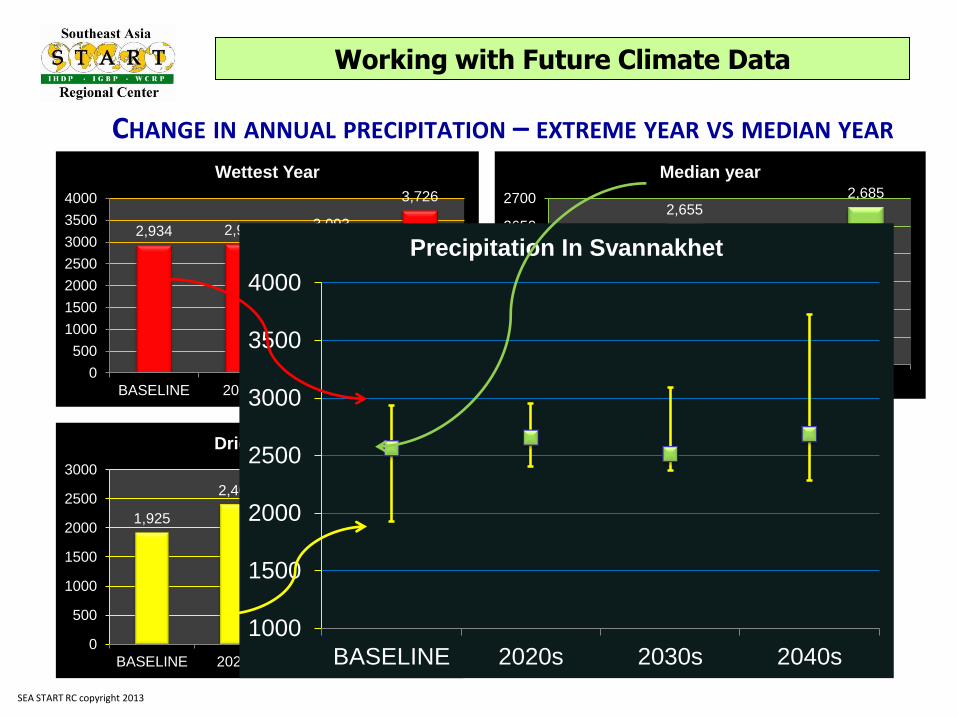
2,934 2,956 3,093
3,726
0
500
1000
1500
2000
2500
3000
3500
4000
BASELINE 2020s 2030s 2040s
Wettest Year
2,562
2,655
2,512
2,685
2400
2450
2500
2550
2600
2650
2700
BASELINE 2020s 2030s 2040s
Median year
1,925
2,407 2,373 2,282
0
500
1000
1500
2000
2500
3000
BASELINE 2020s 2030s 2040s
Driest year
1000
1500
2000
2500
3000
3500
4000
BASELINE 2020s 2030s 2040s
Precipitation In Svannakhet
CHANGE IN ANNUAL PRECIPITATION – EXTREME YEAR VS MEDIAN YEAR
Working with Future Climate Data
SEA START RC copyright 2013
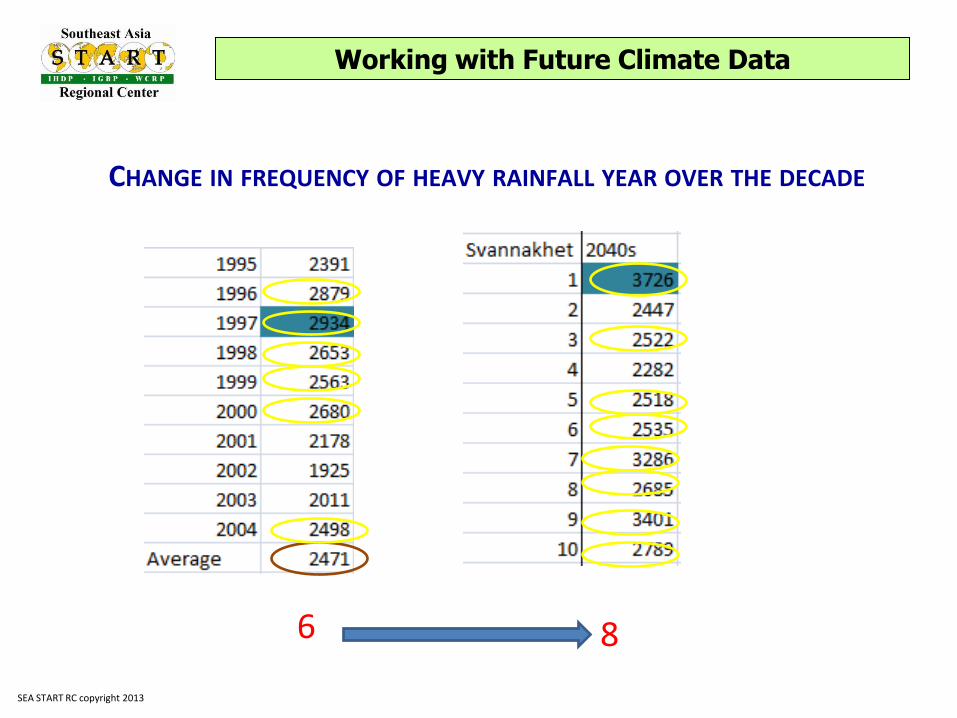
CHANGE IN FREQUENCY OF HEAVY RAINFALL YEAR OVER THE DECADE
6 8
Working with Future Climate Data
SEA START RC copyright 2013

0
100
200
300
400
500
1 3 5 7 9 11
mm
Precipitation
Baseline Median
Shift of rainy season
SHIFT AND CHANGE IN RAINFALL DISTRIBUTION PATTERN/RAINY SEASON
0
20
40
60
80
100
120
140
160
180
200
1 2 3 4 5 6 7 8 9 10 11 12
Baseline
Future
Working with Future Climate Data
SEA START RC copyright 2013

91 94
108112
0
20
40
60
80
100
120
Baseline 2020s 2030s 2040s
Number of hot day (>35°C)
22
15 15
13
0
5
10
15
20
25
Baseline 2020s 2030s 2040s
Number of cool day (<16 °C)
CHANGE IN LENGTH OF SUMMER /WINTER - SAVANNAKHET
Working with Future Climate Data
SEA START RC copyright 2013
0
10
20
30
40
50
60
70
80
1 2 3 4 5 6 7 8 9 10 11 12 13 14 15 16 17 18 19 20 21 22 23 24 25 26 27 28 29 30 31 32 33 34 35 36 37 38 39 40 41 42 43 44 45 46 47 48 49 50
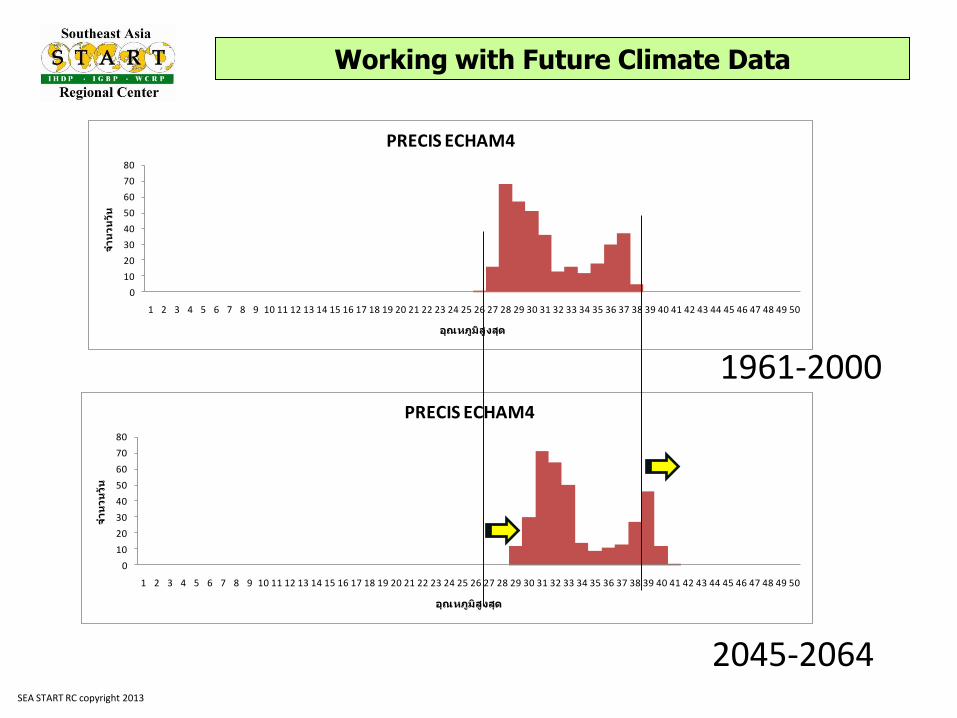
PRECIS ECHAM4
0
10
20
30
40
50
60
70
80
1 2 3 4 5 6 7 8 9 10 11 12 13 14 15 16 17 18 19 20 21 22 23 24 25 26 27 28 29 30 31 32 33 34 35 36 37 38 39 40 41 42 43 44 45 46 47 48 49 50
PRECIS ECHAM4
2045-2064
1961-2000
Working with Future Climate Data
SEA START RC copyright 2013
Using climate change data to analyze impact and risk
Working with Future Climate Data
SEA START RC copyright 2013
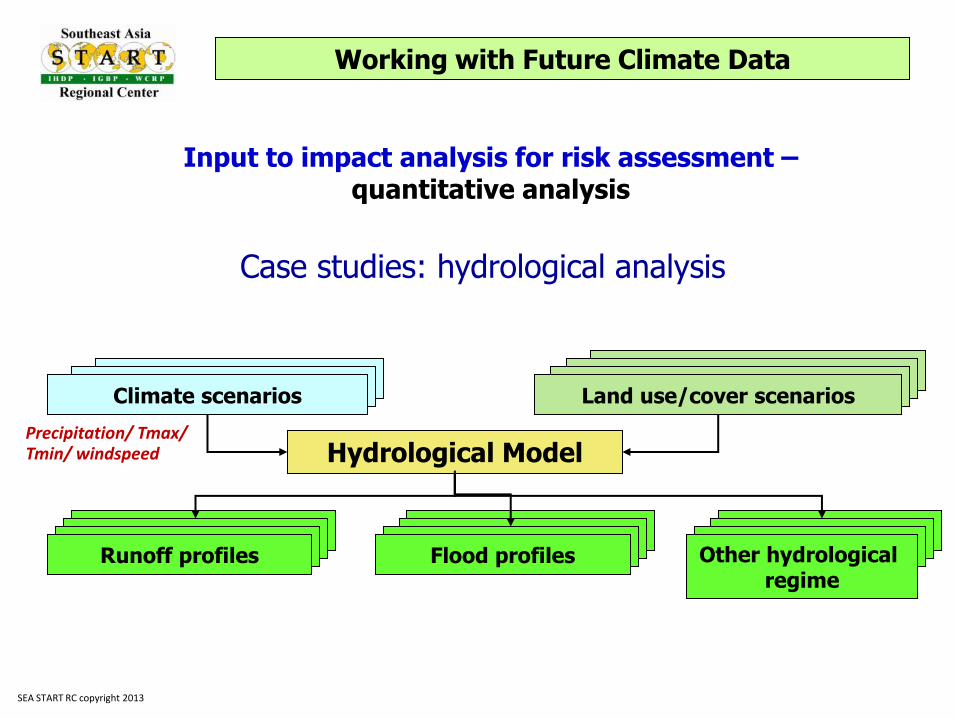
Climate scenarios Land use/cover scenarios
Flood profiles Other hydrological regime
Hydrological Model Precipitation/ Tmax/ Tmin/ windspeed
Runoff profiles
Case studies: hydrological analysis
Input to impact analysis for risk assessment – quantitative analysis
Working with Future Climate Data
SEA START RC copyright 2013
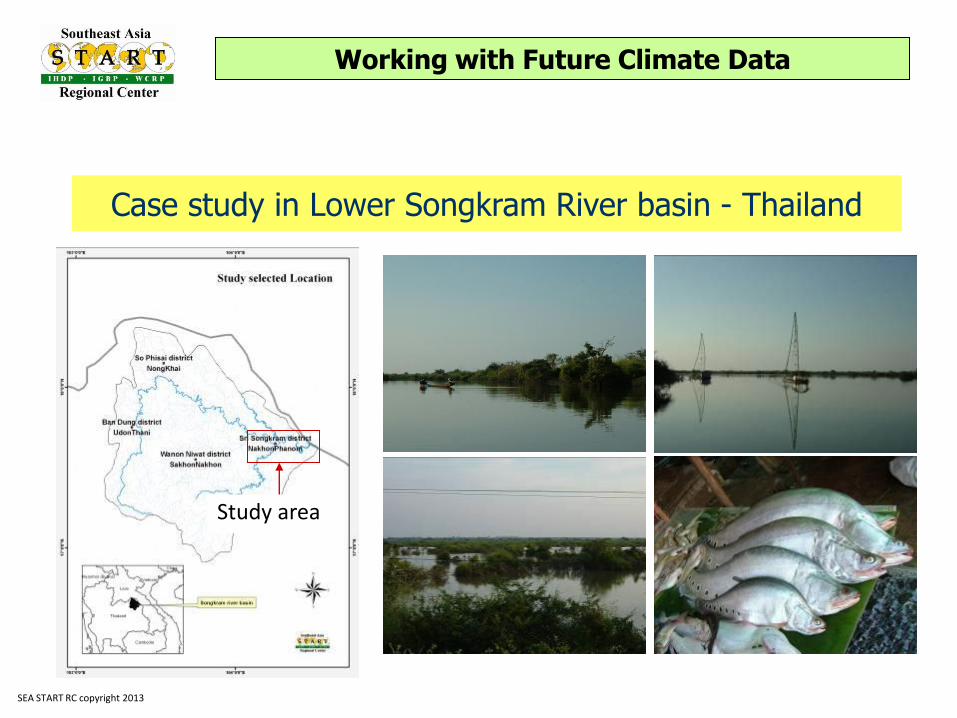
Case study in Lower Songkram River basin - Thailand
Study area
Working with Future Climate Data
SEA START RC copyright 2013

Change in flood boundary in lower Songkram River basin
Source: WUP-Fin Group, MRCS Future
Now
SEA START RC copyright 2011
Working with Future Climate Data
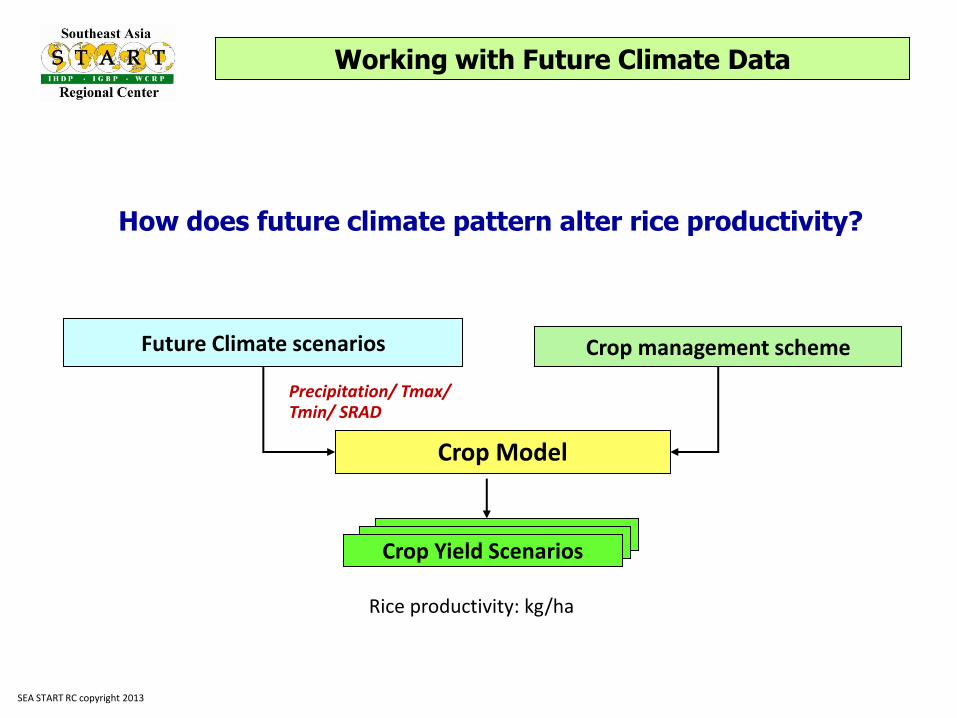
Future Climate scenarios Crop management scheme
Crop Yield Scenarios
Crop Model
How does future climate pattern alter rice productivity?
Precipitation/ Tmax/ Tmin/ SRAD
Rice productivity: kg/ha
Working with Future Climate Data
SEA START RC copyright 2013
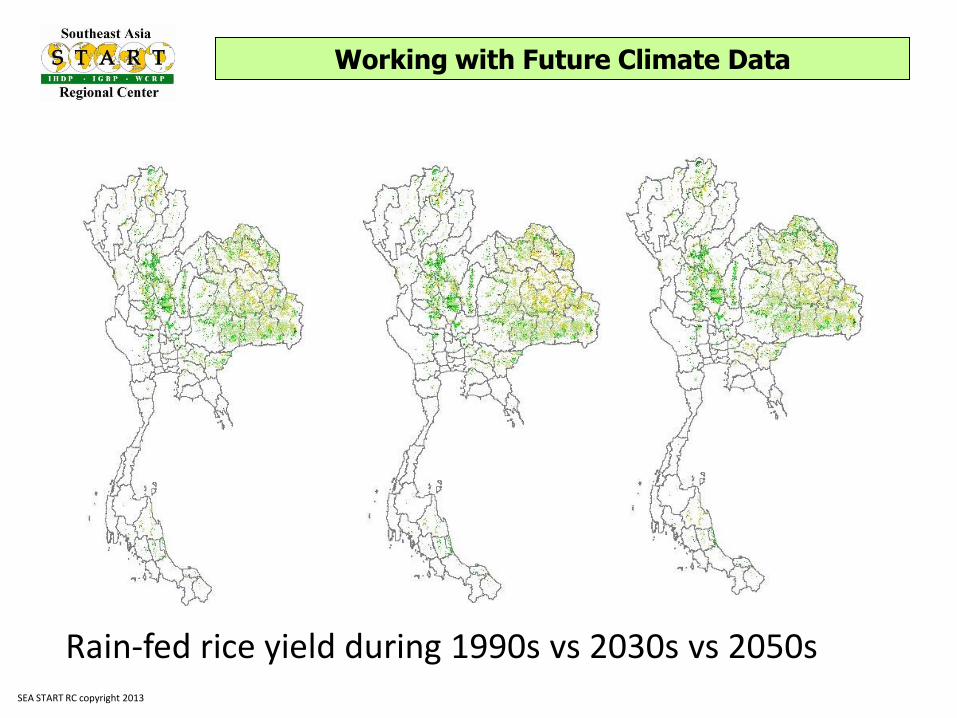
Rain-fed rice yield during 1990s vs 2030s vs 2050s
Working with Future Climate Data
SEA START RC copyright 2013
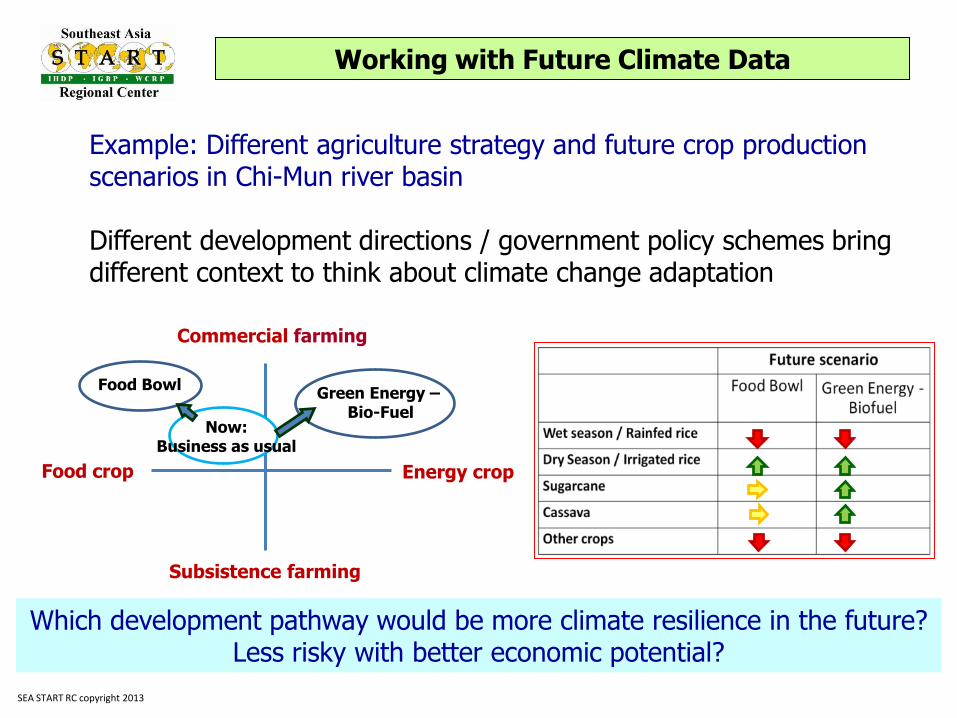
Commercial farming
Subsistence farming
Food crop Energy crop
Now: Business as usual
Food Bowl Green Energy –
Bio-Fuel
Example: Different agriculture strategy and future crop production scenarios in Chi-Mun river basin
Different development directions / government policy schemes bring
different context to think about climate change adaptation
SEA START RC copyright 2013
Working with Future Climate Data
Which development pathway would be more climate resilience in the future? Less risky with better economic potential?
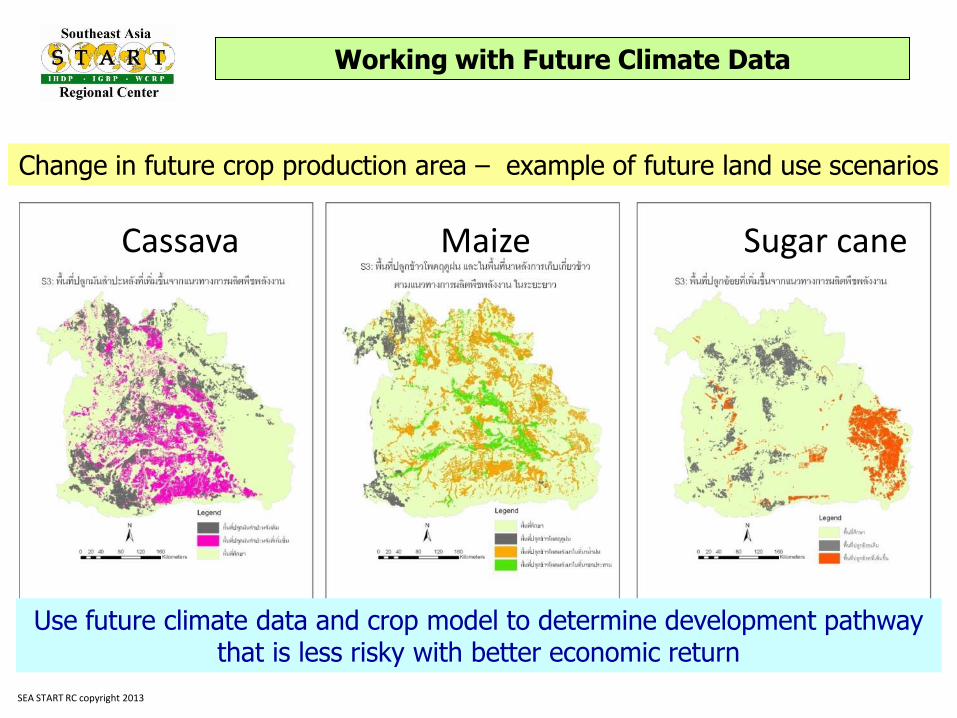
Change in future crop production area – example of future land use scenarios
Cassava Maize Sugar cane
SEA START RC copyright 2013
Working with Future Climate Data
Use future climate data and crop model to determine development pathway that is less risky with better economic return
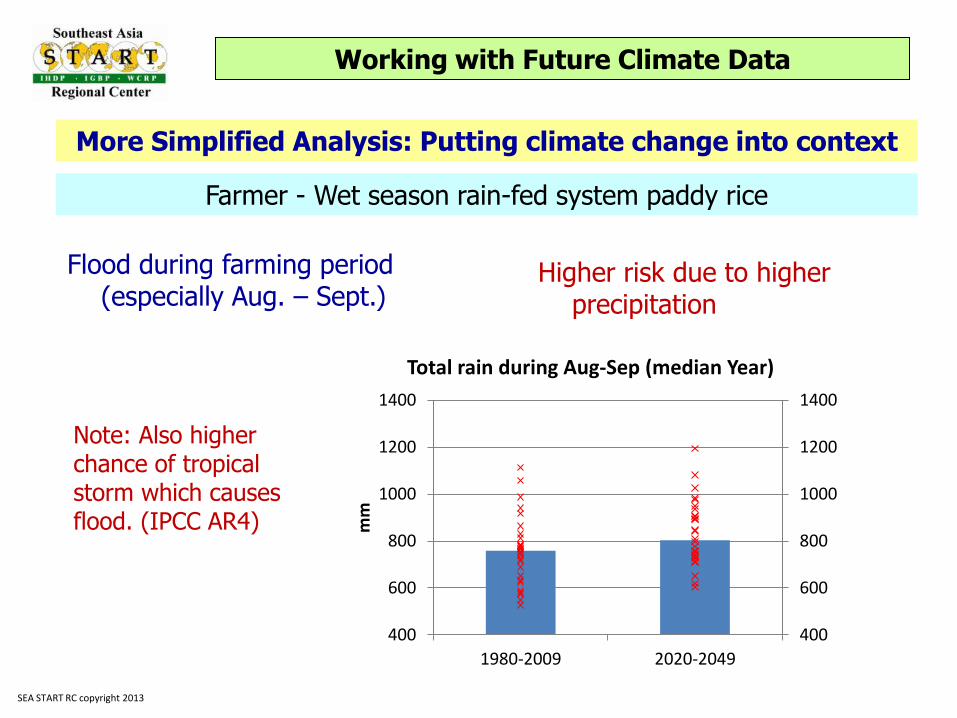
Flood during farming period (especially Aug. – Sept.)
More Simplified Analysis: Putting climate change into context
Higher risk due to higher precipitation
400
600
800
1000
1200
1400
400
600
800
1000
1200
1400
1980-2009 2020-2049
mm
Total rain during Aug-Sep (median Year)
Note: Also higher chance of tropical storm which causes flood. (IPCC AR4)
Working with Future Climate Data
SEA START RC copyright 2013
Farmer - Wet season rain-fed system paddy rice
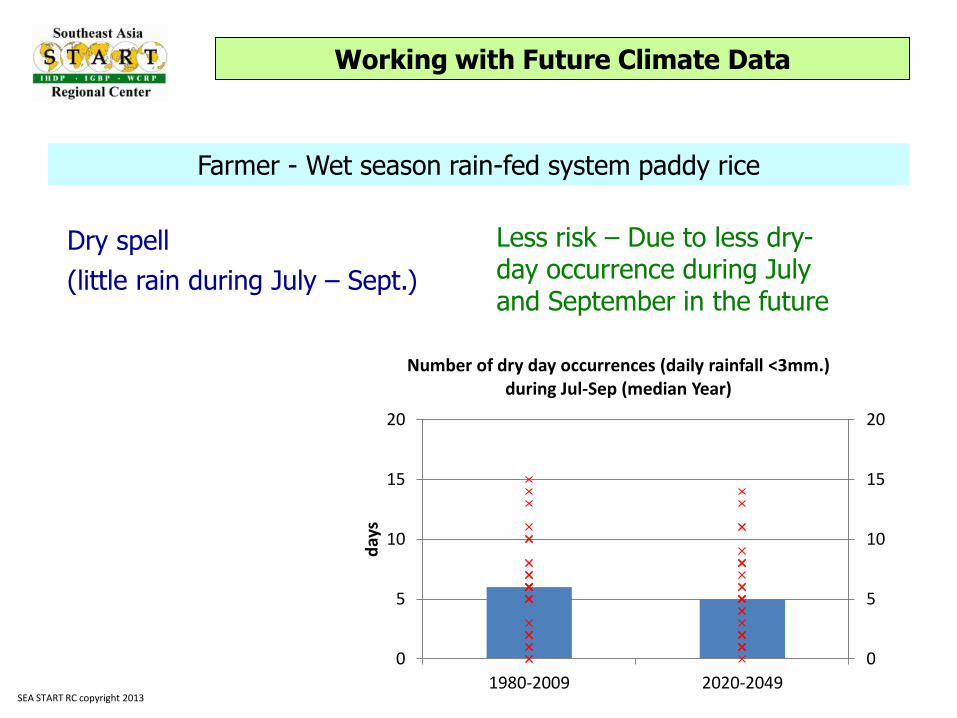
Dry spell
(little rain during July – Sept.)
Farmer - Wet season rain-fed system paddy rice
Less risk – Due to less dry-day occurrence during July and September in the future
0
5
10
15
20
0
5
10
15
20
1980-2009 2020-2049
day
s Number of dry day occurrences (daily rainfall <3mm.)
during Jul-Sep (median Year)
Working with Future Climate Data
SEA START RC copyright 2013
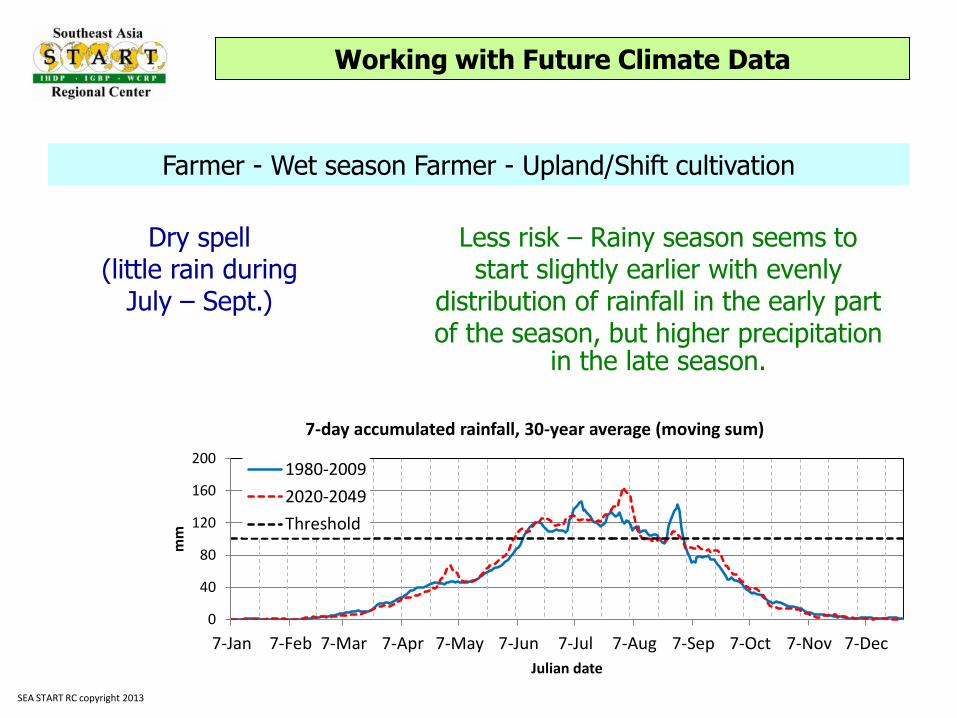
Farmer - Wet season Farmer - Upland/Shift cultivation
Less risk – Rainy season seems to start slightly earlier with evenly
distribution of rainfall in the early part of the season, but higher precipitation
in the late season.
0
40
80
120
160
200
7-Jan 7-Feb 7-Mar 7-Apr 7-May 7-Jun 7-Jul 7-Aug 7-Sep 7-Oct 7-Nov 7-Dec
mm
Julian date
7-day accumulated rainfall, 30-year average (moving sum)
1980-2009
2020-2049
Threshold
Dry spell (little rain during
July – Sept.)
Working with Future Climate Data
SEA START RC copyright 2013
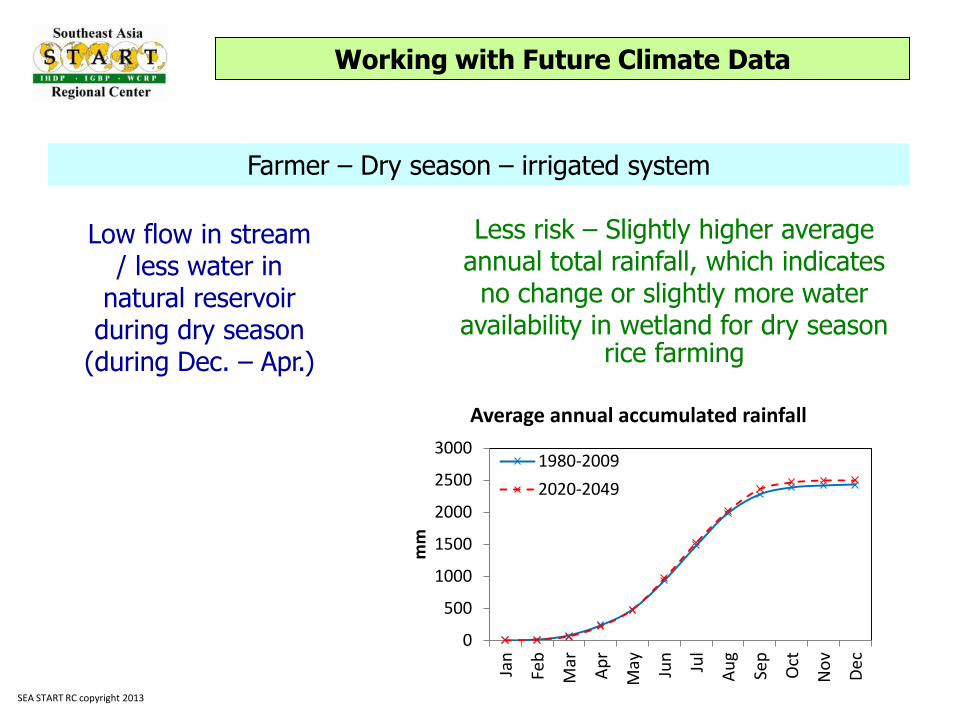
Farmer – Dry season – irrigated system
Less risk – Slightly higher average annual total rainfall, which indicates
no change or slightly more water availability in wetland for dry season
rice farming
Low flow in stream / less water in
natural reservoir during dry season
(during Dec. – Apr.)
0
500
1000
1500
2000
2500
3000
Jan
Feb
Mar
Ap
r
May Jun
Jul
Au
g
Sep
Oct
No
v
Dec
mm
Average annual accumulated rainfall
1980-2009
2020-2049
Working with Future Climate Data
SEA START RC copyright 2013
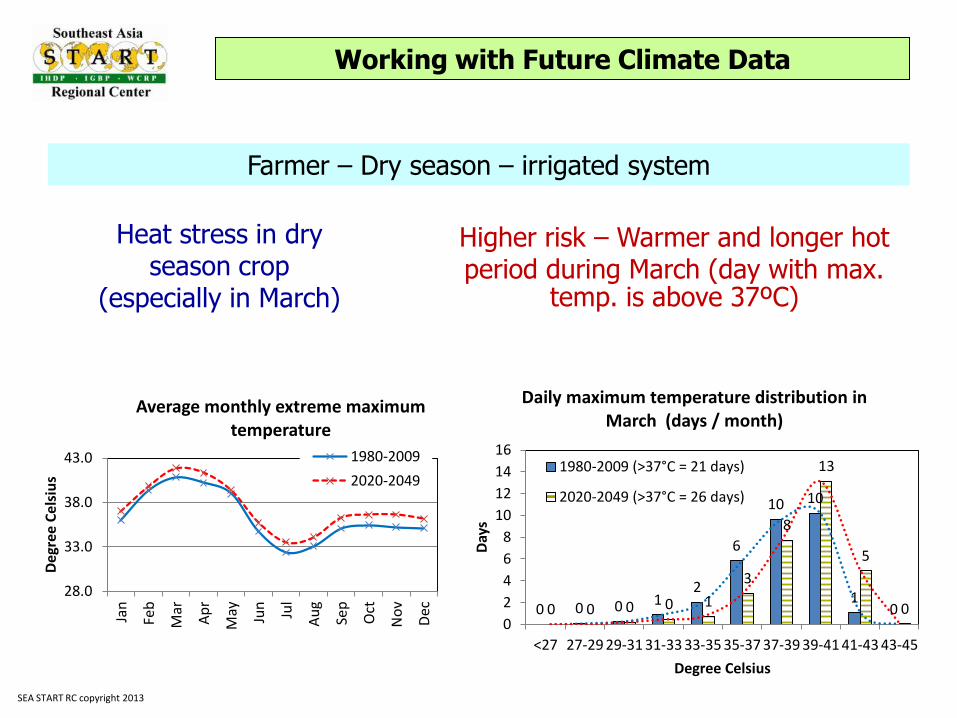
Farmer – Dry season – irrigated system
Higher risk – Warmer and longer hot period during March (day with max.
temp. is above 37ºC)
Heat stress in dry season crop
(especially in March)
28.0
33.0
38.0
43.0
Jan
Feb
Mar
Ap
r
May Jun
Jul
Au
g
Sep
Oct
No
v
Dec
De
gree
Ce
lsiu
s
Average monthly extreme maximum temperature
1980-2009
2020-2049
0 0 0 1 2
6
10 10
1 0 0 0 0 0 1
3
8
13
5
0 0
2
4
6
8
10
12
14
16
<27 27-29 29-31 31-33 33-35 35-37 37-39 39-41 41-43 43-45
Day
s
Degree Celsius
Daily maximum temperature distribution in March (days / month)
1980-2009 (>37°C = 21 days)
2020-2049 (>37°C = 26 days)
Working with Future Climate Data
SEA START RC copyright 2013

Using Future Climate Data to Support Development Planning
IPCC Fourth Assessment Report
SEA START RC copyright 2013

• Key sectors are under climate stress
• Future climate risk may not be the same as it has been due to climate change caused by global warming
• Development plan may not yield desirable outcome as planned
• How should development plan address this issue?
Climate change and challenges in developing country
Clear needs to extend vision of development planning into far future,
which requires different frame of thought
Source: Handoko Tjung, Indonesia
Using Future Climate Data to Support Development Planning
SEA START RC copyright 2013
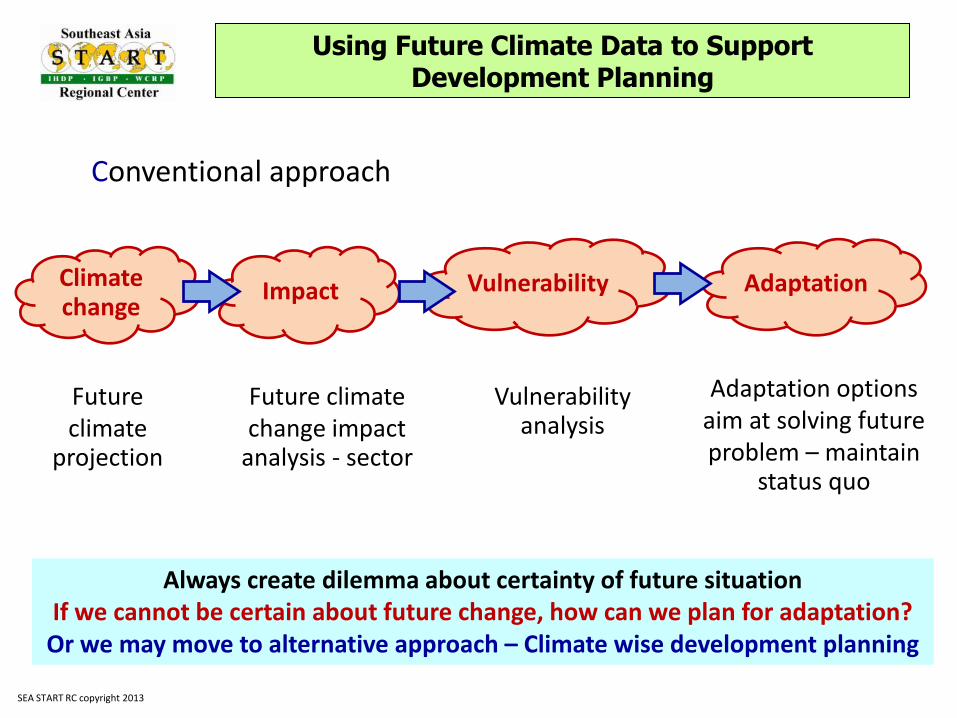
Vulnerability Adaptation Impact
Conventional approach
Future climate
projection
Future climate change impact
analysis - sector
Vulnerability analysis
Adaptation options aim at solving future problem – maintain
status quo
Climate change
Always create dilemma about certainty of future situation If we cannot be certain about future change, how can we plan for adaptation?
Or we may move to alternative approach – Climate wise development planning
Using Future Climate Data to Support Development Planning
SEA START RC copyright 2013
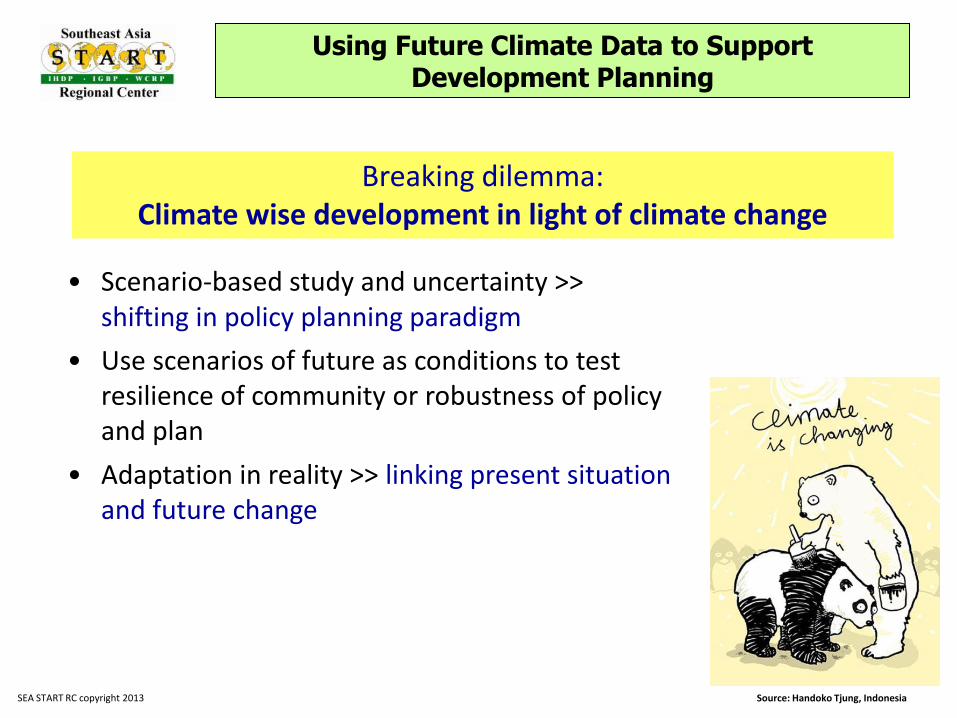
Breaking dilemma: Climate wise development in light of climate change
• Scenario-based study and uncertainty >> shifting in policy planning paradigm
• Use scenarios of future as conditions to test resilience of community or robustness of policy and plan
• Adaptation in reality >> linking present situation and future change
Source: Handoko Tjung, Indonesia
Using Future Climate Data to Support Development Planning
SEA START RC copyright 2013
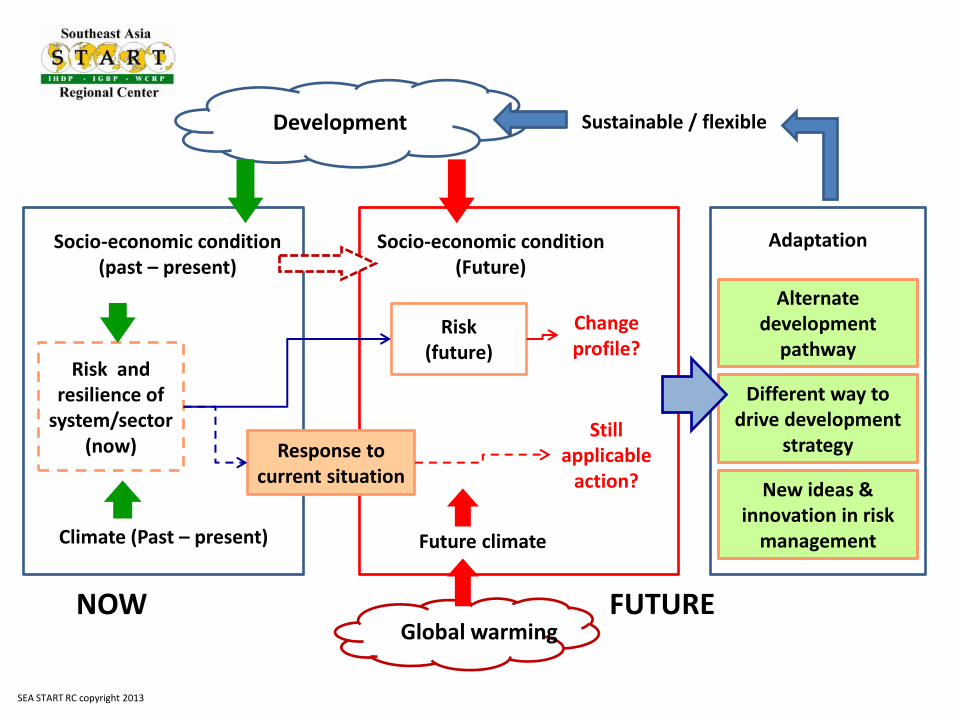
Risk and resilience of
system/sector (now)
Change profile?
Socio-economic condition (past – present)
Climate (Past – present)
New ideas & innovation in risk
management Future climate
Risk (future)
Socio-economic condition (Future)
Sustainable / flexible Development
Global warming NOW FUTURE
Response to current situation
Still applicable
action?
Alternate development
pathway
Different way to drive development
strategy
Adaptation
SEA START RC copyright 2013
Example 1: Alter livelihood strategy in light of climate change
• Case study of the upland farmer, Champone, Champasak, Lao PDR
• Changing government policy putting community exposed to greater climate risk and risk profile will also change under future climate change
Using Future Climate Data to Support Development Planning
SEA START RC copyright 2013
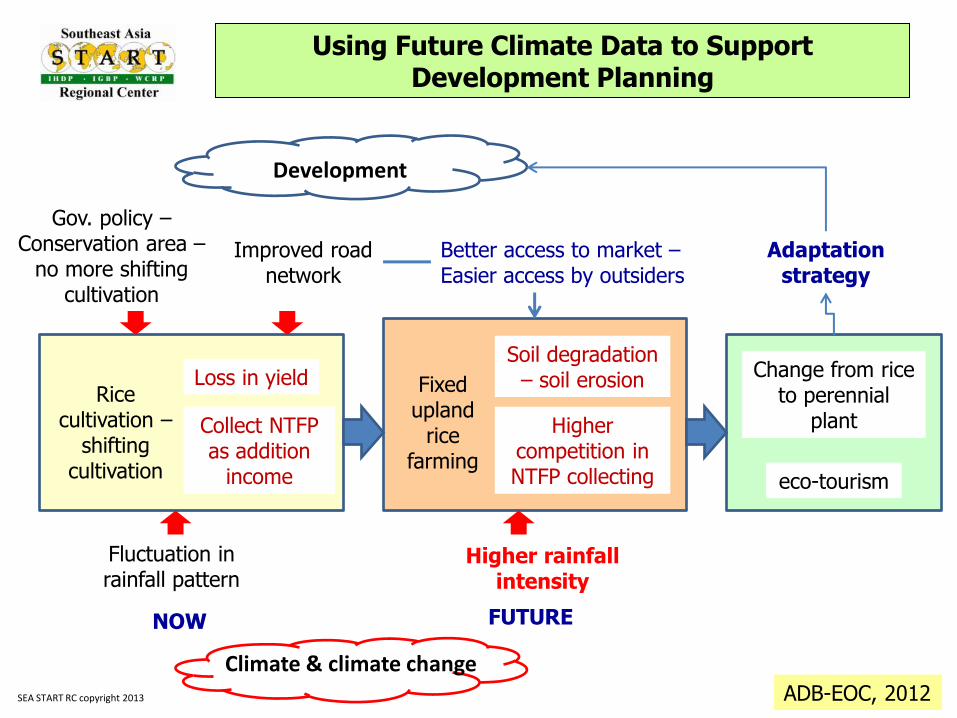
Rice cultivation –
shifting cultivation
Loss in yield
Collect NTFP as addition
income
Fixed upland
rice farming
Soil degradation – soil erosion
Higher competition in NTFP collecting
Change from rice to perennial
plant
eco-tourism
Gov. policy – Conservation area –
no more shifting cultivation
Improved road network
Fluctuation in rainfall pattern
Higher rainfall intensity
NOW FUTURE
Adaptation strategy
ADB-EOC, 2012
Better access to market – Easier access by outsiders
Using Future Climate Data to Support Development Planning
Development
Climate & climate change SEA START RC copyright 2013
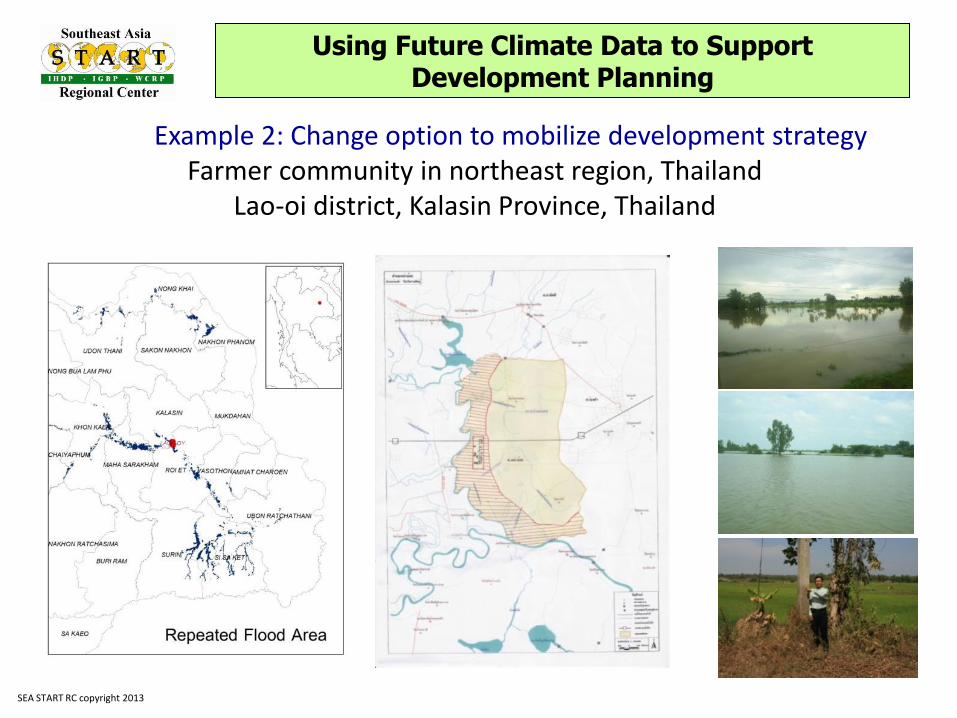
Example 2: Change option to mobilize development strategy Farmer community in northeast region, Thailand
Lao-oi district, Kalasin Province, Thailand
Using Future Climate Data to Support Development Planning
SEA START RC copyright 2013
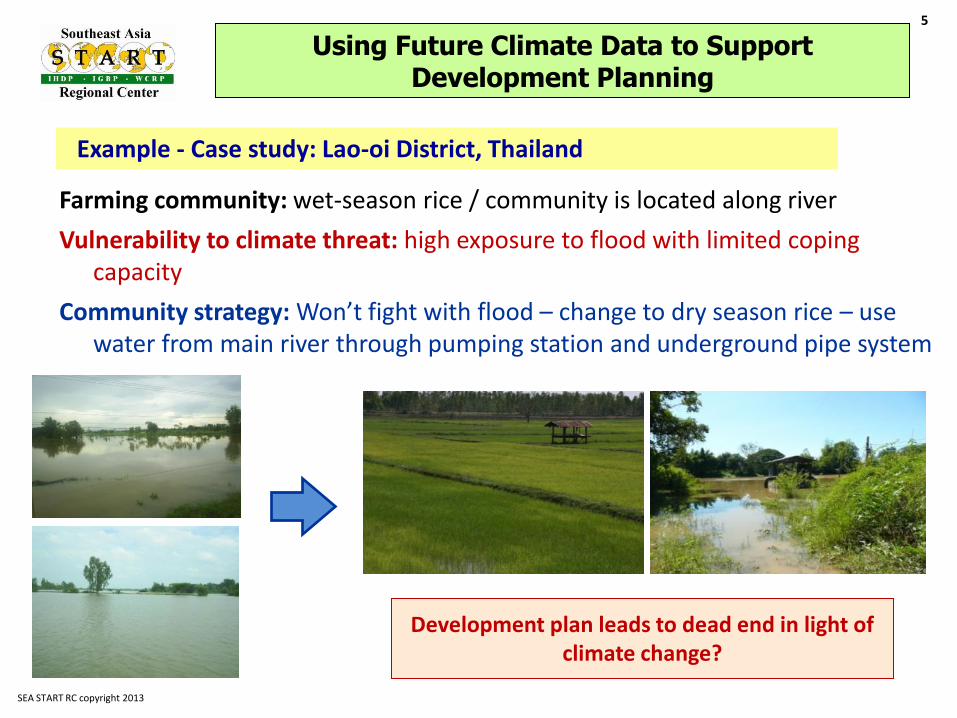
Farming community: wet-season rice / community is located along river
Vulnerability to climate threat: high exposure to flood with limited coping capacity
Community strategy: Won’t fight with flood – change to dry season rice – use water from main river through pumping station and underground pipe system
Development plan leads to dead end in light of climate change?
Example - Case study: Lao-oi District, Thailand
5
Using Future Climate Data to Support Development Planning
SEA START RC copyright 2013

Climate change trend: higher rainfall in rainy season – longer and warmer summer
Example - Case study: Lao-oi District, Thailand
Source: IPCC AR4
Source: SEA START RC
Using Future Climate Data to Support Development Planning
SEA START RC copyright 2013

Example - Case study: Lao-oi District, Thailand
Using Future Climate Data to Support Development Planning
SEA START RC copyright 2013
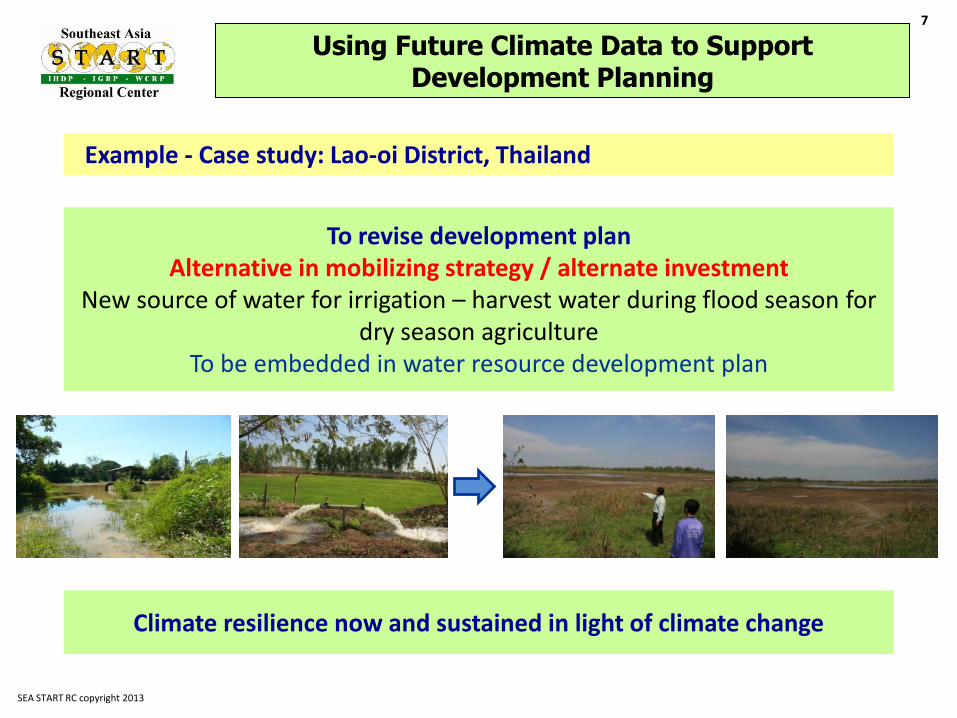
To revise development plan Alternative in mobilizing strategy / alternate investment
New source of water for irrigation – harvest water during flood season for dry season agriculture
To be embedded in water resource development plan
Example - Case study: Lao-oi District, Thailand
Climate resilience now and sustained in light of climate change
7
Using Future Climate Data to Support Development Planning
SEA START RC copyright 2013
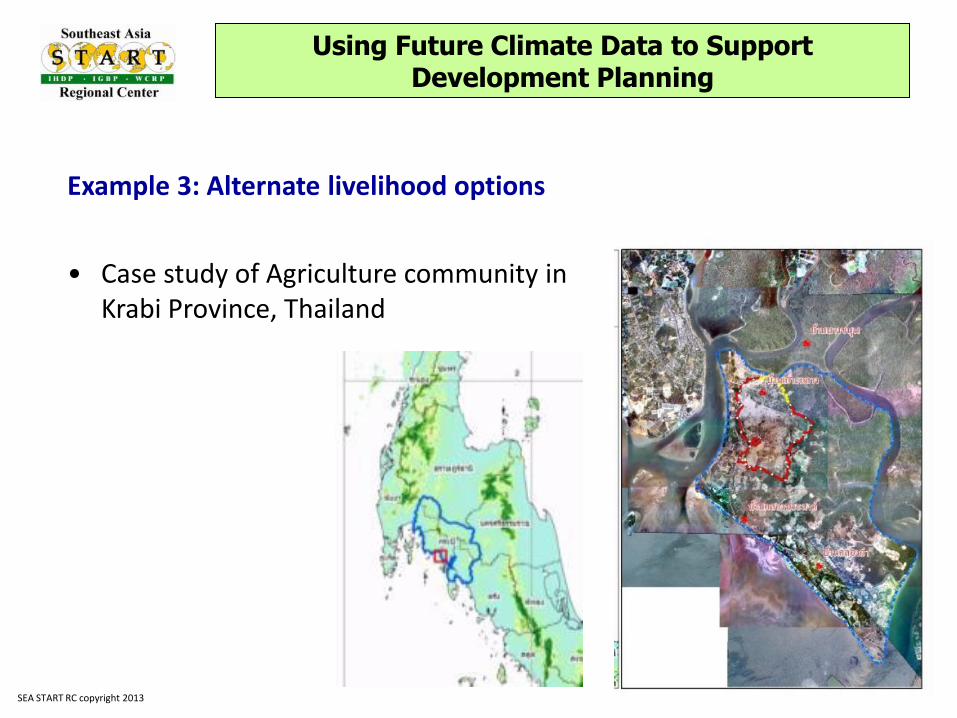
Example 3: Alternate livelihood options
• Case study of Agriculture community in Krabi Province, Thailand
Using Future Climate Data to Support Development Planning
SEA START RC copyright 2013

Rice farming under climate threat from strong wind and storm surge causing saltwater intrusion into rice paddy
Using Future Climate Data to Support Development Planning
SEA START RC copyright 2013

Change in wind speed and increasing sea level
Using Future Climate Data to Support Development Planning
SEA START RC copyright 2013
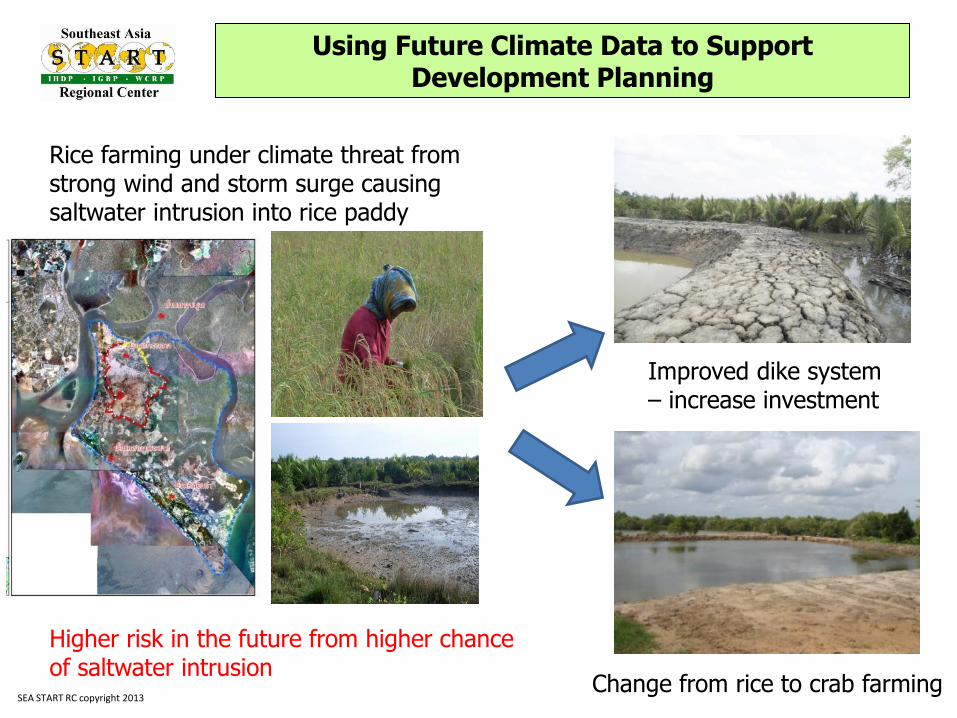
Improved dike system – increase investment
Change from rice to crab farming
Higher risk in the future from higher chance of saltwater intrusion
Using Future Climate Data to Support Development Planning
SEA START RC copyright 2013
Rice farming under climate threat from strong wind and storm surge causing saltwater intrusion into rice paddy
Example 4: Town planning strategy in light of climate change
• Case study of the Town of Pun-pin, Suratthani Province, Thailand
Using Future Climate Data to Support Development Planning
SEA START RC copyright 2013
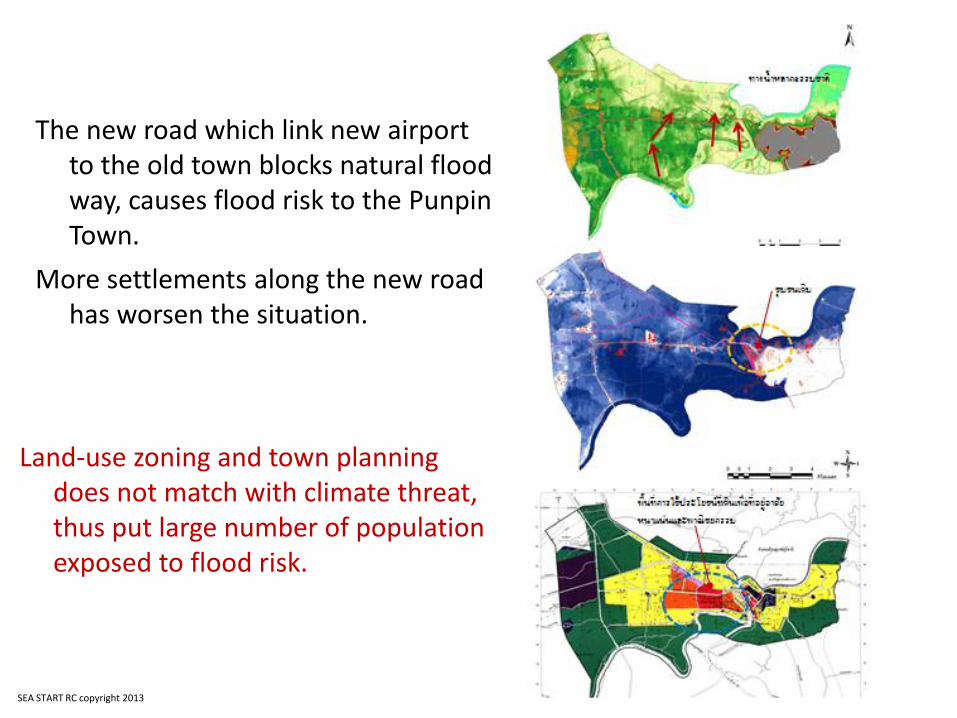
Land-use zoning and town planning does not match with climate threat, thus put large number of population exposed to flood risk.
The new road which link new airport to the old town blocks natural flood way, causes flood risk to the Punpin Town.
More settlements along the new road has worsen the situation.
SEA START RC copyright 2013

Change in 1/20 year heavy rain event & change in rainfall amount of 1/20 year heavy rain event:
Shorter return period and higher rainfall in heavy rain event (5 & 7 days accumulate rainfall)
14
17
20
20
0 20 40 60 80 100
ฝนรวม 7 วัน
ฝนรวม 5 วัน
รอบปีเกิดซ ้ำ
การเปลี่ยนแปลงรอบปีการเกิดซ ้าของฝนที่มีโอกาสเกิดหนึ่งครั งในรอบ 20 ปีในปัจจุบัน
รอบปีเกิดซ ้ำในช่วง 1990-2009 รอบปีเกิดซ ้ำในช่วง 2030-2049
633
693 662
756
500
600
700
800
900
1000
1100
ฝนรวม 5 วัน ฝนรวม 7 วัน
มม.
การเปลี่ยนแปลงปริมาณฝนรวมที่มีโอกาสเกิดหนึ่งครั งในรอบ 20 ปีในอนาคต
รอบปีเกิดซ ้ำในช่วง 1990-2009 รอบปีเกิดซ ้ำในช่วง 2030-2049
SEA START RC copyright 2013
Using Future Climate Data to Support Development Planning

Dual town centers – development strategy for Punpin Town
In order to cope with more serious flood in the future, dual town center concept and new land use plan are proposed for development plan.
Using Future Climate Data to Support Development Planning
Climate change is NOT environmental issue to be handled by environmental agencies
Broaden climate change adaptation context – development planning in light of climate change / different risk management in future
Planning in the unfamiliar timeframe
Scenario thinking – move away from “predict-then-act” approach
Different scale of adaptation – different context and approach
Sectoral assessment VS Area-based holistic development strategy VS community scale adaptation
SEA START RC copyright 2013
Using Future Climate Data to Support Development Planning

THANK YOU
Source: Handoko Tjung, Indonesia