climate change future 2016
TRANSCRIPT

© Project SOUND
Climate Change & the Future of Local Preserves
and Gardens
Constance M. Vadheim - CSUDH (emeritus)
Friends of Madrona Marsh Annual Meeting - 2016Madrona Marsh Preserve
January 31, 2016

15 of the past 16 years have been the warmest on record – that’s a trend we can’t deny!
© Project SOUNDData: NASA GISS. Maps and graph: Makiko Sato, Columbia University
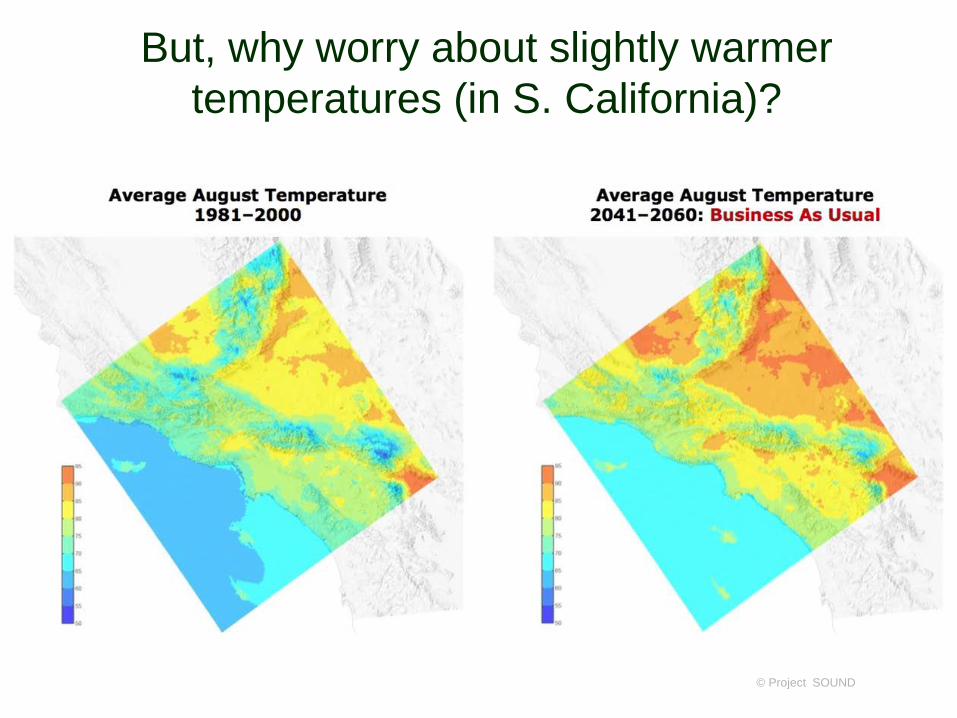
But, why worry about slightly warmer temperatures (in S. California)?
© Project SOUND

© Project SOUND
What, specifically, does climate change mean for the South Bay & for S. California?

© Project SOUND
First, let’s consider what we know about our changing climate

A few definitions Weather is the mix of events
that happen each day in our atmosphere, including temperature, rainfall and humidity. Meteorologists record and predict weather events daily.
Climate is the average weather pattern in a place over many years. Climate controls the weather.
Climate modeling is the use of sophisticated computer-based models of the climate system to understand and predict its behavior.
© Project SOUND

Predicting future climate: always difficult
Problems of scale: Dealing with large scale/global
causes & effects Small scale – what individuals/
states, etc. are interested in
Many factors (and their interactions) are important
Some factors are unpredictable (volcanic eruptions)
No long-term data on many of these factors
We’ve never experienced changes anything like this
© Project SOUND

Atmosphere/ocean/sea-ice general circulationmodels (AOGCMs)
Three-dimensional models of the global atmosphere used in climate modeling
Couple atmospheric GCMs (AGCMs), oceanic GCMs (OGCMs) and increasingly additional data.
Based on laws of physics
Complex – require big computers & lots of time to run the simulations
Results are ‘checked/verified’ by comparing to past/present
Used to predict the effects of climate change
© Project SOUND
http://en.wikipedia.org/wiki/General_Circulation_Model
Global atmospheric modeling began in the mid-1950’s

Factors that go into currant AOGCM models
The hydrosphere: the oceans and other bodies of water
The cryosphere: including sea ice, glaciers and ice sheets
The atmosphere: composition and behavior
The biosphere: the amounts and types of animals and plants
The geosphere: tectonic variations such as volcanic eruptions and moving continents
© Project SOUNDhttp://scienceandtheworld.com/2013/04/29/wading-into-the-fire-episode-6-climate-modelling-is-a-tough-gig/

Hadley Model - average maximum temps
© Project SOUND
http://eos-earthdata.sr.unh.edu/thumbnail_pages/tairmaxtc-h2.jsp

Hadley Model - average minimum temps
© Project SOUNDhttp://eos-earthdata.sr.unh.edu/thumbnail_pages/tairmintc-h2.jsp

Predicting future climate on a smaller, local scale is much more difficult
© Project SOUND

Most planners currently use data from several models (and several scenarios) to predict
When models concur, the result is more likely to be correct
Can compare models and try to understand the reason for the differences – increases our understanding of the processes
Allows to ‘bracket’ what the likely effects will be
© Project SOUND
http://appinsys.com/globalwarming/GW_TemperatureProjections.htm

Cal-Adapt: California’s climate change data/
mapping source
Developed by UC Berkeley's Geospatial Innovation Facility
Data have been gathered from California’s scientific community, and represent the most current data available wherever possible.
Provides data and maps to planners, researchers and the public – Climate Tools are easy to use.
© Project SOUND
http://cal-adapt.org/blog/2011/apr/13/global-climate-models/
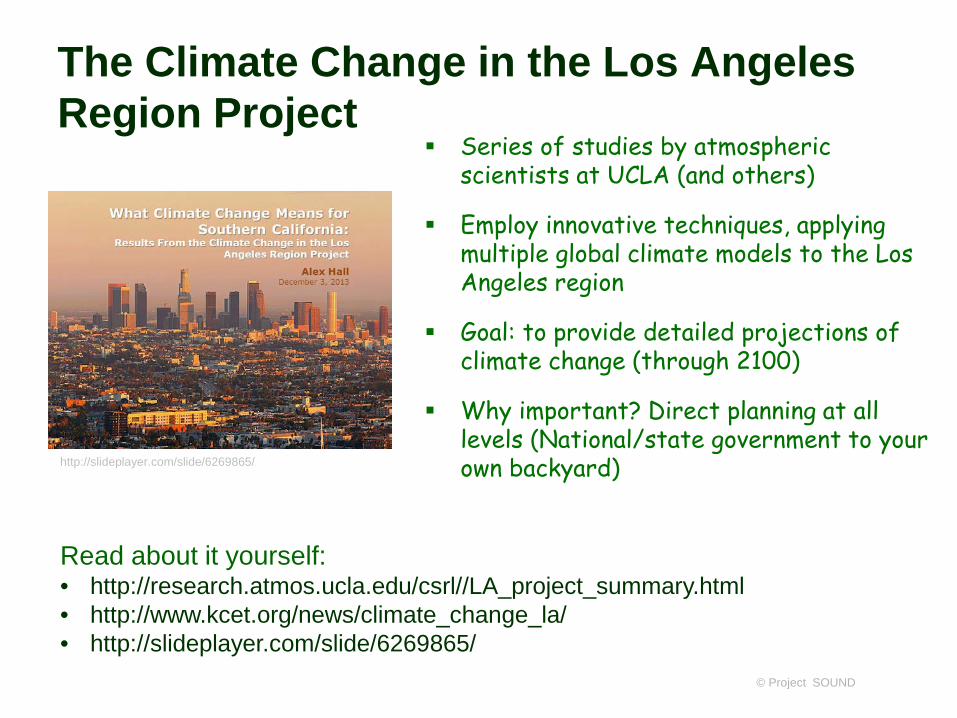
The Climate Change in the Los Angeles Region Project
Series of studies by atmospheric scientists at UCLA (and others)
Employ innovative techniques, applying multiple global climate models to the Los Angeles region
Goal: to provide detailed projections of climate change (through 2100)
Why important? Direct planning at all levels (National/state government to your own backyard)
© Project SOUND
Read about it yourself: • http://research.atmos.ucla.edu/csrl//LA_project_summary.html • http://www.kcet.org/news/climate_change_la/• http://slideplayer.com/slide/6269865/
http://slideplayer.com/slide/6269865/

First Report (2012):"Mid-Century Warming in the Los Angeles Region."
By mid-century, Los Angeles will experience temperatures similar to what we experience today about 75-80% of the time (274-292 days a year)
If we don't reduce global greenhouse gas emissions, Los Angeles will continue to get warmer. By the end of the century, temperatures will be like they are today only 50- 65% of the time (1 83- 243 days a year)
© Project SOUND
• hotter than normal temperatures will likely be experienced primarily in late summer and early fall (our typical hot, dry period).
• December to January and July to August are projected to change the most (relative to today).

© Project SOUND
Anything that affects plants will also affect the animals that depend on them
Climate change like this will affect plants in local Preserves and gardens

Thankfully, plants are pretty adaptable (they have to be to survive)
Plants usually have several back-up systems for dealing with specific environmental stresses.
Local species tend to be adaptable –we live in a fickle Mediterranean climate
Many local plant species tolerate a range of: Light conditions Yearly precipitation Soil nutrients & pH Temperatures
Each plant species is unique – some are more adaptable than others.
© Project SOUND

What difference can a few degrees change have on our local plants?
© Project SOUND

The South Bay benefits from it’s proximity to the ocean
© Project SOUNDhttp://research.atmos.ucla.edu/csrl//LA_project_summary.html
Areas that are already ‘somewhat hot’ will see many more days > 95°
Palmdale, Lancaster The San Fernando Valley Riverside
What can we expect (South Bay)?
More hot days in summer/fall
More year-to-year variability in both hot and cold temperatures
Warmer days in winter (on average)
Warmer nights in winter; fewer nights below 45° F
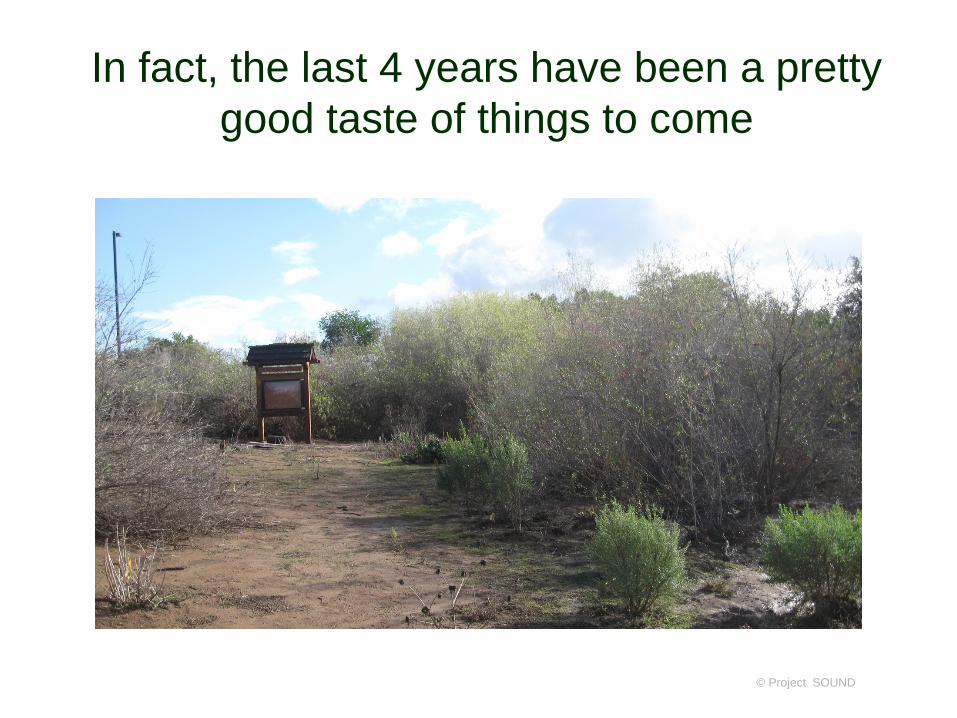
In fact, the last 4 years have been a pretty good taste of things to come
© Project SOUND

Expect temperature extremes: cold/frosts
We’ll likely have years that are colder than usual – and experience frosts
Know how to deal with frosts:
Know which plants are sensitive –often the natives that are white-colored; tropical plants
Heed the frost warnings; cover plants or be sure they are well hydrated before frost
Don’t cut back too quickly – let plants recover a few weeks
© Project SOUND
See Feb/2013 posting on the subject – Mother Nature’s Backyard Blog

In local Preserves, the effects of more high temperature days (taken alone) will probably be small
We will only have 5-20 days > 95°/year
Many native plants have adaptations that allow them to withstand some ‘high heat’
Local native plants programmed to ‘expect’ high temperatures in late summer/fall
But remember: These are averages – some years will have
many more hot days & some will be in winter Increasing temperatures lead to other
climate changes Each plant is different – some are more
heat-tolerant than others
© Project SOUND
http://www.energyatlas.ucla.edu/strategies/
World-wide, plant species tend to be affected (stressed) by temperatures > 85° F.
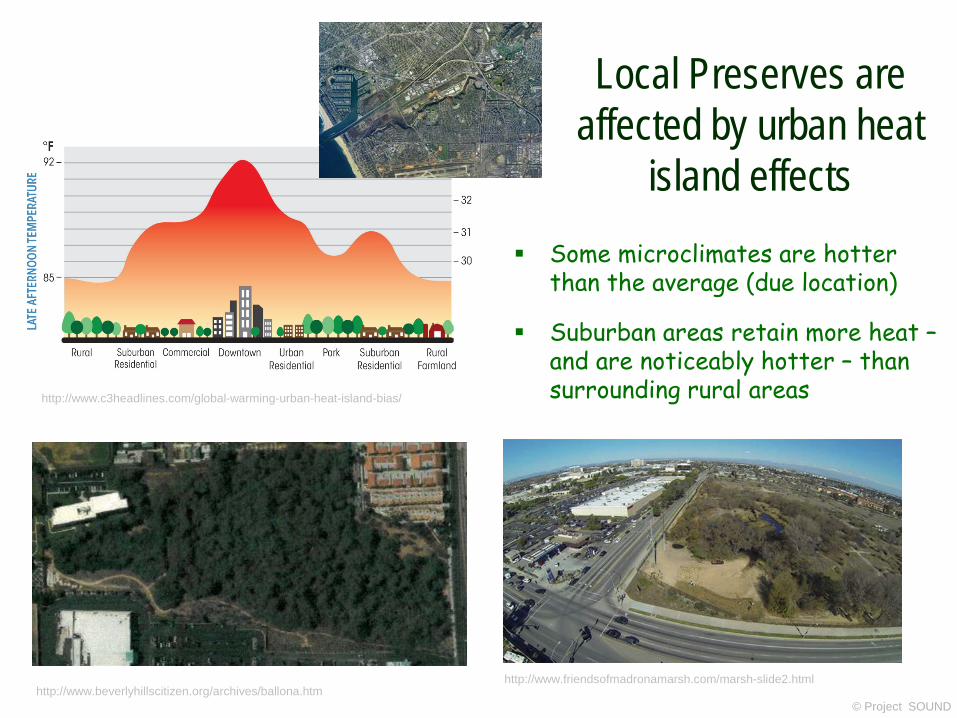
Local Preserves are affected by urban heat
island effects Some microclimates are hotter
than the average (due location)
Suburban areas retain more heat –and are noticeably hotter – than surrounding rural areas
© Project SOUND
http://www.friendsofmadronamarsh.com/marsh-slide2.htmlhttp://www.beverlyhillscitizen.org/archives/ballona.htm
http://www.c3headlines.com/global-warming-urban-heat-island-bias/

We do need to worry about the effects of more warm/hot days on local plants
All plants have optimal temperature ranges – in general, plants from hotter places have higher ranges
Temperatures higher and lower than the optima affect literally everything a plant does:
Taking up water Growing new leaves, branches Producing flowers, fruits & seeds Warding off pests & diseases Timing of life & seasonal changes Just plain staying alive!
© Project SOUND
http://www.intechopen.com/books/abiotic-stress-plant-responses-and-applications-in-agriculture/extreme-temperature-responses-oxidative-stress-and-antioxidant-defense-in-plants
temperatures just beyond the optimal range can greatly affect both survival and reproduction

Some local plants have lower optimal temperatures Lower optima: [California encelia]
Often perennial plants that grow rapidly in winter or early spring
Often flower in spring – but may in cooler fall period
May be completely/mostly dormant in summer/fall (but not always) – avoid heat and drought
Includes a number of local shrubs Give gardens/Preserves their spring
color
Higher optima: [Coast quailbush] Grow and flower in warm weather of
later spring, summer May be evergreen; shrubs w/ deep roots Includes some local plants, warm season
grasses, some desert plants© Project SOUND
Calif. encelia
Coast quailbush
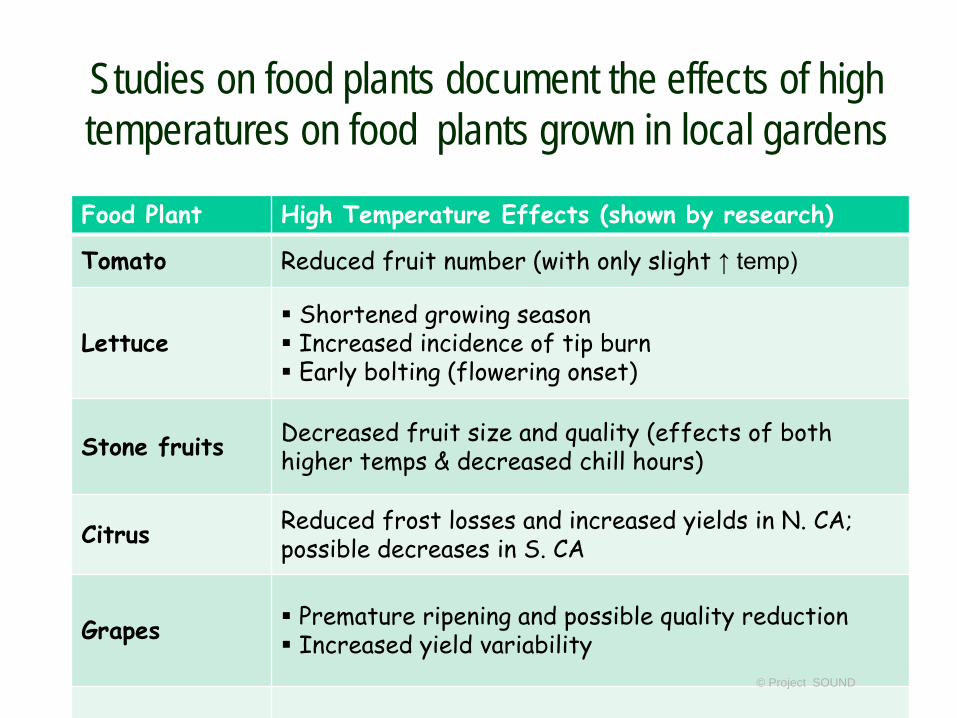
Studies on food plants document the effects of high temperatures on food plants grown in local gardens
Food Plant High Temperature Effects (shown by research)
Tomato Reduced fruit number (with only slight ↑ temp)
Lettuce Shortened growing season Increased incidence of tip burn Early bolting (flowering onset)
Stone fruits Decreased fruit size and quality (effects of both higher temps & decreased chill hours)
Citrus Reduced frost losses and increased yields in N. CA; possible decreases in S. CA
Grapes Premature ripening and possible quality reduction Increased yield variability
© Project SOUND

© Project SOUND
Some plants will experience effects directly attributable to ‘intolerable’ heat
We should expect more warm/hot days

© Project SOUND
…and ‘water-wise gardens’ like this just make things worse

Heat is not just annoying – it kills
Greater risk of death from dehydration, heat stroke/ exhaustion, heart attack, stroke, and respiratory distress
By mid-century, extreme heat events in urban centers such as Los Angeles are projected to cause two to three times as many heat-related deaths as there are today.
High temperatures stress living creatures - from bacteria to mammals.
© Project SOUND
http://leadingwithtrust.com/2013/06/23/are-you-a-thermometer-or-thermostat-leader/

Garden strategies to combat heat: create shade with trees, large shrubs & vines
Look closely at your existing trees Are they healthy? Young enough to
survive your lifetime? In the right places to provide needed shade?
Plant trees to S & W of buildings NOW
Choose trees/large shrubs that provide ‘value added’; fruits; habitat value; etc.
Choose water-wise native species if possible
© Project SOUND
Use vines and trellises creatively; native vines have many good attributes in addition to their shade

December to January and July to August are projected to change the most (relative to today)
© Project SOUND
What can we expect (S. Bay)?
Warmer nights (on average) in summer
Warmer days in winter (on average)
Warmer nights in winter; fewer nights below 45° F.
http://www.c3headlines.com/global-warming-urban-heat-island-bias/
https://www.zagat.com/b/los-angeles/7-new-outdoor-bars-for-sipping-around-la
The more heat-absorbing surfaces that surround us, the warmer the nights (whenever we have sunny days)

Decreasing hours of chill: bad for W. Coast agriculture
‘Chill factor’ – the number of hours below a certain temperature required to trigger some plant behavior (often flowering)
Most important for fruiting trees/shrubs, ‘winter annuals’ and biennials
Fruit and nut production in California will likely be seriously affected
May also affect those of us that grow ‘low chill’ fruits in home gardens [Anna apple; Fuji apple; Black Mission fig; Santa Rosa plum]
© Project SOUND
DECREASING CHILL HOURS,2070-2099

How will decreased hours of chill affect local native plants (in gardens & Preserves)?
Some native shrubs from slightly higher elevations, more northern latitudes and the high desert (which experience more chill) will likely not produce as well/reliably:
Manzanita? Native cherries & other Prunus ? Coffeeberry & other Rhamnus
species ??? Hard to predict
Research is desperately needed on native species that provide food for birds & other creatures.
© Project SOUND
http://irri.org/rice-today/rice-feels-the-heat
Lots of research on effects of heat on crop species – very little on native plant species

Local Preserves & gardens are vulnerable to heat
waves throughout the year
High temperatures are often accompanied by dry conditions.
Santa Ana conditions constitute a ‘double (maybe triple) whammy’.
© Project SOUND
http://www.friendsofmadronamarsh.com/marsh-slide2.htmlhttp://www.beverlyhillscitizen.org/archives/ballona.htm
http://theweatherprediction.com/weatherpapers/049/index.html

Subtle changes in temperature can effect sensitive systems – in plants and in the climate/environment
Global/local temperatures (including ocean temperatures) affect:
Precipitation: amount, timing and type Winds: patterns, timing, velocity Humidity: degree, timing Soil conditions: moisture, organisms
Everything is interconnected

Precipitation change in the 20th century
Most of the U.S. saw increased precipitation
S. CA and Arizona saw significant decreases
© Project SOUNDhttp://www.epa.gov/climatechange/science/indicators/weather-climate/precipitation.html

This has not been a good 4 years for the West
All of California in some level of drought throughout 2015 Estimated Population in Drought Areas: 36,660,308
© Project SOUND
© Project SOUND
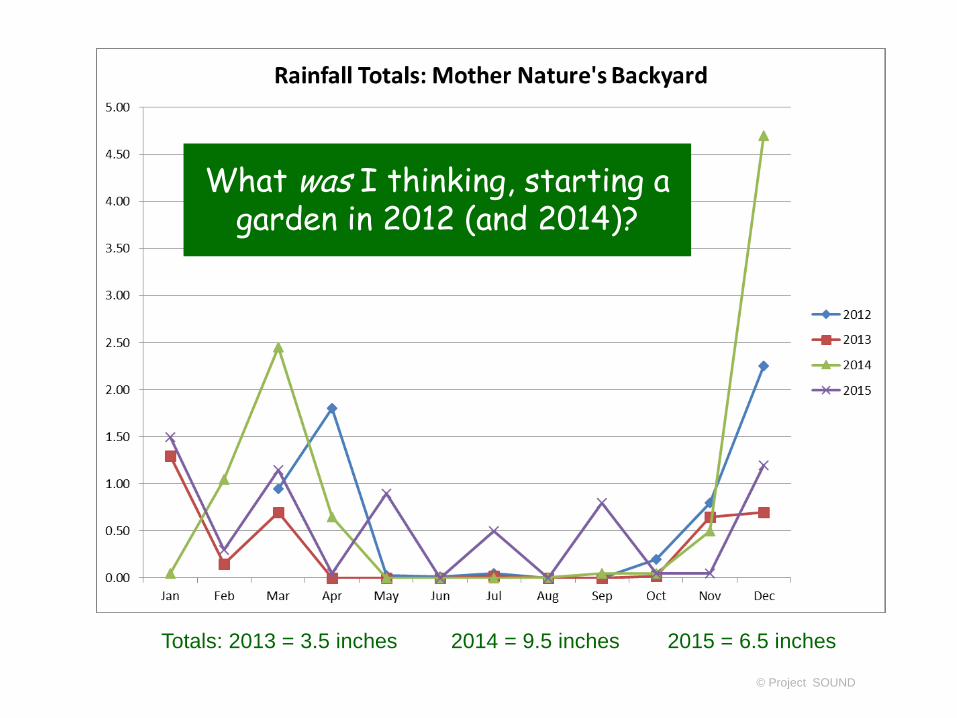
Totals: 2013 = 3.5 inches 2014 = 9.5 inches 2015 = 6.5 inches
What was I thinking, starting a garden in 2012 (and 2014)?

Predicting S. California’s future precipitation is challenging
© Project SOUND
Role of El Nino events is not well understood – and they have a role in our precipitation
We have complex topography
Our area lies right between two areas on which most models agree:
An area of more precipitation to the north
An area of significantly less precipitation to the south

“21st Century Precipitation Changes over the Los Angeles Region” - 2014
Major findings: Probably about the same amount of precipitation overall
(some models suggest slightly higher – some slightly lower)
Continued high year-to-year variability
Less precipitation falling as snow (40% decrease in snowfall) due to increasing temperatures Higher wintertime stream/runoff flows Need to capture/infiltrate to conserve as much water as
possible
For more see: http://www.kcet.org/news/climate_change_la/downloads/LARC_PartIII_V2.pdf
© Project SOUND

Slight decrease or slight increase?
Probably wisest to assume somewhat drier conditions –and less water available for home gardens
Year-to-year variability will likely increase Plan for drought years Plan enough flexibility to
deal with wet years: Plant choices Water infiltration/
conservation
© Project SOUNDhttp://cal-adapt.org/precip/decadal/
PV peninsula
Much of South Bay
Los Angeles average since 1877 thru 2012 (135 years): 14.98 inches

Good news – El Niño year this year!
© Project SOUND
The period October through March tends to be wetter than usual in a swath extending from southern California eastward across Arizona, southern Nevada and Utah, New Mexico, and into Texas.
There are more rainy days, and there is more rain per rainy day. El Nino winters can be two to three times wetter than La Nina winters in this region.
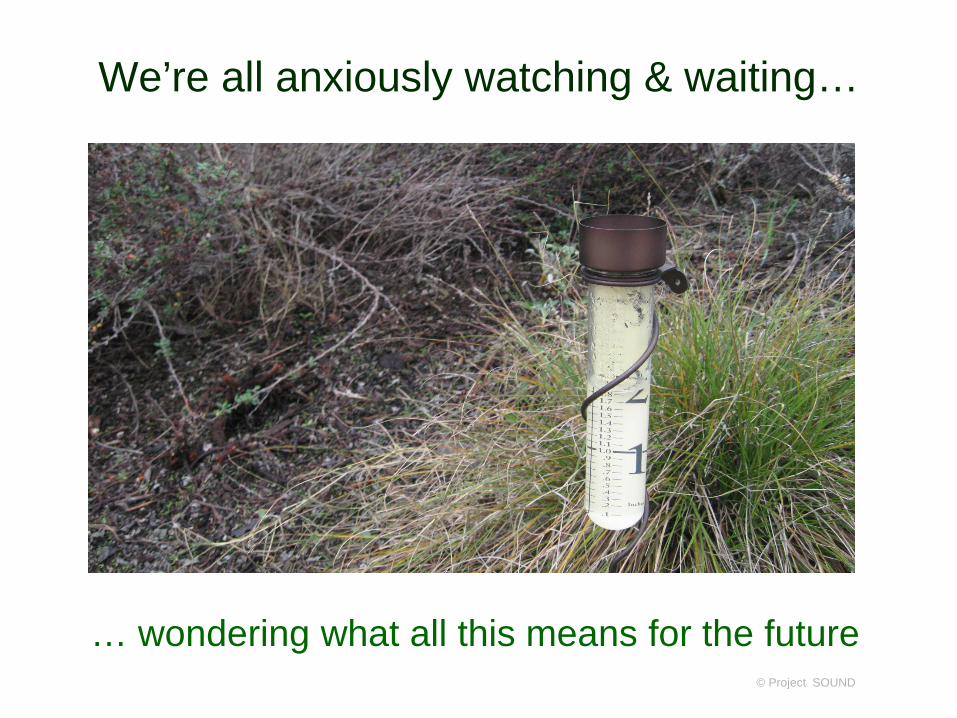
We’re all anxiously watching & waiting…
© Project SOUND
… wondering what all this means for the future

Where’s our El Niño?
Many areas are getting above normal precipitation. Why aren’t we?
Blame it on a strong mass of high pressure
Heats our atmosphere Causes the wet, subtropical Jet Stream to
move North or South (keeps it out) Brings us (you guessed it) Santa Ana Winds
© Project SOUND
Los Angeles Times – January 22, 2016

© Project SOUND
heat
smog
drought
Santa Ana winds
unusual rain patterns

© Project SOUND

Local precipitation is influenced by many factors
Large scale Overall global temperatures &
temperature gradients Ocean temperatures and
temperature gradients Location of the Polar and
Subtropical Jet Streams Many other factors, including
some we know little about
Local Proximity to the ocean Local temperature gradients
(specifically, desert vs. coast) Elevation Location in relationship to
mountain ranges© Project SOUND

We can’t really explain why the masses of high pressure have been so strong/constant recently
We do know they’ve influenced our weather –significantly - for at least the past 4 years
That’s reason for concern – is this our new normal?
Are the past 4 years a taste of things to come?
© Project SOUND
https://en.wikipedia.org/wiki/Weather_front

© Project SOUND
Some days, you just want to weep….

© Project SOUND
California wildlands dramatically illustrate the combined effects of heat, drought & wind

We needn’t discuss the direct effects of drought on local gardens
© Project SOUND
Longer ‘fall warm period’ – lasting well into December or later in some years
? More variable onset of spring warm season
? Earlier onset of spring warm season

Plants are particularly sensitive to the effects of temperature & moisture at certain stages of development
Seed germination
Development of the flower (particularly the pollen-producing organs)
Pollen production & viability
Pollen transfer (‘pollination’)
Actual fertilization process (several steps)
Seed/propagule development
© Project SOUND
Note that all of these impact the reproductive success of a plant – and ultimately of a species

Stages of the reproductive cycle have to happen at the right time – timing is everything
Temperature
Soil moisture
Humidity
Light
Pollinator availability
Seed distribution system availability
© Project SOUND
So, over time, plants have modified their reproductive cycles to synchronize with their local climate
https://www.filamentgames.com/reach-sun-lesson-3-plant-life-cycles-and-reproduction

Plants regulate their daily and yearly behaviors based on cues from the environment
Intensity and color of light
Periods of light and dark Temperature Soil moisture (precipitation)
Physical factors Wind Other, including chemicals in
the air, water & soil Animals Other plants
© Project SOUND

The ‘constant cues’ are necessary for things to happen at the ‘right time’
© Project SOUND

Many types of plant behaviors are temperature regulated (in at least some plants)
All or none effects Flowering Fruiting Seed germination
Timing (earlier/later) effects Timing of bud-set; leaf-loss Timing of bud-break (leafing out) Timing of seed germination Timing of flowering & fruiting
© Project SOUNDhttp://www.psycholawlogy.com/2013/03/04/psychological-detachmentthe-importance-and-benefits-of-mentally-switching-off-during-leisure-time/

What types of temperature cues do plants use to regulate behaviors?
Number of hours below a certain temperature in a year (chill factor)
Number of days above a certain temperature
Number of consecutive days below a certain temperature
The difference between high and low temperatures in a 24 hour period
© Project SOUND
Plants use the most reliable cues (in their particular climate) to ensure that key behaviors (like pollen production) don’t happen too soon
http://alecclayton.blogspot.com/2014/01/v-behaviorurldefaultvmlo.html

What happens when ‘constant’ environmental cues change too quickly?
These are the questions that keep biologists and Preserve Managers awake at night!
© Project SOUND
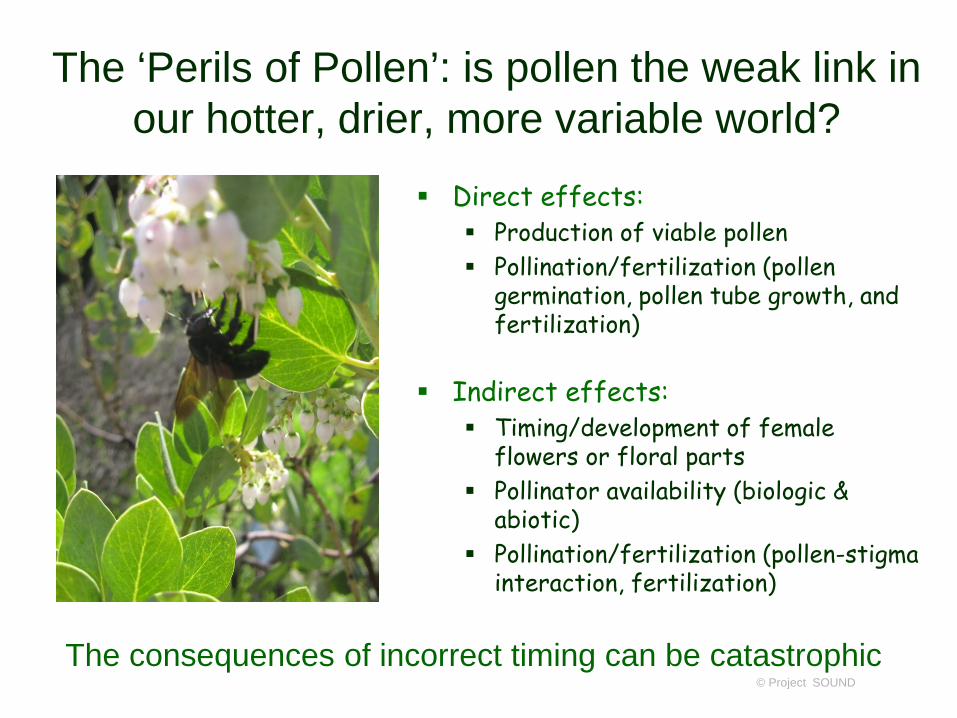
The ‘Perils of Pollen’: is pollen the weak link in our hotter, drier, more variable world?
Direct effects: Production of viable pollen Pollination/fertilization (pollen
germination, pollen tube growth, and fertilization)
Indirect effects: Timing/development of female
flowers or floral parts Pollinator availability (biologic &
abiotic) Pollination/fertilization (pollen-stigma
interaction, fertilization)
© Project SOUND
The consequences of incorrect timing can be catastrophic

So what – I’ll just go and buy some more seed
© Project SOUND
http://www.thelittlegreenhomemaker.com/garden-primer-how-to-read-your-seed-packets

If a plant species can’t reproduce, ultimately it will die out, at least in that area
© Project SOUND
Native grasses failed to reproduce
Any plant species loss has the potential to affect all the animal species which depend on it
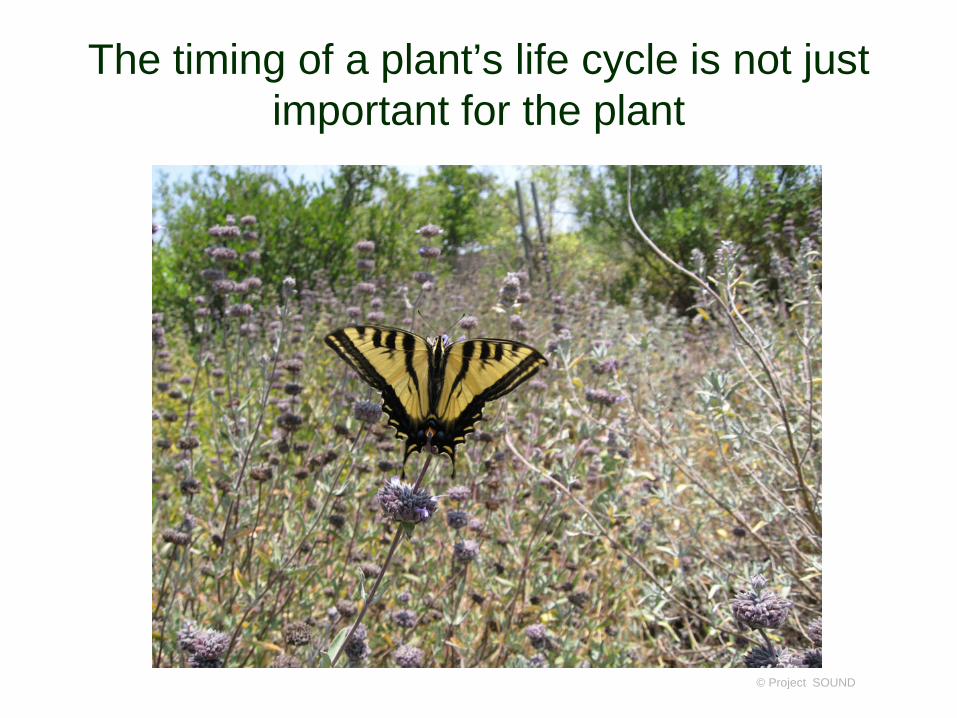
The timing of a plant’s life cycle is not just important for the plant
© Project SOUND

Plants, animals and seasons: disturbing new trends world-wide
Many plant species are responding to climate change by advancing the onset of events in the yearly cycle.
The earlier onset of bud burst, flowering, and fruiting could have major impacts on timing-sensitive relationships with pollinators, seed dispersers, and herbivores.
Events that have long occurred in synchrony may become decoupled, which could especially impact plant species with specialized pollinators and seed dispersers.
© Project SOUND
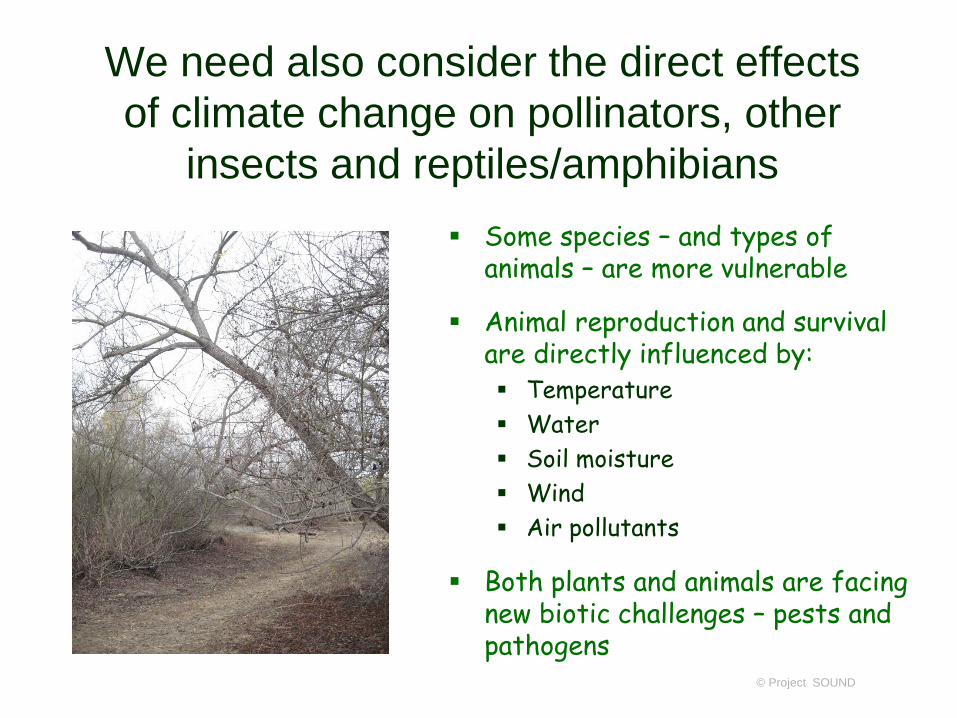
We need also consider the direct effects of climate change on pollinators, other
insects and reptiles/amphibians Some species – and types of
animals – are more vulnerable
Animal reproduction and survival are directly influenced by: Temperature Water Soil moisture Wind Air pollutants
Both plants and animals are facing new biotic challenges – pests and pathogens
© Project SOUND

Air pollution: what can we expect in the future?
↑ emissions due increased population?
Smoke from wild fires
? More stagnant air
? More particulates (due to decreased precipitation)
Because warm, stagnant air tends to increase the formation of ozone, climate change is likely to increase levels of ground-level ozone in already-polluted areas and increase the number of days with poor air quality
© Project SOUNDhttp://www.climatechoices.org/impacts_health/

Santa Ana winds & air pollution in western L.A. county
Santa Anas (off-shore flow) mean more air pollution in our area –you may have noticed this recently
? Longer season for Santa Anas
Maybe 20% fewer Santa Ana events as winter temps in desert increase
But even past records suggest more extremes
© Project SOUNDhttp://www.achangeinthewind.com/2008/10/good-news-friday-global-warming-lessening-santa-ana-wind-conditions.html
http://blogs.kqed.org/climatewatch/2011/12/01/santa-ana-wind-season-may-be-stretched-by-climate-change/

Heat, drought and air pollution can increase plant susceptibility to pests & pathogens
© Project SOUND
Polyphagous shot hole borer
http://ucanr.edu/blogs/blogcore/postdetail.cfm?postnum=8170

Plant disease changing
In both animals and plants, an unprecedented number of fungal and fungal- like diseases have recently caused some of the most severe die-offs and extinctions ever witnessed in wild species, and are jeopardizing food security.
Consequences for local Preserves and gardens: More severe effects of old pests (plants are less able to cope) New pests adapted to the changing climate: temperature & precipitation
The past two decades have seen an increasing number of virulent infectious diseases in natural populations and managed landscapes.

Effects of temperature on birds Observed effects: 1965 to 2005 Birds moved north in winter
Among 305 widespread North American bird species, the average mid-December to early January center of abundance moved northward
The average species shifted northward by 35 miles during this period (see Figure 1). Trends in center of abundance are closely related to winter temperatures.
Birds moved further from the coast
Effects vary by species – but local resident & migrant species are already changing
© Project SOUND

Temperature is one of the most important influences on plant distribution

Temperature and rainfall limit plant distributions in S. CA as well
Air temperature decreases with increasing elevation
Air temperature gradients can explain the distribution of C3 (cool-season) and C4 (warm-season) grasses and many other types of plants
Precipitation interacts with temperature in limiting species distributions
Plant species are already ‘marching up the mountains’ all around the world

http://www.californiachaparral.org/threatstochaparral/cclimatechange.html
What will California look like?

The grim realities: plant communities in a time of significant climate change
Climate change is already impacting plants and altering the structure of plant communities.
Species that are particularly vulnerable to climate change include: Those with limited ranges and dispersal
abilities (long lifespan and/or limited seed dispersal.
Some isolated or disjunct species (including those isolated by human incursion)
Plant genetic composition may change in response to the selection pressure of climate change.
© Project SOUND

The grim realities: plant communities in a time of significant climate change
Evidence from historical plant migrations (e.g. those that occurred at the end of previous ice ages) suggests that while some species will migrate to areas with appropriate climates, many plant species will not be able to migrate fast enough to keep pace with current rates of warming.
Some plant communities or species associations may be lost as species move and adapt at different rates.
© Project SOUND

The grim realities: plant communities in a time of significant climate change
Increased invasions by alien species may occur, as conditions become more suitable for exotic species whilst native species become less well suited to their environment.
© Project SOUND

What will our climate be like in the S. Bay?
1. Slight overall incr. in average temperatures, # high heat days2. Significant changes in the temperature patterns: Hotter July & August Warmer winter/early spring Warmer night temperatures – and less winter chill More year-to-year temperature extremes
© Project SOUND

What will our climate be like in the S. Bay?
3. Significant changes in the timing of seasons: Longer fall dry season (into
December or even longer) Earlier spring (at least in some
years) Shorter winters
4. About the same amount of precipitation
5. More precipitation extremes: droughts and floods
6. Timing of onset of rains more variable
© Project SOUND

What will our climate be like in the S. Bay?
7. More rain/less snow as temperatures rise. ? less irrigation8. ? More (or less) frequent Santa Ana winds (all year-round -
not just in fall/winter)9. ? More smog
© Project SOUND

What will be the likely consequences for plants and animals?
1. Some plants will be killed outright by temperature & precipitation extremes (including some that are not really so extreme)
2. Some plants will have a tough time reproducing, due to either direct or indirect consequences of temperature/precipitation
3. Changing seasonality may disrupt long-standing synchronicities: Plants & weather Plants and pollinators Plants and other beneficial
creatures © Project SOUND

What will be the likely consequences for plants and animals?
4. Some native plant species may not survive
5. The biodiversity in local native plant communities will change
6. Non-native invasive species –especially those better suited to the changing climate – will become more of a problem
7. New diseases & pests (of both plants and animals) will also affect biodiversity in Preserves and gardens
© Project SOUND

What will be the likely consequences for plants and animals?
8. Temperature/precipitation & pollution extremes will render some plants more vulnerable to pests, pathogens, etc.
9. Animals of all sorts and sizes will likely be more vulnerable to starvation; creatures having more specialized relationships with plants will be most vulnerable
© Project SOUND

What will be the likely consequences for plants and animals?
10. The biodiversity of creatures inhabiting our Preserves and gardens will likely change:
Due to direct effects of temperature, precipitation, etc.
Due to indirect effects: Changing plant community Changing predator/pathogen
community Dis-synchronicities that affect
breeding and food sources
© Project SOUND
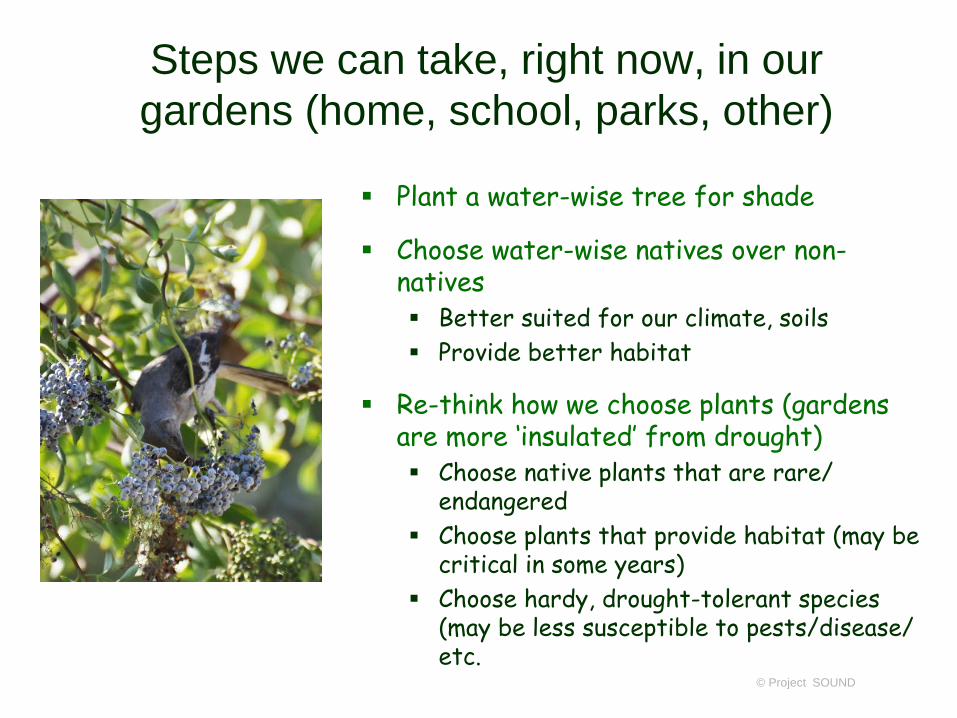
Steps we can take, right now, in our gardens (home, school, parks, other)
Plant a water-wise tree for shade
Choose water-wise natives over non-natives Better suited for our climate, soils Provide better habitat
Re-think how we choose plants (gardens are more ‘insulated’ from drought) Choose native plants that are rare/
endangered Choose plants that provide habitat (may be
critical in some years) Choose hardy, drought-tolerant species
(may be less susceptible to pests/disease/ etc.
© Project SOUND

More steps to take
Let garden plants provide food: seeds, fruits, vegetation
Plant with the seasons – it stresses plants less
Change your watering strategy: good deep watering in winter/spring [we’ll have to educate our water companies]
Be sure that every drop of rain that falls on your garden stays in your garden
Be vigilant about invasive weeds and pests – certainly don’t plant any!
© Project SOUND

Difficult choices to think about for our local Preserves
Should we water? When? To supplement winter drought? To allow us to do restoration in
dry years? To keep key species alive
Some plant species will not be able to reproduce in the wild. Should we artificially plant seedlings? Take other steps?
How do we prioritize species when supplying rare resources (like water)
© Project SOUND

More difficult topics for consideration
How do we define ‘local plant community’ – static or changing
How can we increase genetic diversity in small, local Preserves
How best to maintain surveillance for invasive species, pests, pathogens? How best to combat these invaders (in a way that causes least impact on the ecosystem)
© Project SOUND

© Project SOUND
The past four years have been stressful

© Project SOUND
heat
smog
drought
Santa Ana winds
unusual rain patterns

But the past four years have also taught us important lessons (if we’re willing to listen)
© Project SOUND

…lessons that point towards the future
© Project SOUND

© Project SOUND
… and steps we can take (right now) to make that future more pleasant & sustainable