future 1 reliability analysis results
TRANSCRIPT

August 27, 2021
Long Range Transmission Planning Workshop
Year 10 and 20 Insights:Future 1 Reliability Analysis Results
1

Agenda
• Updates on stakeholder response to the initial results
• Focused steady state reliability issues for Future 1, Year
10 and 20 models
• Future 1 initial solution testing
• Ongoing studies and upcoming study plans
• Next Steps
2

Highlights on information exchange with stakeholders for
reliability analysis and feedback
3
MISO Sharefile location: https://misoenergy.sharefile.com/f/fof89d75-4353-4393-bcd2-f543bb3ce5f1
LRTP website: https://www.misoenergy.org/planning/transmission-planning/long-range-transmission-planning/
• Modeling and input files
• Reviewed line by line comments for their system
• Proposed projects to mitigate the issues seen on posted
results
• Proposed alternative lower cost solutions including
terminal equipment upgrades, line uprates, re-sagging,
protection upgrade, etc.
• Internal studies and presentations
• Modeling document
• Powerflow models and associated input files
to perform studies and study scope
• MISO proposed Indicative roadmap projects
list and associated parameter files
• Study results as they become available
• Near term and future study plans
• Focus area and important issues
Feedback receivedInformation shared with Stakeholder

MISO completed contingency analysis for basecase powerflow
models for Future 1 models
4
Year 20Year 10
Future 1 Future 2 Future 3 Future 1 Future 2 Future 3
*First pass focuses on West, East, Central planning sub-regions
Powerflow Models
Posted for Stakeholder feedbackN-1 Analysis
N-1-1 Analysis

Today’s discussion will focus on the evaluation performed on part of the
proposed solutions in MISO’s F1 indicative roadmap
5
Future 1 Indicative Roadmap Subset of F1 Indicative roadmap

As an initial set of solutions MISO is evaluating a subset of the F1
Indicative Roadmap in the area of more concentrated issues
6
Max Loading %
LRTP solution
>90% issues fixed
90% - 40% issues fixed
<40% issues fixed
Thermal issues
* % is based on total count of issues resolved by the LRTP solution to the total basecase issues
257 unique overloaded
Facilities
29,324 different events#
#Monitored elements + Contingency pair across all models
7
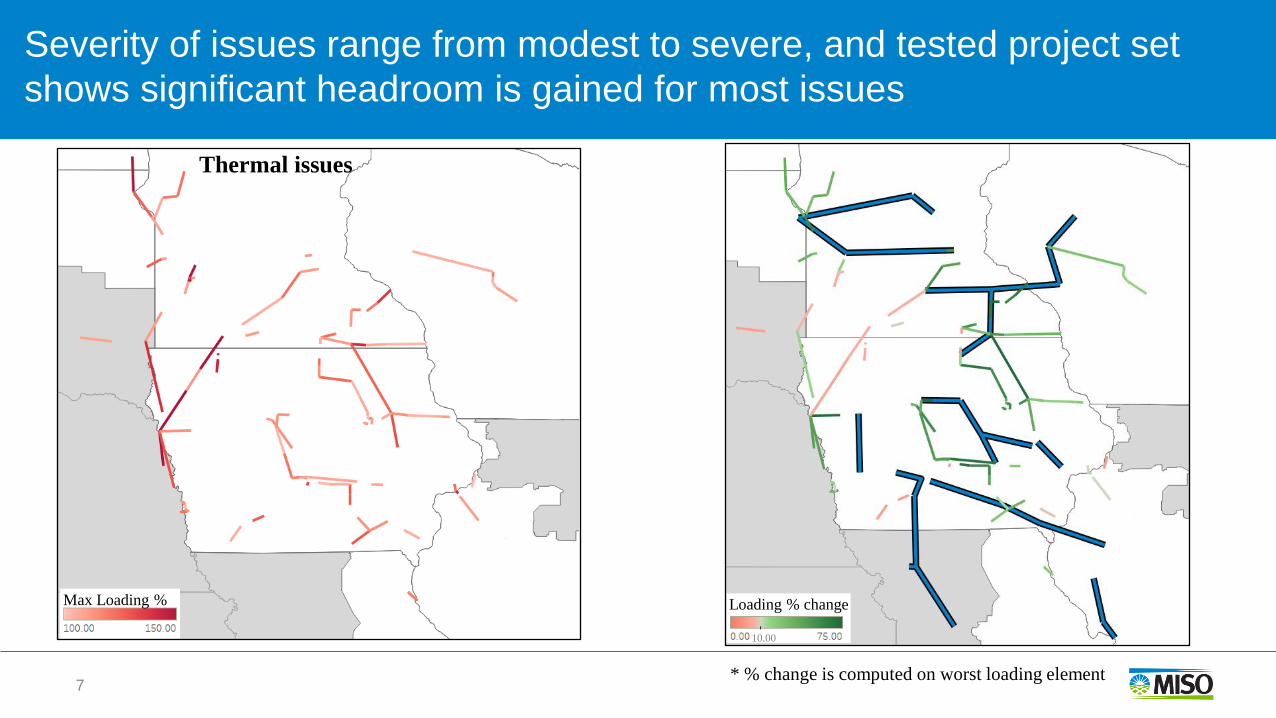
Max Loading % Loading % change
10.00
Thermal issues
Severity of issues range from modest to severe, and tested project set
shows significant headroom is gained for most issues
* % change is computed on worst loading element

8
• The map shows examples of the delta
change in loading on selected facilities
• Central Iowa
• Webster Area 50% average change
• Montezuma to Bondurant 61% average
Big Stone
30–40% change
Split Rock
23% change
Granite falls
~30% change
Wilmarth & Helena
~50% change
Eau Claire
26% change
SE MN
20-50% change
E Iowa
24-53% changeRaun area
30-60% change
SE IA&NE MO
9-30% changeLRTP Line
% Average Decrease
Decrease in loadings on affected
transmission is significant
Colors are average decrease in loading % from base cases to cases with projects applied.
Darker green, the greater the average change

Parallel efforts are ongoing for additional Model building, Issue
Identification and solution testing along with stakeholder communication
• Examination of existing and next limiting elements for the constraints.
• Scoping of transfer analysis to capture important expected system conditions and initiate
the analysis.
• Compare and choose among different solution alternatives
• Rationale to the solution idea with the LRTP
• Matching of the issues to the solution ideas
• Feasibility of the solution ideas
• Distribution factor screening to target for high impact solutions
• AC contingency analysis and comparison with selected set of solution ideas
9

Northeast Iowa Area Results
10
Flows across NE Iowa
• Shoulder Light Load and Winter cases,
some Summer issues near Adams
• Multiple contingency category events
that break West to East and North to
south paths
• Similar results in both year models
Thermal Issues
LRTP Solution

Central and Southeast Iowa Area Results
Flows from Central IA towards East and
South outlets
• Winter cases, some issues seen on
Light Load and Shoulder cases
• Mostly events that break W>E and
N>S paths
• Similar limiting elements for both year
models
11
Thermal Issues
LRTP Solution

Western Iowa Area Issues
Flows across and out of Western Iowa
• Shoulder Light Load and Winter
• Mostly P1 and P2 issues, some P6 driven
subregional limiters
12

13
• Occurs in Winter and Shoulder
cases
• Worst issues observed for the
East/West loss of 230 kV line
• Overloads on 230kV from Big Stone
to Hankinson, and Forman 230/115
kV
• Voltages around 0.92 p.u. post
contingent
13
Bigstone / Hankinson Area
Thermal Issues
LRTP Solution
Low Voltages

• Worst loading in Shoulder
• Contingency events at Lyon Co overloads Wilmarth to Helena 345 kV line
• Contingency events at Wilmarthcauses overload on 345/115kV transformer at Wilmarth
• Double tower outages cause issues along entire 345 kV path
14
South West Twin Cities
Wilmarth
Helena
Thermal Issues
LRTP Solution

Western MN
15
• Shoulder, Winter Day and Night
• Granite Falls area 230 kV and 115 kV
• Multiple contingency events on 345
kV system to south and west
Thermal Issues
LRTP Solution

16
• Seen in Shoulder case
• 345 kV overloading caused by double
tower outage near Stone Lake
• 138 kV overloads caused by certain
contingency types at Rocky Run
• Loss of single element in Shoulder
causes overloads
Thermal Issues
Wisconsin Area

Some of the issues that we see are caused by the specific siting
of individual resource
17
• Northern Wisconsin – Solar outlet issues
• Sited 768 MW of solar at Ironwood for F1Y20
• Causes overloads and low voltage on entire
115kV system
• Many different contingencies makes the situation
worst
• Not seeking for LRTP solution
Thermal Issues

MISO Central planning area issues are driven by flow
to/from multiple neighboring states
18
• West to East Flows:
• Fargo 345/138 XFMRs, Sandburg 161/138 kV
XFMR, Marblehead-Palmyra, Herleman-Quincy
• Bunsonville, Goose Creek area
• Zachary, Adiar area
• Southern IL/MO Issues around
Lutesville/Essex area
• IL/IN wind zone (Goodland Area):
• Paxton-Gilman -Watseka-Sheldon South-
• Grandtower area
• Cayuga, Wallace, Nucor, Whitestown area

Issues observed in Southern Michigan may be resolved
by regional solutions
19
• South-central Michigan
• Issues around Argenta, Battle Creek, Tompkins, Oneida, Majestic 345kV flow corridor
• Parallel 138kV flow paths between METC and ITCT also get impacted
• Situations get worse in 20 year out models
• South-eastern Michigan
• Outages involve Morocco 345/138kV substation, overloads
shown around Whiting area
• For loss of 345kV flow paths from West to East Michigan,
overloads of Wayne 345kV transformer
• Situation gets even worse in 20 year out models
Argenta Majestic
LRTP Indicative roadmap solution

MISO started analyzing indicative roadmap ideas and will also
continue to perform issue identification
• Violation Identification
• Steady state contingency analysis
• Future 1, Year 10 and year 20 models
• Future 2, Future 3 models
• Impact of Generation siting on results
• Transfer Analysis
• Additional scenarios to capture possible system conditions as informed by the RIIA study.
• Solution Testing
• Alternatives will draw from indicative roadmap as well as other proposed solutions
• Compare and choose solutions
• Solution refinement
• Effectiveness of Solution
• Security Assessment
• Cost effectiveness over time and economic values
20
Completed
In-progress

MISO is exploring transfer analysis scenarios to more fully
capture the variability in system conditions across the footprint
Transfer scenarios complement the 7 basecase dispatch conditions which are not sufficient to capture all dispatch conditions
• Prevailing Weather Patterns
• Non uniform intra-day dispatch of renewables in different areas
• Variability of Wind/Solar dispatch across large geographic footprint (wind drought, cloud cover in different subregions)
• Changing weather conditions across the footprint
• Reliably serve load following a weather event in a subregion
• Use of dispatchable resources in other areas to cover sudden loss of renewables in a subregion
• Future availability of dispatchable resources
• Higher renewable penetration in regions of rich supply
• Unavailability of gas units due to increase in retirements
21

Transfer analysis provides further insights into system behavior
as renewable penetration increases
• LRTP F1 models represent a single outcome with mild renewable penetration levels
• At renewable penetration levels of F1 a significant amount of thermal resources remain in operation around the traditional load centers. At higher levels of penetration, conventional resources will be displaced by renewables remote from load centers
• F1 base models do not capture the locational differences of renewable production – uniform dispatch of renewables
• RIIA highlighted the need for transmission to support energy adequacy in a new era of high penetration levels of renewable resources
• The variable nature of renewables presents challenges to ensure reliability for all ours of the year as system conditions change due to the shifting transfers from remote renewable resources to the area load centers
• While MISO large footprint provides a broad geographic diversity as well as solar and wind diversity, areas of renewable production are not uniform and tend to cluster in areas of high production potential.
• Reliable operation requires transmission infrastructure to access the areas of renewable production in the hours when the energy is available
• With high renewable penetration levels, the daily ramping needs are met by thermal resources in other areas of the footprint driving intra-day transfers and need for transmission to support bi-directional flow
22

23
An increasingly connected system is needed to balance renewable
variability across an increasingly heterogenous footprint
7pm peak load
4 pm
6 pm
RIIA March 3rd, 2021 Webinar
Load
Wind
Avg. diurnal load vs. wind + solar
Avg. diurnal load vs. wind + solar
*MISO: 10%*LRZ 3: 70%
†MISO: 50%†LRZ 3: 200%
Wind
Solar
Load
*MISO: 10% Penetration †MISO: 50% Penetration
Slide from Renewable Integration Impact Assessment (RIIA) Study
https://www.misoenergy.org/planning/policy-studies/Renewable-integration-impact-assessment
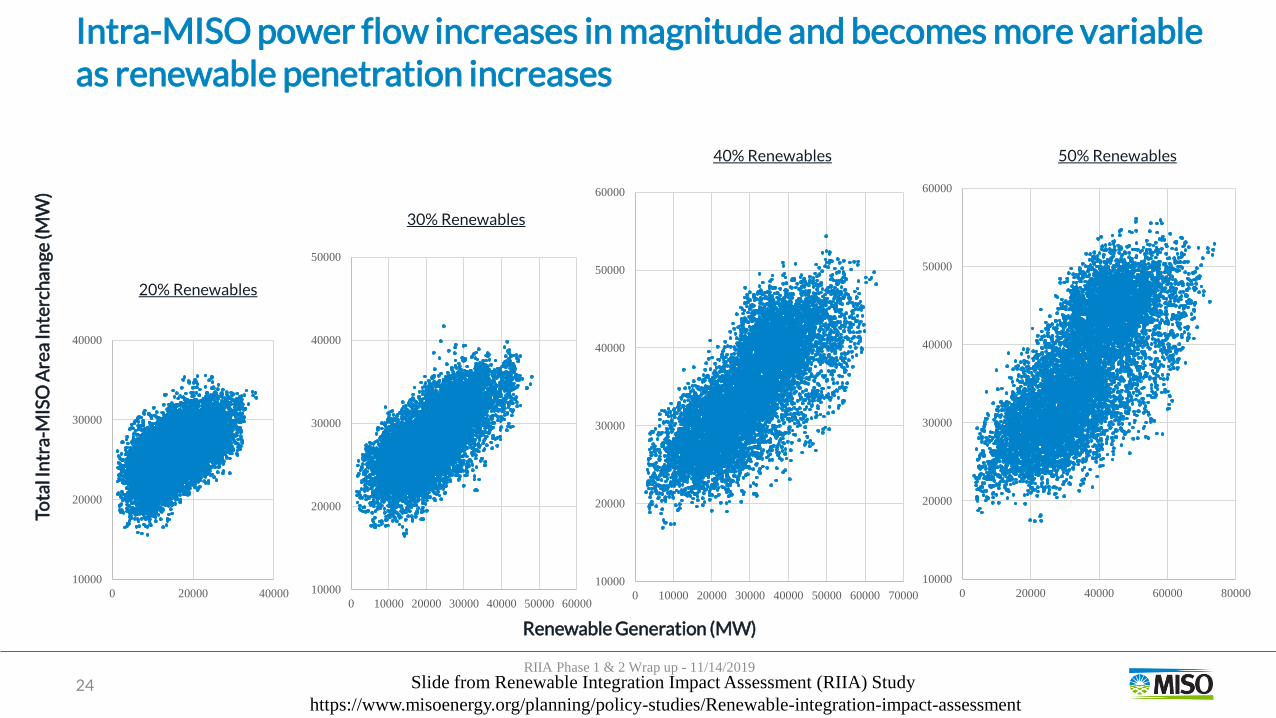
Intra-MISO power flow increases in magnitude and becomes more variable as renewable penetration increases
24
10000
20000
30000
40000
0 20000 40000 10000
20000
30000
40000
50000
0 10000 20000 30000 40000 50000 60000
10000
20000
30000
40000
50000
60000
0 10000 20000 30000 40000 50000 60000 70000
10000
20000
30000
40000
50000
60000
0 20000 40000 60000 80000
50% Renewables40% Renewables
Renewable Generation (MW)
Tota
l In
tra-
MIS
O A
rea
Inte
rch
ange
(MW
)
30% Renewables
20% Renewables
RIIA Phase 1 & 2 Wrap up - 11/14/2019
Slide from Renewable Integration Impact Assessment (RIIA) Study
https://www.misoenergy.org/planning/policy-studies/Renewable-integration-impact-assessment

Wind Drought in West Region: Energy supplied from Central
region
25
• In areas of MISO where we
expect limited thermal
generation as compared to
renewable resource capability
there will be times where we
need to get energy from other
areas.
• Transfer capability will enable
areas with excess gas.
Bubbles represent max capacity of specific unit type in F1

26
Available renewable energy supplying renewable drought areas
• For areas that become deficient in
renewable output access to other
areas with excess renewable
resources allows load to be served
from those low cost resources.
Bubbles represent max capacity of specific unit type in F1

For example, high wind capability in IA/MN can be available to serve
neighboring areas as needed
27
High Wind
Generation Area
• There are certain areas with
high concentration of high
renewable capacity factor and
there will be times where we
will have excess generation
compared to the load.
• Iowa and southern Minnesota
area have high wind generation
• When heavy wind is blowing,
this area can provide power to
support the load in other areas.
Bubbles represent max capacity of specific unit type in F1

Similarly Solar heavy areas will have times when access to external
resources will be valuable
28
• High renewable solar heavy
area suddenly looses solar
• For example, central region
(IL/IN) supplying the power to
Michigan for the sudden loss of
Michigan Solar.
Bubbles represent max capacity of specific unit type in F1


Appendix
30

Reliability Assessment involves multiple iterative phases to
identify the issues and test the solutions
31
Solved?
Yes
Solution Testing
• Regionally focused
• Alternatives will draw from Indicative Roadmap and other proposed solution as appropriate to resolve the observed issues
• Compare and choose solutions
Base LRTP Models
• MTEP21 Futures
• Resource Forecast, Retirements, Load
• MTEP20 TA Topology*
• Dispatch Methodology
Issue Identification
• Contingency Analysis
• Impact of Generation siting on results
• Local/Regional
• Additional Scenarios
• Transfer Analysis
• Stability Analysis
Iterative
refinement
No
Synthesize
issuesMitigation
*Adjusted to MTEP21 based on stakeholder feedback