reliability results of nersc systems · reliability results of nersc systems ... presented in this...
TRANSCRIPT

1
Reliability Results of NERSC Systems
Akbar Mokhtarani, William Kramer, Jason Hick NERSC - LBNL
Abstract In order to address the needs of future scientific applications for storing and accessing large amounts of data in an efficient way, one needs to understand the limitations of current technologies and how they may cause system instability or unavailability. A number of factors can impact system availability ranging from facility-wide power outage to a single point of failure such as network switches or global file systems. In addition, individual component failure in a system can degrade the performance of that system. This paper focuses on analyzing both of these factors and their impacts on the computational and storage systems at NERSC. Component failure data presented in this report primarily focuses on disk drive in on of the computational system and tape drive failure in HPSS. NERSC collected available component failure data and system-wide outages for its computational and storage systems over a six-year period and made them available to the HPC community through the Petascale Data Storage Institute.
Introduction The Petascale Data Storage Institute (PDSI) is a collaboration of universities and national laboratories where each contributes research and experiences towards optimizing I/O that can be delivered to applications of the largest computational and storage systems. PDSI is funded by the Department of Energy’s (DOE) Office of Science as a Scientific Discovery in Advanced Computation (SciDAC) project. PDSI has six major thrusts:
1. Petascale Data Storage Outreach 2. Protocol/API Extensions for Petascale Science Requirements 3. Petascale Storage Application Performance Characterization 4. Petascale Storage System Dependability Characterization 5. Exploration of Novel Mechanisms for Emerging Petascale Science Requirements 6. Exploration of Automation for Petascale Storage System Administration
This report describes initial analysis of systems reliability and component failure rates, and recommendations for improvements and contributes towards thrusts 3 and 4. The following sections provide a brief description of available systems at NERSC and an explanation of methods used for data collection. System wide outage and component failure data exist for all the systems described in this paper, but the data is not totally homogeneous due primarily to the differences in the systems themselves. The remainder of the paper analyzes Seaborg and HPSS data in depth because they have the most comprehensive data for the period being studied. Similar data from other NERSC systems are also collected and stored in the database but cover a shorter period of time. In order to understand whether tape drive activity causes failure, we also looked at the tape drive operation in HPSS in more detail and report some observations on drive activities in the last section.
Systems description Table 1 lists the computing systems in operation at NERSC during the report. Seaborg is an IBM RS/6000 SP consisting of 416 POWER3+ SMP Nodes with 16 CPU1s per node and a total of 4280 disk drives (120 FC, 832 SCSI, and 3328 SSA). There are 380 compute nodes, 20 nodes supporting General Purpose File System (GPFS),
1 For the purposes of this report, CPU is equivalent to a compute core.

2
6 login nodes, 2 network and 8 service nodes. A non-monolithic (modular) switch fabric, SP Switch, is employed to create a high performance network among all nodes.
Table 1: Major Compute Systems at NERSC The main data storage facility at NERSC consists of two high bandwidth archival storage systems running the High Performance Storage System (HPSS) software. The systems have a combined 89 tape drives, eight tape libraries (Sun StorageTek 9310 Powderhorns), and 15 sizable pSeries IBM AIX servers. Users’ data are stored on one archival storage system called Archive and system backup data is stored on the second archival storage system called Regent. Table 2 lists the two systems and their attached hardware.
System Server
Processes Server Hosts Tape Devices
Archive 44 6 46 Regent 40 6 43
Table 2: HPSS at NERSC
The server processes consists of a number of movers and other servers for system management and operation. There are 5 physical mover servers and one core server in each system. In addition, there are 60 internal disks for operating systems and supporting software packages and databases for metadata, and a large number of disk arrays used as “disk cache” for migrating and staging data to and from tape cartridges.
Data Collection Methods Data for this report were mainly extracted from a problem-tracking database, Remedy, maintained by NERSC operations. Various events can prompt operators to initiate a problem ticket: scheduled/un-scheduled system outage, facility-wide outage, individual system component failures, dedicated system testing/benchmarking, and accounting. Only component failures that had impact on system performance are recorded in the database1. Actions and final resolution of the problems are also entered into the database. The two systems with the greatest extent of component failure data available are Seaborg and HPSS. Other sources of data included came from vendor repair records, paper records kept by the operation staff for hardware, and operating system error reports. The data set covers the period from 2001 to 2006 but not all components have been in operation for that time period. A website has been setup at http://pdsi.nersc.gov and the extracted data for all systems are stored in a MySql database for online access. The database can be queried and the results can be displayed in tabular or graphical form. The website allows exporting any and all data to a comma-separated value format as well to encourage further analysis.
1 A single disk failure in a RAID disk array with swappable spares does not impact system performance and hence might not have been reported to operation.
System Type No. Of Nodes
No. Of CPUs
Total Disk Memory Date Commissioned
SEABORG IBM SP RS/6000 416 6080 44TBytes 16-64 GBytes (shared)
Jan. 2001
PDSF Network distributed BASSI IBM p575 POWER 5 111 888 100
TBytes 32 GBytes (shared)
Dec 2005
JACQUARD Opteron Cluster 3563 712 30 TBytes 6 GBytes (shared) July 2005 DAVINCI SGI Altrix 350 (SGI PropPack 4
64-bit Linux) - 32 23.8
TBytes 192 GBytes (shared)
Sept 2005

3
Reliability Data HPSS and the IBM SP RS/6000 (Seaborg) are systems that have been in production since or previous to 2001 and have the most comprehensive component failure data available. Tickets indicating system-wide outages caused by software and/or hardware are categorized as either “scheduled” and “unscheduled” outage. Scheduled outages are planned by one of the NERSC groups and are announced at least 12 hours in advance of system unavailability with a goal of seven days advance notice to the NERSC user community. Unscheduled outages are those that do not involve advance notification. Overall availability is the availability of the system compared to the theoretical maximum of 24 hours a day, 7 days a week, 365 days a year regardless of the reason for system unavailability. Figure 1 shows full system outages for the compute systems Seaborg and the Archival1 storage system. HPSS normally has weekly scheduled (proactive) maintenance periods, of typically 2 hours, which contribute to the higher scheduled unavailability of the systems. There is no regularly scheduled maintenance period for Seaborg and the system is maintained as needs arise, reactive maintenance. The relatively large unscheduled outages for Seaborg in 2004 and 2006 are the result of a major operating system and supporting software upgrade, and a security incident, respectively. A major upgrade of the HPSS software in 2006 resulted in about 3.5 days of storage system unavailability.
Fig. 1: Seaborg and HPSS system-wide outage Figure 2 shows the average annual outage, scheduled and unscheduled, for all systems. They all show average down time of 1.5% to 4%, except for PSDF. The fairly low downtime of the PDSF system can be attributed to its distributed nature; components can be upgraded or updated without a system wide outage. There are only three critical components that can cause the whole system become unavailable: the /home file-system, master batch scheduler, and application file-system. That is to say that outages are not designated system-wide unless one of the critical components fails. To contrast this with a different practice within NERSC, HPSS regularly quiesces user activity by blocking new access to the production system to resolve problems even if the problem itself would not have caused a system-wide outage. Other compute systems share a single global file-system (the NERSC Global File System or NGF) mounted under a common directory, and any down time of this file system limits the use of the compute systems for production runs.
1 Since both storage systems have scheduled weekly downtime and a separate ticket is created for each system, including both in this analysis would result in double counting of down time for the whole system

4
Fig. 2: Average annual outage for all systems at NERSC
Detailed Analysis Seaborg Availability Data Systems outages, scheduled or unscheduled, can be classified as caused by software or hardware failures. Figure 3 shows this classification for Seaborg annual outage. The annual outage due to software failure is a dominant cause of system unavailability. This could be attributed to the fact that hardware components have received more improvements over the years and the technology is more mature than software. It could also be argued that changes in software are more frequent and hence more prone to failure. Software and hardware engineering are very different disciplines and thus have significantly different quality assurance processes, different levels of human involvement in their production, and different fault tolerance characteristics.
Fig. 3:Software and hardware systems outage
Individual tickets were examined to determine the source of each outage. Figure 4 shows classification of each outage highlighting tickets with large downtime. The security incident in 2006 and OS upgrade in 2004 account for a significant portions of the annual outage. The addition of new compute nodes to the system in 2002 accounts for the relatively large downtime due to hardware.

5
Fig. 4: Classification of individual tickets
As is indicated in Fig.4 there are a number of components that can affect system availability. Figure 5 shows the outages categorized by components, software and hardware. File system failures are the leading cause of the Seaborg system outages. It should be noted that there are a number of component failures that manifest themselves as file system failure. For example, problems with any of the Virtual Shared Disks (VSD) connected to 20 I/O nodes or one of the node’s hardware would render the file system as being unavailable. Unfortunately, the tracking tickets did not always reflect the exact cause so careful analysis and consideration was given to establishing the reason for failure. In some cases this involved extensive investigation by looking at multiple different sources to resolve. Software related downtime, in addition to the operating system upgrade, contributes a sizable fraction to system unavailability. These outages vary from scheduled software package installations and upgrade to unscheduled software failures. The SP Switch that handles all the communications between the nodes is a multistage switch with many hardware modules and a Communication Subsystem Software (CSS), which is responsible for sending and receiving packets to and from other nodes. Any failure in this system was reported as switch failure and hence resulted in a large fraction of downtime. Benchmarking also contributed significantly to system unavailability.
Fig 5: Seaborg outage categorized by components

6
HPSS Availability Data Figures 6 – 8 show the same classifications of outages for the HPSS systems at NERSC. Figure 6 is the annual scheduled and unscheduled downtime due to both software and hardware. The lead cause for system outage is the annual scheduled software outage due to the weekly maintenance period. It should be mentioned that the weekly maintenance period is also used to perform necessary software and hardware upgrades which contributes to less unscheduled downtime.
Fig 6: HPSS software and hardware outage Figure 7 shows individual tickets for system-wide outages for HPSS. The software upgrade to HPSS accounts for a large portion of the scheduled outage in 2006. Due to the fact that HPSS is a distributed network-attached storage system, component failures typically do not affect overall system availability; however, various power and network outages have contributed significantly to the HPSS systems being unavailable to end-users.
Fig 7: HPSS outage by tickets

7
Figure 8 shows the HPSS downtime by category. Again, the scheduled software outage is the dominant source of downtime1. It is worth noting that power outages are comparable to the unscheduled software and hardware system unavailability. This illustrates the inter-dependency of systems in a HPC center where one system’s reliability and availability is significantly affected by other systems at the facility.
Fig. 8: HPSS outage by category
Component Failure Data In addition to examining system outage data, this study analyzed individual trouble tickets to look at component failure rates for disk and tape drives. It would be useful to understand how the rates compare to each other as tape is generally accepted to be less reliable than disk. Perhaps the most important result of looking at component failure rates is to determine the relationship between component reliability and system reliability. In looking at the individual trouble tickets, it became apparent that there was insufficient information to indicate the action taken for the failed components. For example, in some cases the information available did not specify whether the vendor or administrator replaced the failed component or returned it to service. Experience in managing many different models and makes of disk systems in production and by several vendors own admittance there exists a wide variance between disk products in when disks are failed by the product. In practice, this means that a failed disk on vendor A’s product might normally result in simply reseating or power-cycling the disk to clear the fault and returning it to service, where a failed disk on vendor B’s product might normally mean a permanent malfunction requiring replacement. Enterprise class tape drives often require different care and attention in both determining and handling failures. The most common failures on tape drives are caused by tape cartridges (media error.) A significant number of tape drives are returned to service even though the drive failed, because the vendor is unable to detect or reproduce the fault after reinitializing or power cycling the drive and running diagnostics. One advantage of tape over disk is that tape is a removable medium. Therefore, failures are less disruptive than disk faults to the availability of data or capability of the overall system. With rare exception, a replaced tape drive indicates a hardware fault.
1 It should be pointed out that not all the weekly scheduled downtimes are 100% software related; any pending hardware upgrades are also performed during this time but the ticket is tagged as software.

8
Given these differences, this study only selected trouble tickets that indicated drive replacement in order to compare similar failure statistics for tape and disk drives. Seaborg Component Failure The annual replacement rate of disk drives for Seaborg shows a rate of about 1.5% per year. This is lower than the observed values of 2-6% in other studies of disk failures [1][2]. The population of disks in this study is smaller than the other studies and from a single vendor. It is also possible that not all disk replacement instances have been captured in this study. For example, hardware technicians may have performed proactive replacement based on tracking drive correctable errors prior to being reported or detected as a drive failure. This kind of maintenance is not accounted for in this study. Figure 9 shows the total number and percentage of disk drives replaced in Seaborg. Total number of disks in the system over time was used to normalize the data. To better understand the failure trend shown in Figure 9, we looked at the addition of new disks to the system over time and the monthly replacement rate of the components.
Fig. 9: Disk failure on Seaborg
Figure 10 shows the number of disks added to the system each year. The majority of disks are of SSA type and only 120 Fibre Channel disks were added in mid 2004.

9
Fig. 10: Total number of disks in Seaborg Figure 11 shows the monthly disks replacement by disk type. The large number of failures in 2003 can be explained as a combination of drive age and “infant mortality” of new drives added in 2003. This also explains the low replacement rate in 2004. The rate increases as drives get “older” leading to an increase in replacement rate in 2006.
Fig .11: Monthly disk replacement in Seaborg HPSS Component Failure The High Performance Storage System (HPSS) statistics included in this report are combined from two separate petabyte mass storage systems running the HPSS software. Each storage system consists of six servers: a core server, a user interface machine, and several movers. The core server’s purpose is to manage metadata for HPSS. The user interface machine provides a platform to host user connections to the storage system. Movers’ primary purpose is to provide users with high bandwidth, low latency, network available disk or tape.
10
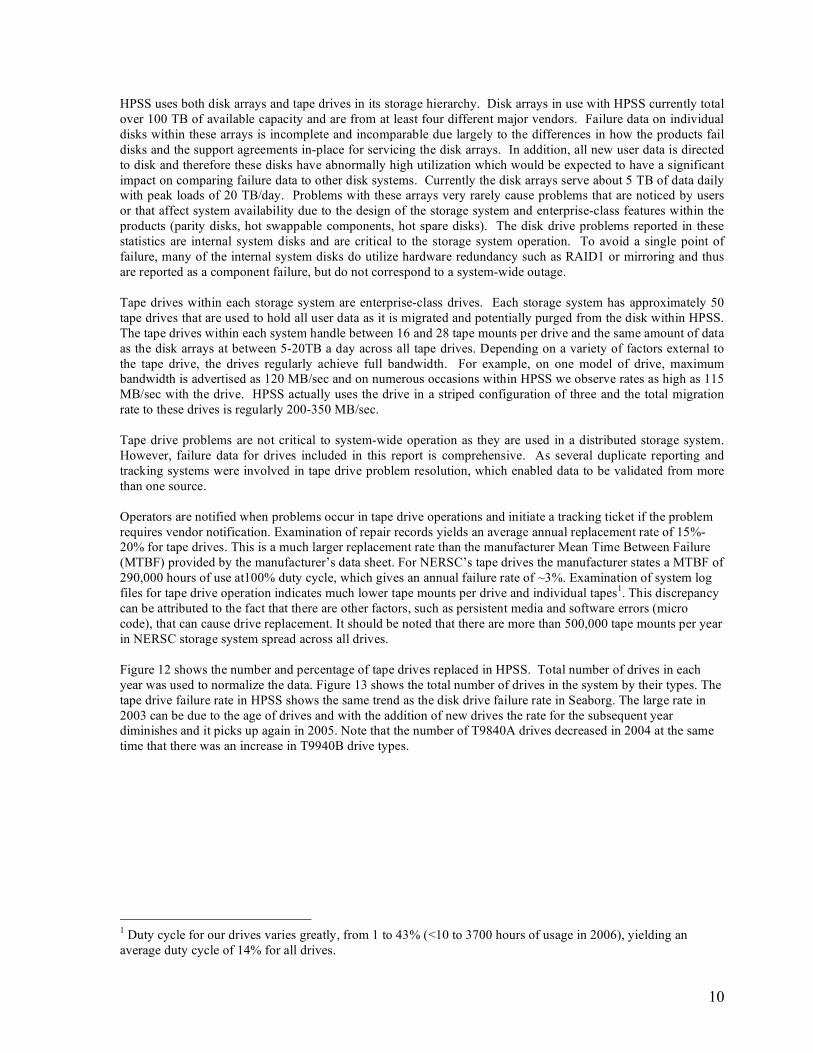
HPSS uses both disk arrays and tape drives in its storage hierarchy. Disk arrays in use with HPSS currently total over 100 TB of available capacity and are from at least four different major vendors. Failure data on individual disks within these arrays is incomplete and incomparable due largely to the differences in how the products fail disks and the support agreements in-place for servicing the disk arrays. In addition, all new user data is directed to disk and therefore these disks have abnormally high utilization which would be expected to have a significant impact on comparing failure data to other disk systems. Currently the disk arrays serve about 5 TB of data daily with peak loads of 20 TB/day. Problems with these arrays very rarely cause problems that are noticed by users or that affect system availability due to the design of the storage system and enterprise-class features within the products (parity disks, hot swappable components, hot spare disks). The disk drive problems reported in these statistics are internal system disks and are critical to the storage system operation. To avoid a single point of failure, many of the internal system disks do utilize hardware redundancy such as RAID1 or mirroring and thus are reported as a component failure, but do not correspond to a system-wide outage. Tape drives within each storage system are enterprise-class drives. Each storage system has approximately 50 tape drives that are used to hold all user data as it is migrated and potentially purged from the disk within HPSS. The tape drives within each system handle between 16 and 28 tape mounts per drive and the same amount of data as the disk arrays at between 5-20TB a day across all tape drives. Depending on a variety of factors external to the tape drive, the drives regularly achieve full bandwidth. For example, on one model of drive, maximum bandwidth is advertised as 120 MB/sec and on numerous occasions within HPSS we observe rates as high as 115 MB/sec with the drive. HPSS actually uses the drive in a striped configuration of three and the total migration rate to these drives is regularly 200-350 MB/sec. Tape drive problems are not critical to system-wide operation as they are used in a distributed storage system. However, failure data for drives included in this report is comprehensive. As several duplicate reporting and tracking systems were involved in tape drive problem resolution, which enabled data to be validated from more than one source. Operators are notified when problems occur in tape drive operations and initiate a tracking ticket if the problem requires vendor notification. Examination of repair records yields an average annual replacement rate of 15%-20% for tape drives. This is a much larger replacement rate than the manufacturer Mean Time Between Failure (MTBF) provided by the manufacturer’s data sheet. For NERSC’s tape drives the manufacturer states a MTBF of 290,000 hours of use at100% duty cycle, which gives an annual failure rate of ~3%. Examination of system log files for tape drive operation indicates much lower tape mounts per drive and individual tapes1. This discrepancy can be attributed to the fact that there are other factors, such as persistent media and software errors (micro code), that can cause drive replacement. It should be noted that there are more than 500,000 tape mounts per year in NERSC storage system spread across all drives. Figure 12 shows the number and percentage of tape drives replaced in HPSS. Total number of drives in each year was used to normalize the data. Figure 13 shows the total number of drives in the system by their types. The tape drive failure rate in HPSS shows the same trend as the disk drive failure rate in Seaborg. The large rate in 2003 can be due to the age of drives and with the addition of new drives the rate for the subsequent year diminishes and it picks up again in 2005. Note that the number of T9840A drives decreased in 2004 at the same time that there was an increase in T9940B drive types.
1 Duty cycle for our drives varies greatly, from 1 to 43% (<10 to 3700 hours of usage in 2006), yielding an average duty cycle of 14% for all drives.

11
Figure 12: HPSS Tape Drive Replaced
Figure 13: Number of tape drives in HPSS
Figure 14 is the monthly number of drives replaced. It should be noted that some older drives still in good operating conditions were replaced with newer types, which might slightly skew the MTBF for tape drives.

12
Figure 14: Tape drives replaced per month
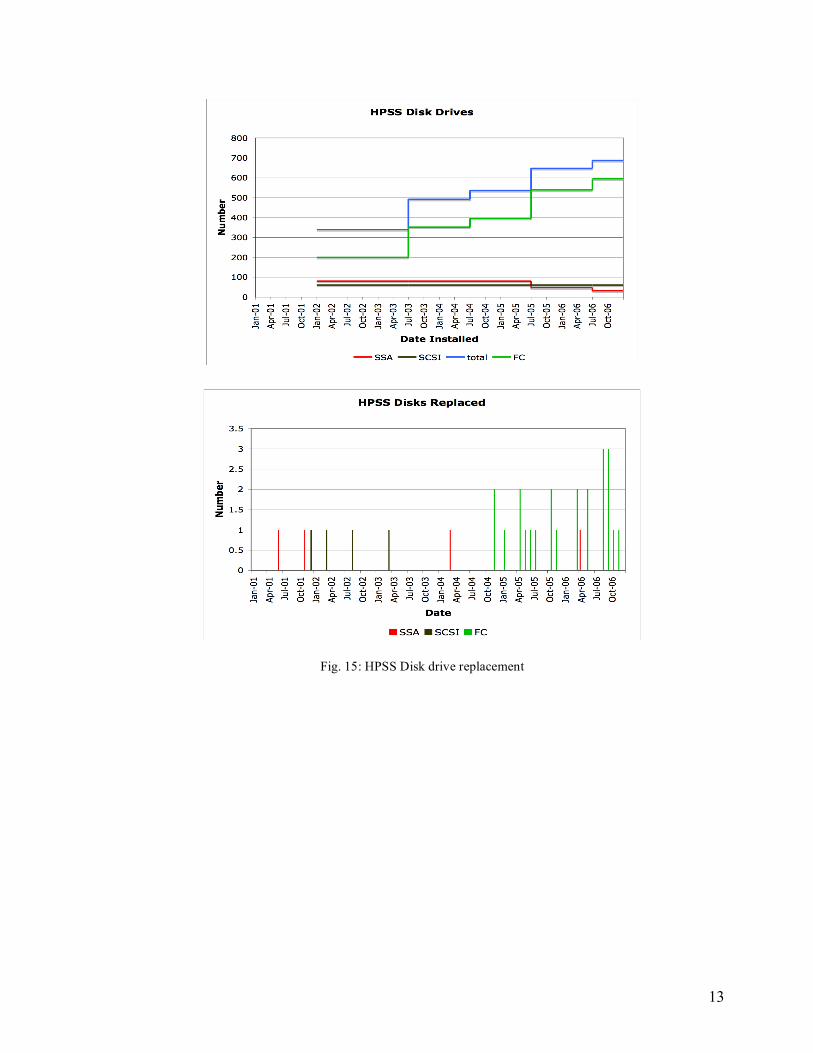
Disk replacement rate in HPSS systems gives a lower rate (< 1%) than expected due in part to insufficient repair records in the database. The disk faults in the HPSS system reported in this study represent the percentage of failed drives and do not take into account replacement statistics or service life of disks or their components. At various times, entire disk arrays were upgraded or replaced with newer hardware without repair record. Figure 15 shows a set of plots corresponding to disk drive failures, internal and external, in HPSS.
13
Fig. 15: HPSS Disk drive replacement
14
The tape drive rate is closer to the actual number of expected failed drives than the disk drive rate. The reason being that operators are notified about any malfunction in tape drives, from micro code error to physical failure of the drive to loading/unloading of tape cartridges. Disk drives (mainly used in RAID arrays), on the other hand, are more fault tolerant and are maintained and/or serviced without reporting to the operators. For example, mandatory visual inspections three times daily can reveal a problem that can be fixed on the spot without initiating a tracking ticket. This resulted in a lower count of disk replacement. Available repair records were examined to extract as much information as possible. Although the data doesn’t comprise a comprehensive measure of disk drive failure rate, it still shows a trend that is worth analyzing.
Additional Findings
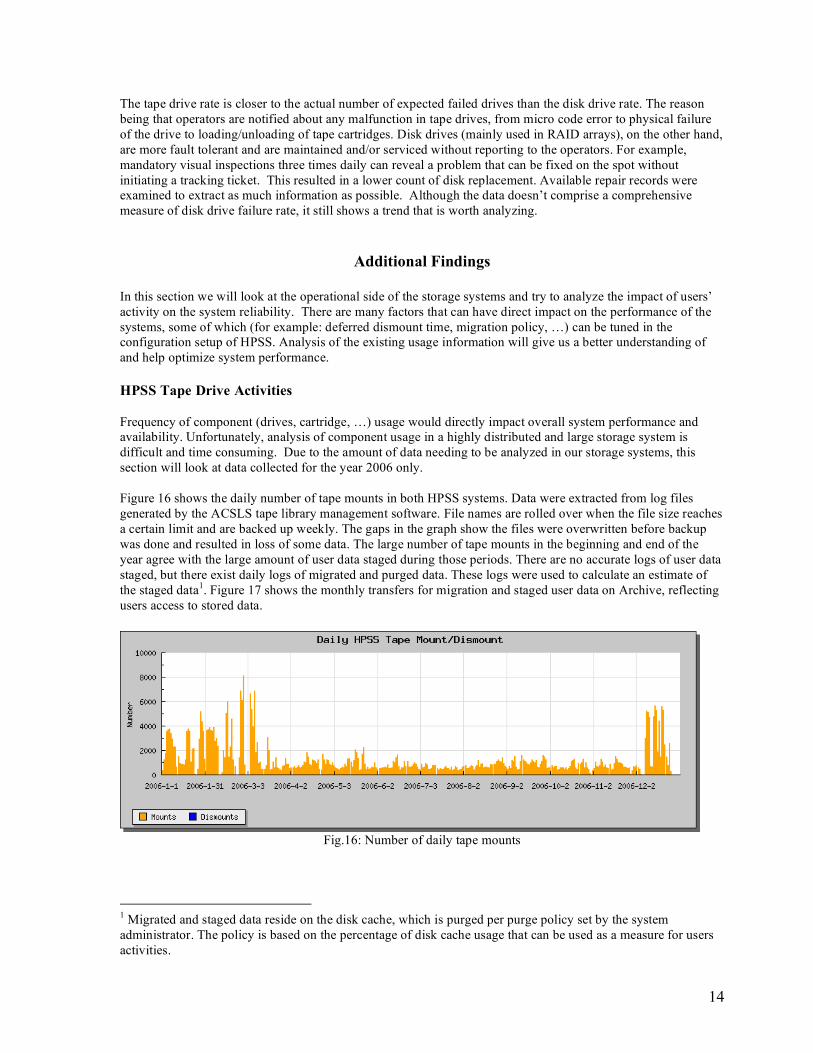
In this section we will look at the operational side of the storage systems and try to analyze the impact of users’ activity on the system reliability. There are many factors that can have direct impact on the performance of the systems, some of which (for example: deferred dismount time, migration policy, …) can be tuned in the configuration setup of HPSS. Analysis of the existing usage information will give us a better understanding of and help optimize system performance. HPSS Tape Drive Activities Frequency of component (drives, cartridge, …) usage would directly impact overall system performance and availability. Unfortunately, analysis of component usage in a highly distributed and large storage system is difficult and time consuming. Due to the amount of data needing to be analyzed in our storage systems, this section will look at data collected for the year 2006 only. Figure 16 shows the daily number of tape mounts in both HPSS systems. Data were extracted from log files generated by the ACSLS tape library management software. File names are rolled over when the file size reaches a certain limit and are backed up weekly. The gaps in the graph show the files were overwritten before backup was done and resulted in loss of some data. The large number of tape mounts in the beginning and end of the year agree with the large amount of user data staged during those periods. There are no accurate logs of user data staged, but there exist daily logs of migrated and purged data. These logs were used to calculate an estimate of the staged data1. Figure 17 shows the monthly transfers for migration and staged user data on Archive, reflecting users access to stored data.
Fig.16: Number of daily tape mounts
1 Migrated and staged data reside on the disk cache, which is purged per purge policy set by the system administrator. The policy is based on the percentage of disk cache usage that can be used as a measure for users activities.

15
Figure 17: HPSS Monthly Transfers
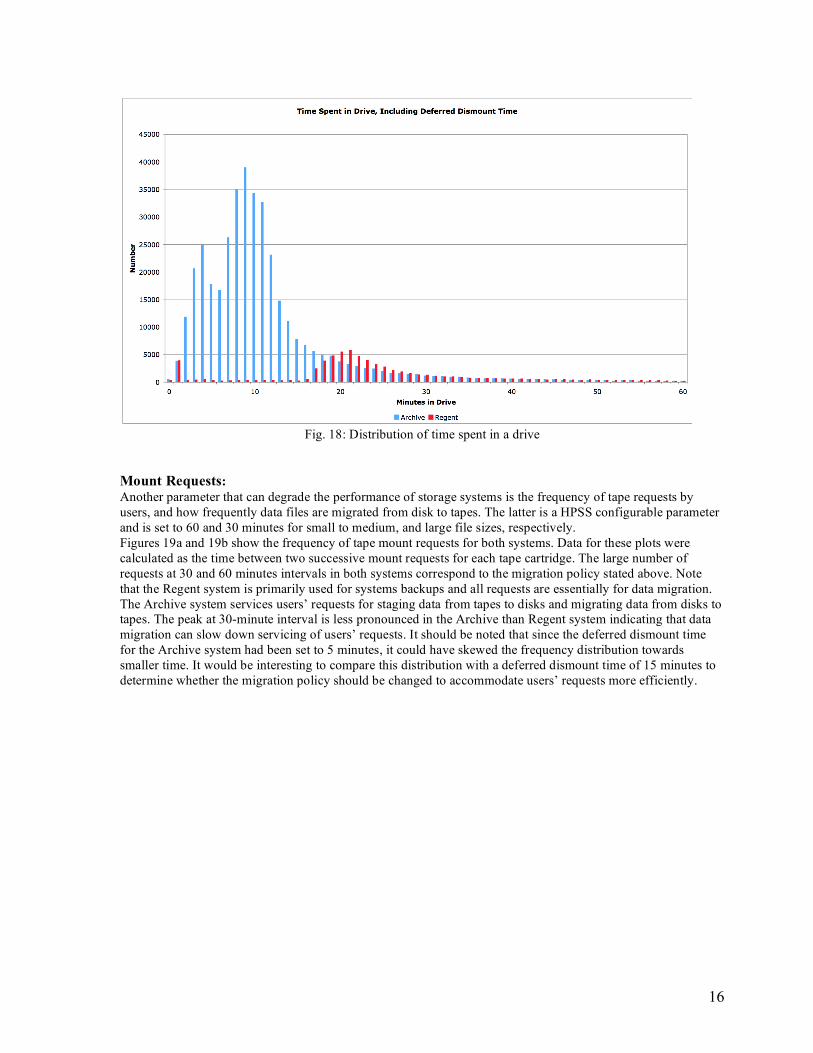
For the following analysis only matched1 mount/dismount operations are considered. This results in about 17% loss of drive operation (# of mounts (492196), # of dismounts (565555), # of matched (474030)). This is the first time NERSC has analyzed its tape mount/dismount activity over a long period of time. Discovering the gaps in available information allowed the storage group to adjust the size of the log files that retain the mount and dismount records to avoid data loss in the future. Deferred Dismount Time: One of the configuration parameters in HPSS is the deferred-dismount-time, which is the time a cartridge stays in a drive from the last I/O request until it is dismounted by the system. Mount and dismount times account for most of the delay considering time to first byte for tape operations. The deferred dismount setting assumes that multiple requests for the same tape are more common than requests for data spread out across multiple tapes. If the setting is just right, requests for data can be fulfilled more efficiently. This parameter can also be used to determine whether there is a race for tape drives. If one calculates the amount of time tapes spend in the drives before dismount, any time less than this parameter indicates contention for tape drives. Figure 18 shows the distribution of time each cartridge spent in a drive for both systems. Initially both systems were set for 15 minutes deferred dismount time, and from the plot one infers that there is large contention for tape drives in the Archive system. Upon examination of the configuration file for the Archive system, it was discovered that this parameter had been changed to 5 minutes. Taking the 10-minute offset into account, the distribution shows contention for tape drives about 15% of the time.
1 All the entries were ordered in time and for each mount of a given tape volume the records were searched for a dismount of the same volume and the same drive. If another mount was found before finding the dismount that entry was discarded
16
Fig. 18: Distribution of time spent in a drive
Mount Requests: Another parameter that can degrade the performance of storage systems is the frequency of tape requests by users, and how frequently data files are migrated from disk to tapes. The latter is a HPSS configurable parameter and is set to 60 and 30 minutes for small to medium, and large file sizes, respectively. Figures 19a and 19b show the frequency of tape mount requests for both systems. Data for these plots were calculated as the time between two successive mount requests for each tape cartridge. The large number of requests at 30 and 60 minutes intervals in both systems correspond to the migration policy stated above. Note that the Regent system is primarily used for systems backups and all requests are essentially for data migration. The Archive system services users’ requests for staging data from tapes to disks and migrating data from disks to tapes. The peak at 30-minute interval is less pronounced in the Archive than Regent system indicating that data migration can slow down servicing of users’ requests. It should be noted that since the deferred dismount time for the Archive system had been set to 5 minutes, it could have skewed the frequency distribution towards smaller time. It would be interesting to compare this distribution with a deferred dismount time of 15 minutes to determine whether the migration policy should be changed to accommodate users’ requests more efficiently.

17
Fig. 19a: Frequency of tape mount requests, the Regent system
Fig. 19b: Frequency of tape mount requests, the Archive system

18
Tape Drive Utilization: There are about 100 tape drive locations in the NERSC HPSS tape library assigned to separate silos. The number and type of drives in production can vary in time and as a result not all drives are utilized uniformly. Figures 20a and 20b show the number of tape mounts for each drive location by drive type for the year 2006 (note the log scale for Regent). Note that the number of mount requests do not correspond to any specific drive, but rather the drive’s location or address within the silos; drives could be replaced or swapped out in a location.
Fig. 20a: Tape drive utilization on Regent (2006 data)
The apparent non-uniform utilization of tape drive types is due to the migration policy for files with various sizes (storage classes), and within the same drive type is attributed to the fact that the number of tapes and drives in each silo is not the same resulting in over-utilization of drives in silos with larger number of tapes and vise versa. It is also worth noting that some drives are designated as backup drives and are not utilized as often. It is also interesting to note that no correlation between drive utilization and drive failure for any location could be established at the observed level of drive usage. The manufacturer listed MTBF for tape loads is 240,000 hours @ 10 loads/day (100,000 loads), which is much larger than the observed load counts.
Fig. 20b: Tape drive utilization on Archive (2006 data)

19
The drive utilization data ideally can be employed to balance the drives and cartridges distribution among silos. This, however, is more difficult in practice since new hardware and cartridges are added to the system gradually and re-distribution of resources can be very interruptive to systems’ availability. Conclusions We have compiled all the available records pertaining to system availability and component failure for both tape and disk drives at NERSC. This report scrutinized in detail system-wide outages for two of the systems, HPSS and Seaborg. Outages for these two systems were classified as scheduled and unscheduled, and hardware or software to determine the cause of each outage. They were also categorized to understand the impact of center wide components beyond each individual system (network, power outage, etc.). The data indicate an average overall system availability of 97%-98.5%. We observe 1.5% annual replacement rate for disk drives in Seaborg. The actual annual replacement rates show failures consistent with “aging” and “infant mortality” of the devices. For the High Performance Storage System, the observed failure rate for tape drives is 15%-20%, higher than the manufacturer’s listed rate, but the overall trend is consistent with drives “aging” and “infant mortality, similar to disk drives in Seaborg. The higher replacement rate is partly due to an implicit agreement to replace a device if it fails repeatedly within a short time to avoid interruptions in system operation and loss of data. No tracking mechanism was in place to determine whether the drive actually failed or reused after returning to the vendor. Often vendors are not able to duplicate the failure in their laboratory setup and the device is returned to service. Failure rate for disk drives in HPSS is not as conclusive as in Seaborg, or tape drives rate due to inadequate records for all replaced disk drives. Majority of disk drives are in RAID systems that are fault tolerant and do not directly impact the system availability. This study confirmed the system wide reliability of our system and some shortcomings in the reporting and tracking of component failure data on systems at NERSC. Efforts are underway to improve the processes by implementing new web-based logging and monitoring systems (e.g Right Now Web and Nagios) to improve data collection. Due to the man-hours spent in doing a detailed analysis of only a subset of data and time available for analysis, we are also in the process of evaluating an appliance that allows real-time monitoring of tape drives and tape cartridge usage that provides historical data gathering and organization, automated report generation based on configured thresholds and items of interest, and a level of fault detection on tape drive and media usage not yet explored (e.g. soft errors). Examination of the operational data in the HPSS system also revealed some interesting insights into the system configuration parameters and usage patterns. We are developing a prototype utility to store the tape drive and tape volumes usage into a database for further analysis. The results can be employed to set the system parameters for optimal performance. Acknowledgment: This work was produced by the University of California, Lawrence Berkeley National Laboratory (LBNL) under Contract No. DE-AC02-05CH11231 with DOE. In collecting data on systems outage and component failure one we benefited from the help of all staff responsible for operation and administration of various systems at NERSC. They graciously provided me with all the available records and their expertise in their respective systems. We deeply appreciate their assistance and kind suggestions.
References: [1] E. Pinheir, W. D. Weber, and L.A. Barroso. Failure Trend in a large Disk Drive Population. Google Inc. In Proc. of the 5th USENIX conf. (FAST’07), Feb. 2007 [2] B. Schroeder and G. A. Gibson. Disk Failure in the Real world: What does an MTTF of 1,000,000 hours mean to you? In Proc. Of 5th USENIX conf. (FAST’07), Feb. 2007