fractal characterization of soil aggregation and fragmentation as influenced by tillage treatment
TRANSCRIPT
Fractal Characterization of Soil Aggregation and Fragmentationas Influenced by Tillage Treatment
E. Perfect* and R. L. Blevins
ABSTRACTParameters are needed to quantify tillage-induced changes in soil
structure. Our objective was to see if fractal parameters from pedmass- and number-size relations could be applied to quantify suchchanges. Soil from long-term conventional (moldboard plow, MP,plus two passes with a disk harrow, DH) and no-till (NT) plots on aMaury silt loam (fine, mixed, mesic Typic Paleudalf) was air driedand sieved into six size classes ranging from 0.5-1 to 16-31.5 mm.The mass percentage and weight of 100 peds in each size class wereused to calculate the mean mass per ped and number of peds as afunction of scale. Fractal equations were then fitted to both data sets(R2 always a 0.99). The resulting parameter estimates were Dm (massfractal dimension) and Am (mass of an aggregate of unit length) forthe mass-size relation, and D, (fragmentation fractal dimension) and k,(number of fragments of unit length) for the number-size distribution.Significant tillage effects were observed for Dm, D,, and k,. The Dmincreased from 2.88 for NT to > 2.94 for MP and DH, suggestingdifferential compaction of large aggregates by plowing and disking.The /), was always less than the Dm as predicted by theory. Soilfragmentation was least for NT (D, = 2.02) and greatest for MP (D, =2.55); for DH, the D, = 2.15 suggesting that disking broke up largefragments and/or coalesced small fragments following plowing. Thekt, which was shown to be nonlinearly related to the Dt, was least forMP and greatest for NT. Similar studies on other soils are needed totest the general applicability of these fractal relations to soil structure.
SOIL STRUCTURE is critical for the germination andgrowth of plants (Braunack and Dexter, 1989a,b),
and for the transport of water and contaminants throughthe unsaturated (vadose) zone underlying agriculturalfields (Thomas and Phillips, 1979; Bevan and Germann,1982). Agricultural chemicals and fecal pathogens fromland-applied animal waste that are not lost in runoffmust pass through this zone to reach groundwater. How-ever, current models to predict transport processeswithin the vadose zone are unsatisfactory because theywere developed without regard for soil structure (Spo-sito et al., 1986; Germann, 1988).
Soil structure may be defined as "the spatial heteroge-neity of the different components or properties of soil"(Dexter, 1988). In other words, it is the variation ofsolids and voids as a function of scale that defines soilstructure. This definition accommodates the many dif-ferent aspects of soil structure that are manifest at differ-ent spatial scales within the vadose zone. In this study,the terms ped and clod are used interchangeably todenote a discrete structural unit, while the terms aggre-gate and fragment are reserved for structural units cre-ated by aggregation (building up) and fragmentation(breaking down) mechanisms, respectively.
Tillage practices have a major impact on soil structure,
Department of Agronomy, University of Kentucky, Lexington, KY 40546-0091. Kentucky Agric. Exp. Stn. Contribution no. 96-06-027. Received 15Apr. 1996. "Corresponding author ([email protected]).
Published in Soil Sci. Soc. Am. J. 61:896-900 (1997).
and hence on crop growth and infiltration. Numerousstudies have been conducted to evaluate the effects oftillage on different macromorphological parameters, in-cluding aggregate-size distribution, wet-aggregate sta-bility, total porosity, and pore-size distribution (see Kay[1990] and Blevins and Frye [1993] for recent reviews).Other researchers (e.g., Drees et al., 1994) have studiedthe micromorphological characteristics of conventional-and no-till soils, and have observed differences in thesize, shape, and arrangement of pores and aggregates.
Many of the parameters currently employed to char-acterize soil structure (e.g., mean weight diameter) areempirical in nature (Kemper and Rosenau, 1986). Therecent application of fractals (geometric models withscale-invariant heterogeneities) to soils permits a morephysically based approach. This approach has consider-able potential for quantifying seedbed conditions, aswell as for improving prediction of transport processesin structured soils (Perfect and Kay, 1995).
Fractals can be used to characterize both soil aggrega-tion and fragmentation (Rieu and Sposito, 1991a,b; Per-fect and Kay, 1995). In the case of fractal aggregation,soil bulk density changes as a function of scale, givingrise to the following power law relationship betweenmass, A/, and length, /, assuming shape is independentof scale (Bartoli et al., 1991; Young and Crawford, 1991):
M = (O < Dm < 3) [1]where Dm and km are constants corresponding to themass fractal dimension and mass of an aggregate of unitlength, respectively. The smaller the value of Dm, thegreater the scale dependency of aggregate density.
Equation [1] was investigated by Young and Craw-ford (1991), who showed that Dm increased from 2.75before tillage to 2.93 after rotary cultivation. Thus, inaddition to changing the fragment-size distribution, till-age may also alter the mass-size relationship of individ-ual peds.
Fractals can also be used to quantify the intensityof soil fragmentation caused by cultivation. Assumingfragment shape is scale invariant, the relevant relation-ship is (Turcotte, 1989):
= DlN = kf (O < Df < 3) P]where N is number of fragments of length /, and Dfand kf are constants corresponding to the fragmentationfractal dimension and number of fragments of unitlength, respectively. The larger the value of Df, thegreater the degree of soil fragmentation. In the limit / — >O, the constants in Eq. [2] are related by (Perfect, 1997):
kf = - 1 LDl [3]
Abbreviations: MP, moldboard plow; DH, disk harrow; NT, no-till; Dmand km mass fractal dimension and mass of an aggregate of unit lengthfor the mass-size relation; DI and kt, fragmentation fractal dimension andnumber of fragments of unit length for the number-size distribution.
896
PERFECT & BLEVINS: FRACTAL CHARACTERIZATION OF AGGREGATION AND FRAGMENTATION 897
where b is a scaling factor >1 and L is the length ofthe structural units (initiators) before fragmentation.
Eghball et al. (1993) applied Eq. [2] to soil peds, andfound significant differences in both constants due totillage treatment and sampling time. Perfect et al. (1994)observed greater fragmentation of no-till peds than con-ventional-till peds after crushing between parallel flatplates to the same energy level. Hallet et al. (1995)showed the Df of natural peds, fragmented under adynamic load using an impact rig, increased with re-duced antecedent wheel traffic, and with increasing im-pact velocity. These researchers also reported that theD( of remolded clods, fragmented using the same impactrig, increased with increasing macroporosity.
Equation [2] was derived for the fragmentation ofa Euclidean cubic initiator (Turcotte, 1989). Such aninitiator is unrealistic for soil aggregates, which are bet-ter modeled by fractal geometry than by Euclidean ge-ometry (Rieu and Sposito, 1991a,b; Young andCrawford, 1991). Recently, Perfect (1997) has shownthat Eq. [2] also holds for the fragmentation of a fractalcubic initiator, the Menger sponge. In this case, therelationship between Dm from Eq. [1] and Df from Eq.[2], assuming / —» O, is given by (Perfect, 1997):
Df = Dm [4]where P is the scale-invariant probability of failure. ForP = 1, fragmentation is complete and Ds = Dm, otherwiseDs < Dm.
Rieu and Sposito (1991a) derived an alternative rela-tionship between D, and Dm, assuming the probabilityof failure was scale dependent. Crawford et al. (1993)explored theoretical relations between D( and the sur-face fractal dimension of irregular solids, assuming bothscale-invariant and scale-dependent probabilities of fail-ure. However, experimental evidence of a relationshipbetween Df and Dm is lacking. Previous experimentalstudies (e.g., Young and Crawford, 1991; Eghball et al.,1993) have applied either Eq. [1] or [2] independently.The objectives of this study were to: (i) test the applica-bility of both equations using the same data set, (ii)investigate the influence of tillage treatment on the frac-tal parameters km, Dm, kf, and Dt, and (iii) examinerelations between these parameters using Eq. [3] and [4].
MATERIALS AND METHODSThe field site is on the University of Kentucky Experiment
Station research farm, near Lexington. The soil is a Maurysilt loam (fine, mixed, mesic Typic Paleudalf) with 1 to 3%slope. Samples were taken from a long-term experiment, initi-ated in 1970 to investigate the influence of tillage, N fertilizerrate, and cover crop on soil properties and corn (Zea maysL.) yields (Ismail et al., 1994). The experimental design wasa split block with four replications. The treatments selectedfor study were conventional- and no-till continuous corn, fertil-ized at a rate of 168 kg N ha"1 yr~', with hairy vetch (Vidavillosa Roth) as the winter cover crop for the past 10 yr.Conventional-till consisted of moldboard plowing (to a depthof 20 to 25 cm) and disking (to a depth of 8 to 10 cm) in lateApril each year. No tillage operations were performed in theno-till treatment.
Soil chemical and physical properties were determined for
the O- to 8-cm layer of each field replicate using standardmethods employed by the Division of Regulatory Services,University of Kentucky, Lexington.
Samples for the soil structural analyses were taken in theconventional-till plots immediately after plowing with a Ford150 three-bottom moldboard plow (MP), and again after twopasses with an International 122 tandem disk harrow (DH).Samples were also taken from nontrafficked interrows of theno-till plots (NT). A shovel was used to collect the soil samplesas described by Kemper and Rosenau (1986). The samplingdepth was approximately O to 18 cm in the MP treatment, andapproximately O to 8 cm in the DH and NT treatments. Thegreater sampling depth in MP was necessitated by the presenceof many large clods immediately following plowing. Four sub-samples (each approximately 4.5 kg dry weight for MP and2.5 kg dry weight for DH and NT) were obtained from eachfield replicate. The soil was bagged at field moisture contentand placed in rigid, stackable containers to reduce compactionduring transportation and storage. All of the tillage operationsand soil sampling were done on 25 Apr. 1995.
Immediately after sampling, the soil was spread out on traysin a greenhouse and air dried to constant weight. The moisturecontent was measured gravimetrically before and after airdrying. The air-dried soil was separated into nine size classesusing a nest of sieves, shaken for 60 s at 2-mm amplitude on aFritsch (Model Analysette 3, Fritsch GmbH Laborgeratebau,Oberstein, Germany) vibratory sieve shaker. The aperturesof the sieves used were: 0.25, 0.5, 1, 2, 4, 8,16, and 31.5 mm.The mass percentage in each fraction corrected for air-drymoisture content (F/) was determined gravimetrically.
One hundred peds from the 0.5- to 1-, 1- to 2-, 2- to 4-, 4-to 8-, 8- to 16-, and 16- to 31.5-mm fractions of each fieldreplicate were counted out and weighed. To minimize sam-pling bias due to possible size segregation effects in the bulksieved fractions, peds were chosen at random from a singlelayer spread out on a flat surface. The weights (W,) wereadjusted for differences in the air-dry moisture content. Themean individual ped mass for each fraction (M,) was thencalculated as W//100. The number of peds in each fraction per100 g of bulk soil (N,) was estimated by F-jMt.
In order to fit Eq. [1] and [2] to the sieving data, it isnecessary to know the relationship between modal ped lengthin the /th fraction, /,, and the upper and lower sieve aperturesfor that fraction, xt-\ and Jt,, respectively. Rieu and Sposito(1991b) and Perfect et al. (1992) assumed that /, ^ (jt, + x,-i)l2. In contrast, Perfect and Kay (1991) showed that if the pedsize distribution is continuous and fractal between the upperand lower sieves, then /, = [(JC,)"D( - (^,-i)"Dt]~"Df or /, =*/(! - b~D')~l'Dl, where *,-_, = bx,. In this case, /, is betterapproximated by z, than by (x( + *,--i)/2 for b and D > 2.Since most published estimates of b and D meet these criteria(Perfect and Kay, 1995), we assumed / = /,• ~ x,.
Using MI and x, as estimates of M and /, respectively, Eq.[1] was log-transformed and fitted to the data using linearregression analysis as described by Young and Crawford(1991). All of the fits were excellent (adjusted R2 > 0.992).The resulting slope is equal to Dm, while km was back-calcu-lated from the intercept (A ) as 104. Log-transformation andlinear regression analysis of Eq. [2] yields biased estimates ofD, and kt (Perfect et al., 1994). Thus, Eq. [2] was fitted bynonlinear regression analysis (multivariate secant method,SAS Institute, 1988) using N, and x, as estimates of N and /,respectively. These fits were also excellent (adjusted R2 20.996). Altogether, 24 fits were performed (2 equations X 3tillage treatments X 4 replications), providing 12 estimates ofeach fractal parameter. Equations [3] and [4] were fitted tothese estimates nonlinearly using the same method as before.
SOIL SCI. SOC. AM. J., VOL. 61, MAY-JUNE 1997
Table 1. Soil chemical and physical properties for the O- to 8-cm sampling depth.
Treatment!Cation-exchange
capacity Organic C pH Sand Silt Clay
NTMP and DH
cmol, kg20.6at14.2a
gkg '28aISb
5.9a6.2a
6.7a6.1a
71.4a70.3a
21.9b23.6a
t NT is no-till, MP is moldboard plow, and DH is moldboard plow followed by two passes with a disk harrow.t Column means with different letters are significantly different at the 0.05 probability level according to a protected (-test.
Analyses of variance were performed using the GeneralLinear Models procedure (SAS Institute, 1988). Unless other-wise noted, statistical significance was always at the 0.05 proba-bility level.
RESULTS AND DISCUSSIONSoil organic C content was higher in NT than in MP
and DH, while clay content was higher in MP and DHthan in NT (Table 1). These trends are consistent withprevious results for this long-term experiment (Dreeset al., 1994; Ismail et al., 1994), and can be explainedin terms of soil inversion and mixing under conven-tional-till, compared with soil stratification under no-till.
There were significant differences in soil moisturecontent between the tillage treatments, both at samplingand after air drying (Table 2). The moisture content atsampling decreased with increasing tillage intensity.This trend can probably be explained by differences insoil loosening and residue cover. Cultivation increasesthe surface area of bare soil exposed to the atmosphere,and thus increases evaporative losses of soil moisture. Interms of moisture content after air drying, the cultivatedsoils were significantly drier than the no-till soil (Table2). This result may be attributable to the higher organicC content of the no-till soil. Water retention would beexpected to increase with increasing organic C content.
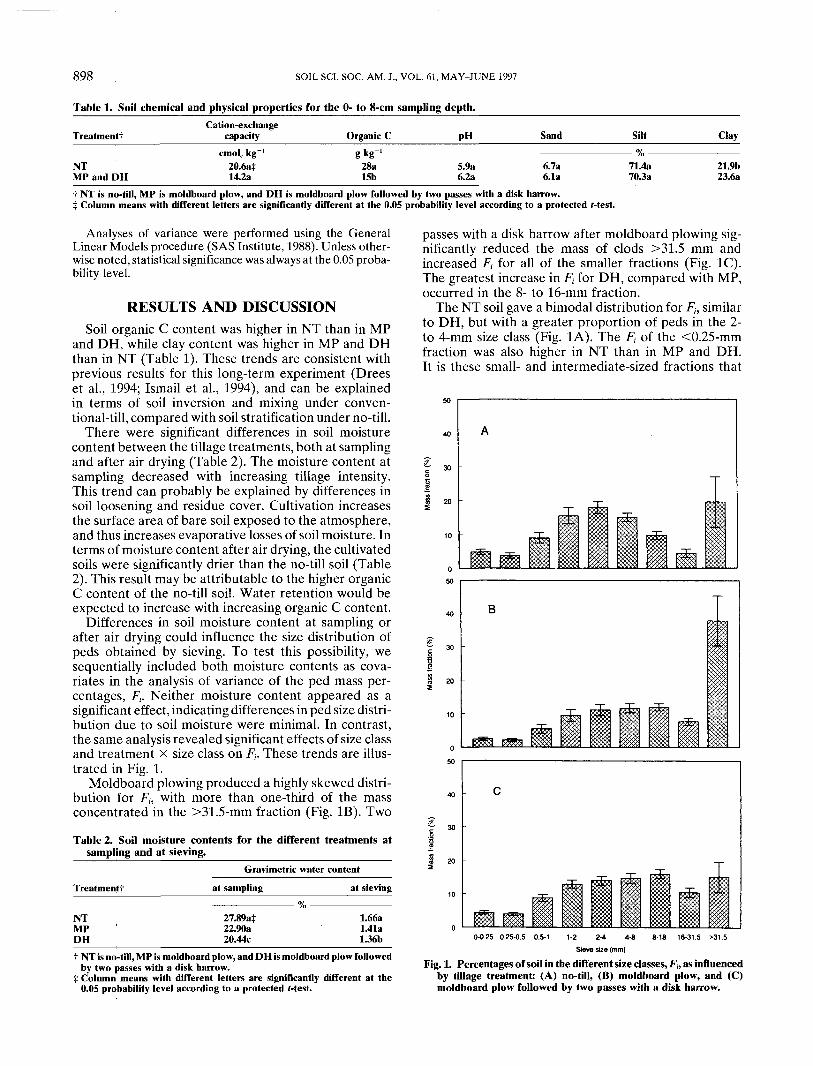
Differences in soil moisture content at sampling orafter air drying could influence the size distribution ofpeds obtained by sieving. To test this possibility, wesequentially included both moisture contents as cova-riates in the analysis of variance of the ped mass per-centages, F,. Neither moisture content appeared as asignificant effect, indicating differences in ped size distri-bution due to soil moisture were minimal. In contrast,the same analysis revealed significant effects of size classand treatment X size class on F/. These trends are illus-trated in Fig. 1.
Moldboard plowing produced a highly skewed distri-bution for Fh with more than one-third of the massconcentrated in the >31.5-mm fraction (Fig. IB). Two
Table 2. Soil moisture contents for the different treatments atsampling and at sieving._______________________
Gravimetric water content
Treatment! at sampling at sieving
NTMPDH
27.893$22.90a20.44c
1.66a1.41a1.36b
passes with a disk harrow after moldboard plowing sig-nificantly reduced the mass of clods >31.5 mm andincreased F/ for all of the smaller fractions (Fig. 1C).The greatest increase in F, for DH, compared with MP,occurred in the 8- to 16-mm fraction.
The NT soil gave a bimodal distribution for F, similarto DH, but with a greater proportion of peds in the 2-to 4-mm size class (Fig. 1A). The F, of the <0.25-mmfraction was also higher in NT than in MP and DH.It is these small- and intermediate-sized fractions that
t NT is no-till, MP is moldboard plow, and DH is moldboard plow followedby two passes with a disk harrow.
I Column means with different letters are significantly different at the0.05 probability level according to a protected (-test.
0-0.25 0.25-0.5 0.5-1 1-2 2-4 4-8 8-16 16-31.5 >31.5Sieve size (mm)
Fig. 1. Percentages of soil in the different size classes, /•',-. as influencedby tillage treatment: (A) no-till, (B) moldboard plow, and (C)moldboard plow followed by two passes with a disk harrow.
PERFECT & BLEVINS: FRACTAL CHARACTERIZATION OF AGGREGATION AND FRAGMENTATION 899
influence germination and emergence of many cropplants, including corn (Braunack and Dexter, 1989b).It should also be remembered that the ped size distribu-tion for NT was produced with much less energy input(only sampling and sieving) than the distributions forMP and DH, which had been tilled to varying degreesprior to sampling and sieving.
The ped size distributions shown in Fig. 1 are quitedifferent from those obtained by microscopic imageanalysis of soil thin sections from the same experimentalplots (see Fig. 5 of Drees et al., 1994). The microscopicmeasurements spanned the range 0.05 to 1 mm, andshowed greater proportions of peds in "small" and "in-termediate" size classes for conventional- comparedwith no-till. According to fractal theory, the relativedistribution of peds observed at one scale should repeatat other scales. Extrapolation of our macroscopic resultsto the microscopic scale would predict an opposite trendto that reported by Drees et al. (1994). This discrepancyquestions the capability of Eq. [2] to characterize struc-tural conditions across a wide range of measurementscales. Keep in mind, however, there were also differ-ences in sampling times and procedures between the twostudies. We sampled immediately after tillage, whereasDrees et al. (1994) sampled after corn harvest. Wet-aggregate stability is lower under conventional-till thanunder no-till (Kay, 1990; Blevins and Frye, 1993). Thus,clods produced by spring tillage should break down inresponse to wetting-drying cycles during the growingseason, yielding a larger proportion of small peds bythe fall. In contrast, no-till peds can be expected toremain relatively stable with time (Eghball et al., 1993).Peds in the soil thin sections used by Drees et al. (1994)were undisturbed, while ours were sieved. This differ-ence in energy inputs may also partially account for thedifferent ped size distributions.
The results of fitting Eq. [1] and [2] to the sievingdata are summarized in Table 3. There was no tillageeffect on mass at the 1-mm length scale (km). However,Dm increased with increasing tillage intensity, ap-proaching 3 for the DH treatment. Young and Crawford(1991) also reported an increase in Dm with cultivation.Values of Dm <3 signify a decrease in bulk density withincreasing aggregate size. Our results (Table 3), andthose of Young and Crawford (1991), show that tillagecan significantly alter this relationship, possibly by com-pression of the largest, most porous aggregates.
The /cf, indicative of number of fragments at the1-mm length scale, was least for MP and greatest for
Table 3. Comparison of means for the parameter estimates fromEq. [1] and [2].
Eq. [1] Eq. [2]
Treatment;
NTMPDH
k*mg mm""™
2.74a$2.91a3.00a
Dm
2.88b2.94ab2.99a
k,W mm"'
6.08a3.04b4.98a
D,
2.02b2.55a2.15b
NT (Table 3). The same trend also existed in termsof the mass percentages (compare Ft for the 1-2-mmfraction in Fig. 1A and 1C). Clearly, tillage did notincrease the amount of intermediate-sized peds in thisstudy.
Moldboard plowing resulted in an increase in the Dsrelative to NT (Table 3). The Df characterizes the rateof change in fragment numbers with scale, and can beexpected to increase with increasing soil fragmentation.However, DH produced a decrease in Df relative toMP. There are three possible explanations for this result.First, the decrease could be due to the different samplingdepths. Tillage tools have a sorting effect on fragmentsin the seedbed (Braunack and Dexter, 1989b). Thus,the difference in Df between MP and DH could bedue to tillage-induced stratification of the fragment-sizedistribution. Further research is needed on the influenceof sampling depth on D,. Second, disking may havecaused smaller fragments to coalesce, while the numberof large clods remained relatively constant. Since thesoil was relatively moist (Table 2), it may have exceededits plastic limit. Support for this idea comes from theobservation that soil adhered to the disk coulters duringboth passes of the harrow. Third, it is possible thatdisking simply broke up large clods, while the propor-tions of smaller fragments remained relatively constant.In reality, the D, probably decreased due to a combina-tion of all three factors.
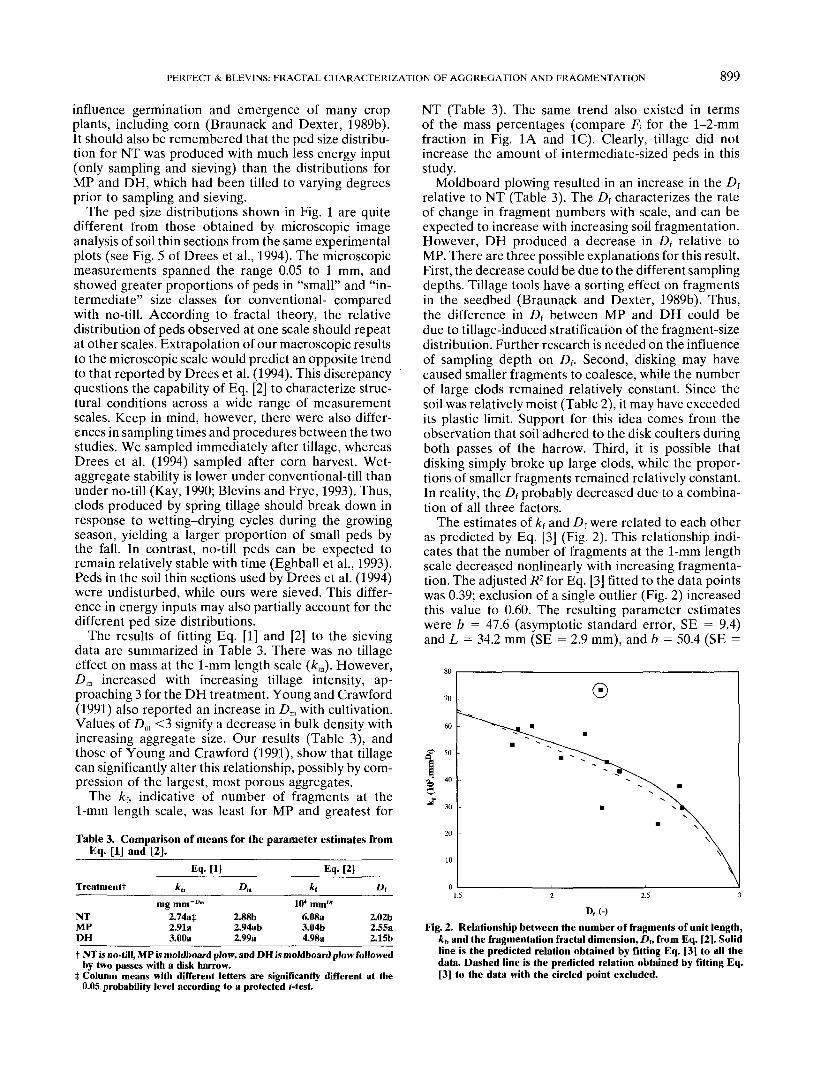
The estimates of k, and Df were related to each otheras predicted by Eq. [3] (Fig. 2). This relationship indi-cates that the number of fragments at the 1-mm lengthscale decreased nonlinearly with increasing fragmenta-tion. The adjusted R2 for Eq. [3] fitted to the data pointswas 0.39; exclusion of a single outlier (Fig. 2) increasedthis value to 0.60. The resulting parameter estimateswere b = 47.6 (asymptotic standard error, SE = 9.4)and L = 34.2 mm (SE = 2.9 mm), and b = 50.4 (SE =
f NT is no-till, MP is moldboard plow, and DH is moldboard plow followedby two passes with a disk harrow.
£ Column means with different letters are significantly different at the0.05 probability level according to a protected (-test.
Dr(-)Fig. 2. Relationship between the number of fragments of unit length,
kt, and the fragmentation fractal dimension, /)„ from Eq. [2]. Solidline is the predicted relation obtained by fitting Eq. [3] to all thedata. Dashed line is the predicted relation obtained by fitting Eq.[3] to the data with the circled point excluded.
900 SOIL SCI. SOC. AM. J., VOL. 61, MAY-JUNE 1997
7.4) and L = 32.6 mm (SE = 2.2 mm) for the outlierincluded and excluded, respectively. The values of b arehigh compared with the value of 2 assumed by Turcotte(1989), but are not inconsistent with the values predictedby Tyler and Wheatcraft (1992), which range from 34to 65 depending on soil texture. Both estimates of Lwere close to 31.5 mm, the size of the screen openingsin the uppermost sieve, implying that the prediction ofL was sensitive to the range of sieve sizes used.
As observed by Rieu and Sposito (1991b), the D, wasalways less than the Dm. According to Eq. [4], a linearrelationship should exist between Df and Dm. However,no significant correlation existed between these twoparameters. A nonlinear fit of Eq. [4] was also unsuc-cessful. Reasons for the absence of any statistical rela-tionship between D, and Dm in this study are unclear.It is possible that the probability of failure was notscale invariant. Perfect and Kay (1995) have shown thatprobabilities of failure can increase with increasing ag-gregate size. Such scale dependency would mean thatlog(P)/log(6) in Eq. [4] cannot be treated as a constant.However, the relatively good fit obtained between kfand D, using Eq. [3] suggests the assumption of a con-stant P was not unreasonable in this case. Perhaps abetter explanation for the lack of fit is the small samplesize (n = 12) and relatively narrow range of structuralconditions (three tillage treatments on the same soil)sampled in this study. It may be that a wider range ofparameter estimates, obtainable by sampling aggregatesfrom different soils, is required for a rigorous test ofEq. [4].
CONCLUSIONSWe have shown that fractal parameters can be used
to characterize both soil aggregation and fragmentation,and that these parameters are sensitive to tillage treat-ment. Aggregation in conventional- and no-till was bestrepresented using Euclidean and fractal cubic hierar-chies, respectively. Euclidean aggregates have a con-stant bulk density equal to the bulk density of theirbuilding blocks, while the bulk density of fractal aggre-gates decreases with increasing size. Moldboard plowingincreased soil fragmentation relative to no-till. This ef-fect was partially reversed by secondary cultivation,indicating that disking broke up large clods and/or coa-lesced small fragments produced by moldboard plowing.The value of fractal parameters lies in the conceptualmodels from which they are derived. By comparingthese models with reality, it is possible to gain insightinto processes responsible for soil aggregation and frag-mentation. Such tests need to be performed on differentsoil types in order to evaluate the capability of fractalmodels to characterize a wide range of structural con-ditions.
ACKNOWLEDGMENTSJohn Clark assisted with the sampling and performed all
of the aggregate analyses.