four common spectroscopic techniques used to …occc.edu/kmbailey/chem2115/lectures/unit1/ir lecture...
TRANSCRIPT

Infrared Spectroscopy
Four common spectroscopic techniques used to determine the structure of organic compounds:
Infrared Spectroscopy (IR) Mass Spectrometry (MS or Mass Spec) Nuclear Magnetic Resonance Spectroscopy (NMR)
Ultraviolet Spectroscopy

Infrared Spectroscopy
Infrared spectroscopy: Used to determine the functional groupspresent (or absent) in a molecule
http://riodb01.ibase.aist.go.jp/sdbs/ (National Institute of Advanced Industrial Science and Technology, 1/5/11)

Infrared Spectroscopy
Infrared spectroscopy is a type of absorption spectroscopy in which: Sample is irradiated by an infrared light source
The amount of light transmitted (or absorbed) at various wavelengths is measured by a detector
A spectrum is obtained.Graph of light transmitted (or absorbed) as a function of wavelength
The position of an absorption peak in the spectrum is reported in wavenumbers (u) the number of wavelengths per cm u = 10,000 where l = mm
l

Infrared Spectroscopy
The covalent bond between two atoms acts like a spring, allowing the atoms to vibrate (stretch and bend) relative to each other.
Absorption of IR radiation increases the amplitude of the bond vibrations. Stretching
SymmetricAsymmetric
Bending

Infrared Spectroscopy
Since energy is quantized, covalent bonds can vibrate/stretch only at certain allowed frequencies.
The position of a peak in an IR spectrum correlates with the type of chemical bond.

Infrared Spectroscopy
The frequency of an absorption band in an IR spectrum depends primarily on:
Type of vibrationStretching vibrations: higher frequencyBending vibrations: lower frequency
Masses of the atoms in a bond
Strength of the bond or bond order
FreqAW
FreqBO

Infrared Spectroscopy
The polarity of a bond has a significant impact on the intensity of an IR absorption band.
Vibrations that cause a significant change in the dipole moment of a chemical bond lead to strong absorption bands.
Vibrations that result in no change/very little change in dipole moment lead to very weak or no absorption band.
Symmetrical bonds often exhibit very weak or no absorption band.

Infrared Spectroscopy
Each molecule has a unique IR spectrum. The IR spectrum is a “fingerprint” for the molecule.
IR spectrum results from a combination of all possible stretching and/or bending vibrations of the individual bonds and the whole molecule. Simple stretching: ~1600-4000 cm-1. Complex vibrations: 600-1400 cm-1, called the “fingerprint region.”

Infrared Spectroscopy
IR Spectrum of n-octane

Infrared Spectroscopy
An IR spectrum is used to identify functional groups that are present (or absent). Cannot conclusively identify a structure by IR alone unless an IR spectrum of an authentic (known) sample of the compound is available.
Absorptions from specific functional groups are found in certain regions of the IR spectrum.
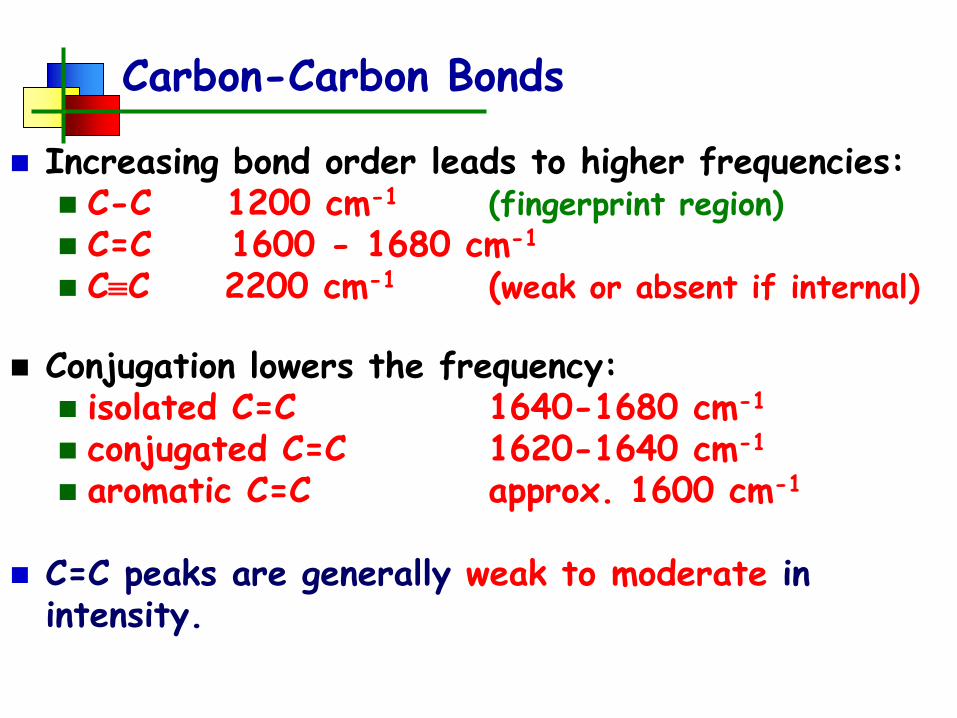
Increasing bond order leads to higher frequencies: C-C 1200 cm-1 (fingerprint region) C=C 1600 - 1680 cm-1
CC 2200 cm-1 (weak or absent if internal)
Conjugation lowers the frequency: isolated C=C 1640-1680 cm-1
conjugated C=C 1620-1640 cm-1
aromatic C=C approx. 1600 cm-1
C=C peaks are generally weak to moderate in intensity.
Carbon-Carbon Bonds

Carbon-Hydrogen Bonds
Bonds with more s character absorb at a higher frequency. sp3 (alkane) C-H
just below 3000 cm-1 (to the right)
sp2 (alkene or aromatic hydrocarbon) C-H just above 3000 cm-1 (to the left)
sp (alkyne) C-Hat 3300 cm-1


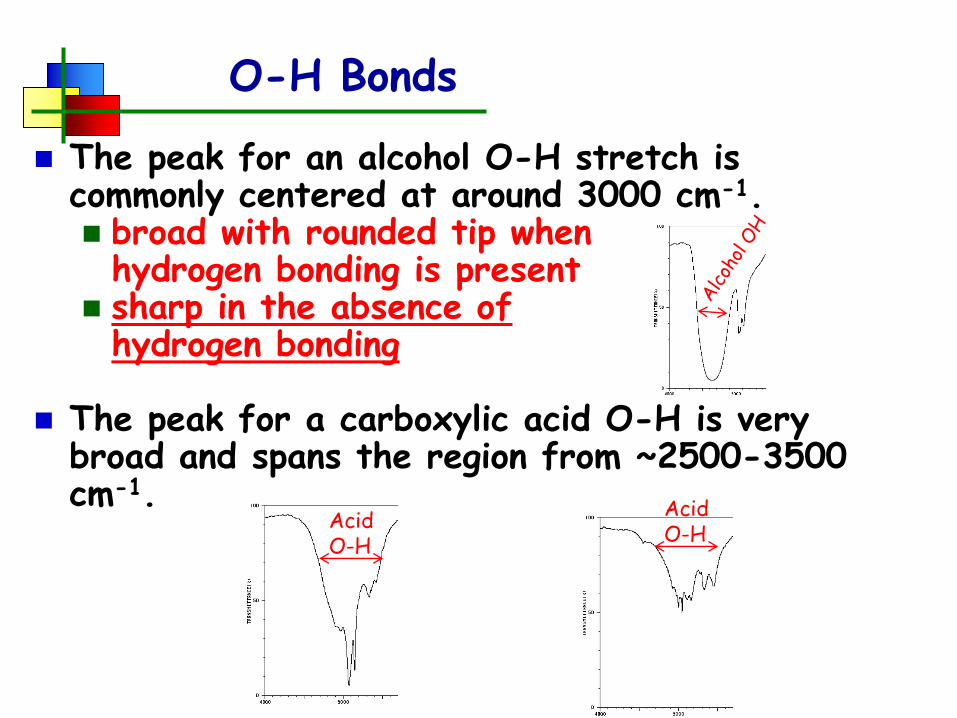
O-H Bonds
The peak for an alcohol O-H stretch is commonly centered at around 3000 cm-1. broad with rounded tip when hydrogen bonding is present
sharp in the absence of hydrogen bonding
The peak for a carboxylic acid O-H is very broad and spans the region from ~2500-3500 cm-1.
AcidO-H
AcidO-H

N-H Bonds
Peak(s) for the N-H stretch also appear around 3300 cm-1, but they usually look different from the alcohol O-H peak. Primary amine/amide (RNH2 or RCONH2) Broad (usually) with two sharp spikes.
Secondary amine/amide (R2NH or RCONHR’)Broad (usually) with one sharp spike
No signal for a tertiary amine/amide (R3N or RCONR2’)
NH2
stretch
NH stretch
NH stretch

NH Bend
A broad, round peak may be observed around 1600 cm-1 for the N – H bend, especially with primary amines.
NH2
stretch
N-H bend
N-H bend has a different shape than an aromatic ring or C=C

Carbonyls
Carbonyl stretches are generally strong:
Aldehyde ~1710 to 1725 cm-1
Ketone ~1710 cm-1
Carboxylic acid ~1710 cm-1
Ester ~1730 - 1760 cm-1
Amide ~1640-1680 cm-1
Conjugation shifts all carbonyls to lowerfrequencies.
Ring strain shifts carbonyls to higherfrequencies.
O
H3C
1745 cm-1

Aldehydes
overtone
1710-1725 cm-1

Carboxylic Acids

Ketones
overtone
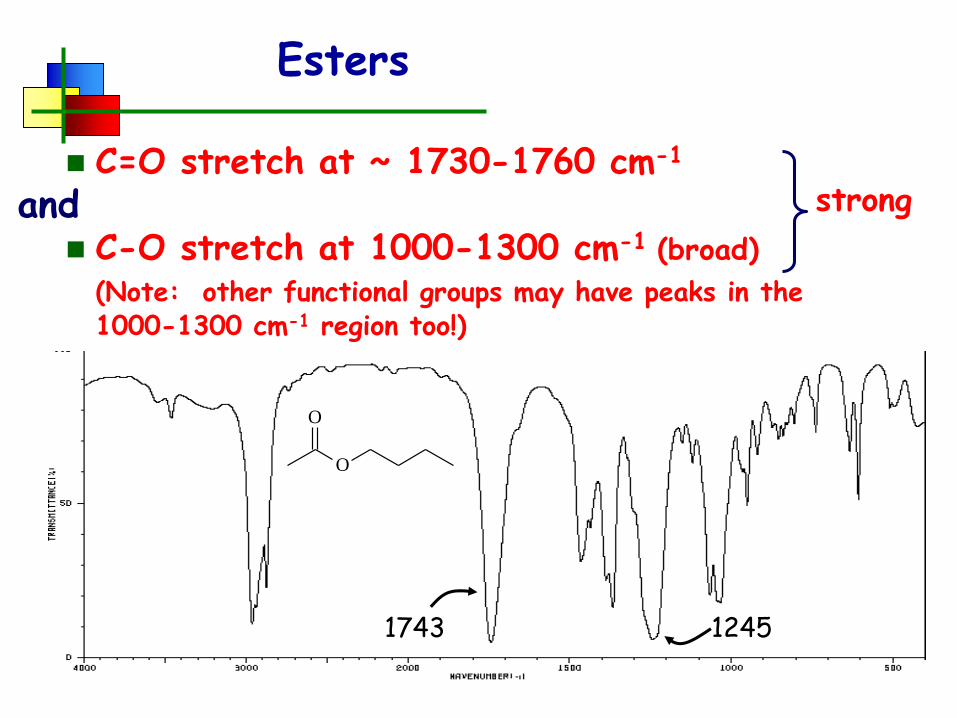
Esters
C=O stretch at ~ 1730-1760 cm-1
and C-O stretch at 1000-1300 cm-1 (broad)
(Note: other functional groups may have peaks in the 1000-1300 cm-1 region too!)
1743 1245
strong
O
O

Amides
C=O stretch at 1640-1680 cm-1 (sometimes a double peak)
N-H stretch (if 1o or 2o) around 3300 cm-1

Nitriles
C N absorbs just above 2200 cm-1 (med – strong)
The alkyne C C signal is much weaker and is just below 2200 cm-1
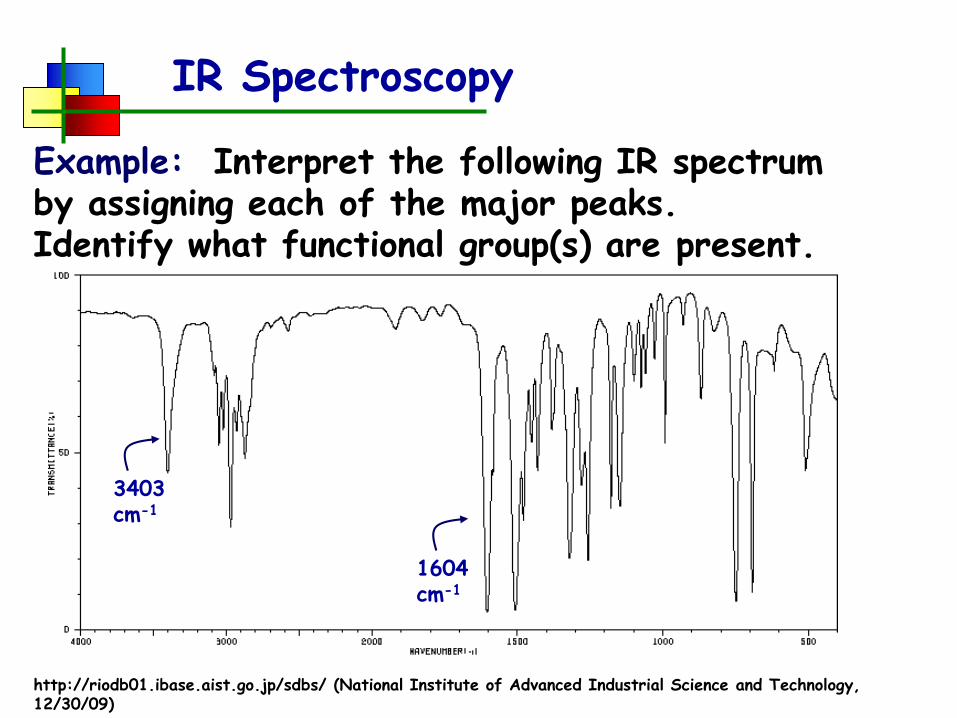
IR Spectroscopy
Example: Interpret the following IR spectrum by assigning each of the major peaks. Identify what functional group(s) are present.
http://riodb01.ibase.aist.go.jp/sdbs/ (National Institute of Advanced Industrial Science and Technology, 12/30/09)
3403 cm-1
1604 cm-1

IR Spectroscopy
Example: Interpret the following IR spectrum by assigning each of the major peaks. Identify what functional group(s) are present.
http://riodb01.ibase.aist.go.jp/sdbs/ (National Institute of Advanced Industrial Science and Technology, 12/30/09)
1691 cm-1
2814 cm-1
1642 cm-1
2733 cm-1

Infrared Spectroscopy
Example: Which one of the following compounds is the most reasonable structure for the IR spectrum shown below?
1721
http://riodb01.ibase.aist.go.jp/sdbs/ (National Institute of Advanced Industrial Science and Technology, 12/30/09)
O OOCH3
O
OH
O

Infrared Spectroscopy
Example: Which of the following compounds is the most reasonable structure for the IR spectrum shown below?
http://riodb01.ibase.aist.go.jp/sdbs/ (National Institute of Advanced Industrial Science and Technology, 12/30/09)
1689
1603
OH
OOH
O
OHOH
ONH2
O