analysis of dioxin and furan related compounds...
TRANSCRIPT

ANALYSIS OF DIOXIN AND FURAN RELATED COMPOUNDS AND
ORGANOPHOSPHOROUS PESTICDES USING MICELLAR
ELECTROKINETIC CHROMATOGRAPHY
SHARAIN LIEW YEN LING
A thesis submitted in fulfilment of the
requirements for the award of the degree of
Master of Science (Chemistry)
Faculty of Science
Universiti Teknologi Malaysia
DECEMBER 2007

iii
Dedicated to my beloved father, mother and brother and people who have supported
me throughout this research.

iv
ACKNOWLEDGEMENT
I would like to express my sincere appreciation to my main project
supervisor, Associate Professor Dr. Wan Aini Wan Ibrahim for her encouragement,
guidance and support throughout this research project. I am also very thankful to my
co-supervisor Professor Dr. Mohd. Marsin Sanagi for his guidance, advice and
motivation. This research would not have been carried out if not for their support
and guidance.
I am also indebted to the Ministry of Science, Technology and Innovation and
Universiti Teknologi Malaysia for funding my Masters by research through Vote
75149.
I would also like to thank my fellow labmates for their support and
encouragement in completing this project. My sincere appreciation to my friends
and family members who have encouraged me in completing this project and for
their support.

v
ABSTRACT
Micellar electrokinetic chromatography (MEKC) is increasingly popular in the analysis of organic pollutants in the environment due to its high separation efficiency, less solvent usage and shorter analysis time. In this study, MEKC was used for the separation of 2,3,7,8-tetrachlorodibenzo-p-dioxin (TCDD) and 2,3,7,8-tetrachlorodibenzo-p-furan (TCDF) with a separation buffer consisting of 20 mM sodium cholate, 20 mM sodium tetraborate decahydrate and 5% v/v organic modifier acetonitrile-methanol (3:1 v/v) at a final buffering pH of 9.16-9.22. Separation voltage was at 25 kV with anodic injection and optimum wavelength set at 225 nm. To improve the limit of detection (LOD), five on-line preconcentration techniques were evaluated. The techniques were normal stacking mode (NSM-MEKC), reversed electrode polarity stacking mode (REPSM-MEKC), high conductivity sample stacking mode (HCSSM-MEKC), sweeping and field enhanced sample injection (FESI-MEKC). High conductivity sample stacking method-MEKC (HCSSM-MEKC) that gave an LOD of 46 ppb for TCDF and 18.5 ppb for TCDD was chosen. Solid phase disc extraction (SPDE) was used to further improve the LOD during the extraction of TCDF and TCDD from water thus reducing the LODs by 1000 fold. LODs in the ppt range were achieved for both analytes. This is the first study conducted using MEKC for 2,3,7,8-TCDF and 2,3,7,8-TCDD. Selected hydrophilic organophosphorous pesticides were also included in this study. They were dicrotophos, monocrotophos and phosphamidon. Separations were carried out using acidic buffer (pH 2.3) with a buffering system consisting of 10 mM sodium dodecyl sulphate, 20 mM sodium dihydrogen phosphate and 10% v/v methanol. Optimum detection wavelength of 225 nm with separation voltage at -25 kV was used. MEKC separation gave LODs of 32.1 ppm for dicrotophos, 3.75 ppm for monocrotophos and 18.6 ppm for phosphamidon. Stacking with reverse migrating micelles (SRMM) gave better LODs of 0.15 ppm for dicrotophos, 0.39 ppm for monocrotophos and 0.22 ppm for phosphamidon. SPDE was able to reduce the LOD further by 250 fold. Sample matrix used was spiked pond water. MEKC was successfully used to separate the test analytes in pond water sample. These analytes consisted of 2,3,7,8-TCDF and 2,3,7,8-TCDD under basic conditions and three hydrophilic organophosphorous pesticides under acidic conditions with analysis time of less than 10 minutes.

vi
ABSTRAK
Kromatografi rerambut elektrokinetik misel (MEKC) semakin kerap digunakan dalam analisis bahan pencemar alam sekitar kerana kecekapan pemisahan yang tinggi, penggunaan isipadu pelarut yang kecil dan masa analisis yang singkat. Dalam kajian ini, MEKC telah digunakan untuk memisahkan 2,3,7,8-tetraklorodibenzo-p-dioksin (TCDD) dan 2,3,7,8-tetraklorodibenzo-p-furan (TCDF) dengan menggunakan larutan penimbal 20 mM natrium kolat, 20 mM natrium tetraborat dekahidrat dan campuran pengubahsuai organik 5% asetonitrile-methanol (3:1 v/v) dengan pH 9.16-9.22. Voltan pemisahan adalah 25 kV dan panjang gelombang optimum pada 225 nm. Lima teknik pra-pemekatan talian terus iaitu mod penyusunan normal (NSM-MEKC), penyusunan kekutuban elektrod berbalik (REPSM-MEKC), mod penyusunan sampel kekonduksian tinggi (HCSSM-MEKC), sapuan (S-MEKC) dan suntikan sampel peningkatan medan (FESI-MEKC) telah diuji untuk membaiki had pengesanan analit. Mod penyusunan sampel kekonduksian tinggi (HCSSM-MEKC) telah dipilih dengan had pengesanan 46 ppb untuk TCDF dan 18.5 ppb untuk TCDD. Kaedah pengekstrakan cakera fasa pepejal (SPDE) telah digunakan untuk memperbaiki had pengesanan TCDF dan TCDD dalam sampel air dan berjaya menurunkan had pengesanan sebanyak 1000 kali ganda. Had pengesanan adalah dalam julat ganda bahagian per trillion (ppt). Ini adalah kajian pertama dilakukan dengan MEKC terhadap kedua-dua analit. Beberapa pestisid organofosforus hidrofilik turut dipilih dalam kajian ini iaitu dikrotofos, monokrotofos dan fosfamidon. Pemisahan dilakukan dalam penimbal berasid (pH 2.3) dengan larutan pemisahan yang mengandungi 10 mM natrium dodesil sulfat (SDS), 20 mM natrium dihidrogen fosfat dan 10% methanol. Panjang gelombang optimum 225 nm dan voltan pemisahan –25 kV. Pemisahan MEKC memberi had pengesanan sebanyak 32.1 ppm untuk dickrotofos, 3.75 ppm bagi monokrotofos dan 18.6 ppm dan fosfamidon. Mod penyusunan dengan misel penghijrahan berbalik (SRMM) memberikan had pengesanan yang lebih baik iaitu sebanyak 0.15 ppm untuk dikrotofos, 0.39 ppm bagi monokrotofos dan 0.22 ppm bagi fosfamidon. SPDE telah berjaya menurunkan lagi had pengesanan sebanyak 250 kali ganda. Sampel matriks yang digunakan ialah air tasik terpaku. MEKC telah berjaya digunakan untuk memisahkan analit-analit dalam sampel air tasik. Analit-analit ini terdiri daripada 2,3,7,8-TCDF dan 2,3,7,8-TCDD dalam keadaan berbes dan tiga jenis pestisid organofosforus hidrofilik dalam keadaan berasid dengan masa analisis kurang daripada 10 minit.

vii
TABLE OF CONTENTS
CHAPTER TITLE PAGE
DECLARATION ii
DEDICATION iii
ACKNOWLEDGEMENTS iv
ABSTRACT v
ABSTRAK vi
TABLE OF CONTENTS vii
LIST OF TABLES xiii
LIST OF FIGURES xvii
LIST OF SYMBOLS xxvi
LIST OF ABBREVIATIONS
xxvii
1 SUMMARY OF THESIS
1.1 Background 1
1.2 Summary of thesis 2
2 INTRODUCTION 5
2.1 Organic Pollutants 5
2.2 Chlorinated Dioxins and Dibenzofurans 6
2.2.1 Physical and Chemical Properties Of 2,3,7,8-TCDF
and 2,3,7,8-TCDD
7

viii
2.2.2 Toxicity of PCDDs and PCDFs 8
2.2.3 Potential Routes of PCDDs and PCDFs Exposure In
Wildlife and Humans
9
2.2.3.1 Commercial and Technical Products 9
2.2.3.2 Municipal Incinerators and Hazardous Waste Incinerators 10
2.2.3.3 Food Products 10
2.3 Organophosphorous Pesticides 11
2.3.1 Physical and Chemical Properties 12
2.3.2 Toxicity of OPPs 14
2.4 Sample Extraction and Clean-up Strategies of Organic
Pollutants
14
2.4.1 Methods For The Extraction Organic Pollutants 15
2.4.2 Clean-up Procedures for Organic Pollutants 17
2.5 Identification and Quantification of Organic Pollutants 19
2.5.1 Gas Chromatography 19
2.5.2 Micellar Electrokinetic Chromatography (MEKC) 20
2.5.3 Types of Surfactants 21
2.5.4 Organic Modifier Effect 25
2.5.5 Matrix Effect 26
2.6 On-line Preconcentration Techniques 27
2.6.1 Stacking 28
2.6.2 Sweeping 34
2.7 Problem Statement 35
2.8 Research Objectives 37
2.9 Scope of Work 38
3 EXPERIMENTAL 41
3.1 Introduction 41
3.2 Reagents 41
3.3 Instrumentations 42
3.4 Conditioning of the Capillary 43
3.5 Procedures for MEKC Separation of TCDF and TCDD 44

ix
3.5.1 Preliminary Investigation For The Separation of TCDF and
TCDD
44
3.5.2 Evaluation Of Organic Modifier Effect On The Separation
of TCDF and TCDD
45
3.5.3 Separation Efficiency of TCDF and TCDD Under Different
Sample Matrix
45
3.5.4 Normal Stacking Mode (NSM-MEKC) In The Separation
Of TCDF and TCDD
46
3.5.5 Reversed Electrode Polarity Stacking Mode 47
3.5.6 High Conductivity Sample Stacking Mode (HCSSM) 47
3.5.7 Sweeping 47
3.5.8 Field-Enhanced Sample Injection (FESI-MEKC) 48
3.6 Off-line Preconcentration Using Solid Phase Disc
Extraction (SPDE)
48
3.6.1 Sample Preparation 48
3.6.2 Solid Phase Disc Extraction 49
3.7 Summary of Methodology of Optimization of eparation of
TCDD and TCDF
51
3.8 Procedures for MEKC Separation Of Hydrophilic
Organophosphorous Pesticides (OPPs)
52
3.8.1 Wavelength Optimization In The Separation Of OPPs
Under Acidic Conditions
52
3.8.2 Stacking With Reverse Migrating Micelles (SRMM) In The
Analysis Of OPPs
53
3.9 Off-line Concentration Using Solid Phase Disc
Extraction (SPDE) Of OPPs
53
3.9.1 Sample Preparation 53
3.9.2 Extraction 53
3.9.3 Method Validation Of Extraction Process 54
4 OPTIMIZATION OF SEPARATION PARAMETERS 55
4.1 Introduction 55

x
4.2 Preliminary Investigation On The Separation of TCDF and
TCDD Using MEKC
55
4.2.1 Confirmation of Individual Peaks 56
4.2.2 Optimization of Analyte Separation By Varying The
Percentage Of Acetontrile In The Running Buffer Solution
57
4.3 Evaluation of Organic Modifier Effect On The Separation
Efficiency of TCDF and TCDD Using MEKC
62
4.3.1 Comparison of Separation Performance Between
Acetonitrile and Methanol
63
4.3.2 Comparison Of Mixed Modifier With Single Organic
Modifier On Separation Performance
68
4.4 Investigation of Sample Matrix Effect On The Separation
Efficiency of TCDF and TCDD
74
4.4.1 Baseline Stability and Unknown Peak Elimination 74
4.4.2 Comparison Of Peak Area, Peak Height
And Separation Efficiency In Different Matrix
77
5 OFF-LINE AND ON-LINE PRECONCENTRATION
TECHNIQUES
80
5.1 Introduction 80
5.2 Normal Mode (NM-MEKC) In Analysis of TCDF and
TCDD
80
5.2.1 Normal Mode MEKC (NM-MEKC) 80
5.2.2 Calibration Lines, Linearity (r2), LODs 81
5.2.3 Repeatability and Efficiency (N) 82
5.3 Normal Stacking Mode (NSM-MEKC) 84
5.3.1 Optimization of Injection Time 85
5.3.2 Calibration Lines, Linearity (r2), LODs 88
5.3.3 Repeatability, Reproducibility and Efficiency (N) 89
5.3.4 Stacking Efficiency 92
5.4 Reversed Electrode Polarity Stacking Mode (REPSM) 93

xi
5.4.1 Influence Of Various Stacking Periods 93
5.4.2 Calibration lines, linearity (r2) and LODs 97
5.4.3 Repeatability and Efficiency 98
5.4.4 Stacking Efficiency 99
5.5 High Conductivity Sample Stacking Mode
(HCSSM-MEKC)
99
5.5.1 Optimization of Sodium Chloride Concentration 100
5.5.2 Calibration lines, linearity (r2) and LODs 103
5.5.3 Repeatability, Reproducibility and Efficiency 104
5.5.4 Stacking Efficiency 105
5.6 Sweeping 106
5.7 Field-Enhanced Sample Injection (FESI) 107
5.8 Off-line Preconcentration Technique With Solid Phase Disc
Extraction (SPDE)
109
5.9 Conclusions
113
6 SEPARATION OF HYDROPHILIC
ORGANOPHOSPHOROUS PESTICIDES USING
MICELLAR ELECTROKINETIC CHROMATOGRAPHY
(MEKC) WITH ACIDIC BUFFER
114
6.1 Introduction 114
6.2 Reverse Mode Micellar Electrokinetic Chromatography 115
6.2.1 Wavelength Optimization 115
6.2.2 Calibration Lines, Linearity (r2), LODs 118
6.2.3 Repeatabilities and Efficiency (N) 119
6.3 Stacking With Reverse Migrating Micelles 121
6.3.1 Calibration Lines, Linearity (r2), LODs 122
6.3.2 Repeatability and Efficiency (N) 124
6.3.3 Stacking Efficiencies (SEF) 125

xii
6.4 Off-line Preconcentration Technique With Solid Phase
Disc Extraction (SPDE)
127
7 CONCLUSIONS 130
7.1 Conclusions 130
7.2 Future Direction
134
REFERENCES 135
APPENDIX
List of Publications
List of Presentations
152
152
153
xiii
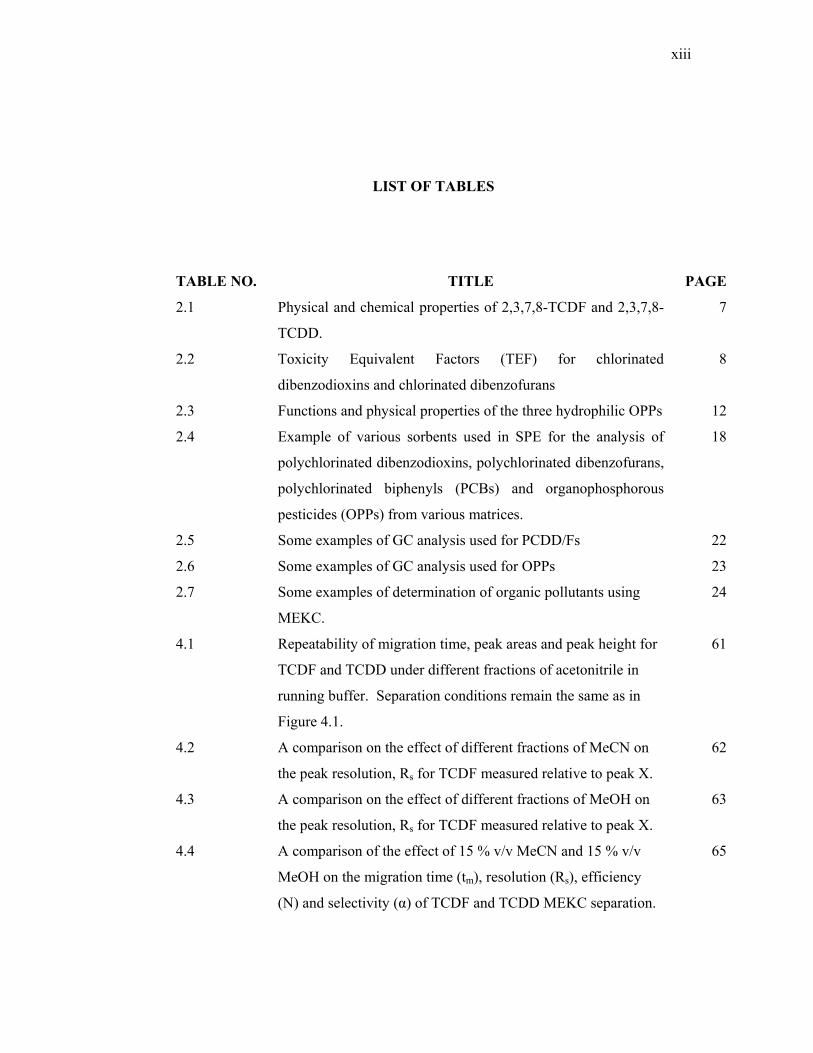
LIST OF TABLES
TABLE NO. TITLE PAGE
2.1 Physical and chemical properties of 2,3,7,8-TCDF and 2,3,7,8-
TCDD.
7
2.2 Toxicity Equivalent Factors (TEF) for chlorinated
dibenzodioxins and chlorinated dibenzofurans
8
2.3 Functions and physical properties of the three hydrophilic OPPs 12
2.4 Example of various sorbents used in SPE for the analysis of
polychlorinated dibenzodioxins, polychlorinated dibenzofurans,
polychlorinated biphenyls (PCBs) and organophosphorous
pesticides (OPPs) from various matrices.
18
2.5 Some examples of GC analysis used for PCDD/Fs 22
2.6 Some examples of GC analysis used for OPPs 23
2.7 Some examples of determination of organic pollutants using
MEKC.
24
4.1 Repeatability of migration time, peak areas and peak height for
TCDF and TCDD under different fractions of acetonitrile in
running buffer. Separation conditions remain the same as in
Figure 4.1.
61
4.2 A comparison on the effect of different fractions of MeCN on
the peak resolution, Rs for TCDF measured relative to peak X.
62
4.3 A comparison on the effect of different fractions of MeOH on
the peak resolution, Rs for TCDF measured relative to peak X.
63
4.4 A comparison of the effect of 15 % v/v MeCN and 15 % v/v
MeOH on the migration time (tm), resolution (Rs), efficiency
(N) and selectivity (α) of TCDF and TCDD MEKC separation.
65

xiv
4.5 Repeatability of migration time, peak area and peak height for
TCDF and TCDD under different fractions of methanol, MeOH
in running buffer. Separation conditions the same as in Figure
4.1.
66
4.6 The effect of different organic modifiers on the relative
standard deviation (% RSD) of migration time, peak area and
peak height for TCDF and TCDD.
73
5.1 Equation of calibration curves, correlation coefficients, r2,
LODs (at S/N = 3) on the basis of calibration curves in Figure
5.1.
82
5.2 Repeatability of migration time, peak area and peak height
(mAU) in the separation of TCDF and TCDD using NM-
MEKC.
82
5.3 Injection volume and plug length as a function of pressure, time
and capillary id. % of sample plug and corresponding % of
remaining length available for separation is also indicated.
86
5.4 Equation of calibration curves, r2, LODs (for S/N = 3)
on the basis of calibration curves in Figure 5.6.
89
5.5 Repeatability of migration time, peak height and peak area for
TCDF and TCDD using NSM.
90
5.6 Reproducibility of migration time (min), peak area (mAUs) and
peak height (mAU) for TCDF and TCDD.
91
5.7 Sensitivity Enhancements Factor (SEF) in NSM-MEKC over
NM-MEKC in the separation of TCDF and TCDD.
92
5.8 Corresponding percentage of original current, % with polarity
switching time,s used in REPSM.
95
5.9 Equation of calibration curves, r2, LODs (for S/N = 3) on the
basis of calibration curves in Figure 5.11 using REPSM.
97
5.10 Repeatability of migration time, peak area and peak height in
the separation of TCDF and TCDD using REPSM.
98
5.11 Sensitivity Enhancement Factors (SEF) in REPSM over NM-
MEKC in the separation of TCDF and TCDD.
99
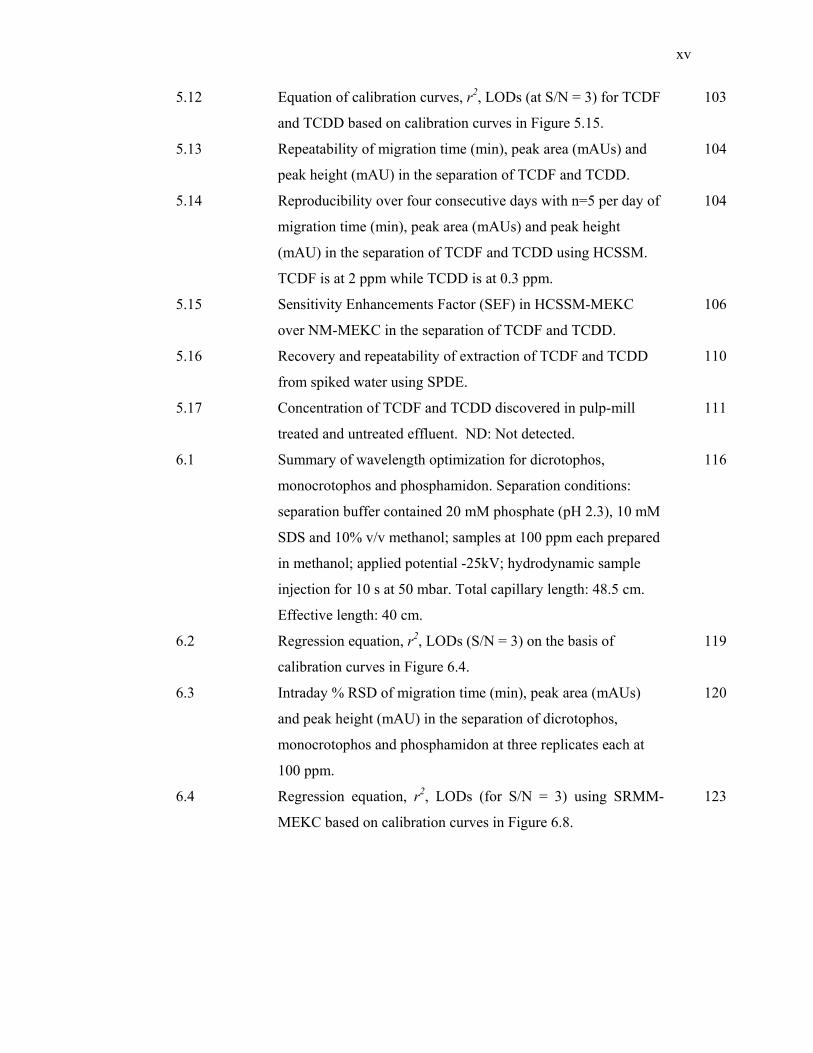
xv
5.12 Equation of calibration curves, r2, LODs (at S/N = 3) for TCDF
and TCDD based on calibration curves in Figure 5.15.
103
5.13 Repeatability of migration time (min), peak area (mAUs) and
peak height (mAU) in the separation of TCDF and TCDD.
104
5.14 Reproducibility over four consecutive days with n=5 per day of
migration time (min), peak area (mAUs) and peak height
(mAU) in the separation of TCDF and TCDD using HCSSM.
TCDF is at 2 ppm while TCDD is at 0.3 ppm.
104
5.15 Sensitivity Enhancements Factor (SEF) in HCSSM-MEKC
over NM-MEKC in the separation of TCDF and TCDD.
106
5.16 Recovery and repeatability of extraction of TCDF and TCDD
from spiked water using SPDE.
110
5.17 Concentration of TCDF and TCDD discovered in pulp-mill
treated and untreated effluent. ND: Not detected.
111
6.1 Summary of wavelength optimization for dicrotophos,
monocrotophos and phosphamidon. Separation conditions:
separation buffer contained 20 mM phosphate (pH 2.3), 10 mM
SDS and 10% v/v methanol; samples at 100 ppm each prepared
in methanol; applied potential -25kV; hydrodynamic sample
injection for 10 s at 50 mbar. Total capillary length: 48.5 cm.
Effective length: 40 cm.
116
6.2 Regression equation, r2, LODs (S/N = 3) on the basis of
calibration curves in Figure 6.4.
119
6.3 Intraday % RSD of migration time (min), peak area (mAUs)
and peak height (mAU) in the separation of dicrotophos,
monocrotophos and phosphamidon at three replicates each at
100 ppm.
120
6.4 Regression equation, r2, LODs (for S/N = 3) using SRMM-
MEKC based on calibration curves in Figure 6.8.
123

xvi
6.5 Repeatability of migration time (min), peak area (mAUs) and
peak height (mAU) in the separation of dicrotophos,
monocrotophos and phosphamidon at three replicates each at
10 ppm.
125
6.6 Sensitivity Enhancement Factors in SRMM-MEKC over RM-
MEKC in the separation of dicrotophos, monocrotophos and
phosphamidon. Conditions as in Figure 6.10.
126
6.7 Recovery and repeatability of extraction. 128
7.1 LODs (for S/N = 3) obtained using the three online
preconcentration techniques as compared to normal mode (NM)
for TCDF and TCDD.
131
7.2 Repeatabilities for migration time, peak area and peak height
for both analytes using the three online preconcentration
techniques as compared to normal mode (NM) for TCDF and
TCDD. Sweeping and FESI were not successful in enhancing
the detection of both analytes.
132

xvii
LIST OF FIGURES
FIGURE NO. TITLE PAGE
2.1 General structures of A) polychlorinated dibenzo-p-dioxins,
PCDDs and B) polychlorinated dibenzofurans, PCDFs.
6
2.2 General structure of organophosphorous pesticides. 12
2.3 The chemical structures of (A) phosphamidon, (B)
dicrotophos and (C) monocrotophos.
13
2.4 Schematic diagram of the principle of sample stacking in
MEKC. SB is the stacking boundary. EOF is the
electrooosmotic flow. (Quirino and Terabe, 1997a).
29
2.5 Schematic diagram of stacking of analytes during REPSM.
(A) Before stacking; (B) micelles enter the capillary and
carry with it neutral analytes a, k(ax)>k(ay)>k(az); (C)
micelles and neutral analytes stack at the concentration
boundary (B2) and (B1) and polarity is switched later to
positive; (D) separation and later detection of zones.
Retention factor is referred with the symbol k. ax, ay and az
refer to the stacking boundary for analyte x, analyte y and
analyte z.(Quirino and Terabe, 1997b).
31

xviii
2.6 Schematic diagram of stacking of neutral analytes in
FESI-MEKC. (A) initial situation (water plug, unshaded;
BGS shaded); (B) micelles enter the capillary and carry
with them neutral analytes emanating from the cathodic
vial, k(x)>k(y)>k(z); (C) micelles and neutral analytes
stacked at the concentration boundary, voltage is cut and
sample vial replaced with BGS vial when the measured
current is approximately 97-99% of the predetermined
current, voltage is then applied at positivie polarity; (D)
separation of zones occur. k refers to the retention factor of
analyte x, y and z
(Quirino and Terabe, 1998b).
33
2.7 Schematic diagram of sweeping of analytes in MEKC under
low electroosmotic flow. (a) Starting situation, injection of
S prepared in a matrix having a conductivity similar to that
of the BGS; (b) application of voltage at negative polarity,
micelles emanating from the cathodic side sweeping analyte
molecules; (c) the injected analyte zone is assumed
completely swept (Shao and Tseng, 2005).
35
2.8 Flow chart of research methodology of separation TCDD
and TCDF.
39
2.9 Flow chart of research methodology of separation of the
three hydrophilic OPPs viz. phosphamidon, dicrotophos and
monocrotophos.
40
3.1 Chemical structure for TCDF and TCDD. 42
3.2 SPE disc extraction setup in the extraction of analytes from
water samples.
50
3.3 Summary of the methodology of MEKC separation
involved in the separation of TCDF and TCDD.
51

xix
4.1 Electropherogram of TCDD and TCDF at 40 ppm each in
1,4-dioxane. Run buffer: 20 mM di-sodium tetraborate
decahydrate, 20 mM sodium cholate and 5% (v/v)
acetonitrile at a final running buffer pH: 9.16-9.22. Injection
time: 1 s at 50 mbar. Wavelength: 225 nm. Separation
voltage: 25 kV. Total capillary length: 48.5 cm, effective
length: 40 cm.
56
4.2 The effect of acetonitrile percentage on the migration
window for the MEKC separation of TCDF and TCDD
(n=3).
57
4.3 Electropherogram of TCDF with different percentages of
acetonitrile (MeCN) in BGS at 0 % v/v, % v/v, 10 % v/v, 15
% v/v and 20 % v/v. At 20 % v/v, the TCDF peak appeared
before peak X. Separation conditions are the same as in
Figure 4.1.
58
4.4 Effect of acetonitrile fraction on migration time of TCDF
and TCDD at 0% v/v MeCN, 5% v/v MeCN, 10% v/v
MeCN, 15% v/v MeCN and 20% v/v MeCN. Separation
conditions remain the same as in Figure 4.1.
59
4.5 Effect of different percentages of acetonitrile in running
buffer on (A) migration time and (B) efficiency on the
separation of -TCDF and TCDD.
60
4.6 Electropherogram of TCDF and peak X at 15% v/v
methanol. Running buffer conditions: 20 mM sodium
cholate, 20 mM sodium tetraborate-decahydrate at a final
buffer pH: 9.16-9.22. Wavelength: 225 nm. Both test
analytes at 100 ppm each in 1,4-dioxane. Hydrodynamic
injection at 50 mbar for 1s. Separation voltage, 25 kV;
temperature, 25ºC; total capillary length, 48.5 cm; effective
length, 40 cm.
64

xx
4.7 Peak shouldering for TCDD at 9.147 min (circle) at 20%
v/v methanol. MEKC conditions as in Figure 4.5.
64
4.8 Electropherogram of the effect of the % of MeOH on the
separation of TCDF and TCDD. Separation conditions
remain the same as in Figure 4.5. The peaks between TCDF
and TCDD are suspected to be from the 1,4-dioxane.
67
4.9 Peak resolution for TCDF (measured relative to peak X
mentioned in section 4.2.2) at 15% v/v MeCN, 15% v/v
MeOH and various percentages of mixed modifier.
Separation conditions similar to Figure 4.1.
67
4.10 Effect of (A) 15% v/v MeCN (B) 15% v/v MeOH (C) 5%
v/v MeCN-MeOH (1:1), (D) 5% v/v MeCN-MeOH (3:1)
and (E) 5% v/v MeCN-MeOH (1:3) on the separation of
TCDD. MEKC separation conditions remain
identical as in Figure 4.1.
69
4.11 Effect of (A) 15% v/v MeCN (B) 15% v/v MeOH (C) 5%
v/v MeCN-MeOH (1:1), (D) 5% v/v MeCN-MeOH (3:1)
and (E) 5% v/v MeCN-MeOH (1:3) on the separation
efficiency of TCDF (enlarged). Peak X refers to an
unknown peak due to the 1,4-dioxane used. MEKC
separation conditions similar to Figure 4.10.
70
4.12 Effect of modifier on (A) migration time, (B) peak area, (C)
peak heights and (D) efficiency of TCDF and TCDD.
72
4.13 Electropherograms of TCDF and TCDD at 4 ppm each in
different media used. (A) ethanol, (B) water and (C) buffer.
(B) and (C) are analytes dissolved in aqueous matrix while
(A) is analyte dissolved in non-aqueous matrix. Running
buffer conditions as in Figure 4.5 but with 5% v/v MeCN-
MeOH (3:1).
75

xxi
4.14 Electropherogram of TCDF in the presence of (A) ethanol,
(B) water and (C) buffer matrix. TCDF: 4 ppm; running
buffer conditions similar to Fig 4.13.
76
4.15 Comparison of sample matrix effect based on (A) separation
efficiency, (B) peak area and (D) peak height. (C) shows the
enlarged peak areas as circled in (B) for TCDF. Error bars
are in standard errors.
78
5.1 Calibration curves based on peak height for (A) TCDF and
(B) TCDD using NM-MEKC. Separation buffer: 20 mM
sodium cholate, 20 mM sodium tetraborate-decahydrate and
5% v/v MeCN/MeOH (3:1) at a final buffer pH 9.16-9.22.
Separation wavelength: 225 nm. Separation voltage: 25 kV.
Hydrodynamicinjection for 1s at 50 mbar. Capillary total
length: 48.5 cm. Effective length: 40 cm.
81
5.2 Electropherogram of three replicated runs for the separation
of TCDF (40 ppm) and TCDD (15 ppm) in NM-MEKC
under the same conditions as in Figure 5.1.
83
5.3 Variations in N for (A) TCDF and (B) TCDD in the
concentration used in the calibration curve in NM-MEKC.
84
5.4 Electropherograms showing the effect of different injection
times on peak shapes of TCDD and TCDF. Separation
buffer: 20 mM sodium cholate, 20 mM sodium tetraborate-
decahydrate and 5% v/v MeCN-MeOH (3:1) at a final
buffer pH 9.16-9.22. Separation wavelength, 225 nm;
separation voltage, 25 kV; hydrodynamic injection of
samples varied from 1 s, 4 s, 10 s, 20 s, 30 s, 40 s and 50 s.
Capillary total length: 48.5 cm; effective length: 40 cm.
87

xxii
5.5 Influence of injection time on (A1) peak area, (A2) enlarged
for TCDF peak area, (B) peak height and (C) efficiency on
the separation of TCDF and TCDD. Hydrodynamic
injection pressure constant at 50 mbar.
88
5.6 Calibration curves based on peak height for (A) TCDF and
(B) TCDD using NSM-MEKC.Injection time at 50 mbar for
10 s. Separation conditions remain similar to Figure 5.4.
89
5.7 Electropherogram of three successive replicated runs for the
separation of TCDF and TCDD in NSM-MEKC under same
conditions as in Figure 5.4 but with an injection time of 10
s.
90
5.8 Variations in N in the concentration range for (A) TCDF
and (B) TCDD used in the calibration curve in NSM-
MEKC.
92
5.9 Effect of polarity switching time on (A1) peak area and
(B1) peak height for both analytes. (A2) enlarged line graph
of peak area for TCDF. (B2) enlarged line graph of peak
height for TCDF.
94
5.10 Electropherogram of REPSM with different polarity
switching times. TCDF at 4 ppm (circled peak) while
TCDD at 1.5 ppm. Separation buffer: 20 mM sodium
cholate, 20 mM sodium tetraborate-decahydrate and 5% v/v
MeCN/MeOH (3:1) at a final buffer pH 9.16-9.22.
Separation wavelength, 225 nm; separation voltage, 25 kV.
Hydrodynamic injection of sample at 50 mbar for 100 s
followed by electrokinetic injection of buffers at -25 kV for
20 s. Total capillary length: 48.5 cm. Effective length: 40.0
cm.
96
5.11 Calibration curves based on peak height for (a) TCDF and
(b) TCDD using REPSM. Injection time set at 50 mbar for
100 s. Electrokinetic injection at -25 kV for 20 s. Separation
conditions similar to Figure 5.10.
97

xxiii
5.12 Variations in N with the concentration for (A) TCDF and
(B) TCDD used in the calibration curve in REPSM-MEKC.
Conditions remain the same as in Figure 5.10.
98
5.13 Effect of different concentrations of NaCl (0-300 mM) on
(A) peak area, (B) peak height and (C) efficiency for both
TCDF and TCDF. Separation buffer: 20 mM sodium
cholate, 20 mM sodium tetraborate-decahydrate and 5% v/v
(3:1 acetonitrile-methanol) at a final buffer pH 9.16-9.22.
Separation wavelength: 225 nm. Separation voltage: 25 kV.
Hydrodynamic injection of sample at 50 mbar for 10 s.
Total capillary length: 48.5 cm. Effective capillary length:
40 cm.
101
5.14 HCSSM-MEKC electropherograms with different
concentration of NaCl. TCDF at 2 ppm while TCDD at 0.3
ppm. Peak for TCDF is shown by the circle drawn around
the peak. Separation buffer: 20 mM sodium cholate, 20
mM sodium tetraborate-decahydrate and 5% v/v MeCN-
MeOH (3:1) at a final buffer pH 9.16-9.22. Separation
wavelength: 225 nm. Separation voltage: 25 kV.
Hydrodynamic injection of sample at 50 mbar for 10 s.
Total capillary length: 48.5 cm. Effective capillary length:
40 cm.
102
5.15 Calibration curves based on peak height for (a) TCDF and
(b) TCDD using HCSSM. Injection time set at 50 mbar for
10 s. NaCl concentration in sample matrix at 200 mM.
Separation conditions similar to Figure 5.14.
103
5.16 Variations in efficiency, N in the concentration range for
(A) TCDF and (B) TCDD used in the calibration curve in
HCSSM-MEKC. Separation conditions similar to Figure
5.14.
105

xxiv
5.17 Electropherogram of sweeping with different concentration
of sodium cholate in sample matrix at (A) 5 mM, (B) 10
mM and (C) 20 mM. Separation buffer: 20 mM sodium
cholate, 20 mM sodium tetraborate-decahydrate and 5% v/v
MeCN-MeOH (3:1) at a final buffer pH 9.16-9.22.
Separation wavelength, 225 nm; separation voltage, 25 kV.
Hydrodynamic injection of sample at 50 mbar for 5 s. Total
capillary length: 48.5 cm. Effective length: 40.0 cm. TCDF
at 2 ppm while TCDD at 0.5 ppm.
107
5.18 Electropherogram of TCDF (2ppm) and TCDD (0.5 ppm)
under FESI-MEKC conditions. Analytes were mixed with
20 mM sodium cholate and deionized water. Samples were
electrokinetically injected at -20 kV, 100 s after
hydrodynamic injection of water plug for 5 s at 50 mbar.
Separation conditions remain the same as in Figure 5.18.
108
5.19 Electropherograms of SPDE-HCSSM of TCDF and TCDD
spiked with 50 ng. Separation buffer: 20 mM sodium
cholate, 20 mM sodium tetraborate-decahydrate and 5% v/v
MeCN-MeOH (3:1) at a final buffer pH 9.16-9.22.
Separation wavelength, 225 nm; separation voltage, 25 kV.
Hydrodynamic injection of sample at 50 mbar for 10 s.
Total capillary length: 48.5 cm. Effective capillary length:
40 cm.
111
5.20 Electropherograms of pulp mill effluent water obtained as
tabulated in Table 5.17. (A) treated A, (B) treated B, (C)
untreated A and (D) untreated B.
112

xxv
6.1 Comparison of intensity of (1) dicrotophos, (2)
monocrotophos and (3) phosphamidon at different detection
wavelengths which are 225 nm and 195 nm under the same
running buffer conditions. Separation buffer: 20 mM
phosphate at buffer pH 2.3, 10 mM SDS and 10% v/v
methanol. Separation wavelength, 225 nm; separation
voltage, -25 kV; hydrodynamic injection for 50 s at 50
mbar. Capillary total length, 48.5 cm; effective length, 40
cm.
116
6.2 The influence of different wavelengths on peak area
response for dicrotophos, monocrotophos and
phosphamidon. Separation conditions is similar Figure 6.1.
117
6.3 The influence of different wavelengths on peak height
intensity for dicrotophos, monocrotophos and
phosphamidon. Separation conditions is similar to Figure
6.2.
118
6.4 Calibration curves based on (A) peak areas and (B) peak
heights for the separation of hydrophilic OPPs in RM-
MEKC. Separation conditions remain the same as in Figure
6.3.
119
6.5 Electropherogram of (1) dicrotophos, (2) monocrotophos
and (3) phosphamidon at 100 ppm each when injected in
triplicates. Separation conditions remain the same as in
Figure 6.4.
120
6.6 Variations in efficiency, N in the concentration range for
dicrotophos, monocrotophos and phosphamidon using RM-
MEKC. Separation conditions of Figure 6.5.
121
6.7 Schematic diagram of the priniciple of stacking with reverse
migrating micelles in MEKC. EOF, electroosmotic flow;
SB, stacking boundary.
122

xxvi
6.8 Calibration curves based on (A) peak areas and (B) peak
heights for the separation of hydrophilic OPPs in SRMM-
MEKC. Separation buffer: 20 mM phosphate at buffer pH
2.3, 10 mM SDS and 10% v/v methanol. Separation
wavelength: 225 nm. Separation voltage: -25 kV.
Hydrodynamic injection for 50 s at 50 mbar. Capillary total
length: 48.5 cm. Effective length: 40 cm.
123
6.9 Separation of hydrophilic OPPs using SRMM-MEKC at
mixture at (A) 10 ppm, (B) 20 ppm and (C) 30 ppm for
(1)dicrotophos, (2) monocrotophos and (3) phosphamidon.
Separation conditions remain the same as in Figure 6.8.
124
6.10 Variations in N in the concentration range for dicrotophos,
monocrotophos and phosphamidon using SRMM-MEKC.
Separation conditions similar to Figure 6.9.
125
6.11 Electropherograms of extracted blank pond water (A) and of
dicrotophos (1), monocrotophos (2) and phosphamidon (3)
at (B) 0.5 µg and (C) 1 µg. Separation buffer: 20 mM
phosphate at buffer pH 2.3, 10 mM SDS and 10% v/v
methanol. Separation wavelength, 225 nm; separation
voltage, -25 kV; hydrodynamic injection for 50 s at 50
mbar. Capillary total length, 48.5 cm and effective length,
40 cm.
129

xxvii
LIST OF SYMBOLS
D, d - Diameter (µm)
Ip - Sample plug length
L - Length (cm)
N - Efficiency
P - Pressure (mbar)
r2 - Correlation coefficient
Rs - Peak resolution
T - Temperature (˚C)
tm - Migration time
Vp - Volume of sample loaded
α - Selectivity
η - Viscosity

xxviii
LIST OF ABBREVIATIONS
ACh - Acetylcholine
AChE - Acetylcholinesterase
ASE - Accelerated solvent extraction
BGE - Background electrolyte
BGS - Background solution
CD - Cyclodextrin
CD-MEKC - Cyclodextrin assisted MEKC
CHES - 2-(N-Cyclohexylamino)ethane sulfonic acid
CMC - Critical micelle concentration
CZE - Capillary zone electrophoresis
DAD - Diode-array detection
DMSO - Dimethyl sulphoxide
EPA - Environmental Protection Agency
EOF - Electroosmotic flow
FESI - Field enhanced sample injection
HCSSM - High conductivity sample stacking mode
HRGC - High resolution gas chromatography
HRMS - High resolution mass spectrometry
HSW - Hazardous solid waste
ID - Isotope dilution
i.d. - Internal diameter
LD - Detection limit
LLE - Liquid-liquid extraction
LMT - N-lauroyl-N-methyltaurate
LOD - Limit of detection
MASE - Microwave-assisted solvent extraction

xxix
MeCN - Acetonitrile
MEKC - Micellar electrokinetic chromatography
MeOH - Methanol
MSPD - Matrix solid phase dispersion
MSW - Municipal solid waste incinerator
NACE - Non-aqueous capillary electrophoresis
NaCl - Sodium chloride
NM - Normal mode
NSM - Normal stacking mode
OPPs - Organophosphorous Pesticides
PBDE - Polybrominated diphenyl ether
PCB - Polychlorinated biphenyls
PCDD - Polychlorinated dibenzodioxins
PCDF - Polychlorinated dibenzofurans
PLE - Pressurized liquid extraction
poly-SUS - Polysodium undecyl sulfate
REPSM - Reversed electrode polarity stacking mode
RSD - Residual standard deviation
SC - Sodium cholate
SDS - Sodium dodecyl sulphate
SEF - Sensitivity enhancement factor
SPE - Solid phase extraction
SPDE - Solid phase disc extraction
SPME - Solid phase microextraction
SDME - Single drop microextraction
SPMD - Semi permeable membrane devices
SRM - Standard Reference Material
SRMM - Stacking with reverse migrating micelles
SRW - Stacking with reverse migrating micelles and a water
plug
TEF - Toxic Equivalent Factors
TEQ - Toxic Equivalent Concentrations
TCDD - Tetrachlorodibenzodioxins
- 2,3,7,8-tetracholordibenzo-p-dioxin

xxx
TCDF - Tetrachlorodibenzofurans
- 2,3,7,8-tetrachlorodibenzo-p-furan
UV - Ultraviolet

1
CHAPTER I
SUMMARY OF THESIS
1.1 Background
Since its introduction in the late 1980s, micellar electrokinetic
chromatography (MEKC) has been widely used in the pharmaceutical industry and in
environmental analysis. MEKC is a mode of capillary electrophoresis able to
separate both ionic and neutral analytes with the usage of charged micelles in a single
run. Separation by electrophoresis is obtained via differential migration of solutes of
charged species in an electric field performed in narrow-bore capillaries with inner
diameter (i.d) of 25-75 µm filled only with buffer. Its advantages lie in its flexibility
in manipulating various parameters on-column in order to obtain the best separation
and to improve sensitivity. Furthermore, separation time is faster compared to
conventional methods such as gas chromatography and high performance liquid
chromatography with very little sample and solvent requirement.

2
1.2 Summary of Thesis
This study was conducted into two parts as two different separation
conditions were used. The first part was the study on separating polychlorinated
dibenzo-p-dioxins (2,3,7,8-tetrachlorodibenzo-p-dioxin) and polychlorinated
dibenzo-p-furans (2,3,7,8-tetrachlorodibenzo-p-furan) which were conducted under
basic conditions. The second part was the study of three hydrophilic
organophosphorous pesticides (OPPs) under acidic buffer conditions. The three
hydrophilic organophosphorous pesticides were monocrotophos, dicrotophos and
phosphamidon. This chapter summarizes every chapter covered in this work.
Chapter 2 introduces the background behind this work. It explains in detail
the physical and chemical properties of the test analytes which are the
polychlorinated compounds (PCDDs and PCDFs) and the hydrophilic pesticides.
The potential routes of PCDDs and PCDFs in humans and wildlife are also
discussed. While for the OPPs, we touched on the toxicity of the pesticides. Various
extraction and detection methods are also discussed for both class of analytes in this
chapter. On-line preconcentration methods using MEKC are also discussed in detail.
The objectives of this study and the problem statements are also covered.
Chapter 3 discusses the experimental methods used in this work. The
instrumental aspect covers the capillary electrophoresis system used for our analysis
and the extraction set-up used. Conditioning of the capillary was also discussed in
detail for both polychlorinated compounds and pesticides analysis. For both
polychlorinated compounds and the pesticides, the methodology used in optimizing
parameters and online preconcentration techniques used are found in Chapter 3.
Sample preparation and extraction methods for both analytes are covered in Chapter
3.
Chapter 4 covers the optimization of parameters used in the MEKC analysis
of TCDF and TCDD. The parameters optimized are the fraction of organic modifier
used in the running buffer in order to improve peak resolution. Single modifiers used
were methanol and acetonitrile at various percentages in the running buffer. These

3
were then compared with mixed modifier mode at different fractions of acetonitrile
and methanol in the running buffer. The second parameter involved the type of
sample matrix used. In aqueous mode, the analytes were diluted in water and in the
same fraction as the running buffer. While for non-aqueous mode, analytes were
diluted in the organic solvent which was ethanol. Different sample matrixes were
investigated to study the effect of the sample matrix on separation efficiency.
Chapter 5 explores the various on-line preconcentration techniques used to
reduce the detection limit for both TCDF and TCDD. Five types of on-line
preconcentration techniques were used which were normal stacking mode (NSM),
reversed electrode polarity stacking mode (REPSM), high conductivity sample
stacking mode (HCSSM), sweeping and field-enhanced sample injection (FESI).
Out of the five, the on-line preconcentration technique which gives the best limit of
detection (LOD) would be chosen to be applied to the real sample. HCSSM was
chosen as the optimized stacking method. This is then followed by off-line
preconcentration technique which is solid phase disc extraction (SPDE) to further
reduce the existing limit of detection (LOD) by offering sample enrichment. SPDE
is also able to do sample clean-up by removing interference in the matrix that would
interfere with the analysis. The combined HCSSM-SPDE was then applied to real
sample analysis of spiked deionised water and effluent water obtained from a pulp
mill at Temerloh, Pahang.
Chapter 6 involves the analysis of three hydrophilic OPPs which are
dicrotophos, monocrotophos and phosphamidon. In this chapter, the analysis using
MEKC was conducted under acidic conditions. This section discusses the
wavelength optimization for analyzing the three analytes using diode-array detection
(DAD). The wavelength that offers the best peak area and peak height was used in
the stacking method. Stacking with reverse migrating micelles (SRMM) was used to
reduce the detection limit (LODs) of the three analytes. This is followed by solid
phase disc extraction (SPDE) in order to reduce the LODs further by offering sample
enrichment and clean-up. The combined SRMM-SPDE was then applied to
analyzing spiked pond water obtained from the UTM lake.

4
Chapter 7 presents the conclusions and suggestions for further studies. This
chapter summarizes the results obtained throughout the study such as the optimized
conditions and recovery studies from the extraction method. Suggestions are
presented and discussed for further improvement of the study for future usage.