the danish dioxin monitoring programme ii dioxin in the
TRANSCRIPT

National Environmental Research InstituteMinistry of the Environment . Denmark
The Danish Dioxin Monitoring Programme II
Dioxin inthe Atmosphereof DenmarkA Field Study at Selected Locations
NERI Technical Report No. 565

[Tom side]

National Environmental Research InstituteMinistry of the Environment
The Danish Dioxin Monitoring Programme II
Dioxin inthe Atmosphereof DenmarkA Field Study at Selected Locations
NERI Technical Report No. 5652005
Jørgen VikelsøeHelle Vibeke AndersenRossana Bossi Elsebeth JohansenMary-Ann Chrillesen
Mads F. HovmandScience Consult

2
Data sheet
Title: Dioxin in the Atmosphere of Denmark
Subtitle: A Field Study at Selected Locations. The Danish Dioxin Monitoring Programme II.
Authors Jørgen Vikelsøe1, Mads F. Hovmand2, Helle Vibeke Andersen1, Rossana Bossi1,Elsebeth Johansen1, Mary-Ann Chrillesen1
Departments: 1Department of Atmospheric Environment2 Science Consult
Analytical laboratory: Elsebeth Johansen, Mary-Ann Chrillesen
Serial title and no.: NERI Technical Report No. 565
Publisher: National Environmental Research Institute URL: Ministry of the Environment
http://www.dmu.dk
Date of publication: March 2006
Referees: Niels Zeuthen Heidam and Marianne Glasius
Please cite as: Vikelsøe, J., Hovmand, M.F., Andersen, H.V., Bossi, R., Johansen, E. & Chrillesen,M.-A., 2005. Dioxin in the Atmosphere of Denmark. A Field Study at Selected Loca-tions. National Environmental Research Institute, Denmark. 83p – NERI TechnicalReport no. 565. http://Technical-reports.dmu.dk
Reproduction is permitted, provided the source is explicitly acknowledged.
Abstract: Occurrence and geographical distribution of dioxin was investigated in air anddeposition at selected locations in Denmark, three forest sites in the background area,a city site in Copenhagen and a village site. At two sites simultaneously determina-tion of dioxins concentrations in the ambient atmosphere and bulk precipitation werecarried out during a period of three years.
Keywords: Dioxin, PCDD, PCDF, PCDD/F, bulk deposition, air, through fall.
Layout: Majbritt Pedersen-UlrichDrawings: Jørgen Vikelsøe, Mads Hovmand
ISBN: 87-7772-910-2ISSN: 1600-0048
Number of pages: 83
Internet-version: The report is available only in electronic format from NERI’s homepagehttp://www2.dmu.dk/1_viden/2_Publikationer/3_fagrapporter/rapporter/FR565.pdf
For sale at: Ministry of the EnvironmentFrontlinienRentemestervej 8DK-2400 Copenhagen NVDenmarkTel. +45 70 12 02 [email protected]

3
Contents
Summary 5
Sammendrag 9
1 Introduction 111.1 Purpose 14
2 Experimental 152.1 Sampling programme 152.2 Sampling sites 162.3 Equipment 192.4 Sampling procedure 23
3 Analytical 253.1 Extraction and clean-up 253.2 Standards and spikes 273.3 GC/MS analysis 293.4 Toxic equivalents (TEQ) 313.5 Performance of analytical method 32
4 Results 354.1 Concentrations in air 354.2 Bulk deposition and through fall 39
5 Discussion and statistics 455.1 Air 455.2 Through fall 465.3 Bulk deposition 485.4 Role of deposition for soil 495.5 Role of deposition for sediment 515.6 Role of rain for bulk deposition 535.7 Role of deposition for cows’ milk 545.8 Role of deposition for the sea 545.9 National annual deposition 565.10 Correlation and regression analysis 565.11 Congener profiles 605.12 Principal component analysis (PCA) 665.13 Other studies 69
6 Conclusions 71
7 Acknowledgements 73
8 References 75
9 Abbreviations 81
Danmarks Miljøundersøgelser 82

4
Faglige rapporter fra DMU/NERI Technical Reports83

5
Summary
Aims The aim of the present investigation has been to measure the level ofdioxins in the atmosphere and bulk deposition in Denmark. The di-oxins consist of polychlorinated dibenzo-p-dioxins and polychlori-nated dibenzofurans, with the abbreviation “PCDD/F”. The geo-graphical and seasonal variations and influence from differentsources have been investigated through measurements at selectedrural, urban and marine sites. The annual Danish deposition is esti-mated from the measurements and compared to the dioxin contentfound in soil, lake and sea sediment and in milk and fish.
Measuring campaign The investigation began in the fall 2001 with preliminaryexperiments, and was then gradually expanded until springtime2005. PCDD/F were measured in bulk deposition at three forest sitesin the Danish background area: the western part of Jutland (Ulborg),northern part of Zealand (Frederiksborg) and Bornholm (in the BalticSea) and at one urban site (Copenhagen). In addition through fallwas measured in Frederiksborg. Through fall is the wet depositionpassing the crown of the trees. The PCDD/F concentrations in theambient air were measured in Frederiksborg and Copenhagen andperiodically in a village (Gundsømagle) close to residences withwood stoves.
Methods The sampling method for bulk deposition was developed for theproject and is based on absorption of dioxins on a filter in the field.Air was sampled according to US-EPA specifications. Samples weretaken monthly or in some cases over two months or pooled as twomonths values. The analytical method comprised extraction in tolu-ene, followed by classic clean up by liqiud chromatography on silicaand alumina. Detection and quantification was done by high resolu-tion GC/MS.
Air results The results for air show a pronounced seasonal variation withmaxima in the winter and a small year to year variation. The air con-centrations in North-Zealand and Copenhagen are very alike, point-ing to long range transport as a potential contributor to atmosphericPCDD/F at these sites. The village winter maximum is very pro-nounced, being the highest measured in the programme. The highconcentrations are must likely caused by local emissions from woodstoves during the heating season.
Bulk deposition results The bulk deposition results show a winter maxima, though not aspronounced as for the air concentrations. Some variation between theyears are also observed. The geographical distribution showed thehighest annual fluxes in Copenhagen and lowest in West-Jutland.Apart from Copenhagen, the geographical variation was within afactor two. This modest variation indicates that the dioxins in thebulk deposition most likely are dominated by contributions fromlong-range transport of dioxin from distant sources.

6
Through fall results The through fall results show some variation throughout the seasonsand the level is somewhat higher than the bulk deposition. Thehigher level is probably caused by a contribution from airbornePCDD/F, captured by the spruce canopy and later on transferred tothe ground by precipitation or adsorbed to organic material.
Annual national deposition The measurements of bulk deposition at the background stations areused to estimate an annual load to the Danish land area. The load isestimated to 4.5 pg/m2·day I-TEQ, corresponding to a total annualbulk deposition over the Danish land area of 72 g/year I-TEQ. TheDanish atmospheric emissions are estimated to be in the range 11-148g/year I-TEQ.
Congener TEQ profiles The main TEQ-contributor is 2,3,4,7,8-PeCDF followed by 1,2,3,7,8-PeCDD, 2,3,7,8-TCDD and the HxCDDs, despite the site, season andtype of samples, i.e. air samples, bulk deposition or through fall.
Correlation analysis Highly significant correlations are found between the airconcentrations in Frederiksborg and Copenhagen. A correlation isobserved between bulk deposition and through fall in Frederiksborg.No significant correlation is seen between air concentrations andbulk deposition or air concentrations and through fall in Frederiks-borg.
Role for soil The bulk deposition can roughly account for the dioxin contentfound in rural soil. Even though the bulk deposition measured inCopenhagen is higher than the rural results, it is not large enough toexplain the high soil concentrations found here.
Role for sediment An investigation of the content of dioxin in sediments of lakes showsresults that generally are too high to be explained by bulk depositionas the only source. This is also the case for sea sediment.
Human intake, fish The total atmospheric deposition to the surface of the western BalticSea is estimated to 1.3 mg I-TEQ/km2·year. From measurements ofthe content of dioxin in fatty pelagic fish (herring and salmon) and anestimation of the yearly production of biomass, it is demonstratedthat the uptake in fish corresponds to 0.4% of the flux of dioxins de-posited from the atmosphere. This means, that the atmospheric depo-sition carries a large surplus of dioxins into the Baltic Sea availablefor uptake in the food chains. Fish is an important source for humanintake of dioxins.
Human intake, dairy From the measurements the average deposition to the Danish landarea during the summer is estimated to 2.8 pg/m2·day I-TEQ. Thisflux is about six times more than the amount of dioxins in the milkproduced pr area unit by grazing cows in summer time. This sub-stantial surplus makes it likely that atmospheric deposition is respon-sible for a major part of the PCDD/F in cow milk and related dairyproducts, which, next to fish, are the most important source to hu-man intake of dioxin.

7
Other studies The air concentrations of dioxin measured in Denmark are at thesame level as reported from Sweden, all though results from theSwedish west coast show lower levels. Atmospheric concentrationlevels from other European sites have in general shown higher re-sults. The results found for the bulk deposition is in good agreementwith results from Northgermany.

8

9
Sammendrag
Formål Formålet med nærværende undersøgelse har været at bestemmeniveauet af dioxiner i luft og nedbør i Danmark. Dioxiner består afpolychlorerede dibenzo-p-dioxiner og polychlorerede dibenzofura-ner, der fælles forkortes til ”PCDD/F”. Den geografiske variationsamt variation med årstid og kildepåvirkning er undersøgt ved atmåle på lokaliteter i baggrundsområder, byområde og nær hav. Densamlede danske deposition er estimeret ud fra målingerne og sat iforhold til dioxinindhold fundet i jord, sø- og havsediment samt imælk og fisk.
Måleperiode Undersøgelsen begyndte i efteråret 2001 og er udvidet gradvist indtilslutningen af foråret 2005. Der er målt PCDD/F i nedbør på tre skov-stationer i det danske baggrundsområde: Vestjylland (Ulborg), Nord-sjælland (Frederiksborg) og Bornholm samt i et byområde (Køben-havn). Nedbøren er målt som bulk deposition. I Frederiksborg er derogså målt dioxin i gennemdryp, d.v.s. den nedbør, der passerer træ-kronen. Koncentrationen af dioxin i luft er målt i Frederiksborg ogKøbenhavn samt periodisk i en landsby (Gundsømagle) på en loka-litet tæt på husstande med brændeovn.
Metoder Metoden til prøvetagning af bulk deposition er udviklet til projektetog baseres på absorption af dioxin til filtermateriale i felten. Luftprø-ver er udtaget iht. US-EPA forskrifter. Der er udtaget månedsprøver,i visse tilfælde to-måneds prøver, sidstnævnte enten som samlet eks-ponering to måneder i felten eller som sammenlægning af to må-nedsprøver i laboratoriet. Analysemetoden består af ekstraktion itoluen fulgt af klassisk oprensning v.h.a. væskekromatografi på sili-kagel og aluminiumoxid. Påvisning og kvantificering af de forskelli-ge PCDD/F’er er udført ved højtopløsende GC/MS.
Luft resultater Resultaterne for luftmålingerne viser en tydelig årstidsvariation medmaksimum om vinteren og en relativ lille variation årene imellem.Luftkoncentrationen i Nordsjælland og København er meget ens,hvilket kan tyde på, at fjerntransporteret dioxin udgør et betydeligtbidrag til PCDD/F i luften på de pågældende lokaliteter. I landsbyener der hovedsagligt målt i fyringssæsonen og disse målinger viserhøjere værdier end samtidige målinger i Nordsjælland og Køben-havn. De høje værdier skyldes formentlig, at målingen er foretagettæt på kilder (brændeovne).
Bulk deposition resultater Resultaterne for bulk deposition viser en årstidsvariation medmaksimum om vinteren, men også med nogen variation årene imel-lem. Den geografiske fordeling viser den højeste deposition i Køben-havn og lavest i Ulborg. Udelades København, er den geografiskevariation en faktor to. Dette betragtes som en beskeden variation, derkan betyde, at dioxinindholdet i nedbøren hovedsageligt stammer fralangtransport af dioxin fra fjerne kilder.
Gennemdryp resultater Resultaterne for gennemdryp viser en betydelig variation åretigennem og tilsyneladende er variationen ikke årstidsafhængig.Gennemdryp giver et lidt højere gennemsnitsniveau end bulk depo-

10
sition, formentligt fordi PCDD/F fra luften afsættes i trækronerne ogsenere føres ned til skovbunden med regnen eller nedfaldne nå-le/organisk materiale.
Årlig landsdeposition Målingerne af bulk deposition i baggrundsområderne er brugt til atestimere et samlet gennemsnit til det danske landområde. Det bereg-nes til 4,5 pg/m2·d I-TEQ, hvilket svarer til en samlet deposition overhele landet på 72 g/år I-TEQ. Estimatet for det samlede danske atmo-sfæriske udslip af dioxiner er 11-148 g/år I-TEQ.
Kongener TEQ profiler Hovedbidraget til TEQ stammer fra 2,3,4,7,8-PeCDF fulgt af 1,2,3,7,8-PeCDD, 2,3,7,8-TCDD og HxCDD’erne, uanset lokalitet, årstid ellerhvorvidt der er målt i luft, nedbør eller gennemdryp.
Korrelationsanalyse Der er god korrelation mellem luftkoncentrationerne målt iFrederiksborg og København. Der er også en signifikant korrelationmellem bulk deposition og gennemdryp i Frederiksborg, men ingensammenhæng mellem luftkoncentration og bulk deposition h.h.v.gennemdryp.
Betydning for jord Det estimerede niveau af bulk deposition kan nogenlunde redegørefor dioxinindholdet i jord analyseret fra landområder. Selvom bulkdepositionen målt i København er højere end resultaterne fra bag-grundsstationerne, så er depositionen af dioxin i København ikke højnok til at forklare de koncentrationer, der er fundet ved analyse afjorden i byen.
Betydning for sediment Koncentrationerne af dioxin i sediment fra undersøgte søer ergenerelt for høje til at kunne forklares ved bulk deposition som ene-ste kilde. Dette gælder også havsediment.
Human indtagelse, fisk Den totale atmosfæriske deposition af dioxin til havoverfladen af denvestlige Østersø estimeres til 1,3 mg I-TEQ/km2·år. Ud fra målingeraf dioxinindholdet i fede pelagiske fisk (sild og laks) og en estimeringaf den årlige biomasseproduktion kan det anskueliggøres, at optageti fiskene svarer til ca. 0,4% af den atmosfæriske tilførsel af dioxiner tilhavoverfladen. Atmosfærisk deposition tilfører således Østersøen etstort overskud af PCDD/F, som er tilgængeligt for optagelse i føde-kæderne. Fede fisk fra Østersøen er en betydningsfuld kilde til be-folkningens indtagelse af dioxin.
Human indtagelse, mælk Gennemsnitsdepositionen om sommeren til danske landområder erestimeret til 2,8 pg/m2·d I-TEQ. Dette er omkring seks gange højereend den mængde, der findes i mælken produceret pr. arealenhed fragræssende køer over en sommer sæson. Dette betydelige overskudgør det sandsynligt, at atmosfærisk deposition er kilden til hoved-parten af dioxin i komælk og afledede mejeriprodukter, som næstefter fisk er den betydeligste kilde til human indtagelse.
Andre undersøgelser De fundne koncentrationsniveauer af dioxin i luft er ioverensstemmelse med svenske resultater, dog måles lavere værdierved den svenske vestkyst. Andre rapporterede luftkoncentrationerfra europæiske målestationer ligger generelt på et højere niveau. Re-sultaterne for bulk deposition i baggrundsområder er generelt i over-ensstemmelse med nordtyske målinger i baggrundsområder.

11
1 Introduction
The Belgian scandal In the Belgian dioxin scandal in 1999 PCB contaminated fodderresulted in unacceptable dioxin contamination of food. This causedan international attention focused on dioxin and food safety. Re-sponding to this situation, the EU countries took initiatives to reducethe dioxin exposure of the populations.
The Danish effort The Danish environmental effort commenced with a literature surveyof dioxin emissions in Denmark (Hansen et al. 2000 & 2003) carriedout on initiative of the Danish Environmental Protection Agency(DEPA). The survey indicated a lack of data for the dioxin levels andemissions in Denmark. As a response, the DEPA initiated in co-operation with NERI in 2002 a comprehensive series of investiga-tions, the Danish Dioxin Monitoring Programme. The programmeencompassed the most relevant environmental matrixes for dioxin,such as soil, compost, percolate, bio-ash, bulk deposition, air, sedi-ment, flue-gas and waste products from incineration and cow milk.Finally, the investigations comprise dioxin in human milk and emis-sions from private wood stoves; the last two investigations are still inprogress.
The Dioxin Monitoring Programme has yielded important informa-tion about dioxin in the Danish environment. The present report de-scribes the results from atmospheric measurements of dioxin, i.e. inair, bulk deposition and in through fall from a forest canopy.
The investigation has been supported financially by the Ministry ofthe Environment.
Dioxins Dioxin is not a single substance, but a whole family of compounds,which chemically consists of polychlorinated dibenzo-p-dioxins(PCDDs) and polychlorinated dibenzofurans (PCDFs), together re-ferred to as PCDD/Fs. PCDD/Fs is very persistent in the environ-ment, insoluble in water, but soluble in fat. Because of these proper-ties PCDD/Fs concentrate in the food chains, particularly in the fattissue of the organisms. The PCDD/Fs is introduced into the foodchains largely via atmospheric deposition over land or - in particular- sea, which therefore is an important route to human exposure.PCDD/Fs are aromatic planar compounds having a high affinity tocarbon, hence PCDD/Fs are easily bound to soot particles e.g. in theatmosphere.
Toxicological properties PCDD/Fs are among the most toxic environmental pollutantsknown. The individual PCDD/Fs congeners have widely differingtoxicological properties; some are highly toxic, whereas others are nottoxic at all. To cope with this, a widely used approach is to expressthe results in so-called toxic equivalents, TEQs, which sets the totaltoxicity of all congeners of a sample in relation to the one most toxiccongener, the “Seveso-dioxin“ 2,3,7,8-TCDD. In this way, the con-centrations of all congeners in the sample can be translated to a ficti-tious concentration of 2,3,7,8-TCDD having the same toxicity. Thus,the PCDD/Fs concentration in a sample is expressed as a single

12
number, simplifying the presentation of the results. More important,the results are made more relevant for environment and health byweighting the toxic congeners according to toxicity and ignoring theones not toxic.
Sources Contrary to many other pollutants, PCDD/Fs are not madeintentionally, but arise as unwanted by-products. According to cur-rent scientific consensus most PCDD/Fs are formed by combustionprocesses mainly as a consequence of human activities such as in-dustrial production, waste incineration, power plants, heating, trans-portation, metal production and fires. Hence, most of the PCDD/Fsformed are emitted to the atmosphere. According to the EuropeanDioxin Inventory, about 95% of all PCDD/Fs emissions were atmos-pheric, whereas the residual 5% is released to the aquatic environ-ment, or to soil. PCDD/Fs are also formed during certain chemicalprocesses with chlorine. Hence, a certain fraction is found in techni-cal or chemical products such as industrial chemicals, chlorinatedpesticides, sealant and paper, as well as in waste products such asfly-ash, filter dust and discarded electric appliances. In addition somenatural dioxin formation is believed to take place. For instance,PCDD/Fs may be formed in forest fires, vulcanos and lightning andreleased to the atmosphere.
Human exposure Humans are mainly exposed to PCDD/Fs by food intake, whereasthe direct intake through the skin or by inhalation is of minor im-portance for the general population. Humans are placed as the lastlink of the food chains and are therefore particularly exposed. Thehuman levels are subsequently higher than those found in manyanimals. For example, human milk contains about 15 times morePCDD/Fs than does cow milk. PCDD/Fs are suspected of being can-cerogenous, and further to exert a hormone like (anti-androgenic) ef-fect, which is believed to harm the human health, especially the re-productive health. The exposure of the foetus is particularly harmful,since the foetus is very vulnerable to hormones during the develop-ment in utero.
Point source measurements However, the quantification of PCDD/F sources is difficult anduncertain. Estimates of the total industrial emission of PCDD/Fs inthe atmosphere has traditionally been done by measurements onchimneys of large industrial point sources such as incinerators, metalworks, power-plants, chemical factories etc. But this straightforwardapproach suffers from a number of limitations. Evidently, it requiresthat all sources are known, but with incomplete knowledge there is asevere risk of overlooking unknown sources. Furthermore, since it isimpossible to measure on all chimneys, it is necessary to select someand make assumptions about the rest, usually by more or less uncer-tain analogy considerations. Aggravating the problem, the measure-ments on a chimney is performed over a very limited period of time,typically a few hours, thus introducing a risk of being un-representative by overlooking emissions peaks occurring at rare oc-casions during atypical operation conditions. In addition, chimneymeasurements cannot include diffuse sources. Finally, it requires amathematical model to evaluate or simulate the effect on the envi-ronment from the results from the point sources.

13
Atmospheric measurements In contrast, air and deposition measurements include atmosphericemissions from all sources. Atmospheric measurements include con-tributions from all sources, both point and diffuse sources, known aswell as unknown and in addition also emissions from such diffusesources as re-evaporation (e.g. from soil). Indeed, sources may bedetected and found by such measurements. Hence, using atmos-pheric measurements one can make more realistic estimates of thetotal emission, than is possible to estimate from data on pointsources. However, in spite of the many virtues there are also draw-backs of atmospheric measurements, the most serious of which arethe long sampling period required (years) to cover variations causedby climate, season, meteorology and emissions. Moreover, severalsampling stations are necessary to cover the geographical variation.From an analytical point of view, deposition measurements are tech-nically demanding and hampered by the lack of an internationalstandardised method.
Air Because PCDD/Fs are emitted mainly to the atmosphere, the air isthe most important medium for transport of PCDD/Fs from thesources to the environment (Harrad and Jones, 1992). Therefore at-mospheric measurements are well suited for tracking the transportand fate of PCDD/F. Many researchers believe that long range at-mospheric transport plays a significant role for the concentration inair, but also short-range transport and local sources may be impor-tant for the local concentrations. The relative significance of the dif-ferent transport routes is poorly investigated. The climate and themeteorological conditions are important for the atmospheric trans-port. During the residence in the atmosphere, a large fraction ofPCDD/Fs is bound to particles, especially to carbon in soot. This isparticularly the case in the winter, where the atmospheric soot con-tent is high and the temperature low. During the summer, a higherpercentage of PCDD/Fs are found in the vapour phase, particularlythe lighter congeners. The ultraviolet (UV) radiation in sunlight is themost important degradation mechanism for PCDD/Fs in the envi-ronment. In the absence of UV-light, e.g. in sediment, PCDD/Fs areextremely persistent, with estimated half-lives up to hundreds ofyears.
Deposition PCDD/Fs is transferred from the atmosphere to the terrestrial andmarine environment by atmospheric deposition. Atmospheric depo-sition consists of the material deposited as dry deposition, compris-ing particles and gasses, and wet deposition i.e. material transportedto the ground with precipitation, comprising particles and dissolvedcompounds. The processes that operate during deposition ofPCDD/Fs are poorly understood and investigated. The bulk deposi-tion is defined operationally as the substance flux collected in a fun-nel exposed to the atmosphere. It is believed to be a measure of thewet deposition and to a certain extent the dry deposition. However,no specific study of wet and dry deposition has been done in the pre-sent investigation.
Through fall Through fall is the bulk deposition measured below the canopy in aforest, in the present investigation a spruce plantation. It consists ofprecipitation that has passed through the canopy and organic matterfalling from the canopy, mostly spruce needles. These absorb

14
PCDD/Fs from air and deposition and carry an important part of thePCDD/Fs in the through fall. The average long term through fall fluxmeasured during a sufficiently long period (year) is believed to be agood estimate of the total deposition flux to the forest during that pe-riod. Because it presents a large and rough surface to the atmosphere,the spruce plantation has high collecting efficiency. Accordingly,spruce through fall measurements may yield an independent resultfor the deposition flux, which may be compared with the results forthe free bulk deposition in the same area.
1.1 Purpose
The overall purpose of the present investigation was to quantify thePCDD/Fs contamination of rural, urban, and marine sites throughmeasurements of bulk deposition and atmospheric concentrations.Specific purposes have been to:
• develop a sampling method for bulk deposition of PCDD/F
• estimate the bulk deposition at selected urban, rural and marinesites
• measure background level and annual variation for air and bulkdeposition
• estimate the total annual Danish deposition
• compare the total annual deposition with emission from knownsources
• compare bulk deposition with soil and sediment results
• measure through fall as an estimation of the total deposition fluxto a forest
• compare bulk deposition with through fall results to check themethod
• compare the bulk deposition with through fall at the same site toget an estimation of the dry deposition load
• measure and compare air concentration at different sites (rural,urban, village)
• investigate the relative importance of local sources/long rangetransport

15
2 Experimental
2.1 Sampling programme
The sampling of bulk deposition and through fall started at the be-ginning of 2002 in the forest site Frederiksborg in North Zealand.Later in 2002 the forest site Ulborg, located in Western Jutland not farfrom the North Sea, was added to the programme. In 2003 the pro-gramme was extended with the urban site of Copenhagen BotanicalGarden. The soil investigation in the Dioxin Monitoring Programmehad previously shown high PCDD/Fs concentration in parks andgardens of Copenhagen. The purpose with this urban site was toshow whether atmospheric deposition could be the cause of thesehigh soil concentrations. At the same time a site at the island ofBornholm in the Baltic Sea was included in order to investigate theimportance of PCDD/Fs deposition over the Baltic Sea, where highPCDD/Fs content in salmons had recently caused public concern.This is the first study of PCDD/Fs deposition over the Baltic Sea.
The air programme started simultaneously with deposition atFrederiksborg and Copenhagen Botanical Garden. In late summer2002 the programme was extended to the village site Gundsømagle,in order to investigate the local atmospheric environment in a villagewhere many wood stoves were used for additional domestic heating.The programme is summarised in Table 1.
Table 1. The monitoring programme for atmospheric PCDD/F
Site Location, description Matrix Period
Roskilde N-Zealand, near Roskilde fjord (preliminary test) Depo Nov 01 & Jan 02
Frederiksborg N-Zealand, in Frederiksborg forest Depo, Feb 02 – Jun 05
- do - - do - Air Feb 02 – Aug 05
- do - - do - Through fall Feb 02 – Mar 04
Ulborg Jutland W- (North Sea) coast, in Ulborg forest Depo Jul 02 – Mar 05
Copenhagen Botanical Garden in central city Depo, Air Mar 03 – Dec 04
Bornholm S-E corner of the Island in the Baltic Sea Depo Mar 03 – Apr 05
Gundsømagle Village in N-Zealand, near Roskilde fjord Air Nov 02, Aug – Dec 03
- do - do - Air Sep 04 – Aug 05
In connection with the wood-stove project in Gundsømagle men-tioned below, the air measurements in Frederiksborg will be contin-ued until the summer 2005.

16
2.2 Sampling sites
Since 1985 the two forest sampling sites (Frederiksborg- and UlborgForest Districts) have served as monitoring sites for advanced studiesof atmospheric input of contaminants and studies of mineral cyclingin the forest (Andersen et al. 1993; Hovmand and Bille-Hansen, 1999).Since 1989/90 the Ulborg-, Frederiksborg- and Bornholm monitoringstations have been major monitoring sites in the “Nation-widemonitoring program” on nutrient input to the aquatic environment(Kronvang et al., 1993, Hovmand et al., 1992). It is a major advantagethat all sites used in the PCDD/Fs monitoring program have a longrecord on concentrations and depositions of other pollutants, in orderto document the general pollution climate in the area and to facilitatea professional maintenance of the sampling procedures. A generaldescription of the two experimental stations Frederiksborg and Ul-borg was reported by Bille-Hansen et al. (1994), Hovmand and Bille-Hansen (1999), ICP-forest/EU-Level.II (2002). Forest growth, litterfall, water and mineral fluxes as well as air pollution inputs to thesites were well documented. Pollution levels at both stations reflectthe average situation of the region.
Figure 1 shows the geographical location of the sites where atmos-pheric PCDD/Fs has been measured. Two German monitoring sta-tions, to be used for comparison, were indicated (Knoth et al., 2000).
N
Bornholm
Frederiksborg
Ulborg
Sild
Zingst
100 km
CopenhagenGundsømagle
Figure 1. Map of sampling sites for PCDD/Fs in the atmosphere of Den-mark and northern Germany.
17
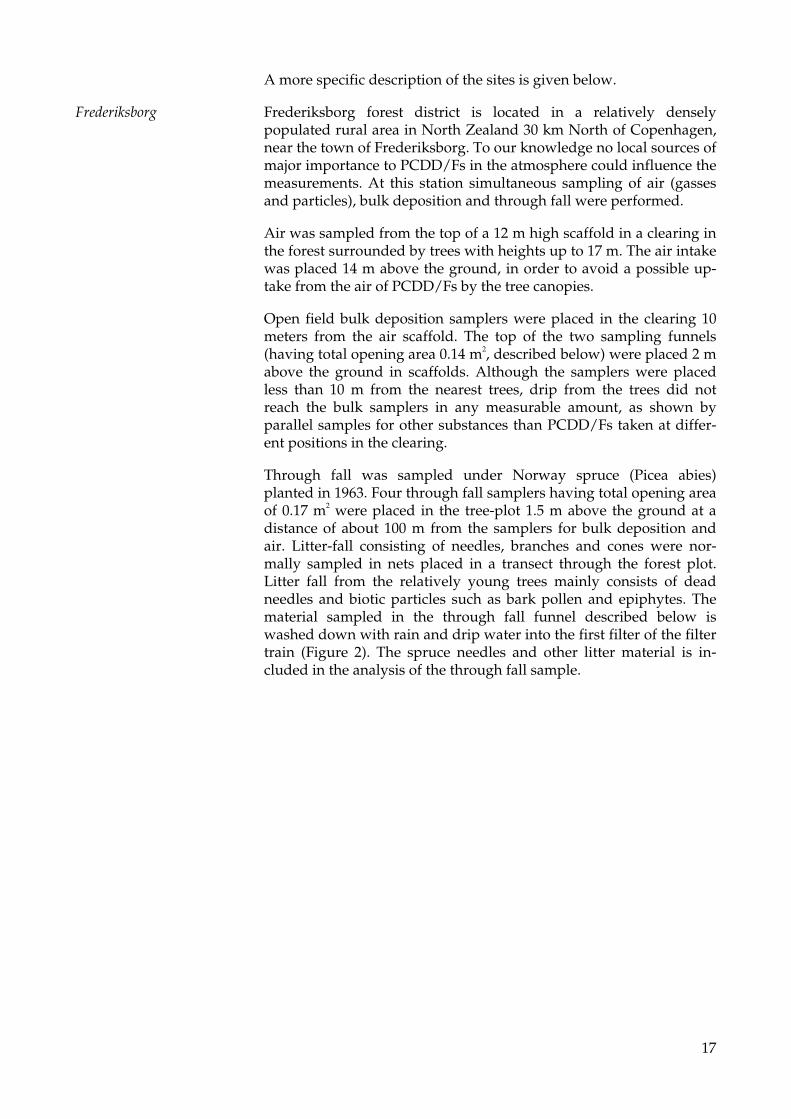
A more specific description of the sites is given below.
Frederiksborg Frederiksborg forest district is located in a relatively denselypopulated rural area in North Zealand 30 km North of Copenhagen,near the town of Frederiksborg. To our knowledge no local sources ofmajor importance to PCDD/Fs in the atmosphere could influence themeasurements. At this station simultaneous sampling of air (gassesand particles), bulk deposition and through fall were performed.
Air was sampled from the top of a 12 m high scaffold in a clearing inthe forest surrounded by trees with heights up to 17 m. The air intakewas placed 14 m above the ground, in order to avoid a possible up-take from the air of PCDD/Fs by the tree canopies.
Open field bulk deposition samplers were placed in the clearing 10meters from the air scaffold. The top of the two sampling funnels(having total opening area 0.14 m2, described below) were placed 2 mabove the ground in scaffolds. Although the samplers were placedless than 10 m from the nearest trees, drip from the trees did notreach the bulk samplers in any measurable amount, as shown byparallel samples for other substances than PCDD/Fs taken at differ-ent positions in the clearing.
Through fall was sampled under Norway spruce (Picea abies)planted in 1963. Four through fall samplers having total opening areaof 0.17 m2 were placed in the tree-plot 1.5 m above the ground at adistance of about 100 m from the samplers for bulk deposition andair. Litter-fall consisting of needles, branches and cones were nor-mally sampled in nets placed in a transect through the forest plot.Litter fall from the relatively young trees mainly consists of deadneedles and biotic particles such as bark pollen and epiphytes. Thematerial sampled in the through fall funnel described below iswashed down with rain and drip water into the first filter of the filtertrain (Figure 2). The spruce needles and other litter material is in-cluded in the analysis of the through fall sample.

18
Figure 2. The 12 meter high scaffold in Frederiksborg. The rain protectedair-intake is seen at the top
Ulborg Ulborg is located in a sparsely populated rural area of westernJutland 15 km east of the North Sea coast. Bulk deposition was sam-pled in Ulborg forest district near Ulborg. In the prevailing westerlywind, the site is believed to be representative of the deposition ofPCDD/Fs over the Eastern part of the North Sea. The sampling set-up for deposition is similar to that in Frederiksborg, comprising onesampler having 0.07 m2 opening. The local forest conditions weresimilar to those in Frederiksborg.
Bornholm Pedersker is a forest site located 0.2 km from the coast in the south-eastern corner of the island of Bornholm in the Baltic Sea. This site isexposed to air masses from the Baltic Sea by the prevailing wind di-rections from south, south-west and west. It may therefore be as-sumed that local sources play a minor role compared to long rangetransport of pollutants. One sampler having 0.07 m2 opening wasplaced in a clearing in the forest surrounded by low spruce trees of aheight up to 10 m. The site is described by Hovmand (2005).

19
Copenhagen The Botanical Garden is located in central Copenhagen. Bulkdeposition (one sampler of 0.07 m2) as well as air samples were col-lected at the site. The downtown city is heated almost exclusively bydistrict heating, and no large point sources such as heavy industry orincinerators were located within 2 km from the measuring site. Thetraffic is heavy in the city but the nearest larger road is 200 m fromthe sampling site. The site should give a good picture of thePCDD/Fs load in the urban environment. The sampling sites is de-scribed by Hovmand (2005).
Gundsømagle Gundsømagle is a small village located in North Zealand 5 km east ofRoskilde Fjord. The village is mainly residential, having many homeswith wood stoves used for additional heating as a supplement to theprevailing electrical heating. No other known atmospheric dioxinsources exist in or near the village. In the predominantly westerlywind, the village is exposed to air masses blowing from the fjord.Hence, the air is believed to be relatively free from PCDD/Fs fromlarge point sources, and the measurements supposed to reflect localconditions. The air measuring station is placed in the village near arow of houses (< 100 m) with wood stoves.
The project in Gundsømagle is connected with an investigating ofPCDD/Fs emissions from wood stoves, and the significance for thelocal atmosphere. That project, which will be reported separately, in-cludes measurements of PCDD/Fs in flue gas in chimneys in the vil-lage. The air measurements will be continued until the summer 2005.
A study of PAHs and particles emission from wood stove is also inprogress at the same site. The results from this study will also be re-ported separately (Glasius et al., 2005).
2.3 Equipment
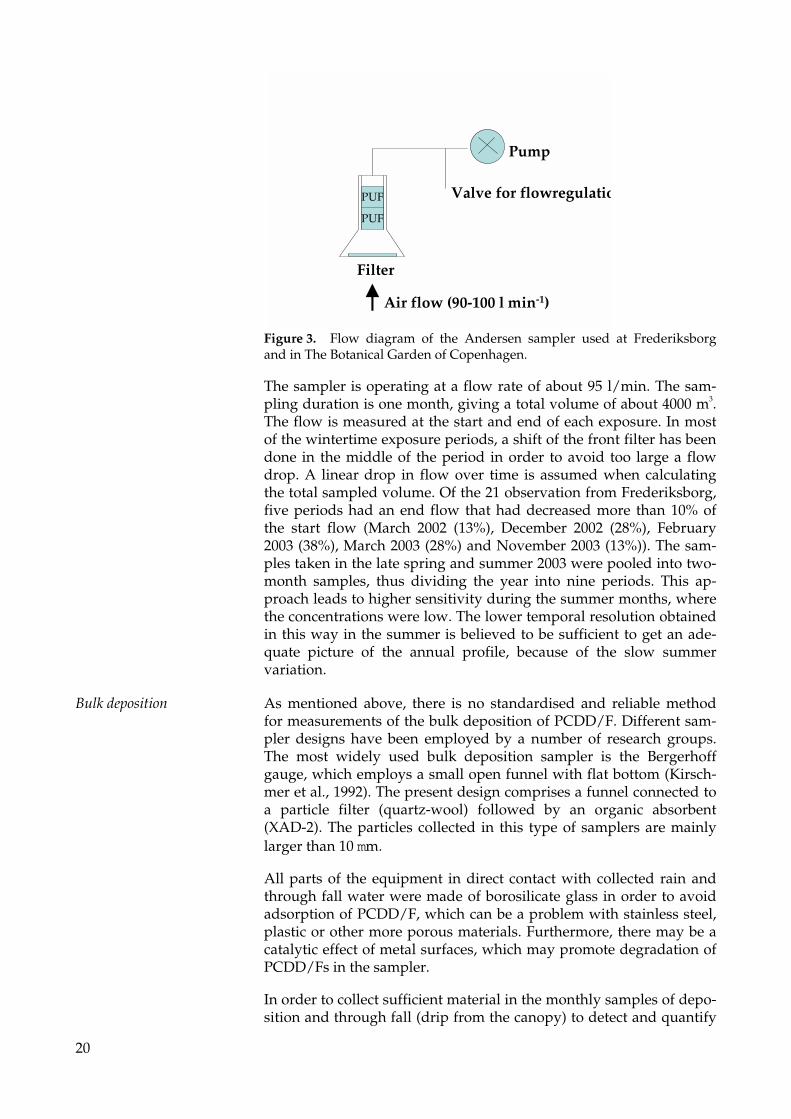
Air A dual-sampling module (type GPS1-1, Andersen Instruments Inc.,Smyrna, Georgia, USA), shown in Figure 3, is employed for the sam-pling of air (gasses and particles). The sampler is made of aluminium.The front part of the sampler contains a planar quartz fibre particlefilter (Whatman QM-A, 0.6 µm, 10.2 cm in diameter), supported by anet made of stainless steel. The sampler narrows down to the secondpart, containing a glass cylinder with two polyurethane foam (PUF)plugs in series (Søm og Plastskum Fabrikk, Sunde, Norway). Thedensity of the PUF is 0.02 g/cm3. Each plug is 5 cm long and with adiameter of 6.5 cm. The method is the same as used in the US EPA’sNational Dioxin Air Monitoring Network (Ferrario et al., 2001).
20
Figure 3. Flow diagram of the Andersen sampler used at Frederiksborgand in The Botanical Garden of Copenhagen.
The sampler is operating at a flow rate of about 95 l/min. The sam-pling duration is one month, giving a total volume of about 4000 m3.The flow is measured at the start and end of each exposure. In mostof the wintertime exposure periods, a shift of the front filter has beendone in the middle of the period in order to avoid too large a flowdrop. A linear drop in flow over time is assumed when calculatingthe total sampled volume. Of the 21 observation from Frederiksborg,five periods had an end flow that had decreased more than 10% ofthe start flow (March 2002 (13%), December 2002 (28%), February2003 (38%), March 2003 (28%) and November 2003 (13%)). The sam-ples taken in the late spring and summer 2003 were pooled into two-month samples, thus dividing the year into nine periods. This ap-proach leads to higher sensitivity during the summer months, wherethe concentrations were low. The lower temporal resolution obtainedin this way in the summer is believed to be sufficient to get an ade-quate picture of the annual profile, because of the slow summervariation.
Bulk deposition As mentioned above, there is no standardised and reliable methodfor measurements of the bulk deposition of PCDD/F. Different sam-pler designs have been employed by a number of research groups.The most widely used bulk deposition sampler is the Bergerhoffgauge, which employs a small open funnel with flat bottom (Kirsch-mer et al., 1992). The present design comprises a funnel connected toa particle filter (quartz-wool) followed by an organic absorbent(XAD-2). The particles collected in this type of samplers are mainlylarger than 10 mm.
All parts of the equipment in direct contact with collected rain andthrough fall water were made of borosilicate glass in order to avoidadsorption of PCDD/F, which can be a problem with stainless steel,plastic or other more porous materials. Furthermore, there may be acatalytic effect of metal surfaces, which may promote degradation ofPCDD/Fs in the sampler.
In order to collect sufficient material in the monthly samples of depo-sition and through fall (drip from the canopy) to detect and quantify
PUF
PUF
Pump
Filter
Air flow (90-100 l min-1)
Valve for flowregulatio

21
PCDD/F, large sampling areas were required. It would have beenbest to use 1 m2 sampling area, but because the handling of the fragileglass funnels under field conditions is difficult, we realised that a to-tal weight of the funnel exceeding 10 kg, corresponding to 0,07 m2collecting area, would be impractical to handle. In addition, largerfunnels are not standard glassware, and they are difficult to manu-facture. In order to increase the total collecting area, samplers weresometimes employed in pairs or quadruples.
Laboratory bottles (Scott Mainz, Cat. No 21 801 91) with a volumecapacity of 10 l (through fall) or 20 l (deposition) were converted tofunnels by removing the bottom. The collecting areas of the samplingfunnels were 0.043 m2 and 0.07 m2, respectively. The height of the rimis 30 cm, giving sufficient sampling capacity for snow under Danishwinter conditions, and further reducing splash-back and light inten-sity on the filter. This funnel is comparable to the modified Germansampler (VD 2119) used by Horstmann and McLachlan (1997), Knothet al. (2000) for sampling of PCDD/Fs and PCB, and by Guerzoni etal. (2004).
A spherical ground glass joint was fused to the bottleneck of the fun-nel (Figure 4), connected via a long glass tube, which adds pressureto the gravity-assisted flow, to a sampling train comprising two fil-ters: a quartz wool plug that retains particles from rainwater fol-lowed by a XAD-2 filter that absorbs dissolved PCDD/Fs. The filtermaterials were supported by glass frittes in the filter tubes. All tubeswere suspended in the funnel, connected by ground glass joints se-cured by clamps.
A stainless steel casing surrounds the glass funnel, keeping it in po-sition. A rubber seal mounted on the upper rim of the encasing tight-ens between encasing and funnel, to avoid leakage of rainwater onthe outer side of the funnel and filter train. The funnel was protectedfrom light by the steel encasing and the filters by a black plastic tubeas shown in Figure 4. The long suspension tube reduces the intensityof light falling on the quartz-wool filter. For further light protectioneach glass filter tube is wrapped in aluminium foil. The plastic tube isinsulated and a low voltage thermostatic heating element keeps theglass tubes frost-free. This precaution is necessary, since in prelimi-nary experiments the glass broke because of ice formation during thesubsequent freezing and thawing often encountered in Danish win-ters.

22
Figure 4. Schematic diagram of sampler for bulk-deposition and through fall.
Our sampler design differs from other similar samplers in the fol-lowing ways:
• We use an all-glass system without plastic or steel surfaces incontact with the sample
• Particle and absorption filters are used in stead of collecting therainwater
• Quartz-wool depth filter are used instead of planar filter or sox-hlet crucible
• XAD-2 is used as absorbing material instead of PUF
• Heating is applied to avoid glass breakage due to freezing and tomelt snow
The design offer several advantages compared to other depositionsamplers
• The all-glass system gives lesser absorption and catalytic degra-dation
• It is easier to clean than plastic or metals
• The filters were easy to ship and store compared to samples col-lected in bottle, or to Bergerhof gauges.
• The quartz-wool filters were less likely to clog compared to pla-nar filters.
• The light protection is much better than the more open designs(e.g. Bergerhof).
In Frederiksborg, the samplers were employed in pairs, giving a totalarea of 0.14 m2. For through fall, four parallel smaller funnels of 0.043m2 were used, giving a total area of 0.17 m2 (Table 2). At other sta-tions only one deposition sampler is employed.
Glass funnel
Spherical glass joint
Glass tube withquartz wool
Glass tubewith XAD-2
Plastic tube
Stainless steelencasing (holder)
Heatingelement

23
The combined sampling area and the collected average annualamount of water is shown in Table 2 in addition to the actual regis-tered amount of water sampled during the one-year experimental pe-riod.
Table 2. Sampling area of samplers and amount of water in combined samples. Air volume sampled by thehigh volume sampler.
Site Depositionsample
Funnelarea
n Samplingarea
Sampled wa-ter amount
Sampled airvolume
Unit m2 m2 l/year m3/year
Frederiksborg Open field 0.07 2 0.14 82 48,000
Frederiksborg Through fall 0.043 4 0.17 83
Ulborg Open field 0.070 1 0.07 60
Copenhagen Open field 0.070 2 0.14 82 48,000
Bornholm Open filed 0.070 2 0.14 70
Gundsømagle 48,000
2.4 Sampling procedure
General Samplers were changed with an interval of one or two, occasionallythree months for deposition samples. A check schema was filled outwith sampling data and observations concerning the state of thesamplers. Exposed samples were kept cool and dark in transportboxes, and sent to the laboratory for analyses.
Deposition filter shift The filter tubes were packed in the laboratory and shipped to thestation. Before use, the quartz-wool is cleaned by soxhlet extractionin CH2Cl2, XAD-2 in toluene. After air-drying, 2.5 g of quartz-wool or20 g of XAD-2 is carefully packed into clean filter tubes, which con-tain glass frittes to support the filter material. The quartz-wool filteris then spiked with sampling spike solution as described in the ana-lytical section.
At the station, the funnel is rinsed with distilled water, which is al-lowed to run through the exposed filter train. This is then removed,and a new one mounted, leaving the funnel in place. Snow collectedin the funnel was normally left over for the next sampling period.However, in case of very severe snowfall in prolonged frost periods,is has been necessary to thaw the snow using an electrical heatinglamp.
Funnel cleaning In the first years of the programme, the funnels were rinsed withsolvents at rare occasions at the station in field conditions. Once ayear the funnel was dismounted and cleaned thoroughly in the labo-ratory, finished by annealing at 450 C. However, to clean the funnelcompletely after an exposure period that long proved very difficult.Furthermore, it was feared that the dirt and soot residing in the fun-nel could bind PCDD/F, preventing it from reaching the filter train;this could in theory lead to loss of PCDD/F. Hence, a more rigorousrinsing procedure was introduced. According to this, after the waterrinse and after the exposed filter train has been removed, the funnelwas further rinsed with acetone (to remove residual water and pre-

24
liminary dissolve PCDD/F) followed by toluene (to dissolve residualPCDD/Fs and desorb it from soot). The solvents were collected in abottle, and analysed together with the sample. To check the impor-tance of the rinsing, the solvents have been analysed separately on asingle occasion, as reported in the section on Analytical performance.
Air Before use, the PUF was cleaned by soxhlet extraction in toluene. ThePUF plugs were dried and packed into clean glass tubes in the labo-ratory, and were then mounted in the clean sampler. The particle(QFF) filter was mounted in the sampler and spiked with samplingspike mix as described in the Analytical chapter. The complete sam-pler was then shipped to the sampling station.
In wintertime the particle load on the QFF filter increased, and amidway change of particle filter was necessary in order to avoidflow-drop. This operation was performed at the station. The halfway-exposed QFF filter was removed and packed in aluminium foil, and anew spiked QFF filter mounted.

25
3 Analytical
Principle The filters of the air (QFF and PUF) or deposition sample(Quartzwool and XAD-2) were combined, and spiked with a mixtureof eleven 13C12-labelled PCDD/Fs congeners, the extraction spike mix.The spiked combined sample was extracted in toluene. The extractwas concentrated followed by classic clean up on SiO2/NaOH,SiO2/H2SO4 and acidic Al2O3. The analysis was performed by GC/MSat 10000 resolution. The spiking programme, as well as the clean-upand mass spectrometric (MS) analysis is adapted from a modifiedversion of the European standard for analysis of dioxin in flue gasses(CEN, 1996).
3.1 Extraction and clean-up
Pre-treatment of samples Before sampling, the particle filter (quarts wool for a depositionsample or QFF filter for air samples, respectively) was spiked with asampling spike mixture containing three 13C12- labelled PCDFs intoluene (Table 3) according to European standard EN 1948-1 (CEN,1996). In case of a midway shift of QFF filter for an air sample, thenew filter was spiked in the same way as the first one.
After sampling, the quarts wool of a bulk deposition sample wassucked dry by vacuum. The exposed samples were stored at 4 C untilanalysed.
Chemicals Toluene Rathburn, glass distilled
n-hexane Rathburn, glass distilled
CH2Cl2 Rathburn, HPLC grade
Na2SO4 Merck, anhydrous, analytical grade
SiO2 (silica) Merck, Kieselgel 60, 0.063-0.20 mm
H2SO4 Merck, analytical grade
NaOH Merck, analytical grade
Al2O3 ICN Biomedicals, Alumina A
n-dodecane BDH, Purity > 99% (GC area)
PFK Fluka, Perflourokerosene, High boiling,for mass spectroscopy
Extraction Before extraction, the filters of a sample (either air, deposition orthrough fall) were combined. In case of pools, either from parallelsamplers, or consecutive monthly samples, or both, all filter materialwas combined in the same extraction. Then 100 µl of extraction spikemixture was added, containing eleven 13C12-labelled congeners (0.4 ngtetra-hexas, 0.8 ng hepta-octas, Table 4). Air samples were Soxhletextracted (without crucible) for 20 hours with 700 ml of toluene. Bulkdeposition samples were refluxed using Dean-Stark water removaltrap for 20 hr with 700 ml of toluene. The extract was filtered throughfilter paper. A volume of 0.5 ml of n-dodecane was added as a
26
keeper, and the extract concentrated to a volume of about 0.5 ml invacuum using a rotary evaporator operating at 35 C, 25 torr.
Clean-up Clean-up was then performed by classical column chromatographyusing SiO2 /NaOH, SiO2/H2SO4, acidic Al2O3.
The extract was dissolved in 3 ml of n-hexane, and applied to the firstof two columns coupled in series, containing (mentioned from top tobottom):
Column 1: (2.5 x 12 cm fitted with reservoir 250 ml)
• 1 g anhydrous Na2SO4.
• 1 g SiO2 (activated at 150 C),
• 4 g SiO2 containing 33% 1 M NaOH
• 1 g SiO2
• 4 g SiO2 containing 44% conc. H2SO4
• 2 g SiO2
Column 2: (1 x 17 cm)
• 1 g anhydrous Na2SO4.
• 6 g acidic Al2O3 (activated at 250 C).
Both columns were eluted in series with 90 ml of n-hexane. The col-umns were disconnected, and column 2 alone eluted with 20 of ml n-hexane. Both eluates, which contain impurities, were discarded.
The PCDD/Fs fraction, which was adsorbed on the Al2O3, was elutedwith 20 ml of a mixture of CH2Cl2/n-hexane 20/80 (v/v).
The eluate, which contains the cleaned PCDD/Fs fraction, was con-centrated to about 1 ml under N2. Then 25 ml of syringe spike solutioncontaining two 13C12 - PCDDs in n-dodecane (Table 5) was added, thespike also functioning as a keeper. The evaporation was continued tonear 25 ml. The sample was transferred to an injection vial, ready foranalysis by GC/MS.
Blanks For each analytical series blanks were included by subjectingunexposed filters and glassware to the total extraction and clean upprocedure as described above. For air, laboratory blanks were madeby analysing a QFF filter and two PUF plugs. For deposition, sam-pling blank (so-called “box-blank) were made by keeping a spikedfilter train in a box on the sampling station during the sampling pe-riod. The blank results were subtracted from the results of the un-known on an amount per sample basis for each analytical series. Forresults of blanks see section on Analytical Performance.
27
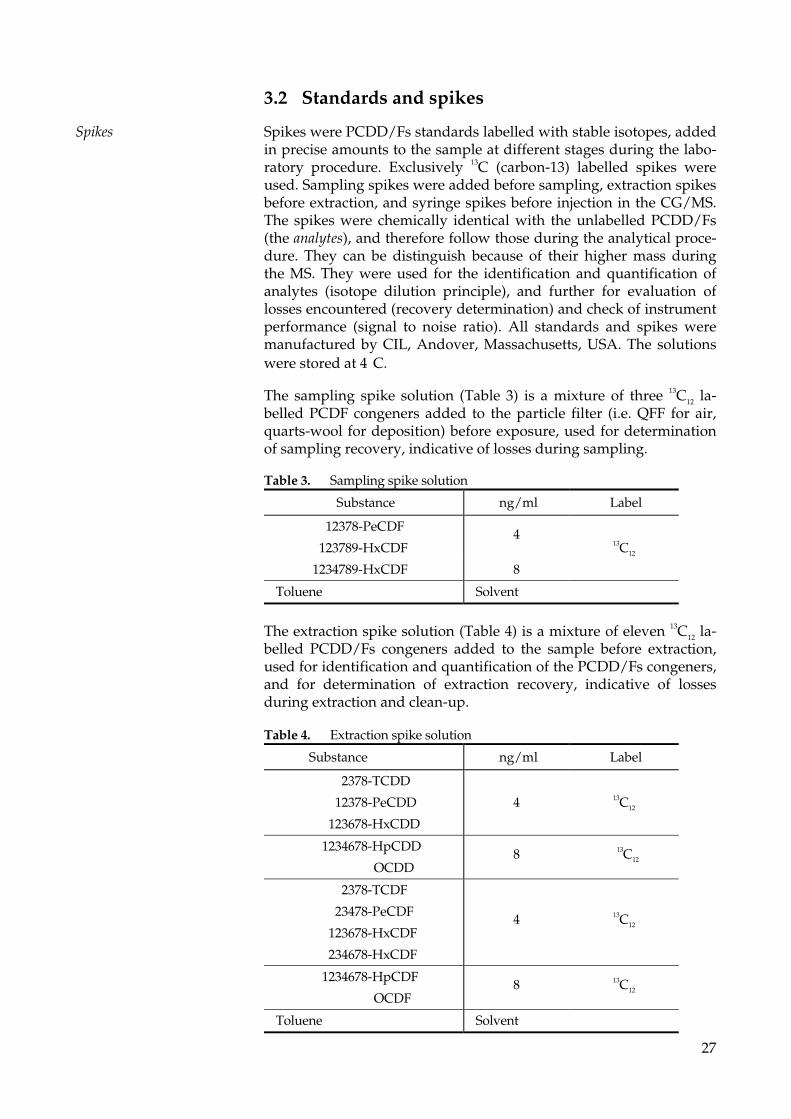
3.2 Standards and spikes
Spikes Spikes were PCDD/Fs standards labelled with stable isotopes, addedin precise amounts to the sample at different stages during the labo-ratory procedure. Exclusively 13C (carbon-13) labelled spikes wereused. Sampling spikes were added before sampling, extraction spikesbefore extraction, and syringe spikes before injection in the CG/MS.The spikes were chemically identical with the unlabelled PCDD/Fs(the analytes), and therefore follow those during the analytical proce-dure. They can be distinguish because of their higher mass duringthe MS. They were used for the identification and quantification ofanalytes (isotope dilution principle), and further for evaluation oflosses encountered (recovery determination) and check of instrumentperformance (signal to noise ratio). All standards and spikes weremanufactured by CIL, Andover, Massachusetts, USA. The solutionswere stored at 4 C.
The sampling spike solution (Table 3) is a mixture of three 13C12 la-belled PCDF congeners added to the particle filter (i.e. QFF for air,quarts-wool for deposition) before exposure, used for determinationof sampling recovery, indicative of losses during sampling.
Table 3. Sampling spike solution
Substance ng/ml Label
12378-PeCDF
123789-HxCDF4
13C12
1234789-HxCDF 8
Toluene Solvent
The extraction spike solution (Table 4) is a mixture of eleven 13C12 la-belled PCDD/Fs congeners added to the sample before extraction,used for identification and quantification of the PCDD/Fs congeners,and for determination of extraction recovery, indicative of lossesduring extraction and clean-up.
Table 4. Extraction spike solution
Substance ng/ml Label
2378-TCDD
12378-PeCDD
123678-HxCDD
4 13C12
1234678-HpCDD
OCDD8 13C12
2378-TCDF
23478-PeCDF
123678-HxCDF
234678-HxCDF
4 13C12
1234678-HpCDF
OCDF8 13C12
Toluene Solvent

28
The syringe spike solution (Table 5), containing two 13C12 labelledPCDD congeners in n-dodecane, is used for re-dissolving and dilutionof the sample. The presence of syringe spikes in the sample is neces-sary to calculate the recoveries. It is further used to check the injection,function and signal of the GC/MS system for each GC/MS run. Fi-nally, it is used during preparation of the external standard solutions.EN-1948 prescribes 13C12 –1,2,3,4-TCDD as syringe spike. This is synthe-sised solely for this purpose and is the only spike in the spiking pro-gramme which does not have a corresponding analyte.
Table 5. Syringe spike solution
Substance ng/ml Label
1234-TCDD
123789-HxCDD16 13C12
n-dodecane Solvent
External standards A series of external standard solutions (Table 6) was analysed byCG/MS for identification and quantification of the individual conge-ners, and for checking the performance of the mass spectrometer dur-ing the analysis. The solutions form a series of dilution, containing allthe 2,3,7,8-substituted congeners in increasing concentrations, given inthe first columns of the table. All solutions further contain the 13C12 la-belled standards (spikes) in the same concentration given in the lastcolumn of the table.
Table 6. External standard solutions
Substance Unlabelled 13C12
ng/ml ng/ml ng/ml ng/ml ng/ml ng/ml
1234-TCDD - - - - - 4
2378-TCDD 0.4 1 4 10 40 4
12378-PeCDD 0.4 1 4 10 40 4
123478-HxCDD 0.4 1 4 10 40 -
123678-HxCDD 0.4 1 4 10 40 4
123789-HxCDD 0.4 1 4 10 40 4
1234678-HpCDD 0.8 2 8 20 80 8
OCDD 0.8 2 8 20 80 8
2378-TCDF 0.4 1 4 10 40 4
12378-PeCDF 0.4 1 4 10 40 4
23478-PeCDF 0.4 1 4 10 40 4
123478-HxCDF 0.4 1 4 10 40 -
123678-HxCDF 0.4 1 4 10 40 4
123789-HxCDF 0.4 1 4 10 40 4
234678-HxCDF 0.4 1 4 10 40 4
1234678-HpCDF 0.8 2 8 20 80 8
1234789-HpCDF 0.8 2 8 20 80 8
OCDF 0.8 2 8 20 80 8
n-dodecane Solvent

29
The standard solutions of levels 1, 4 and 10 ng/ml 2,3,7,8-TCDD wereused for quantification. To reduce the risk of carry-over from standardsto unknowns, the strongest standard was not included in the analysisof a series of weak samples, such as deposition samples. The weakeststandard solution (0.4 ng/ml TCDD) was used for checking the signalto noise ratio (sensitivity) of the GC/MS system.
All standard solutions from 0.4 to 40 ng/ml (TCDD) were used forlinearity test of the GC/MS.
3.3 GC/MS analysis
Analytical sequence Each analytical series was analysed by GC/MS in the followingsequence:
Dilution series of external standards, a sample of pure n-dodecanefor control of carry-over, blank, the unknown samples, dilution seriesof external standards.
During long analytical series, extra standard series were insertedbetween the unknowns.
Gaschromatography (GC) Gaschromatograph: Hewlett-Packard 5890 series II
Injection: Automatic, CTC autosampler,3 ml split/splitless, 290 C, purge closed 40 sec,Restek gooseneck insert 4 mm
Pre-column: Chrompack Retention Gap,fused silica, 2.5 m x 0.32 mm i.Ø.
Column: Agilent J&W Scientific DB-5MS,fused silica, 60 m x 0.25 mm i.Ø,cross-linked phenyl-methyl silicone0.25 µm film thickness
Carrier gas: He, 150 kPa
Temperature- 40 sec at 200 C, 20 C/min to 230 C,programme: 3 C/min to 230 C, 28 min at 290 C
Transfer line: 290 C
Mass spectrometry Instrument: Kratos Concept 1S, high resolution magnetic sector mass spectrometer
Resolution: 10,000 (10% valley definition)
Ionisation: Electron impact (EI). Source temperature290 C, electron energy 35-45 eV depending ontuning, electron current 5 mA
Interface: Direct to ion source, 290 C
High voltage: Acceleration 8 kV, electron multiplier 2,5-3 kV
Noise filter: 300 Hz digital
Magnet stabilisation: Current
Solvent filament delay: 10 min

30
Coolant temperature: 19-21 C
Calibration gas: Perfluoro kerosene (PFK)
Scan parameters: Cycle time 1 secElectrostatic analyser (ESA) sweep 10 ppmLock-mass sweep 300 ppmLock-mass dwell 100 msecCheck-mass dwell 20 msecDwell per monitored mass 90-100 msecInter mass delay 10 msecFixed fly-back time 20 msec
Detection mode: Selected Ion Monitoring (SIM) using 5 win-dows with different mass combinations (“de-scriptors”, Table 7)
The descriptors contain masses for analytes and spikes. For each sub-stance class (i.e. sum formula) two masses were monitored, corre-sponding to the most intense lines in the molecular ion group of themass spectrum. In all windows was further used a lock-mass to cor-rect (automatically) for magnet instabilities, and a check-mass as adocumentation of correct mass-lock and instrument signal. Both wereprominent lines in the PFK mass spectrum.
Table 7. Selected ion monitoring (SIM) programme for mass spectroscopy
Substance m/z 1 m/z 2 m/z 313C12-
m/z 413C12-
Intensity %mz1/mz2
Group 1, Cl4 10-18 min
Lock/check
TCDF
TCDD
292.9824
303.9016
319.8965
304.9824
305.8987
321.8936
315.9419
331.9368
317.9389
333.9339
77.3
77.2
Group 2, Cl5 18-24 min
Lock/check
PeCDF
PeCDD
330.9792
339.8597
355.8546
342.9792
341.8567
357.8517
351.9005
367.8954
353.8976
369.8925
154.3
154.3
Group 3, Cl6 24-28 min
Lock/check
HxCDF
HxCDD
392.9760
373.8207
389.8156
392.9760
375.8178
391.8127
385.8610
401.8559
387.8579
403.8530
123.5
123.5
Group 4, Cl7 28-34 min
Lock/check
HpCDF
HpCDD
442.9729
407.7818
423.7767
442.9729
409.7788
425.7737
419.8220
435.8169
421.8189
437.8140
102.9
102.9
Group 5, Cl8 34-45 min
Lock/check
OCDF
OCDD
442.9729
441.7428
457.7377
442.9729
443.7398
459.7348
453.7860
469.7780
455.7830
471.7750
88.2
88.2

31
3.4 Toxic equivalents (TEQ)
The result is calculated in toxic equivalents according to the formula:
T C = E iiptox •∑
where:
Etox = Toxic Equivalents concentration in sample (TEQ, ng/kg)
Cip = Concentration of i'th isomer
Ti = Toxic Equivalent Factor (TEF) for i’th isomer, either In-ternational or WHO (Table 8)
International toxic equivalent factors (I-TEF) have been generallyused for many years. The newer WHO-TEF is regarded as more rele-vant for toxicity in humans. In the present investigation, the resultshave been calculated both systems. In Figures, I-TEQ are used tomake them comparable with other investigations.
Table 8. Toxic equivalent factors (TEFs)
Substance I-TEF WHO-TEF
2378-TCDD 1 1
12378-PeCDD 0.5 1
123478-HxCDD 0.1 0.1
123678-HxCDD 0.1 0.1
123789-HxCDD 0.1 0.1
1234678-HpCDD 0.01 0.01
OCDD 0.001 0.0001
2378-TCDF 0.1 0.1
12378-PeCDF 0.05 0.05
23478-PeCDF 0.5 0.5
123478-HxCDF 0.1 0.1
123678-HxCDF 0.1 0.1
123789-HxCDF 0.1 0.1
234678-HxCDF 0.1 0.1
1234678-HpCDF 0.01 0.01
1234789-HpCDF 0.01 0.01
OCDF 0.001 0.0001
Abbreviations: I-TEF = International toxic equivalent factor,WHO-TEF = World Health Organisation toxic equivalent factor

32
3.5 Performance of analytical method
Air To evaluate repeatability, in May 2002 a parallel sampling wasperformed at Frederiksborg and the results showed good agreement.Furthermore, to evaluate the collecting efficiency, a breakthrough ex-periment was performed in December 2002 by placing two extraPUF-plugs (a so-called “police filter”) after the normal filter train.The police filter was analysed separately.
Repeatability for two parallel samples: 6%.
Breakthrough in police filter experiment: 0.6%.
Recoveries (mean – sd all data): Sampling recovery 67% – 21%, ex-traction recovery 79% – 14%.
Detection limits, defined by signal to noise ratio on 2s level of sig-nificance, (mean all data): Ranging from 0.02 fg/m3 (OCDD) to 0.5fg/m3 (PeCDD).
Laboratory blanks
Bulk deposition To evaluate repeatability, a parallel sampling was performed inJanuary 2004 at Frederiksborg, by pooling the four filter trains in twopairs, which were analysed separately. The results showed a relativestandard deviation of 45%. This considerable deviation was probablycaused by the different amounts of spruce needles in the funnels,which was substantially larger for the pair having the highest result.Hence, this variation is inherent in the through fall itself because ofthe uneven spatial distribution of the litter over the forest floor, andis not caused by the sampling method itself. However, a lower varia-tion will result when all four funnels were analysed together, as isthe normal practice. This was anticipated during the planning of thecampaign, and it is the reason for the use of four funnels analysedtogether.
To evaluate the absorption efficiency, a breakthrough experimentwas performed in April 2004 by collecting the rainwater flowingthrough the normal filter train in a bottle. The rainwater was ana-lysed separately (using NERI in-house analytical method forPCDD/Fs in water by extraction in toluene).
A solvent rinsing experiment was performed in Frederiksborg Sep-tember 2004 in order to measure the amount of remaining PCDD/Fsin the funnel, and to test the efficiency of the rinsing procedure. Afterthe water rinse, the funnels were rinsed with acetone followed bytoluene. The rinsings were collected and analysed separately.
Repeatability for through fall (two parallel pairs of samples): 45%.
Breakthrough by collecting water through bulk deposition train:0.2%.
Funnel solvent rinse performed after water rinse (rinse/sample, %):First rinse with acetone 1.1%, second rinse with toluene 0.1%.

33
Detection limits for monthly samples, defined by signal to noise ra-tio on 2s level of significance (mean all data): Ranging from 0.1pg/m2·d (TCDD) to 8 pg/m2·d (OCDD).
Sampling recoveries for 13C12-1,2,3,7,8-PeCDD (mean – sd all data):Bulk deposition 40 – 23%, through fall 38 – 33%
Sampling recoveries for 13C12-1,2,3,4,7,8,9-HpCDD (mean – sd alldata):Bulk deposition 13 – 15%, through fall 26 – 11%.
Extraction recoveries (mean – sd all data): Bulk deposition 51 – 19%,through fall 45 – 9%.
Note on sampling recovery The sampling recoveries were somewhat lower than the extractionrecoveries, because during the sampling exposure, the compoundswere inevitably lost to evaporation, breakthrough and degradation.
It is noteworthy that the bulk deposition average sampling recoveryfor 13C12-1,2,3,7,8-PeCDD is 40%, whereas the corresponding figure for13C12-1,2,3,4,7,8,9-HpCDD is only 13%, even if the latter higher chlo-rinated congener is more chemically stable than the former one. Anexplanation for this anomaly could rely on the higher water solubilityof the lower congeners. Hence, during the sampling exposure, therain water predominantly washes the more soluble 13C12-1,2,3,7,8-PeCDD out of the quartz-wool filter onto the XAD-2 filter. Adsorbedhere, it is protected from photo-degradation. In contrast, the lowwater soluble 13C12-1,2,3,4,7,8,9-HpCDD preferentially remains on thequarts-wool where it is more exposed to light. This interpretation issupported by an annual variation of the field recoveries, which has apronounced summer minimum. Further indications come from thecorresponding recoveries for through fall, which displays substan-tially lesser difference between the sampling spikes. This can be ex-plained by the low light intensity in the shadow of the spruce plan-tation. Provided the above considerations were correct, they demon-strate the importance of light protection. But in practice it is difficultto devise better light protection measures than the present ones inuse, without impeding the collecting properties of the sampler. Inaddition, the location in forests reduces the direct sunlight falling onthe samplers. However, the evidence is indirect, since only spikeswere involved; the significance of light protection for nativePCDD/Fs during the residence in the sampler has not been investi-gated directly.
Note on extraction recovery Whereas the extraction recovery grand mean for air is 79%, which isentirely acceptable, the recovery for deposition is somewhat lower,and that for through fall were even lower. A reason for this is the useof reflux extraction for deposition and through fall samples, in steadof the more efficient soxhlet extraction used for air. This is dictatedby practical reasons, because it has turned out to be very difficult todry the very wet exposed XAD-2 material sufficiently for soxhlet ex-traction. During the reflux extraction, the water is boiled out of thesample as an azeotrope with toluene and removed with the Dean-Stark trap, which is a very efficient method to remove water. If anywater is left in the XAD-2 material, the extraction efficiency will suf-

34
fer. Furthermore, the reflux is somewhat overloaded, being designedfor one sampling train only; this will lead to lower extraction effi-ciency when multiple samples are pooled. Particularly the throughfall extraction is overloaded with the pooled materials from four (insome cases eight) parallel sampling trains.

35
4 Results
4.1 Concentrations in air
Figure 5 shows the results for PCDD/Fs in air in Frederiksborg. Astrong seasonal variation is observed in all years, the minimum oc-curring during the summer and the maximum during the winter. Thewinter maxima stand out sharply and well defined. The annualvariation profile seems very alike in the different years. The varia-tions span a factor of 35. The average winter concentration is 31fg/m3 I-TEQ, the summer average 8 fg/m3 I-TEQ and the total aver-age 20 fg/m3 I-TEQ. An almost equal distribution between PCDDand PCDF is found for most of the measurements; the averagePCDF/PCDD ration is 0.9.
0
10
20
30
40
50
60
70
80
90
f m a m j j a s o n d j f m a m j j a s o n d j f m a m j j a s o n d j f m
beginning m onth
I-TEQ fg/m³
PC DF
PCDD
2002 2003 2004 2005
Figure 5. PCDD/Fs in the ambient atmosphere of Frederiksborg State Forest expressed as I-TEQcontributions from PCDD and PCDF respectively. April/May, June/July and August/September 2003 weresampled monthly, though analysed as pooled samples.
Figure 6 shows the PCDD/Fs concentrations in the air in central Co-penhagen. The results were very similar to the results fromFrederiksborg, with respect to the seasonal variation and the order ofmagnitude. Also here, an almost equal distribution between PCDDand PCDF is found for most of the measurements, the averagePCDF/PCDD ratio being 1.2. The variation spans a factor of 23,somewhat lower than in Frederiksborg. The average winter concen-tration is 34 fg/m3 I-TEQ, the summer average 8 fg/m3 I-TEQ and thetotal average 20 fg/m3 I-TEQ, i.e. very close to those found inFrederiksborg.

36
0
10
20
30
40
50
60
m a m j j a s o n d j f m a m j j a s o n d
beginning m onth
I-TEQ fg/m³
PCDF
PCDD
2003 2004
Figure 6. PCDD/Fs in the ambient atmosphere of central Copenhagen (Botanical Garden) expressed as I-TEQ contributions from PCDD and PCDF, respectively. April/May, June/July and August/September2003 were sampled monthly, though analysed as pooled samples.
0
20
40
60
80
100
120
140
160
180
200
n d j f m a m j j a s o n d j f m a m j j a s o n d j f m a
m onth
I-TEQ fg/m³
PCDF
PCDD
2002 2003 2004 2005
Figure 7. PCDD/Fs in the ambient air of Gundsømagle, a small village in North Zealand having manyhomes with wood stoves. The measurements cover a single result from November 2002, and the latesummer and heating season autumn 2003, expressed as I-TEQ contributions from PCDD and PCDF,respectively.
Figure 7 shows the PCDD/Fs concentrations the in air in Gundsøma-gle. The concentrations rises sharply during the heating season be-ginning in October 2003, reaching a maximum of 180 fg/m3 I-TEQ inNovember 2003. The heating season 2004-05 displays a similar rise,but does not include a pronounced maximum comparable with theone in 2003. The variation spans a factor of 20; this comparatively lowfactor is caused by the lack of a complete summer period. In themaximum, the distribution between PCDD and PCDF is dominatedby PCDD, in contrast to the other air measurements, which show anaverage PCDF/PCDD ratio of 0.9.

37
0
20
40
60
80
100
120
140
160
180
200
f m a m j j a s o n d j f m a m j j a s o n d j f m a m j j a s o n d j f m a
beginning m onth
I-TEQ fg/m³
Fredensborg (rural)
Copenhagen (urban)
Gundsøm agle (village )
20032002 2004 2005
Figure 8. PCDD/Fs concentrations in air at all stations Frederiksborg (rural forest), Copenhagen (urban)and Gundsømagle (village) shown on a common time axis.
Figure 8 shows the results for PCDD/Fs in air from all three stationson a common time axis. The parallel measurements in urban Copen-hagen 40 km from the forest site Frederiksborg follow each otherclosely and synchronously in spite of the distance and different char-acteristics of the sites. This strongly suggests the hypothesis that theseasonal variation in background concentrations is a regional phe-nomenon, not a local one. This issue is further addressed in the dis-cussion section.
In contrast, the concentrations in Gundsømagle deviate much fromthose of the other sites. In August and September 2004 the results arecomparable with Frederiksborg and Copenhagen, but in November2003 the concentrations at Gundsømagle are clearly elevated, beingmore than five times higher than at the other sites. However, the sub-sequent maximum in November 2004 is much lower. One could ex-pect that this difference might reflect differences in the meteorologi-cal conditions. Comparing monthly averages of temperature andwind speed show little differences between 2003 and 2004, thoughsampling with average times of one month, single or few meteoro-logical events i.e. with stable air conditions can affect the samplingwithout affecting the meteorological average values.
Figure 9 and Table 9 shows descriptive statistics of the air resultsfrom all stations. As seen, the average concentrations for summer,winter and total are nearly identical in Frederiksborg and Copenha-gen, the total being 20 fg/m3 I-TEQ at both sites. The winter averagesin Frederiksborg and Copenhagen are higher than the summer aver-ages by a factor 4. The winter average in Gundsømagle, 61 fg/m3 I-TEQ, is twice that of the I-TEQ winter average of 31 fg/m3 inFrederiksborg.

38
0
20
40
60
80
100
120
140
160
180
200
Gundsømagle
(village )
Fredensborg
(rural)
Copenhagen
(urban)
All
I-TEQ fg/m³
Sum m er
W inter
Total
Figure 9. Descriptive statistics of PCDD/Fs concentrations in air, all resultsfrom all stations Frederiksborg (rural), Copenhagen (urban) and Gundsøma-gle (village). Average (weighted by duration of sampling periods), maxi-mum and minimum for summer, winter and total, respectively. Summer forGundsømagle has been omitted because data do not cover a whole summerperiod.
Table 9. Descriptive statistics of results for PCDD/Fs concentrations in air, fg/m3 I-TEQ
Site From To Season n Mean Median Min Max
Gundsømagle 06/11-02 02/05-05 Total 14 52.7 47.2 8.9 179.9
Summer 3 21.0 21.0 8.9 33.0
Winter 11 60.7 54.3 12.2 179.9
Frederiksborg 05/02-02 05/04-05 Total 37 20.0 20.6 2.5 86.7
Summer 16 7.9 7.2 2.5 22.5
Winter 21 31.1 30.2 7.9 86.7
Copenhagen* 28/03-03 04/01-05 Total 19 20.0 18.6 2.5 55.7
Summer 9 8.4 6.6 2.5 17.6
Winter 10 34.0 33.7 18.6 55.7
All 02/04-02 05/04-05 Total 70 26.0 22.1 2.5 179.9
Summer 28 30.0 7.1 2.5 33.0
Winter 42 39.6 33.9 7.9 179.9

39
4.2 Bulk deposition and through fall
Monthly bulk deposition fluxes for Frederiksborg Forest District areshown in Figure 10 and through fall results in Figure 11, expressed inpg I-TEQ/m2·day.
0
2
4
6
8
10
12
14
16
18
20
n d j f m a m j j a s o n d j f m a m j j a s o n d j f m a m j j a s o n d j f m a m
begining m onth
I-TEQ pg/m²/day
PCDF
PCDD
2001 2003 2004
167
2002 2005
Figure 10. PCDD/Fs flux in bulk deposition at Roskilde November 2001 and January 2002 and inFrederiksborg from February 2003 to February 2005. Summer samples were pooled, pools and long periodsare shown as the beginning month.
Figure 10 shows the bulk deposition of PCDD/Fs at Roskilde in No-vember 2001 and January 2002 and at Frederiksborg from February2002 to February 2005. The very high result in Roskilde from No-vember 2002 is obviously an outlier, perhaps caused by birds’ drop-pings in the sampler. A regular variation profile is seen in 2002, hav-ing maxima in the winter. A more erratic pattern prevails in 2003with a very weak winter maximum 2003-04. The result from August2004 stands out as the maximum in the series. There is a pronouncedwinter maximum 2004-05, which ends abruptly in March 2005. Thevariation spans a factor 33 omitting the outlier November 2001. Theratio between PCDF and PCDD is more variable than for air, fluctu-ating around an average PCDF/PCDD ratio of 1.0.
The average winter deposition flux is 5.1 pg/m2·day I-TEQ, thesummer average 3.6 pg/m2·day I-TEQ and the total average 4.4pg/m2·day I-TEQ.
Figure 11 shows the results for through fall in Frederiksborg fromFebruary 2002 to February 2004. Several local peaks and valleys areseen, making a rather erratic variation profile. The variation spans afactor of 7, considerably lower than for air and bulk deposition. Theaverage PCDF/PCDD ratio is 1.1, somewhat higher than for bulkdeposition. The average winter through fall flux is 5.3 pg/m2·day I-TEQ, the summer average 5.2 pg/m2·day I-TEQ and the total average5.3 pg/m2·day I-TEQ, i.e. the winter-summer difference for throughfall is negligible.

40
0
2
4
6
8
10
12
14
16
f m a m j j a s o n d j f m a m j j a s o n d j f
beginning m onth
I-TEQ pg/m²/day
PCDF
PCDD
2003 20042002
Figure 11. PCDD/Fs in through fall sampled at Frederiksborg State Forest 2002-04. Some summer sampleswere pooled due to low concentrations. Each sampling period is shown by the start month.
Figure 12 shows the results for bulk deposition and the sprucethrough fall at Frederiksborg on a common time axis. In many casesthe results are nearly identical but in general the through fall arehigher and the variation profile more erratic. Most likely, this iscaused by irregular shedding of spruce needles during the cause ofthe year. The low overall variation for through fall may be due to abuffering effect for absorbed PCDD/Fs of the canopy, causing a lev-elling effect.
Even so, the through fall variation profile is highly correlated withthe bulk deposition profile, as shown in the correlation section 6.10below. During the through fall campaign, the bulk deposition aver-age flux at that site was 2.8 pg/m2·day I-TEQ, and the through fallflux a factor 1.9 higher. These issues are further addressed in the dis-cussion section.
0
2
4
6
8
10
12
14
16
18
20
f m a m j j a s o n d j f m a m j j a s o n d j
begining m onth
I-TEQ pg/m²/day
D epo
Through
2002 2003 2004
Figure 12. PCDD/Fs in through fall and deposition at Frederiksborg 2002-04 shown on a common timeaxis. Some samples were pooled, pools and long sampling periods being shown by the start month.

41
Figures 13 to 15 show the bulk deposition results for Ulborg, Copen-hagen and Bornholm, respectively.
0
2
4
6
8
10
12
14
16
j a s o n d j f m a m j j a s o n d j f m a m j j a s o n d j f m a
beginning m onth
I-TEQ pg/m²/day
PC DF
PCDD
2002 20042003 2005
Figure 13. PCDD/Fs in bulk deposition in Ulborg State Forest. Some sample were pooled, pools are shownby the start month.
Figure 13 shows PCDD/Fs in bulk deposition sampled in UlborgState Forest January 2002 to April 2004. As seen, the variation is com-paratively modest, apart from the minimum in January 2002 and themaximum in December 2004. The variation spans a factor 50 includ-ing all data, but only a factor 13 omitting July 2002. The averagePCDF/PCDD ratio is 1.0. The average winter flux is 4.0 pg/m2·day I-TEQ, the summer average 2.0 pg/m2·day I-TEQ i.e. the winter is thedouble of the summer; the total average is 2.9 pg/m2·day I-TEQ.
0
5
10
15
20
25
30
35
m a m j j a s o n d j f m a m j j a s o n d
beginning m onth
I-TEQ pg/m²/day
PCDF
PCDD
132
2003 2004
Figure 14. PCDD/Fs in bulk deposition sampled in Copenhagen Botanical Garden Summer samples werepooled due to low concentrations, pools being shown as the start month.
Figure 14 shows the results for bulk deposition sampled in Copenha-gen Botanical Garden March 2003 to December 2004. The very highresult from March 2003 is an outlier, possibly caused by bird’s drop-pings in the sampler. However, this has not been further investi-gated, and the cause of the outlier remains hypothetical. Omitting theoutlier, the maximum result from August 2004 stands out. The varia-

42
tion spans a factor 18 including August 2004, but only a factor 5omitting that result. The average PCDF/PCDD ratio is 1.5. The aver-age winter flux is 5.5 pg/m2·day I-TEQ, the summer average is 9.8pg/m2·day I-TEQ, i.e. the summer is higher than the winter; the totalaverage is 8.0 pg/m2·day I-TEQ.
0
5
10
15
20
25
30
35
m a m j j a s o n d j f m a m j j a s o n d j f m a
beginning m onth
I-TEQ pg/m²/day
PC DF
PCDD
2003 2004 2005
Figure 15. PCDD/Fs in bulk deposition sampled at Bornholm March 2003 – April 2005. Some samples werepooled and in some cases the sample duration was more than month. Pools and long sampling periods areshown by the start month.
Figure 15 shows the results of bulk deposition on Bornholm. As seen,all summer values are low. A conspicuous feature of the variationprofile is the large difference between the winters 2003-04 and 2004-05, respectively. There is a pronounced winter peak 2004-05 withmaximum in November 2004. The PCDF/PCDD ratio varies erratic-ally, it seems that PCDF fluctuates more than PCDD do; hence, theaverage ratio is not meaningful. The winter flux average is 8.8pg/m2·day I-TEQ, the summer average is 2.9 pg/m2·day I-TEQ, i.e.the winter is more than the double of the summer; the total average is6.1 pg/m2·day I-TEQ.
Figure 16 shows results of bulk deposition flux at all stations on acommon time axis. As seen, the results from all stations are in manyperiods comparable, e.g. March-August 2003. Differences, when oc-curring, may in most cases be ascribed to the geographical location.Thus the Copenhagen results are generally highest. In October 2003Bornholm, isolated in the Baltic Sea, stands out as elevated comparedto the other sites; the same is the case the winter 2004-05. In August2004 the concentrations in Copenhagen and Frederiksborg are ele-vated especially compared to Ulborg. A general tendency to higherresults in the winter is observed, particularly the winter peak 2004-05.

43
0
5
10
15
20
25
30
35
j f m a m j j a s o n d j f m a m j j a s o n d j f m a m j j a s o n d j f m a m
beginning m onth
pg/m²/day I-TEQ
U lfborg
Fredensborg
Copenhagen
Bornholm
2002 2003 2004 2005
Figure 16. PCDD/Fs in bulk deposition at all stations shown at common time axis. Each sample period isshown as the start month. The two outliers (Roskilde November 2001 and Copenhagen March 2003) havebeen omitted.
Figure 17 and Table 10 shows descriptive statistics of the depositionresults, for each station arranged in summer, winter and total, re-spectively. For example, “Winter” represents the mean for all wintermonths (i.e. October to March, incl.) encompassing all years from aparticular station, weighted by period lenght. “All” represents thegrand mean for all stations. As seen, the overall geographical varia-tion spans a factor of only 2.7 between the lowest average total flux inUlborg and the highest one in Copenhagen. For all sites except Co-penhagen, the bulk deposition winter average is higher than thesummer average. For through fall the winter-summer difference isnegligible.
0
5
10
15
20
25
30
35
Ulfborg
Fredensborg
Fred thorugh
Copenhagen
Bornholm All
I-TEQ pg/m²/day
Sum m er
W inter
Total
Figure 17. Descriptive statistics for deposition of PCDD/Fs at all stationsand for through fall at Frederiksborg for summer, winter and total, respec-tively. The average (weighted by length of sampling periods) is shown ascolumn height, minimum and maximum by error bars.

44
Table 10. Descriptive statistics of results for PCDD/Fs in bulk deposition and through fall, ng/m2·day I-TEQ
Site From To Season n Mean Median Min Max
Ulborg 01/07-02 30/04-05 Total 22 2.9 2.8 0.3 13.8
Summer 9 2.0 1.6 0.3 8.0
Winter 13 4.0 3.9 1.4 13.8
Frederiksborg 1) 01/01-02 06/06-05 Total 28 4.4 2.9 0.5 16.9
Summer 11 3.6 1.8 0.5 16.9
Winter 17 5.1 4.3 0.8 13.2
Fred through 01/02-02 31/03-04 Total 21 5.3 3.9 2.1 15.1
Summer 11 5.2 3.9 2.6 9.7
Winter 10 5.3 4.0 2.1 15.1
Copenhagen 2) 01/04-03 04/01-05 Total 13 8.0 6.2 1.7 31.6
Summer 6 9.8 6.7 2.0 31.6
Winter 7 5.5 6.2 1.7 8.7
Bornholm 14/03-03 21/04-05 Total 14 6.1 4.6 0.5 31.5
Summer 6 2.9 2.0 0.5 7.2
Winter 8 8.8 10.0 1.2 31.5
All 01/01-02 06/06-05 Total 98 5.0 3.7 0.3 31.6
Summer 43 4.3 2.0 0.3 31.6
Winter 55 5.7 4.3 0.8 31.5
1) Roskilde January 2002 included. 2) High outlier March 2003 omitted

45
5 Discussion and statistics
5.1 Air
Rural and urban sites It is remarkable that dioxin concentrations in Frederiksborg andCopenhagen (see figure 8) follow each other very closely and almostsynchronously in spite of the distance of 40 km and the location inrural and urban zone, respectively. This suggests that a substantialcontribution is due to long-range transport, because it is highly un-likely that zones so different in type could have synchronous emis-sions from local sources. Whereas the main domestic heating form inthe North Zealand region is by oil firing, central Copenhagen islargely heated by district heating based on waste heat from electricalpower generation (most of them gas fired), incineration and industry.Hence, domestic heating by individual stoves plays a minor role inthe city. The total average for air in Frederiksborg and Copenhagenwere found to 20.0 fg/m3 I-TEQ at both sites i.e. practically withoutany difference (Figure 9). However, there is an appreciable differencein the corresponding deposition fluxes in Frederiksborg and Copen-hagen, amounting to a factor 1.8 of between the total averages. Wecan conclude that air concentrations cannot explain the differencebetween urban and rural deposition fluxes, as further discussed be-low in the deposition section.
Village As noted from Figure 8 the concentrations in the air of the ruralvillage deviate considerably from the variation profile prevailing inFrederiksborg and Copenhagen. The village is a residential area,where many houses have wood stoves used for domestic heating assupplement to the electrical heating that is prevailing in the village.During a NERI monitoring campaign for particles and PAHs in air(Wåhlin et al., 2003), a sample taken in November 2002 was analysedfor dioxin. The concentration found was significantly higher than thecorresponding one in Frederiksborg. The wood stoves were sus-pected to be the source of this high concentration, since the samplewas taken in the heating season, and because no other known localdioxin sources exist in the village. As a consequence, the present in-vestigation was initiated. This also comprise an investigation onemission from the wood stoves in the village. This investigation isstill in progress, but results from the first part of the study has beenreported separately (Glasius et al., 2005). As noted from Figure 8, theAugust 2002 result is on level with Frederiksborg and Copenhagen,but as the heating season begins in October the PCDD/Fs concentra-tion increases to a very high level in November. The much higherlevels compared to Frederiksborg (which as mentioned is suspectedmainly to reflect long range transport) indicate that the increase iscaused by local sources. Local emissions were confined to an air layerat low altitude; hence the dilution is much lower than is the case forlong range transport, enhancing the concentrations in the local at-mosphere.

46
The simultaneous increase in the level of PAHs, which are known tobe emitted by wood stoves (Wåhlin et al., 2003) supports the hy-pothesis that the observed PCDD/F increase in air is caused by do-mestic heating.
5.2 Through fall
Through fall For substances with no or little internal cycling between soil andvegetation, the through fall can be an approximation of the totaldeposition to the forest canopy. This applies for PCDD/Fs which donot participate in an internal cycling in a forest ecosystem, since theinput of PCDD/Fs to the canopy comes from the atmosphere and theuptake through the roots is negligible (Hülster & Machner, 1993). Inaddition, PCDD/Fs are extremely persistent. A spruce plantation inequilibrium with the atmosphere enters a steady state, as the receiv-ing rate of PCDD/Fs in the long term becomes equal to the releasingrate. Therefore, the through fall measured below the canopy is a goodestimate of the total deposition of PCDD/Fs to the forest. Contrary tothe conditions encountered for in the free bulk deposition sampler,the plantation presents a very large and “rough” surface to the at-mosphere, leading to high uptake efficiency. The waxy surface of thespruce needles has high uptake of the lipophilic substances likePCDD/F, which dissolves in the wax. Accordingly, spruce needleshave been used frequently as a convenient monitoring method forPCDD/Fs in air, and this method is widely accepted internationally(Rappolder et al., 2004). Most likely, the erratic variation profile ob-served for through fall reflects irregular variations in the shedding ofspruce needles, which in turn depend on season and are caused byvarying meteorological conditions e.g. wind, rainfall, draughts, tem-perature, and by the needle life cycle. This being the case, a large partof the through fall PCDD/Fs flux must be carried by the needles, andnot by rainwater or particles. A further indication of this is the largedifference observed between the parallel sampling experiments,mentioned in the Analytical performance section, which can be ex-plained by the different amounts of spruce needles in the samplers.In spite of the erratic variation profile, the variations span only afactor of 7, much less than for free deposition. This may be explainedby a certain damping caused by the canopy acting as a buffer andreservoir for PCDD/F.
The through fall samples in this project includes needle fall in thesampling period, i.e. the flux estimate is based on water solublePCDD/F and particulate bound PCDD/F including needles andother organogenic particles sampled in the funnel.
Because of the erratic variation and the buffer effect in the canopy,only the average long term through fall is a good estimate of the totalflux deposition to the forest. Of course, the same can be said of freedeposition, because of the substantial difference between years.
As mentioned in the results section, the through fall flux is a factor of1.9 higher than the bulk deposition flux at Frederiksborg and may becaused by dry deposition, mainly uptake of gaseous PCDD/Fs andparticles, on the spruce trees. This is also observed for other sub-

47
stances, e.g. sulphur compounds (Hovmand & Kemp, 1996). In addi-tion, the deep shadow in the spruce plantation would theoreticallyreduce the photo-degradation of PCDD/Fs in the sampler, whichcould lead to higher results compared to free deposition.
Dry deposition The atmospheric deposition of a substance is defined as the total fluxof the substance from the atmosphere per unit surface area. Atmos-pheric deposition includes wet deposition, which in Danish condi-tions means mainly with rain, and dry deposition of gasses and par-ticles. Net-through fall is defined as the difference between throughfall and bulk deposition. In Frederiksborg, the total average flux forbulk deposition and through fall is 2.8 and 5.3 pg/m2·day I-TEQ, re-spectively. The difference is the net-through fall 2.4 pg/m2·day I-TEQ. For some substances, the net-through fall is a good estimate ofthe dry deposition. If it also applies for PCDD/F, this figure will bean approximation to the dry deposition in the plantation. However,this cannot be validated, since dry (or wet) deposition has not beenmeasured directly in the present investigation. This would have re-quired the development and construction of special samplers, andfurther a considerably more comprehensive analytical programme.The particle fraction in the quartz-wool filter, which would be ameasure of the particle fraction in the dry deposition, has not beenmeasured separately in the present study. However, even if thethrough fall is a good estimate for the deposition to the forest, it doesnot necessarily mean that it is a good overall estimate. On the openland no spruce trees are available to absorb gaseous PCDD/F. Theinterpretation of through fall measurements of PCDD/Fs is furtherdiscussed by Hovmand et al. (in prep.).
Variation profiles In Figure 18, the variation profiles of bulk deposition, through falland air concentrations measured at Frederiksborg Forest District arecompared on a common time axis. Roughly speaking, the bulk depo-sition and through fall flux have episodes with close correspondenceinterspersed with episodes with higher through fall. For example,there are near identical values in March 2002, August 2002-February2003 and August 2003, whereas elevated through fall episodes occurin April -July 2002 and March and June 2003. As mentioned, the highepisodes very likely reflect the shedding of needles from the sprucetrees. This indicates that in the absence of needle shedding, there is aclose correspondence between through fall and deposition. This inturn shows that in the absence of needles falling, the sampler collectsdeposition which has passed more or less unchanged through thespruce trees. From an analytical point of view, this further demon-strates that under the field conditions in Frederiksborg, the samplersfor free deposition and for through fall yield comparable, indeedsometimes nearly identical, results. Hence, the photo-degradationsuspected to occur in the free deposition sampler cannot be of practi-cal importance for the operation of that sampler.
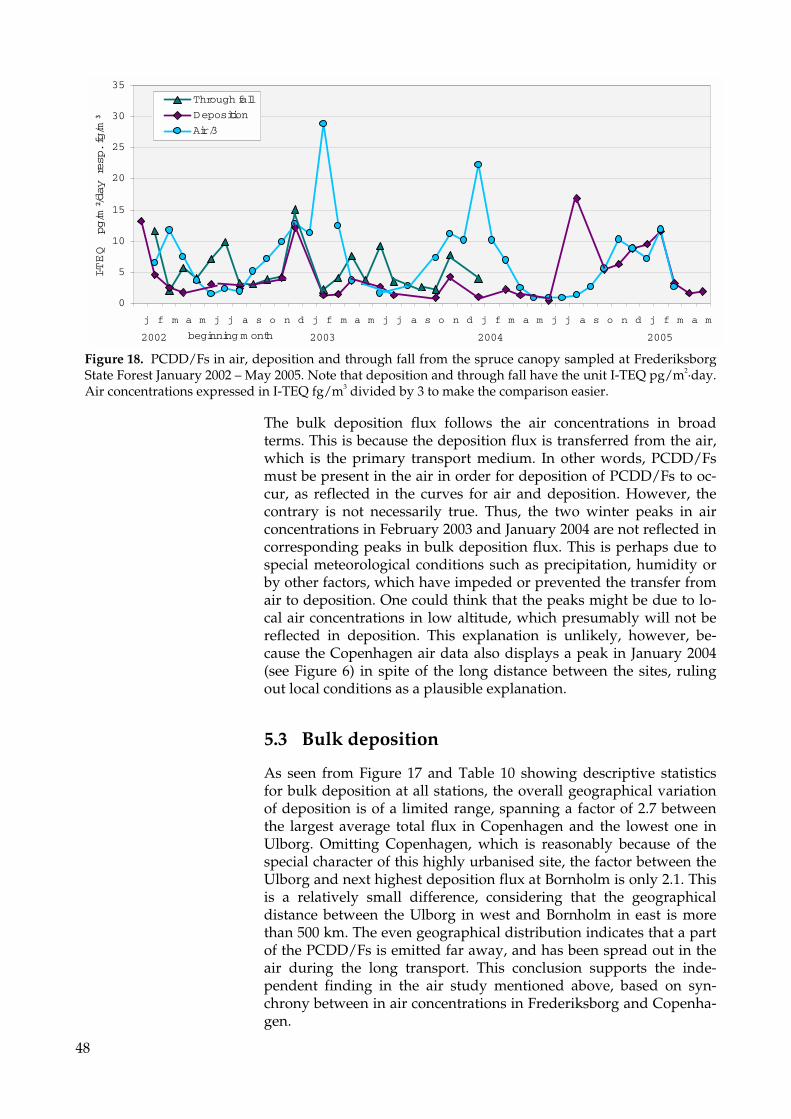
48
0
5
10
15
20
25
30
35
j f m a m j j a s o n d j f m a m j j a s o n d j f m a m j j a s o n d j f m a m
beginning m onth
I-TEQ pg/m²/day resp. fg/m³
Through fall
Deposition
Air /3
20032002 2004 2005
Figure 18. PCDD/Fs in air, deposition and through fall from the spruce canopy sampled at FrederiksborgState Forest January 2002 – May 2005. Note that deposition and through fall have the unit I-TEQ pg/m2·day.Air concentrations expressed in I-TEQ fg/m3 divided by 3 to make the comparison easier.
The bulk deposition flux follows the air concentrations in broadterms. This is because the deposition flux is transferred from the air,which is the primary transport medium. In other words, PCDD/Fsmust be present in the air in order for deposition of PCDD/Fs to oc-cur, as reflected in the curves for air and deposition. However, thecontrary is not necessarily true. Thus, the two winter peaks in airconcentrations in February 2003 and January 2004 are not reflected incorresponding peaks in bulk deposition flux. This is perhaps due tospecial meteorological conditions such as precipitation, humidity orby other factors, which have impeded or prevented the transfer fromair to deposition. One could think that the peaks might be due to lo-cal air concentrations in low altitude, which presumably will not bereflected in deposition. This explanation is unlikely, however, be-cause the Copenhagen air data also displays a peak in January 2004(see Figure 6) in spite of the long distance between the sites, rulingout local conditions as a plausible explanation.
5.3 Bulk deposition
As seen from Figure 17 and Table 10 showing descriptive statisticsfor bulk deposition at all stations, the overall geographical variationof deposition is of a limited range, spanning a factor of 2.7 betweenthe largest average total flux in Copenhagen and the lowest one inUlborg. Omitting Copenhagen, which is reasonably because of thespecial character of this highly urbanised site, the factor between theUlborg and next highest deposition flux at Bornholm is only 2.1. Thisis a relatively small difference, considering that the geographicaldistance between the Ulborg in west and Bornholm in east is morethan 500 km. The even geographical distribution indicates that a partof the PCDD/Fs is emitted far away, and has been spread out in theair during the long transport. This conclusion supports the inde-pendent finding in the air study mentioned above, based on syn-chrony between in air concentrations in Frederiksborg and Copenha-gen.

49
Copenhagen deposition It is noteworthy that the Copenhagen bulk deposition flux is 1.8times higher than the one in Frederiksborg, in spite of the almostidentical levels of the air concentrations at these sites, as seen fromthe corresponding Figure 9 in the Air chapter. This difference, as wellas the winter-summer anomaly for Copenhagen mentioned below,suggests that special conditions exist in the highly urbanised envi-ronment, which affects the transfer of PCDD/Fs from air to deposi-tion. Possibly particles are involved in this, but the issue has not beenfurther investigated. Local atmospheric sources can be excluded asthe cause, since these ought to be reflected in the air concentrations,in stark contrast to what is found. However, an influence of the ur-ban environment directly on the bulk deposition sampling cannot beexcluded, such as soot or dust blown up from soil collecting in thesampler funnel. Of course, this will also happen in the rural sampler,but the considerable higher concentration in urban soil (discussedbelow) will yield a correspondingly higher contribution. Further-more, the urban surface area is largely covered with buildings, con-crete and asphalt which do not bind dust as well as the rural vegeta-tion.
Winter/summer ratios The winter average for bulk deposition is a factor 2 higher than thesummer average for Ulborg, 3 for Bornholm and 1.4 for Frederiks-borg. This is probably due to higher atmospheric emissions duringwinter e.g. from heating, and faster atmospheric photo degradationduring summer. In Copenhagen, wee observe the opposite relation-ship with a ratio of 0.6. This might be due to dust collecting in thesampler during the more dusty conditions in the dry summer. Forthrough fall, the winter-summer difference is negligible, very likelybecause of an equalising effect of the spruce canopy.
5.4 Role of deposition for soil
Geographical regions The Danish Dioxin Monitoring Programme included acomprehensive investigation of PCDD/F in soil (Vikelsøe 2003,2004a, 2004b). The soil study was planned in such a way that it ispossible to evaluate the role of deposition for the contamination ofsoil. In soil context Denmark is in the following described in terms ofgeographical regions: N-Jutland (NW region), S-Jutland and Funen(SW region), Zealand (E region), Falster and Bornholm (SE region).The deposition sampling sites are located in regions as follows: Ul-borg in W-Jutland (NW region), Frederiksborg in North Zealand (Eregion), Copenhagen central city (E region) and Bornholm (SE re-gion). Figure 19 shows the average PCDD/Fs concentrations in soil(72 samples) in the regions together with the total averages of thebulk deposition flux at all stations placed in their respective re-gions/zones. The average for rural soil is 0.8 ng/kg I-TEQ. An in-crease is seen in rural soils from the NW to the SE region. This fol-lows the same tendency as the deposition, but is much weaker. Thus,the variation originating from deposition seems to be smoothed outin rural soil, possibly an effect of ploughing or culturing.

50
Rural zones An important question is whether the atmospheric sources – eitherdiffuse or point sources – contaminates the surrounding land. To ad-dress this, alternatively to the geographical regions, the soil resultshave been divided into zones: rural reference zones located far fromknown sources, and rural exposed impact zones located some kmleeward (E) from point sources or diffuse sources with respect to thepredominant wind directions (W, SW). Contrary to a region, a zonedoes not form a coherent area, but is patched together from manyseparate sites of similar characteristics. As seen from Figure 19, nodifference between those zones is found, the average soil concentra-tions in both zones being 0.93 ng/kg I-TEQ. Hence, somewhat con-trary to expectation, there is no indication that deposition from largerpoint sources or diffuse sources via short-range transport contami-nates the surrounding land.
0
1
2
3
4
5
6
7
8
9
NW Region
SW Region
E Region
SE Region
Ref Zones
Exp Zones
Provincial
Copenhagen
I-TEQ ng/kg pg/m²/day
Soil conc.
Depo flux
Rural
regions
Rural
zones
Urban
zones
Figure 19. Concentrations in soil in geographical regions and zones com-pared to deposition flux. The deposition stations are placed in their respec-tive regions/zone. Note different units on the y-axis.
Urban zones In addition to the rural zones, provincial cities form a zone, and theCopenhagen area is regarded as a large urban zone. The average forpark and garden soil in provincial cities are 2.2 ng/kg I-TEQ, for Co-penhagen it is 8 ng/kg I-TEQ. Thus urban zones are substantiallyhigher than rural zones. In soil from Frederiksborg was found 1.3ng/kg I-TEQ, thus Copenhagen is a factor 6 higher. However, thecorresponding factor for deposition is only 1.8. Hence, the differencein soil concentrations in Copenhagen and Frederiksborg cannot beexplained by difference in deposition alone.
Accumulation times PCDD/Fs in soil is extremely persistent, therefore the PCDD/Fsfound today has been accumulated from contamination in the pastduring many years. Hence, the PCDD/Fs will build up in the soilunder a steady influx from deposition. The time required to accu-mulate the PCDD/Fs amount found in the upper 10 cm of soil at thepresent deposition flux – the simple accumulation time - can be cal-culated. The accumulation times of the rural regions are thus calcu-lated to 86 years in Ulborg, 81 years in Frederiksborg and 75 years onBornholm. These consistent and plausible accumulation times make
51
it likely that deposition has been the main source for PCDD/Fs in soilin the rural regions. Unfortunately, we have no deposition results forprovincial cities, and can therefore not calculate the accumulationtimes.
Copenhagen contamination In contrast, the accumulation times for Copenhagen average is 280years, ranging up to 1300 years for the highest concentration in Co-penhagen soil. These very long accumulation times show that depo-sition alone is not enough to account for the present concentrations,thus other sources must have contributed. On the other hand, thepresent deposition flux in Copenhagen agree with a finding in thesoil of a preserved fortress in the easternmost part of the city (Kas-trupfortet very close to the East coast) which has remained undis-turbed since it was built in 1887. Because of the prevailing Westerlywind direction, this specific location ought theoretically to be par-ticularly exposed to the atmospheric pollution from Copenhagen.Nevertheless, the concentration found in the soil there was only 1.5ng/kg I-TEQ, much lower than in the central city, and only slightlyhigher than that in Frederiksborg. An accumulation time of 50 yearsis calculated for this site. Very likely, the PCDD/Fs concentration inthe soil of the preserved fortress comes close to the true contamina-tion from atmospheric deposition in the Copenhagen area.
In conclusion, the present deposition fluxes cannot explain the pres-ent high concentrations in soil of Copenhagen. It is likely that thedeposition flux was considerably higher before the introduction ofincinerator flue gas cleaning and lead-free gasoline during the 1990ties;but this would be reflected in the concentration at Kastupfortet. Fur-thermore, the dioxin concentrations in the atmosphere are geo-graphically evenly distributed and cannot explain why there is solarge a variation (a factor 25) in the soils of Copenhagen. Most likely,the soil with concentrations exceeding that found at Kastrupfortet,has been contaminated with chemicals, garbage, ash, slag etc. Thiswould explain both the high concentrations and the large variation inthe Copenhagen soil. The highest concentrations are found at formerindustrial sites, and in parks built on former garbage dumps.
5.5 Role of deposition for sediment
The Danish Dioxin Monitoring Programme included an investigationof sediment from lakes and fjords, from internal Danish waters, fromthe Baltic Sea and from small and large harbours, respectively. In ad-dition, it was anticipated that the sediment study would reveal theimportance of deposition over lakes and fjords for sediment but alsoaquatic and marine biota. The reason is the very long persistence ofPCDD/F in sediment, which as mentioned previously is due to theabsence of UV-light and the low O2-level. Of course, PCDD/F insediment is also important in its own right. In total 28 samples ofsediment were analysed. To evaluate the geographical distribution inlake sediment, the lakes were assigned to the same geographical re-gions as mentioned in the preceding section on soil.

52
0
5
10
15
20
25
30
35
40
45
50
Lakes NW
Region
Lakes SW
Region
Lakes E
Region
Sea
Small
harbours
Large
harbours
I-TEQ ng/kg resp. pg/m²/day
Sedi conc.
Depo flux
Figure 20. Concentrations in lake sediment in geographical regions, seasediment and harbour sludge compared to deposition flux. The depositionstations are placed in their respective regions/zone. Mean (column height)minimum and maximum (error bars). Note different units on the y-axis.
Lake sediment Figure 20 shows descriptive statistics (mean, maximum andminimum) for fjords and lakes in the regions, harbour sludge and seasediment, compared where possible to deposition fluxes. As seen, theconcentration in lake sediments increase from NW to E region. Theincrease seems almost proportional with the corresponding one fordeposition, but is more pronounced. The mean concentrations insediments are considerably higher than those of soils (see Figure 19),attesting to long persistence in sediment, where the concentrationsseem to build up. The deposition of PCDD/F on the lake surfacesmay have been higher in the past, before the introduction of efficientincinerator flue gas cleaning; the PCDD/F from then might still bepresent in sediment today. However, as shown by the error bars,there is a pronounced variation between individual lakes in the samegeographical region. Since deposition is evenly distributed in a re-gion, this variation must originate from contributions from othersources.
Accumulation times The accumulation time for sediment in the lakes at the presentdeposition flux range from a plausible 60 years to 1800 years. Thelatter value indicates that significant pollution takes place in somelakes, most likely from waterborne sources, or in some cases possiblyfrom direct contamination (e.g. with sludge or ash). Also the waterpollution might have been worse in the past, particularly before effi-cient wastewater treatment was introduced in Denmark in the 1990ties.In addition to the anthropogenic pollution, some researchers believethat natural formation of dioxin takes place in lake sediment; how-ever, this reportedly is characterised by a high PCDD/PCDF TEQratio (Rappe et al., 1999a & b), contrary to the almost unity ratiofound in all lakes in the present investigation. For sea sediment, theaccumulation times range from 300-2500 years, which is considerablymore than can be explained by the present deposition. For the sea, incontrast to lakes, contamination through water sources is no optionto explain the high values, because such sources world-wide only

53
amounts to a few percent of the air emissions. The sea is the ultimatereservoir for PCDD/F on the planet, therefore PCDD/F accumulatesthere, whereas most lakes are washed through. Hence, theoretically95% of PCDD/Fs in sea sediment globally originates from depositionon the sea surface. It is also possibly, that hot spots in the very pol-luted Baltic sea sediment are re-distributed by sea currents. For har-bour sludge the accumulation times range from 13 years for a smallharbour to 2300 years for large harbours, indicating that the PCDD/Fin the small harbours may originate from deposition only, whereaslarge harbours are highly contaminated.
5.6 Role of rain for bulk deposition
Figure 21 shows deposition flux total averages all stations, comparedto concentrations in rainwater and rainfall in geographical regions(the same designations as used in the soil and sediment discussionabove). As seen, the rainfall is not very different in the regions, beinghighest in Ulborg. The concentration in the rainwater is lowest in Ul-borg and highest in Copenhagen, as is also the case for the depositionflux. Thus the flux seems to follow the concentrations and not therainfall, indicating that the flux is independent of the rainfall. Asshown in the correlation section, there is a highly significant correla-tion between deposition flux and concentration in rainwater, but notbetween flux and amount of rainfall.
0
1
2
3
4
5
6
7
8
9
Ulfborg
NW-Region
Fredensborg
E-Region
Copenhagen
E-Region
Bornholm
SE-Region All
I-TEQ pg/m²/d pg/l mm/day
D epo flux
Conc. in rain
Rainfall
Figure 21. Bulk deposition averages at all stations and as averages of all lo-cations (until December 2004), compared to concentrations in rainwater andrainfall in geographical regions (see text in soil discussion). Note that thereare three different units on the y-axis.
Also for phthalates, which like PCDD/Fs are ubiquitous substancesinsoluble in water, the bulk deposition seems to be relatively inde-pendent of the amount of rainfall as found by Vikelsøe et al. (1997 &1998).

54
5.7 Role of deposition for cows’ milk
An important question is the role of deposition over the agriculturalland, particularly the importance for the human intake via food. Ithas long been known that milk and other dairy products account fora substantial part of the human intake with PCDD/Fs. Since cows aregrazing during the summer, we use the average summer depositionvalues at rural sites Ulborg and Frederiksborg, which amounts to 2.8pg/m2·day. According to questionnaire data collected during thecows’ milk study (Vikelsøe, 2002 & 2003), the production of milk fatper hectare range from 1-27 kg/ha/day with average 5.7 kg/ha/day(Vikelsøe, unpublished). Setting the average PCDD/F concentrationin cows’ milk to 0.8 pg/g fat WHO-TEQ, this corresponds to 0.08-2.1pg/m2·day with average 0.45 pg/m2·day I-TEQ. This in turn amountsto 2.8-76% with average 16% compared to the average land-deposition above. Thus on the average, 6 times more PCDD/F is car-ried to the ground than is excreted in the milk of grazing cows. Thissubstantial surplus available for uptake in cows makes it likely that asubstantial part of the PCDD/Fs enter milk - and hence, dairy prod-ucts - via atmospheric deposition over agricultural grassland.
5.8 Role of deposition for the sea
Deposition was measured at three coastal stations in the western partof the Baltic Sea (including The Belts) and a coastal station on Sild inthe North Sea only 80 km west of the Baltic Sea (see figure 1 and table12). Results from these four stations (including two German stations)give us the possibility to make a first approximation of the atmos-pheric input of PCDD/Fs to the western Baltic Sea.
The measurements represent an area of approximately 43,000 km2 ofsea surface. The average bulk deposition flux measured at the fourstations is 3.3 pg/m2·day I-TEQ, corresponding to 1.2 mg/km2·year I-TEQ. The dry deposition input to water surfaces has to our knowl-edge not been measured, so we estimate an extra input fromPCDD/Fs in particles and gasses directly to the water surface to 10%of the bulk deposition. This leads to a total dry- and wet-depositionof 1.3 mg/km2·year I-TEQ, corresponding to 57 g/year I-TEQ on the43.000 km2 of sea surface considered. This seems to be a smallamount, but it is of the same order of magnitude as the 72 g/year I-TEQ bulk deposition over the Danish land area. Furthermore, itshould be compared to other sources. According to the latest assess-ment reports (Jensen, 2003) the outlet emissions directly to water areworld-wide between 1% and 4% of the emissions to the atmosphere.Riverine loads to the Western Baltic Sea should consequently besmall; but it must be remembered that the Baltic Sea may be un-representative since it is closed and receives input from a number ofpresumably polluted rivers. Unfortunately, we have at this point noinformation on other major PCDD/Fs sources to the Western BalticSea.
We speculate if a total atmospheric input of PCDD/Fs on 1.3 mg I-TEQ/km2·year could lead to measurable concentrations of PCDD/Fsin fat pelagic fish as herring, sprat and wild salmon. Recent investi-

55
gations (Jensen, 2003) show an average concentration in herring of2.2 ng WHO-TEQ PCDD/Fs /kg fresh weight. This unit is in our in-vestigation close (within in a factor 1.1 se table 2.) to the I-TEQ unitotherwise used in this report. It should be stressed that coplanar PCBis not included in the toxicity evaluation below.
Rough estimates on fish-biomass production in the Western Balticindicate a fresh weight production of pelagic fish as herring andsprat of 2400 kg/km2·year. The annual pelagic fish production inwestern Baltic Sea is based on data of landed herrings and sprat re-ported by ICES (2003) and an estimated natural fish death of 50%.
We are aware that herring and sprat are migratory fish, so yearly fishbio-mass production and exposure is not attributed to a fixed area.However, neighbouring areas have the same PCDD/Fs exposure asthe Western Baltic Sea. PCDD/Fs are cumulated in the marine foodweb and fatty fish such as herring, sprat and salmon have higherPCDD/Fs concentrations than other fish.
Herring is the dominating pelagic fish in the Western Baltic Sea andthe Belts. Based on the above reported PCDD/Fs concentrations inherring, we estimate an average PCDD/Fs accumulation of (2400*2.2ng =) 5.3 µg WHO-TEQ/km2·year (fresh weight) in pelagic fish pro-duction (Hovmand and Vikelsøe, 2005).
Comparing the atmospheric deposition of PCDD/Fs to the WesternBaltic Sea of 1.3 mg I-TEQ/ km2·year with a yearly pelagic fish accu-mulation of 5.3 µg WHO-TEQ/km2·year we find that the pelagic fishbio mass production amounts approximately 0.4% of the flux to thesea surface. Thus, a large surplus of PCDD/Fs is available in the seafor bio-uptake from atmospheric deposition on the sea surface alone.This makes it likely that most of the PCDD/Fs in fish originate fromthis source, even if some may be taken up from sediment or originatefrom rivers. Only a minor part of the deposition flux to the sea endsup in the biomass near the top of the food web. The major part is pre-cipitated to the sediments, where in the case of the Western Baltic Seaconcentrations found in the Danish Dioxin Monitoring Programmeare in the range of 4-36 ng/kg I-TEQ (see Figure 20). According toother studies are reported 10-30 ng WHO-TEQ/kg dry matter (Jen-sen, 2003) or 4-36 ng/kg I-TEQ (Verta et al., 2005).

56
5.9 National annual deposition
The modest geographical variation makes it possible to use the aver-age deposition to calculate the total national deposition. The total av-erage bulk deposition and through fall all data is 5.0 pg/m2·day I-TEQ, corresponding to 1.8 mg/km2·year I-TEQ, which in turn corre-sponds to 80 g/year on the 44000 km2 of land area in Denmark.However, it is reasonable to omit the results for through fall and Co-penhagen from the calculation, because of their special character. Theaverage of the total deposition fluxes of the more representative datafrom Ulborg, Frederiksborg and Bornholm is 4.5 pg/m2·day I-TEQ,corresponding to 1.6 mg/km2·year I-TEQ, which in turn correspondsto 72 g/year on the Danish land area. Using the lowest total averageflux in Ulborg and the highest one on Bornholm for the calculationyields 47 and 98 g/year, respectively; these values can be regarded aslimits.
Hence, according to the present study, the annual bulk deposition ofPCDD/Fs on the Danish land area can be estimated to:
47-98 g/year with best estimate 72 g/year.
This may be compared to the emission from the known Danishsources. According to Hansen et al. (2003), the annual Danish emis-sions are estimated at 9-45 g/year I-TEQ, including incinerators,power plants, industry, traffic and heating. Attempting to includeunknown sources Hansen et al. (2003) estimate the emission to 11-148g/year I_TEQ. Both known sources and the estimate includingunknown sources are of the same order of magnitude as the deposi-tion above.
It is likely that some of the deposition originates from long-rangetransport of dioxins and furans from foreign sources. However, thiscan only be confirmed by model calculations that are also needed toquantify this contribution more closely as well as the fraction of in-digenous emissions exported abroad.
5.10 Correlation and regression analysis
Correlation analysis This section addresses the aspect of the statistical significance bymeans of correlation and regression analysis. A significant correla-tion between two parameters indicates (but does not prove) thatthere might a causal effect. Regression analysis indicates if there ex-ists a linear relationship between two parameters. The analysis ofcorrelation was performed on the z-transformed (normal parametric)correlation coefficients that are approximately normally distributed,allowing a t-test for statistical significance of the correlation coeffi-cients to be performed

57
The following figures show the correlation between the most impor-tant or interesting pairs of parameters. In all cases the correlation co-efficient squared (R2) is shown together with the level of significance(p). In case of pairs with significant correlation, linear regressionanalysis is performed, shown by the regression line and equation.
0
2
4
6
8
10
12
14
16
18
0 20 40 60 80 100
Concentration in air I-TEQ fg/m ³
Deposition flux I-TEQ pg/m²/day
R ² = 0.0093
p = 0.3 (NS)
Figure 22. Correlation of bulk deposition and air concentration in Frederiks-borg.
Figure 22 shows the bulk deposition versus the air concentrations inFrederiksborg. No significant correlation was found (p = 0.3). Thelack of correlation indicates that a complicated process takes place inthe transfer of dioxin from the air to deposition.
0
2
4
6
8
10
12
14
16
0 20 40 60 80 100
Air conc. I-TEQ fg/m ³
Thorugh fall flux I-TEQ pg/m²/day
R ² = 0.061
p = 0.2 (NS)
Figure 23. Correlation of air concentrations and through fall inFrederiksborg.

58
Figure 23 shows the air concentrations versus the through fall data.No significant correlation was found (p = 0.2). This indicates that theuptake from air in the spruce needles is delayed before arriving asthrough fall at the sampler.
y = 1.12x + 2.45
R2 = 0.68 p < 0.0001
0
2
4
6
8
10
12
14
16
18
0 2 4 6 8 10 12 14
Deposition I-TEQ pg/m ²/day
Throughfall I-TEQ pg/m²/day
Figure 24. Correlation of bulk deposition and through fall in Frederiksborg.
Figure 24 shows through fall data versus the bulk deposition data. Ahighly significant correlation was found. The slope near 1 indicatesthat the through fall flux closely follows the deposition flux. Onecould suspect that the high through fall episode June-July 2002 (Fig-ure 12) might negatively affect the correlation. However, this is notthe case, since repeating the correlation analysis with that episodeomitted from the data did not result in a higher level of significance.A correlation between sulphur in net-through fall and atmosphericconcentrations of sulphur-containing gasses and aerosols was alsoobserved by Hovmand and Kemp (1996).

59
y = 0.92x + 3.81
R2 = 0.92 p< 0.0001
y = 2.85x - 7.24
R2 = 0.44 p < 0.01
0
20
40
60
80
100
120
140
160
180
200
0 10 20 30 40 50 60 70
Fredensborg, conc. in air I-TEQ fg/m ³
Conc. In air I-TEQ fg/m³
C openhagen
Gundsøm agle
Figure 25. Correlation of concentrations in air in Frederiksborg with Copen-hagen and Gundsømagle.
Figure 25 shows the air concentrations measured at Frederiksborgversus the data from Copenhagen and Gundsømagle, respectively. Ahighly significant correlation was found between Frederiksborg andCopenhagen (p < 0.0001). The slope near 1 indicates that the concen-trations covariate synchronously, presumably because both sites re-ceive contributions from long range transport. Also betweenFrederiksborg and Gundsømagle a significant correlation was found(p < 0.01). However, the higher slope (2.5) indicate a contributionfrom local sources in Gundsømagle.
R 2 = 0.97
p = 0.01
0
0,5
1
1,5
2
2,5
3
3,5
4
4,5
0 2 4 6 8 10
Deposition flux I-TEQ pg/m ²/day
Rain I-TEQ conc. pg/l, fall mm/day
C onc. in rain
Rainfall
Copenhagen
Bornholm
Fredensborg
Ulborg
R ² = 0.085
p = 0.4 (NS)
Figure 26. Correlation of yearly average of PCDD/Fs in bulk depositionversus the concentrations in rainwater and rainfall, respectively.

60
Figure 26 shows the yearly average of PCDD/Fs bulk deposition ver-sus the concentrations in rainwater and rainfall, respectively. Totalaverages all stations until December 2004. A significant correlationwas found between flux and concentration in rainwater (p < 0.01).Between flux and rainfall, no significant correlation was found (p =0.4). This indicates that on a geographical scale, the deposition flux isindependent of the rainfall. That is, a higher (average) rainfall doesnot result in a higher (average) deposition flux, but in stead dilutesthe PCDD/Fs in the rainwater.
5.11 Congener profiles
The concentrations of the 7 PCDD-congeners and the 10 PCDF-congeners analysed form a characteristic pattern, which can be con-sidered as a “fingerprint” for each sample. This can be used to com-pare mutual similarities in different samples, and to compare sam-ples with sources. It is not useful to directly display the concentra-tions of the 17 analysed congeners in a diagram, because of the widerange of concentrations in a single sample, and because the toxicity ofthe congeners differ widely. The analysis below does not take intoconsideration, that the recoveries of the different congeners show avariation (see section 4.5).
Relative congener profiles To cope with this, so-called relative congener profiles are useful;these show the relative I-TEQ contribution from each congener in asample as % of the total I-TEQ. Relative profiles are calculated bymultiplying the concentration of each congeners in the sample withthe corresponding International Toxicity Equivalent Factors (I-TEF),obtaining the contributions to I-TEQ. The congener contributions arethen normalised by division with the sum of all contributions, whichis set to 100%. The relative congener profiles displays the toxicologi-cal importance of each congener. The very high concentration ofOCDD in air and deposition samples is scaled down because of thelow I-TEF of that congener, making the diagram more readable.Furthermore, it is possible to compare profiles of samples withwidely different concentration levels in the same diagram. Finally, itis feasible to compare results expressed in incommensurable units(e.g. for air fg/m3 and for deposition pg/m2·day). Because of thesevirtues, relative congener profiles are used in the following.
An important question is the difference between air, deposition andthrough fall, between the different sites, and between summer andwinter. In the following figures, relative congener profiles are shownfor selected averages of air and deposition. The profiles are calculatedfrom the respective averages, which have been calculated from theconcentrations.
Air congener profiles Figure 27 shows the relative congener profiles of air from all air-sites.The upper three panels show summer, winter and total averages, re-spectively from Frederiksborg, Copenhagen and Gundsømagle, re-spectively. It is noted that the main TEQ contributor for all sites is2,3,4,7,8-PeCDF, followed by 1,2,3,7,8-PeCDD, 2,3,7,8-TCDD, and1,2,3,4,6,7,8-HpCDD.

61
No substantial difference is seen between summer and winter for anysite. One might expect that the air temperature would affect the ratiobetween the lower, more volatile congeners, compared to the higher,lesser volatile ones, which should condense at low temperatures.However, several studies have shown that low temperature merelyshifts the equilibrium from gaseous to the more particle-bound state,without changing the overall concentration in the air. As mentioned,the profile is a “fingerprint” characteristic for the sources. In particu-lar, one might expect that the winter results would stand out fromthe summer ones, since the former would be characterised by emis-sion from heating. But as noted, it does not seem to be the case. Evenin Gundsømagle, where wood stoves are known to emit considerableamounts of PCDD/Fs during the winter, the difference seems to beas modest as is the case for the other sites.
Figure 27 lower panel compare the total means of the three air sites.As seen, the profiles for all sites are alike. This support the notionmentioned previously, that that the PCDD/Fs in air is a large-scalephenomenon, the profiles being similar everywhere.

62
0
5
10
15
20
25
30
35
I-TEQ contributions %
Sum m er
W inter
Total
0
5
10
15
20
25
30
35
I-TEQ contributions %
Sum m er
W inter
Total
0
5
10
15
20
25
30
I-TEQ contributions %
Sum m er
W inter
Total
0
5
10
15
20
25
30
35
I-TEQ contributions %
Fredensborg
Copenhagen
Gundsøm agle
Figure 27. Relative congener profiles of air in Frederiksborg, Copenhagenand Gundsømagle, average of summer, winter and total (3 upper panels),average totals all 3 stations (lower panel).
63
Deposition profiles Figure 28 shows the relative congener profiles of deposition forsummer, winter and total averages, from Ulborg (upper panel),Frederiksborg, Copenhagen and Bornholm, respectively. It is notedthat the main TEQ contributor for all sites is 2,3,4,7,8-PeCDF as wasthe case for air,. This is very pronounced, more so than for air, and isfollowed by the lower PCDDs, and then the PCDFs. In contrast to air,no pronounced contribution from 2,3,7,8-TCDD and 1,2,3,7,8-PePDDis seen. A further conspicuous feature of Figure 27 is the relationshipbetween Ulborg and Frederiksborg, characterised by the compara-tively high and evenly descending contributions from the lowerPCDDs. Also Copenhagen and Bornholm are related. Contrary to Ul-borg and Frederiksborg, their profiles are dominated by 2,3,4,7,8-PeCDF, the contributions from all other congeners being low andrather erratic.
Contrary to air, a difference is seen between summer and winter fordeposition. This is particularly evident for 2,3,4,7,8-PeCDF in the up-per 3 panels of Figure 28, being higher during the summer. Other-wise, the summer winter difference does not seem well defined. Theexplanation for this may be that - in contrast to air – it seems that thedeposition profile depends on the particle bound fraction, which inturn is dependent in a complicated way on kind, amount and size ofthe particles, temperature etc.
Figure 29 upper panel shows relative congener profiles of throughfall in Frederiksborg summer, winter and total. No appreciable dif-ference between summer and winter is seen. The profile and the airprofiles is alike (Figure 26). Thus air-uptake dominates the profile,independently confirming the previous conclusion that dry deposi-tion of gaseous substance plays a major role for through fall.
Figure 29 middle panel shows average total bulk deposition andthrough fall for all stations. As seen, for the highest contributing con-geners, Ulborg and Frederiksborg are close together, confirming therelationship between those stations. The same remarks apply to Co-penhagen and Bornholm. For through fall in comparison, the twolower PCDD congeners stands out as elevated.
Figure 29 lower panel compares relative profiles of the winter aver-ages for air and deposition in Frederiksborg and Copenhagen. Shownin this way, it seems that the profiles for air and deposition are alikefor each site, the only (minor) difference being 1,2,3,4,7,8-HxCDD inFrederiksborg. Also the difference between sites seems modest.
It must be concluded that the congener profiles of deposition and airare similar in many respects, but also differs from each other as wellas mutually in subtle ways. It is difficult to get an overview of the dif-ferences and similarities between the profiles by visually comparingthe diagrams. To cope with this, a new approach is needed, such aspattern recognition.

64
0
5
10
15
20
25
30
35
40
45
50
I-TEQ contributions %
Sum m er
W inter
Total
0
5
10
15
20
25
30
35
40
I-TEQ contributions %
Sum m er
W inter
Total
0
10
20
30
40
50
60
I-TEQ contributions %
Sum m er
W inter
Total
0
10
20
30
40
50
60
I-TEQ contributions %
Sum m er
W inter
Total
Figure 28. Relative congener profiles of bulk deposition in Ulborg (upperpanel), Frederiksborg, Copenhagen and Bornholm, average of summer,winter and total.

65
0
5
10
15
20
25
30
35
I-TEQ contributions %
Sum m er
W inter
Total
0
10
20
30
40
50
60
I-TEQ contributions %
U lborg
Fredensborg
Fred Through
Copenhagen
Bornholm
0
5
10
15
20
25
30
35
I-TEQ contributions %
Fredensborg Air
Fredensborg Depo
Copenhagen Air
Copenhagen Depo
Figure 29. Relative congener profiles. Through fall in Frederiksborg sum-mer, winter and total (upper panel). Average total bulk deposition andthrough fall all stations (middle panel). Air compared to deposition (winteraverage) in Frederiksborg and Copenhagen (lower panel).

66
5.12 Principal component analysis (PCA)
The different profiles in the previous section may be difficult to com-pare. In this connection, pattern recognition techniques may be help-ful, and for these reasons a principal component analysis was per-formed. The analysis was carried using the FACTOR routine in UN-ESCOs free software package WinIDAM downloaded from the Inter-net. The PCA was done on correlation coefficients and limited to 6principal components. The relative congener profiles of the averagesmentioned in the preceding section were used as input. The datawere ranked in order of total averages all data, leading to the se-quence (in descending order):
23478-PeCDF, 12378-PeCDD, 2378-TCDD, 1234678-HpCDD, 123789-HxCDD, 123678-HxCDD, 123478-HxCDD, 123478-HxCDF, 2378-TCDF, 123678-HxCDF, 234678-HxCDF, OCDD, 12378-PeCDF,123789-HxCDF.
1234789-HpCDF and OCDF were left out because of low average.
The results of the PCA showed that the eigenvalues of the first 2principal components (factors) were 5.42 and 3.89, explaining 36 and25% respectively of the variation, i.e. 61% together. In the following,only these two factors are considered.
-50
-40
-30
-20
-10
0
10
20
30
40
50
-40 -20 0 20 40 60
Factor 1
Factor 2
D epo
Through
Air
Figure 30. Results of PCA on first two factors on the average relativecongener profiles deposition, through fall and air all sites, summer winterand total, signatures showing matrix.

67
Air and through fall Figure 30 shows the results of the PCA with signatures for the matrix.It is remarkably that the air results form a tight, well-defined groupon the left side of the y-axis close to the x-axis. This group includessummer winter and total for all air-sites. Also the through fall formsa very tight group within the x-range (factor 1) of the air group, buthigher y-range (factor 2). The distinct groups at near identical pri-mary factor attest to a close relationship between the profiles of airand through fall, and confirm that the uptake of PCDD/Fs from theair in spruce needles is an important process for through fall. Thatthe through fall is higher in factor 2 indicates subtle differences in theprofiles, possibly caused by different solubilities of congeners in thewaxy needles. However, one must consider the possibility that the(slight) difference also might be due to the different sampling tech-niques employed for air and deposition/through fall. The existenceof such well-defined groups so close together confirms that themethods of sampling and analysis yield consistent and comparableresults, even if the sampling campaign extends over several years. Onthe other hand, the distinct air-group show that the profiles in (Dan-ish) air are closely related and ubiquitous, and hence, unsuited forsource identification and backtracking studies. Thus, the idea to usePCA on air profiles for source identification and transport studies isnot supported by the present results.
Deposition In stark contrast to air and through fall, the deposition results arespread out in the right side of the PCA diagram, occupying spacenear the x-axis and the y-axis. A single point (Copenhagen winter av-erage) is found on the left side inside the air group. The wide spread-out of the deposition points indicates that the profiles vary muchmore than those of air, the primary transport medium. We can con-clude that the profiles are altered during the process of transfer formair to deposition. This transformation is highly variable, and the pro-cess discriminates between congeners.
Site and season The influence of season and geographical location is addressed inFigure 31, which shows the same PCA as Figure 30 with the site andmatrix colour-coded and the season shape-coded. To make the sum-mer-winter difference, clearer, the totals are omitted.

68
-50
-40
-30
-20
-10
0
10
20
30
40
50
-40 -20 0 20 40 60
Factor 1 (% )
Factor 2 (%)
U lfb Dep
Fred Dep
Fred Thr
Cope Dep
Born Dep
Fred Air
Cope Air
Gund Air
Sum m er
W inter
Figure 31. Results of PCA (same as shown in Figure 30) on first two factorson the average relative congener profiles deposition, through fall and air alldata, summer and winter (totals are omitted). Site and matrix colour-coded,season shape-coded.
It is seen from Figure 31 that the deposition summer and winter re-sults of Ulborg and Frederiksborg display large vertical differencewithin a narrow x-interval. These findings indicate that the Ulborgand Frederiksborg profiles are related, as may also be seen by closeinspection of Figure 27. On the contrary, Copenhagen and Bornholmform more horizontal groups, showing a high variation along the x-axis. The PCA thus once more confirm the anomaly of Copenhagendeposition. Bornholm displays an erratic PCDD/PCDF ratio (asnoted in the result section) that leads to a poorly defined profile.Otherwise, no clear picture with respect to stations emerges. Omit-ting Copenhagen entirely and Bornholm winter, the remainder of thedata in the diagram indicates an influence of station along the x-axis(first factor), and season along the y-axis (second factor). The summeris highest in y in all cases. It may be difficult to explain the variationbetween stations, but the causes of the summer-winter difference areclearer. One factor responsible for this is obviously the air tempera-ture, which affect the fraction being in the vapour phase, thus dis-criminating between more or less volatile congeners. Another factormay be the soot content in the air, which is considerably higher dur-ing the winter, but also varies with the site. This factor also discrimi-nates between congeners, because the higher congeners (e.g. OCDD)are bound much stronger to soot carbon than the lower ones (e.g.2,3,7,8-TCDF). A third factor might be air moisture and rain fall, butthis seems to be of lesser importance as mentioned previously. Aforth factor could be photodegradation, because light intensity atDanish latitudes is considerably higher during the summer. How-ever, since photodegradation takes place in the air, this factor shouldtheoretically influence the air profiles as well, contrary to what isseen.

69
In conclusion, the PCA displays a clear picture of air and through fallprofiles, which forms distinct and related groups close to each otherin the PCA diagram. In contrast, the deposition profiles do not formgroups, but are spread out in the PCA diagram, occupying space farfrom the air group. This indicates that the profiles, during the trans-fer from air to deposition, are changed in a highly variable process,which discriminates between congeners. However, the factors re-sponsible for the variation are not entirely clear. The analysis abovedoes not take into consideration, that the recoveries of the differentcongeners show a variation (see section 4.5). This might also have aninfluence on the results.
5.13 Other studies
Concentrations in air Ambient air concentrations of PCDD/Fs from selected Europeansites are compared to the levels found in this study in Table 11.
Table 11. Comparison of atmospheric levels of PCDD/Fs in selected studies from Europe
Country Location Samplingperiod
Annual mean(min-max),fg TEQ/m3
References Remark
Denmark Frederiksborg 2002-2003 20 (3-87) Present study R
Copenhagen 2002-2003 20 (3-56) Present study U
Gundsømagle 2003 71 (9-180) Present study R
Belgium Flanders 1992 110 (20-380) Wevers et al. (1993) U
Germany Köln, Duisburg 1987 240 Hiester et al. (1997) U
Essen, Dortmund 1993 90 Hiester et al. (1997) U
Hessen 1994 100 (80-150) König et al. (1993) U
Italy Rome 1990-1991 85 (50-280) Turrio-Baldassarri et al. (1994) U
Poland Krakow 1995 12000 Grochowalski et al. (1995) U
Spain Catalunya 1995 250 (70-530) Abad et al. (1997) U
Catalunya 1995 50 Abad et al. (1997) R
Sweden Rörvik 1989-1990 21 (4-60) Tysklind et al. (1993) R
Göteborg 1988 22 (16-30) Tysklind et al. (1993) U
Coast 1987 4 Broman et al. (1991) B
Stockholm 1987 19 Broman et al. (1991) U
UK Manchester 1991-1993 410 (ND-1800) Duarte-Davidson et al. (1994) U
Cardiff 1992-1993 190 Jones et al. (1997) U
Remarks: U = urban area, SU = suburban area, R = rural area, B = background site
It is seen from Table 11 that the dioxin concentrations found in air inFrederiksborg and Copenhagen are very similar to levels earlier re-ported from Sweden (Rörvik, Göteborg and Stockholm). The coastmeasurements from Sweden are lower. The concentrations from arural site in Spain are somewhat higher than the Danish levels. Thiscould be caused by climate difference, but since in Spain the reportedurban concentrations are considerably higher, there must be localsources that might influence the background too. Apart from Swe-den, all urban values reported are higher than the Copenhagen re-sults. This might be due to combustion sources such as industry, in-

70
cineration and heating; whereas in the Copenhagen area the prevail-ing heating method is district heating, incinerators are equipped withspecial flue-gas cleaning, and there is no heavy industry.
Bulk deposition The atmospheric deposition fluxes of PCDDs/F (pg TEQ/m2·day)reported in selected studies in Europe are compared to the fluxes ob-served in the present study (Table 12).
It is seen from Table 12 that the flux in bulk deposition at the back-ground and rural sites Ulborg, Frederiksborg and Bornholm are verysimilar to the levels reported from Belgium (rural site in Flanders)and Germany (rural sites in Bayreuth and Baden-Würtemberg). Allresults from Italy are lower, even of the industrial and urban sites,and so is the German background site at Zingst. The results from Co-penhagen compared to urban and suburban values are close to re-sults reported from Flanders and Bayreuth, but lower than thosefrom Nort Rhine Westphalia and Baden Würtemberg.
Overall, this geographical distribution shows a general agreementbetween the background/rural and low urban levels, whereas someresults from urban sites in Germany are higher than the Danish re-sults. This is hardly surprising. Contrasting this pattern, the resultsfrom Italy and Zingst stand out as low in comparison. Since this dis-crepancy is confined to two specific studies (Guerzoni et al., 2004 andKnoth et al., 2000), it cannot be excluded that the difference might bedue to the methods used in the respective studies.
Table 12. Comparison of atmospheric deposition fluxes of PCDD/Fs in selected studies from Europe
Country Location Samplingperiod
Flux, mean (min-max),pg/m2·day TEQ
Reference Remark
Denmark Ulborg 2002-2005 2.9 (0.3-13.8) Present study B
Frederiksborg 2002-2005 4.4 (0.5-16.9) Present study R
Bornholm 2003-2005 6.1 (0.5-31.5) Present study R
Copenhagen 2003-2004 8.0 (1.7-31.6) Present study U
Italy Venice 1998-1999 (0.19-0.2) Guerzoni et al. (2004) U
Porto Marghera 1998-1999 (0.03-5.2) Guerzoni et al. (2004) I
Venice 1998-1999 (0.03-6.2) Guerzoni et al. (2004) R
Belgium Flanders 1993-1999 (3.4-25.0) van Lieshout et al. (2001) U
Flanders 1993-1999 (0.68-10.0) van Lieshout et al. (2001) R
Germany Bayreuth 1996 (0.71-6.4) Hostmann et al. (1997) B
Bayreuth 1994-1995 (2.0-10.9) Hostmann et al. (1998) U
North Rhine West-phalia
1992 (9.6-82.2) Hiester et al. (1993) U
Baden Württemberg 1992 (34.0-40.8) Wallenhorst et al. (1997) U
Baden Württemberg 1992 (24.1-38.1) Wallenhorst et al. (1997) SU
Baden Württemberg 1992 (2.7-10.1) Wallenhorst et al. (1997) R
Zingst 1996-1997 (1.1-1.7) Knoth et al. (2000) B
Remarks: U = urban area, SU = suburban area, R = rural area, B = background site, I = industrial area

71
6 Conclusions
Air The results for air show a pronounced seasonal variation withmaxima in the winter and a small year to year variation. The air con-centrations in North-Zealand and Copenhagen are very alike, point-ing to long range transport as a potential contributor to atmosphericPCDD/F at these sites. The village winter maximum is very pro-nounced, being the highest measured in the programme. The highconcentrations are must likely caused by local emissions from woodstoves during the heating season. The mean concentrations at theFrederiksborg and Copenhagen sites were 20 fg/m3 I-TEQ
Through fall The through fall results show some variation throughout the seasonsand the level is somewhat higher than the bulk deposition. Thehigher level is probably caused by a contribution from airbornePCDD/F, captured by the spruce canopy and later on transferred tothe ground by precipitation or adsorbed to organic material.
Bulk deposition Measurements of PCDD/Fs in bulk deposition 2002-2005 at threerural sites in Denmark show an even geographical distribution overthe country, the difference amounting to factor two. The seasonalvariation is not as pronounced as for air. The background level (i.e.mean of rural sites) was 4.5 pg/m2·day I-TEQ. The deposition in Co-penhagen is 1.8 times higher than that in Frederiksborg, in spite ofthe similarity in air concentration. This difference is, possibly an ef-fect of dust contaminating the bulk deposition sampler.
Role for soil The regional deposition roughly accounts for the PCDD/Fs in ruralsoil. The present bulk deposition flux corresponds to accumulationtimes of 75-86 years. In Copenhagen, the soil concentrations are muchtoo high and variable to be explained by deposition alone.
Role for sediment The concentrations of dioxin in sediments of investigated lakes are ingeneral too high to be explained by bulk deposition alone. This is alsothe case for sea sediment.
Connection with rain The rainfall amounts at the different sites are similar. On a regionalscale, the average deposition flux follows the concentrations in rainand not the rainfall.
National annual deposition The average rural deposition, 4.5 pg/m2·day I-TEQ, corresponds to1.6 mg/km2·year I-TEQ or 72 g/year on the Danish land area. This isin the same range as Danish atmospheric sources, which is estimatedto 11-148 g/year (all sources) or 9-45 g/year (known sources).
Deposition over the Baltic Sea Atmospheric input of PCDD/Fs to the western Baltic Sea based onDanish and German measurements is estimated to 1.3 mg I-TEQ/km2·year. From measurements of the content of dioxin in fatty pelagicfish (herring and salmon) and an estimation of the yearly productionof biomass, it is demonstrated that the uptake in fish only amounts to0.4% of the flux of dioxins deposited from the atmosphere. There-fore, atmospheric deposition to the sea surface of the western BalticSea can account for the PCDD/Fs found in pelagic fish being the topof the food web in the open sea.

72
Human intake Deposition carries a large surplus of PCDD/Fs into the Baltic Seacompared to the amount contained in the pelagic fish production;hence, this transport route does have an important impact on thehuman intake via seafood. Also, the deposition on the Danish landarea during the summer is more than sufficient to account for thePCDD/F s contained in cow milk, hence, dairy products.
Correlations The main TEQ-contributor is 2,3,4,7,8-PeCDF followed by 1,2,3,7,8-PeCDD and 2,3,7,8-TCDD at all sites, seasons as well as matrixes. Thecongener profiles of air and through fall are alike, as are the deposi-tion profiles of Ulborg/Frederiksborg and Copenhagen/Bornholm.
Congener profiles The main TEQ-contributor in all sites and matrixes is 2,3,4,7,8-PeCDFfollowed by 1,2,3,7,8-PeCDD and 2,3,7,8-TCDD. The congener pro-files of air and through fall are alike, as are the deposition profiles ofUlborg/Frederiksborg and Copenhagen/Bornholm.
Principal Component Analysis A principal Component Analysis on average congener profiles showsthat the congeners found in air form a tight group, indicating that theprofiles are similar (across site, summer and winter). The same is thecase for profiles of through fall, which form a group close to the airgroup, showing the effect of gaseous dry deposition on the sprucetrees. In contrast, the deposition data are spread out in another regionof the PCA diagram, reflecting a much higher variation between pro-files. Roughly speaking, the first component accounts for site, and thesecond for the summer-winter difference.
Other studies The Danish concentrations of PCDD/Fs in rural air are at the samelevel as those found by Swedish and German measurements,whereas Spanish values are higher. Apart from Sweden, all urbanvalues reported elsewhere are higher than the Copenhagen results.The flux of PCDD/Fs in bulk deposition at the Danish rural sites isvery similar to the levels reported from rural sites in Belgium andGermany. Results from Italy and German background site at Zingstare lower, however. The results from Copenhagen are close to urbanand suburban values results reported from Flanders and Bayreuth,but those from North Rhine Westphalia and Baden Würtemberg arehigher.
Future work It is important to quantify deposition and atmospheric levels ofPCDD/F over Danish waters in order to evaluate, and eventually toreduce, the flux of PCDD/Fs into seafood. In this connection it wouldbe necessary to operate more sea stations. The Danish islands Born-holm and Falster in the Baltic Sea and Anholt in Kattegat, would bevery suited for such an investigation, since deposition stations has tobe located on islands. Backtracking from high time resolution studiesshould be used to locate atmospheric sources in the Baltic region.
Final conclusion The present investigation shows that atmospheric deposition stillyields an important contribution to the human intake of PCDD/Fsfrom seafood, milk and dairy products. The only way to cope withthis is to locate atmospheric sources and reduce/eliminate theiremission. This work should be continued on an international scale,and the progress followed by air and deposition studies.

73
7 Acknowledgements
The investigation was financially supported by a grant from DanishEPA, additional supported from National Environmental ResearchInstitute in Roskilde and from Danish Forest and Landscape Re-search Institute in Hørsholm. The skilful technical assistance of HansAhleson, Morten Hildan and Viggo Madsen is gratefully acknowl-edged.

74

75
8 References
Abad, E., Caixach, J., Rivera, J. (1997) PCDD/PCDF from emissionssources and ambient air in northeast Spain. Chemosphere, 35, 453-463.
Andersen, H.V., Hovmand, M.F., Hummelshøj, P., Jensen, N.O. (1993).Measurements of Ammonia Flux to a Spruce Stand in Denmark. At-mospheric Environment. 27a, 189-202.
Bille-Hansen, J., Hovmand, M.F., Jensen, N.O., Ro-Poulsen, H. (1994).Background information for surveillance on the permanent observa-tion plots in Denmark. Level II. Danish Forest and Landscape ResearchInstitute, DK-2800 Lyngby.
Bille-Hansen, J. (2000). Biogeochemical cycling in forest ecosystemswith special emphasis on litterfall fluxes and stability of forest eco-systems.
Brodersen, K.E., Bille-Hansen, J., Jørgensen, K.H., Hovmand, M.F.,Christiansen, H., Machenzie, S., Solgaard, P. (1990). Data Acquisitionand App. of soil chemistry model ECCES. Forskningscenter Risø. Risø-M-2893.
Broman, D., Näf, C., Zebuer, Y. (1991). Long term high- and low-volume air sampling for polychlorinated dibenzo-p-dioxins and di-benzofurans and polycyclic aromatic hydrocarbons along a transectfrom urban to remote areas on the Swedish Baltic Coast. Environ-mental Science & Technology, 31, 1841-1850.
CEN (1996). European Standard EN 1948. Mass determination ofpolychlorinated dibenzo-p-dioxins (PCDD) and polychlorinated di-benzofurans (PCDF) in flue gas from incinerators. Part 1, Sampling.Part 2. Extraction and cleanup. Part 3, Determination by GC/HR-MS.
Cleverly D.H., Winters, D., Ferrario, J., Schaum, J., Riggs, K., Hart-ford, P., Joseph, D., Wisbith, T., Dupuy, A., Byrne, C. (2001). Organo-halogen Compounds 51, 1-4.
Duarte-Davidson, R., Clayton, P., Coleman, P., Davis B.J., Halsall,C.J., Harding-Jones, P., Pettit, K., Woodfield, M.J., Jones, K.C. (1994).Polychlorinated dibenzo-p-dioxins (PCDDs) and furans (PCDFs) inurban air and deposition in the United Kingdom. Environmental Sci-ence and Pollution Research, 1, 262-270.
Fiedler, H., Rottler, H., Peichl, L. Knetsch, G., Basler, A. (2000).PCDDs/PCDFs Concentrations of PCDD/PCDF in AtmosphericSamples in Germany. Organohalogen Compounds 45, 264-268.
Glasius, M., Vikelsøe, J., Bossi, R., Andersen, H.V., Holst, J., Johan-sen, E., Schleicher, O. (2005). Dioxin, PAH og partikler fra brændeov-ne. Arbejdsrapport fra DMU, nr. 212.

76
Grochowalski, A., Wybraniec, S., Chrzaszcz, R. (1995). Determina-tion of PCDFs/PCDDs in ambient air from Krakow city, Poland. Or-ganohalogen Compounds Vol. 24, 153-156.
Guerzoni, S., Rossini, P., Molinaroli, E., Rampazzo, G., Racanelli, S.(2004). Measurements of polychlorinated dibenzo-p-dioxins and di-benzofurans in the Lagoon of Venice, Italy. Chemosphere 54, 1309-1317.
Hansen E., Skårup S., Jensen A.A. (2000). Substance flow analysis fordioxins in Denmark. Environmental Project No. 570, Danish EPA.Electronic publication: www.mst.dk/udgiv/Publications/2000
Hansen E, Hansen, C.L. (2003). Substance Flow Analysis for Dioxin2002. Environmental Project No. 811. Electronic publication:www.mst.dk/udgiv/Publications/2003
Harrad, S. J., Jones, K. C. (1992). A source inventory and budget forchlorinated dioxins and furans in the United Kingdom Environment.Science of the Total Environment 126, 89-1007.
Hiester, E., Böhm, R., Eynck, P., Gerlach, A., Mülder, W., Ristow, H.(1993). Long term monitoring of PCDD, PCDF and PCB in bulkdeposition samples. Organohalogen Compounds Vol. 12, 147-150.
Hiester, E., Bruckmann, P., Böhm, R., Eynck, P., Gerlach, A., Mülder,W., Ristow, H. (1997). Pronounced decrease of PCDDs and PCDFsburden in ambient air. Chemosphere, 34, 1231-1243.
Horstmann, M., Bopp, U., McLachlan, M.S. (1997). Comparison onthe Bulk Deposition of PCDD/Fs in a Spruce Forest and an adjacentClearing. Chemosphere 34, 1245-1254.
Horstmann, M., Mclachlan, M. S. (1997). Sampling Bulk Depositionof Polychlorinates Dibenzo-p-Dioxins and Dibenzofurans. Atmos-pheric Environment 31, 2977 - 2982.
Horstmann, M., Mclachlan, M. S. (1998). Atmospheric deposition ofsemivolatile organic compounds to two forest canopies. AtmosphericEnvironment 32, 1799-1809.
Hovmand, M.F. (1990). Vandmiljøplanens Overvågningsprogram1989, Atmosfæren. NERI technical reports no. 7. DK-4000 Roskilde
Hovmand, M.F., Kemp, K. (1996). Downward trends of Sulphurdeposition to Danish forest. Atmospheric Environ. 30, 2989-2999.
Hovmand, M.F., Bille-Hansen, J. (1999). Atmospheric input to Danishspruce forest and effects on soil acidification and forest growth basedon 12 years measurements. Water, Air and Soil Pollution. 116
Hovmand, M.F., Grundahl, L., Kemp, K. (1992). VandmiljøplanensOvervågningsprogram 1991. Atmosfærisk deposition. NERI technicalreport no. 59.

77
Hovmand, M.F., Vikelsøe, J., Andersen, H.V. (In prep.) Atmosphericdeposition of PCDD/Fs (Dioxins and Furans) at three forest sites innorthern Europe. National Environmental Research Institute,Frederiksborgvej 399. DK-4000 Roskilde.
Hovmand M.F., Vikelsøe J, 2005. Et lille atmosfærisk dioxinnedfaldmed stor virkning. Stads-og havneingeniøren, 3, 60-62.
Hülster, A., Marchner, H. (1993). Transfer of PCDD/PCDF from con-taminated soil to food and fodder crop plants. Chemosphere 27(1-3)439-445.
Jensen, Allan Astrup (2003) Kortlægning af dioxinforurening samtkilder til dioxinforurening i Østersøen. Miljøprojekt nr. 796, Miljøsty-relsen, februar 2003.
Jones, K.C., Duarte-Davidson, R. (1997). Transfer of airbornePCDDs/Fs to bulk deposition collectors and herbage. EnvironmentalScience & Technology, 31, 2937-2943.
Kirshmer, P., Mulder, W. Eynck, P. (1992). Comparison of samplepreparation and extraction procedure for the analysis of PCDD/Fs indeposited particulate matter and bulk deposition. Chemosphere 24(5),575-580.
Knoth, W., Rotard, W., Christmann, W., Pribyl, J. (2000). Backgroundlevels of PCDD/Fs ambient air, particulate matter and deposition inGermany. (2000) Organohalogen Compounds, Vol. 46, 467-470.
Kronvang, B. Ærtebjerg, G. Grant, R. Kristensen, P. Hovmand, M.,Kirkegaard, J. (1993). Nation-wide Monitoring of Nutrients and theirEcological Effects. AMBIO 22, 176-187.
König, J., Theisen, J., Günther, W.J., Liebl, K.H., Büchen, M. (1993).Ambient air levels of polychlorinated dibenzofurans and di-benzo(p)dioxins in different sites in Hessen. Chemosphere 26, 851-861.
Lohmann, R., Jones, K.C. (1998). Dioxins and furans in air and depo-sition.: A review of levels, behaviour and processes. Science of TotalEnvironment 219, 53-81.
Rappe, C., Öberg, L., Andersson, R. (1999a). Natural Formation - ANeglected Source of Polychlorinated Dioxins and Dibenzofurans. Or-ganohalogen Compounds 43, 249-253.
Rappe, C., Bergek, S., Andersson, R., Cooper, K., Fiedler, H., Bopp, R.,Howell, F., Bonner, M. (1999b). PCDDs in Naturally-formed LakeSediment Cores from Southern Mississippi, USA. OrganohalogenCompounds 43, 111-116.
Rappolder, M., Schroeter-Kermani, C., Waller, U., Koerner, W. (2004).Pine- and Spruce-Shoots - Results from the German EnvironmentalSpecimen Bank. Organohalogen Compounds 66, 1842-1847.

78
Turrio-Baldassarri, R., Carere, A., di Domenico, A., Fuselli, S., Ia-covella, N., Rodiguez, F. (1994). PCDD, PCDF, and PCB contamina-tion of air and inhalable particulate in Rome. Fresenius Journal ofAnalytical Chemistry 348, 144-147.
Tysklind, M., Fängmark, I., Marklund, S., Lindskog, A., Thaning, L.,Rappe, C. (1993). Atmospheric transport and transformation of poly-chlorinated dibenzo-p-dioxins and dibenzofurans. EnvironmentalScience & Technology, 27, 2190-2197.
van Lieshout, L., Desmedt, M., Roekens, E., de Fré, R., van Cleuven-bergen, R., Wevers, M. (2001). Deposition of dioxins in Flanders (Bel-gium) and a proposition for guide values. Atmospheric Environment35, 83-90.
VDI 2119 (1972). Messung partikelförmiger Niederschläge. VereinDeutscher Ingeniure. Düsseldorf.
Verta M., Salo, S., Korhonen, M., Assmuth, T., Kiviranta, H., Koisti-nen, Ruokojärvi, P., Isosaari, P., Bergqvist, P.-A., Tysklind, M., Cato,I., Vikelsoe, J., Larsen, M.M. (2005). Dioxin Concentrations in Sedi-ments of the Baltic Sea. - A Survey Of Existing. Data. Submitted toChemosphere
Vikelsøe, J., Thomsen, M., Johansen E. (1998). Sources of phthalatesand nonylphenols in municipal waste water. A study in a local envi-ronment. NERI Technical Report No. 225.
Vikelsøe, J., Thomsen, M., Johansen, E., Carlsen, L. (1999). Phthalatesand nonylphenols in soil. A field study of different soil profiles.NERI technical report No. 268.
Vikelsøe, J., Hovmand, M., Andersen, H.V. (2003). PCDD/Fs in depo-sition, spruce through fall and air in Denmark. Organohalogen Com-pounds 61, 454-457.
Vikelsøe, J. (2003). Det Danske Dioxin Moniterings Program. Mereviden om kilder og emissioner. Statusrapport for dioxinmålepro-grammet på DMU, april 2003.
Vikelsøe, J,. Andersen, H.V (2004). The Danish Dioxin MonitoringProgramme. Dioxin in Danish Air. Organohalogen Compounds 66,2204-2208.
Vikelsøe, J. (2004). Det Danske Dioxin Moniterings Program. Mereviden om kilder og emissioner. Statusrapport for dioxinmålepro-grammet på DMU, april 2004.
Vikelsøe, J. (2005). Det Danske Dioxin Moniterings Program. Mereviden om kilder og emissioner. Statusrapport for dioxinmålepro-grammet på DMU, april 2005.
Wallenhorst, T., Krauß, P., Hagenmaier, H-P. (1997). PCDD/Fs inambient air and deposition in Baden Württemberg, Germany. Che-mosphere 34, 1369-1378.

79
Wevers, M., De Fré, R., Van Cleuvenbergen, R., Rymen, T. (1993).Concentrations of PCDDs and PCDFs in ambient air at selected loca-tions in Flanders. Organohalogen Compounds, Vol. 12, 123-126.
Wåhlin, P., Mønster, J.G., Glasius, M., Ketzel, M., Berkowicz, R. &Palmgren, F. 2003: Measurements of wood burning emissions inDenmark – first results. Abstract presented at the NOSA 2003 Aero-sol Symposium, Copenhagen, Denmark, 13-14 November 2003.

80

81
9 Abbreviations
2378-TCDD 2,3,7,8-tetrachlorodibenzo-p-dioxin
12378-PeCDD 1,2,3,7,8-pentachlorodibenzo-p-dioxin
123478-HxCDD 1,2,3,4,7,8-pentachlorodibenzo-p-dioxin
123678-HxCDD 1,2,3,6,7,8-hexachlorodibenzo-p-dioxin
123789-HxCDD 1,2,3,7,8,9-hexachlorodibenzo-p-dioxin
1234678-HpCDD 1,2,3,4,6,7,8-heptachlorodibenzo-p-dioxin
OCDD Octachlorodibenzo-p-dioxin
2378-TCDF 2,3,7,8-tetrachlorodibenzofuran
12378-PeCDF 1,2,3,7,8-pentachlorodibenzofuran
23478-PeCDF 2,3,4,7,8-pentachlorodibenzofuran
123478-HxCDF 1,2,3,4,7,8-hexachlorodibenzofuran
123678-HxCDF 1,2,3,6,7,8-hexachlorodibenzofuran
123789-HxCDF 1,2,3,7,8,9-hexachlorodibenzofuran
234678-HxCDF 2,3,4,6,7,8-hexachlorodibenzofuran
1234678-HpCDF 1,2,3,4,6,7,8-heptachlorodibenzofuran
1234789-HpCDF 1,2,3,4,7,8,9-heptachlorodibenzofuran
OCDF Octachlorodibenzofuran
dm Dry matter
HR-MS High resolution mass spectrometry
I-TEQ International Toxicity Equivalent
Max Maximum value
Min Minimum value
n Number of measurements (in statistics)
nd Not detected, non-detect
ng Nanogram, 10-9 g
µg Microgram, 10-6 g
pg Picogram, 10-12 g
fg Femtogram, 10-15 g
PCA Principal Component Analysis
PCDDs Polychlorinated dibenzo-p-dioxins
PCDFs Polychlorinated dibenzofurans
PCDD/Fs PCDDs and/or PCDFs
sd Standard deviation
TEF Toxicity equivalence factor
UV Ultra-violet
WHO-TEQ WHO toxicity equivalent
GC/MS Gas Chromatography – Mass Spectrometry

Danmarks Miljøundersøgelser
Danmarks Miljøundersøgelser - DMU - er en forskningsinstitution i Miljøministeriet. DMU’s opgaveromfatter forskning, overvågning og faglig rådgivning indenfor natur og miljø.
Henvendelser kan rettes til: URL: http://www.dmu.dk
Danmarks MiljøundersøgelserFrederiksborgvej 399Postboks 3584000 RoskildeTlf.: 46 30 12 00Fax: 46 30 11 14
DirektionPersonale- og ØkonomisekretariatForsknings-, Overvågnings- og UdviklingssekretariatAfd. for SystemanalyseAfd. for Atmosfærisk MiljøAfd. for Marin ØkologiAfd. for Miljøkemi og MikrobiologiAfd. for Arktisk MiljøProjektchef for kvalitets- og analyseområdet
Danmarks MiljøundersøgelserVejlsøvej 25Postboks 3148600 SilkeborgTlf.: 89 20 14 00Fax: 89 20 14 14
Afd. for Terrestrisk ØkologiAfd. for Ferskvandsøkologi
Danmarks MiljøundersøgelserGrenåvej 12-14, Kalø8410 RøndeTlf.: 89 20 17 00Fax: 89 20 15 15
Afd. for Vildtbiologi og Biodiversitet
Publikationer:DMU udgiver faglige rapporter, tekniske anvisninger, temarapporter, samt årsberetninger. Et katalog overDMU’s aktuelle forsknings- og udviklingsprojekter er tilgængeligt via World Wide Web.I årsberetningen findes en oversigt over det pågældende års publikationer.

Faglige rapporter fra DMU/NERI Technical Reports
2005Nr. 526: Effekter af fi skeri på stenrevs algevegetation. Et pilotprojekt på Store Middelgrund i Kattegat.
Af Dahl, K. 16 s. (elektronisk) Nr. 527: The impact on skylark numbers of reductions in pesticide usage in Denmark. Predictions using a
landscape-scale individual-based model. By Topping, C.J. 33 pp. (electronic) Nr. 528: Vitamins and minerals in the traditional Greenland diet. By Andersen, S.M. 43 pp. (electronic) Nr. 529: Mejlgrund og lillegrund. En undersøgelse af biologisk diversitet på et lavvandet område med stenrev
i Samsø Bælt. Af Dahl, K., Lundsteen, S. & Tendal, O.S. 87 s. (elektronisk) Nr. 530: Eksempler på økologisk klassifi cering af kystvande. Vandrammedirektiv-projekt, Fase IIIa.
Af Andersen, J.H. et al. 48 s. (elektronisk)Nr. 531: Restaurering af Skjern Å. Sammenfatning af overvågningsresultater fra 1999-2003.
Af Andersen, J.M. (red.). 94 s. Nr. 532: NOVANA. Nationwide Monitoring and Assessment Programme for the Aquatic and Terrestrial
Environments. Programme Description – Part 1. By Svendsen, L.M. & Norup, B. (eds.). 53 pp., 60,00 DKK. Nr. 533: Fate of mercury in the Arctic (FOMA). Sub-project atmosphere. By Skov, H. et al. 55 pp. (electronic) Nr. 534: Control of pesticides 2003. Chemical Substances and Chemical Preparations.
By Krongaard, T., Petersen, K.T. & Christoffersen, C. 32 pp. (electronic) Nr. 535: Redskaber til vurdering af miljø- og naturkvalitet i de danske farvande. Typeinddeling, udvalgte
indikatorer og eksempler på klassifi kation. Af Dahl, K. (red.) et al. 158 s. (elektronisk) Nr. 536: Aromatiske kulbrinter i produceret vand fra offshore olie- og gasindustrien. Test af prøvetagningsstrategi.
Af Hansen, A.B. 41 s. (elektronisk) Nr. 537: NOVANA. National Monitoring and Assessment Programme for the Aquatic and Terrestrial
Environments. Programme Description – Part 2. By Svendsen, L.M., Bijl, L. van der, Boutrup, S. & Norup, B. (eds.). 137 pp., 100,00 DKK.
Nr. 538: Tungmetaller i tang og musling ved Ivituut 2004. Af Johansen, P. & Asmund, G. 27 s. (elektronisk) Nr. 539: Anvendelse af molekylærgenetiske markører i naturforvaltningen.
Af Andersen, L.W. et al. 70 s. (elektronisk) Nr. 540: Cadmiumindholdet i kammusling Chlamys islandica ved Nuuk, Vestgrønland, 2004.
Af Pedersen, K.H., Jørgensen, B. & Asmund, G. 36 s. (elektronisk) Nr. 541: Regulatory odour model development: Survey of modelling tools and datasets with focus on building
effects. By Olesen, H.R. et al. 60 pp. (electronic) Nr. 542: Jordrentetab ved arealekstensivering i landbruget. Principper og resultater.
Af Schou, J.S. & Abildtrup, J. 64 s. (elektronisk) Nr. 543: Valuation of groundwater protection versus water treatment in Denmark by Choice Experiments and
Contingent Valuation. By Hasler, B. et al. 173 pp. (electronic) Nr. 544: Air Quality Monitoring Programme. Annual Summary for 2004, Part 1 Measurements.
By Kemp, K. et al. 64 pp. (electronic) Nr. 546: Environmental monitoring at the Nalunaq Mine, South Greenland, 2004.
By Glahder, C.M. & Asmund, G. 32 pp. (electronic) Nr. 547: Contaminants in the Atmosphere. AMAP-Nuuk, Westgreenland 2002-2004.
By Skov, H. et al. 43 pp (electronic)Nr. 548: Vurdering af naturtilstand. Af Fredshavn, J & Skov, F. 93 s. (elektronisk) Nr. 549: Kriterier for gunstig bevaringsstatus for EF-habitatdirektivets 8 marine naturtyper.
Af Dahl, K. et al. 39 s. (elektronisk)Nr. 550: Natur og Miljø 2005. Påvirkninger og tilstand. Af Bach, H. (red.) et al. 205 s., 200,00 kr. Nr. 551: Marine områder 2004 – Tilstand og udvikling i miljø- og naturkvaliteten. NOVANA.
Af Ærtebjerg, G. et al. 94 s. (elektronisk)Nr. 552: Landovervågningsoplande 2004. NOVANA. Af Grant, R. et al. 140 s. (elektronisk)Nr. 553: Søer 2004. NOVANA. Af Lauridsen, T.L. et al. 62 s. (elektronisk)Nr. 554: Vandløb 2004. NOVANA. Af Bøgestrand, J. (red.) 81 s. (elektronisk)Nr. 555: Atmosfærisk deposition 2004. NOVANA. Af Ellermann, T. et al. 74 s. (elektronisk)Nr. 557: Terrestriske naturtyper 2004. NOVANA. Af Nielsen, K.E. et al. (elektronisk)Nr. 558: Vandmiljø og Natur 2004. Tilstand og udvikling – faglig sammenfatning.
Af Andersen, J.M. et al. 132 s. (elektronisk)Nr. 559: Control of Pesticides 2004. Chemical Substances and Chemical Preparations.
By Krongaard, T., Petersen, K.K. & Christoffersen, C. 32 pp. (electronic)

565 D
ioxin in the Atm
osphere of Denm
ark
National Environmental Research Institute ISBN 87-7772-910-2Ministry of the Environment ISSN 1600-0048
Occurrence and geographical distribution of dioxin was investigated in air and deposition at selected locations in Denmark, three forest sites in the background area, a city site in Copenhagen and a village site. At two sites simultaneously determination of dioxins concentrations in the ambient atmosphere and bulk precipitation were carried out during a period of three years.