forestry & society what is the problem? hort/rgsc 302 j.g. mexal spring 2002
Post on 19-Dec-2015
216 views
TRANSCRIPT
Forestry & Society
What is the Problem?
HORT/RGSC 302
J.G. Mexal
Spring 2002
Forestry & Society
What is the Problem?• We are the problem--our insatiable demand
for wood!
Forestry & Society
What is the Problem?• Trees are the solution.
• But a landowner is better off financially to clearcut the land, sell the timber,
sell the land, and put
the money in the bank!
You don’t see this anymore!
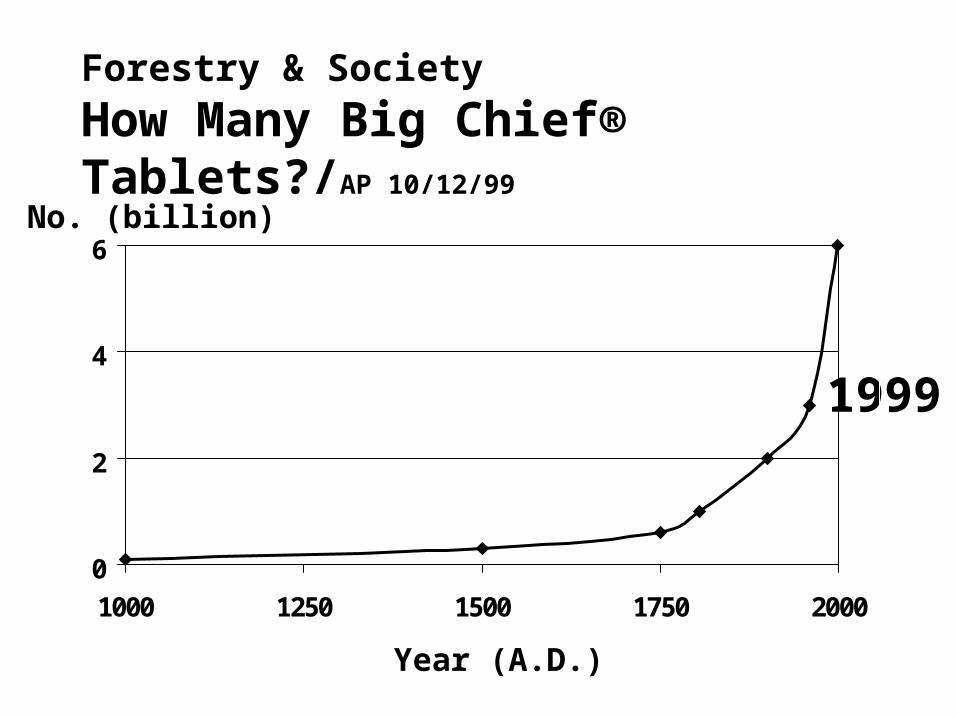
Forestry & Society
How Many Big Chief® Tablets?/AP 10/12/99
Year (A.D.)
1999
0
2
4
6
1000 1250 1500 1750 2000
No. (billion)
Forestry & Society
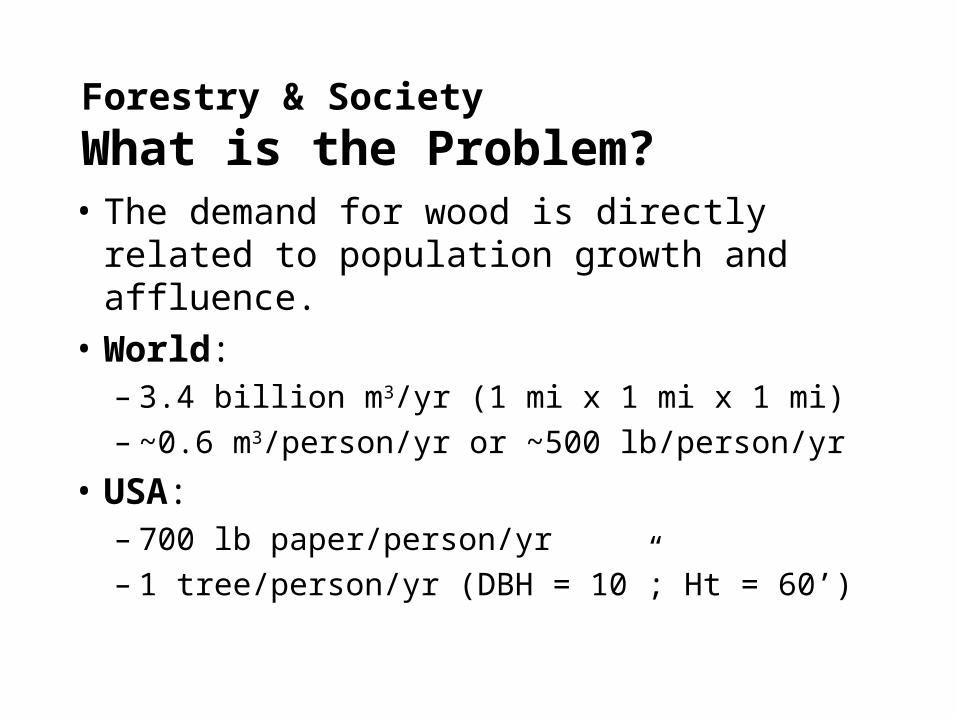
What is the Problem?• The demand for wood is directly related to
population growth and affluence.• World:
– 3.4 billion m3/yr (1 mi x 1 mi x 1 mi)– ~0.6 m3/person/yr or ~500 lb/person/yr
• USA:– 700 lb paper/person/yr– 1 tree/person/yr (DBH = 10”; Ht = 60’)
Forestry & Society
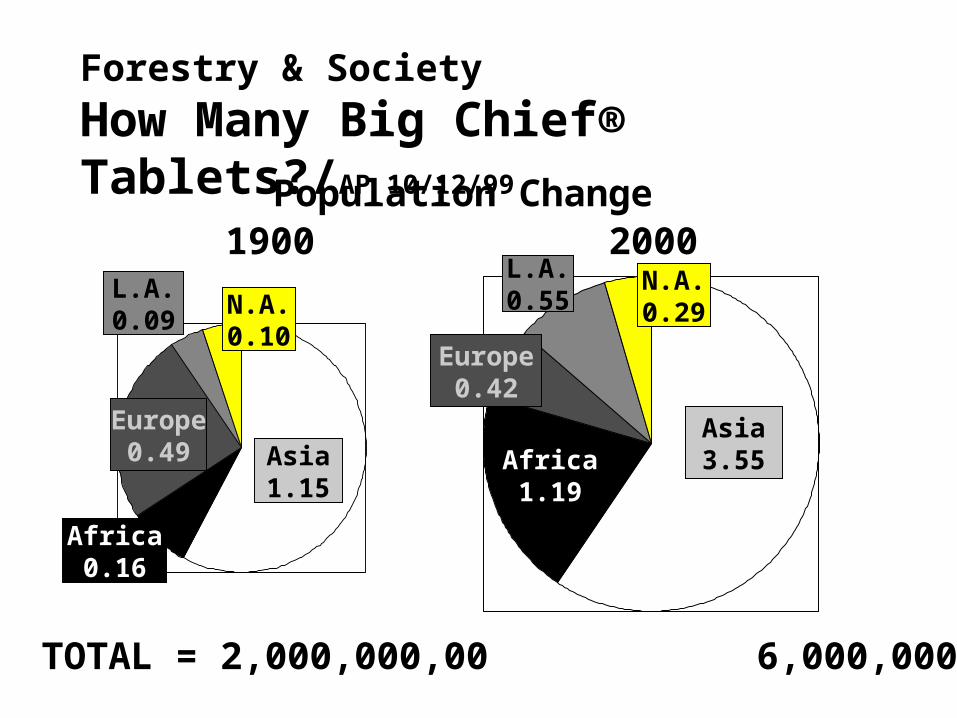
How Many Big Chief® Tablets?/AP 10/12/99
1900 2000
TOTAL = 2,000,000,00 6,000,000,000
Asia3.55Africa
1.19
Europe0.42
L.A.0.55
N.A.0.29
Asia1.15
Europe0.49
Africa0.16
L.A.0.09
N.A.0.10
Population Change
Forestry & Society
The Situation
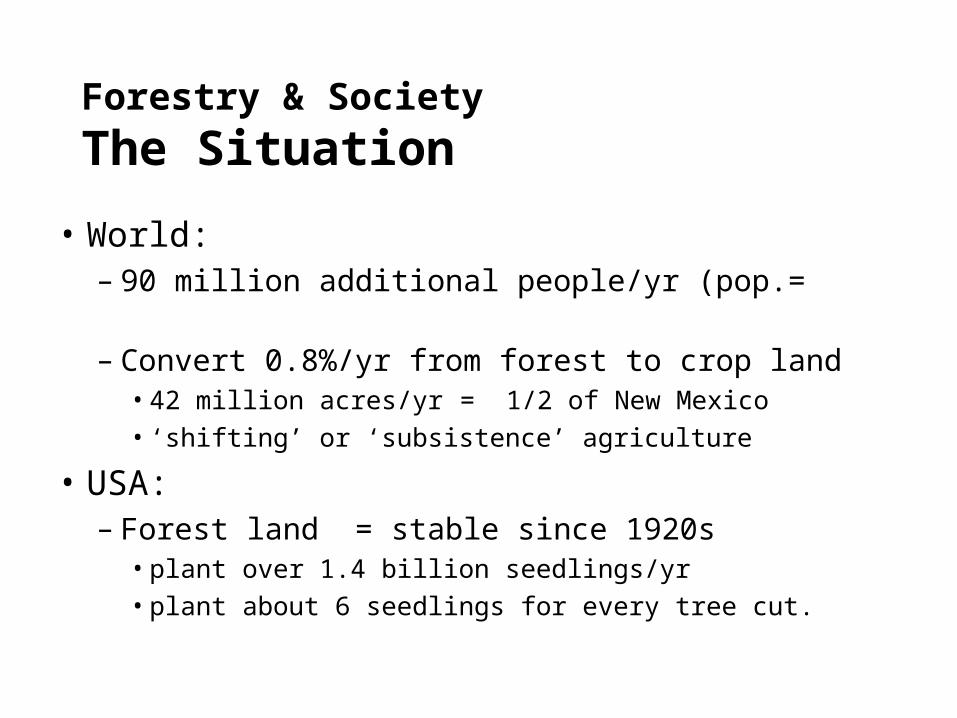
• World:– 90 million additional people/yr (pop.= Mexico)– Convert 0.8%/yr from forest to crop land
• 42 million acres/yr = 1/2 of New Mexico• ‘shifting’ or ‘subsistence’ agriculture
• USA:– Forest land = stable since 1920s
• plant over 1.4 billion seedlings/yr• plant about 6 seedlings for every tree cut.
Forestry & Society
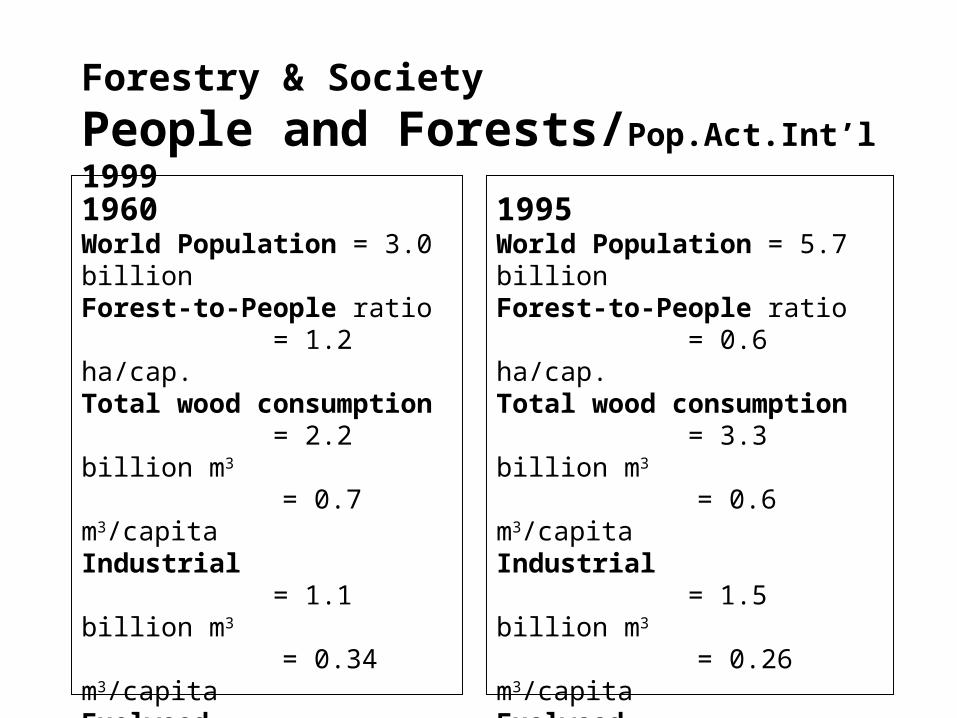
People and Forests/Pop.Act.Int’l 1999
1960World Population = 3.0 billionForest-to-People ratio
= 1.2 ha/cap.Total wood consumption
= 2.2 billion m3
= 0.7 m3/capitaIndustrial
= 1.1 billion m3
= 0.34 m3/capitaFuelwood
= 1.1 billion m3
= 0.33 m3/capita
1995World Population = 5.7 billionForest-to-People ratio
= 0.6 ha/cap.Total wood consumption
= 3.3 billion m3
= 0.6 m3/capitaIndustrial
= 1.5 billion m3
= 0.26 m3/capitaFuelwood
= 1.8 billion m3
= 0.32 m3/capita
Forestry & Society
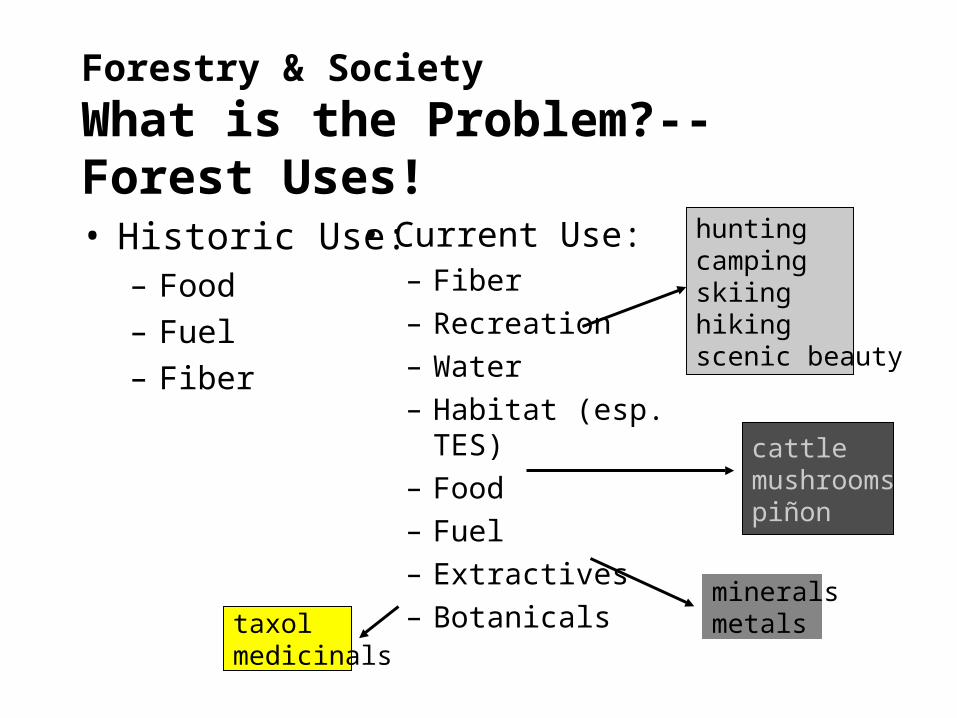
What is the Problem?--Forest Uses!
• Historic Use:– Food
– Fuel
– Fiber
• Current Use:– Fiber
– Recreation
– Water
– Habitat (esp. TES)
– Food
– Fuel
– Extractives
– Botanicals
huntingcampingskiinghikingscenic beauty
cattlemushroomspiñon
mineralsmetalstaxol
medicinals
Forestry & Society
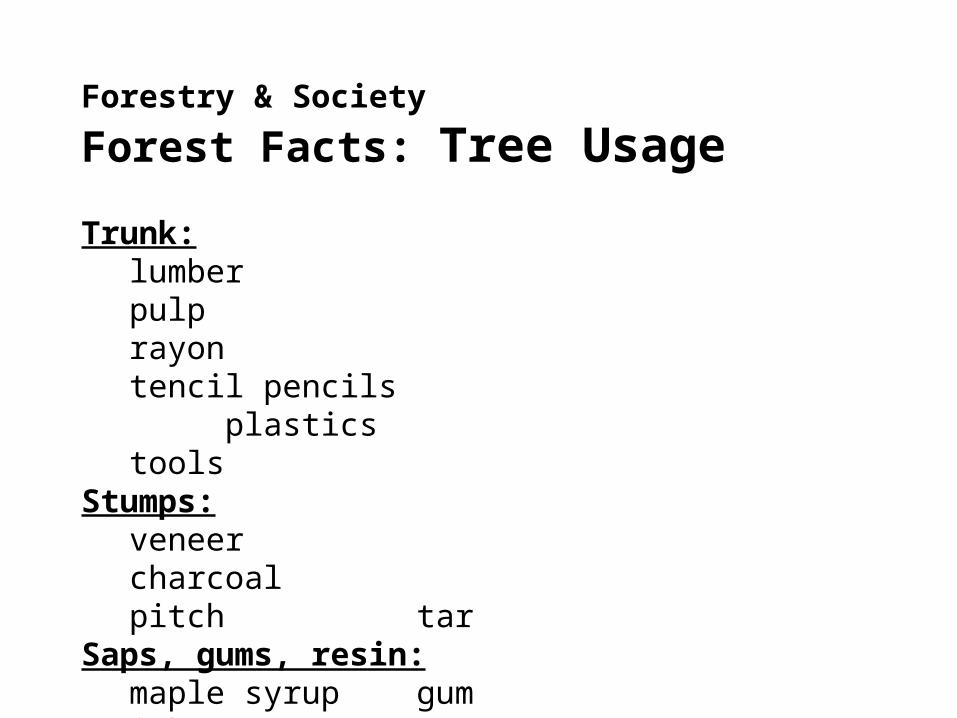
Forest Facts: Tree Usage
Trunk:lumber pulprayon tencil pencils plasticstools
Stumps:veneer charcoalpitch tar
Saps, gums, resin:maple syrup guminkpaints
Forestry & Society
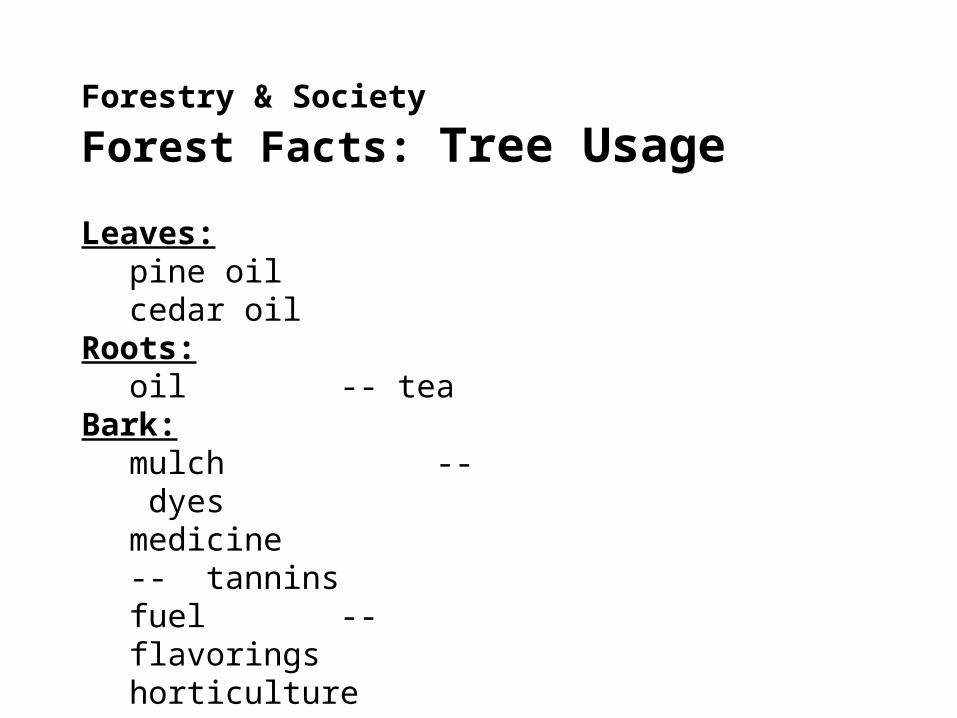
Forest Facts: Tree Usage
Leaves:pine oilcedar oil
Roots:oil -- tea
Bark:mulch -- dyesmedicine -- tanninsfuel -- flavoringshorticulture
Forestry & Society
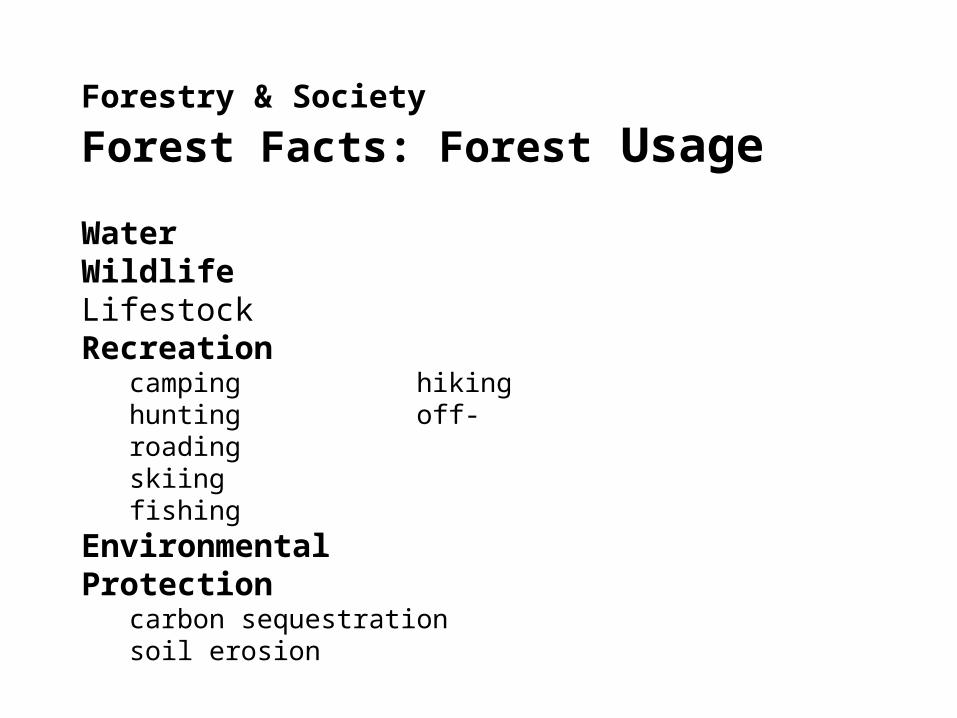
Forest Facts: Forest Usage
WaterWildlifeLifestockRecreation
camping hikinghunting off-roadingskiing fishing
Environmental Protectioncarbon sequestrationsoil erosion
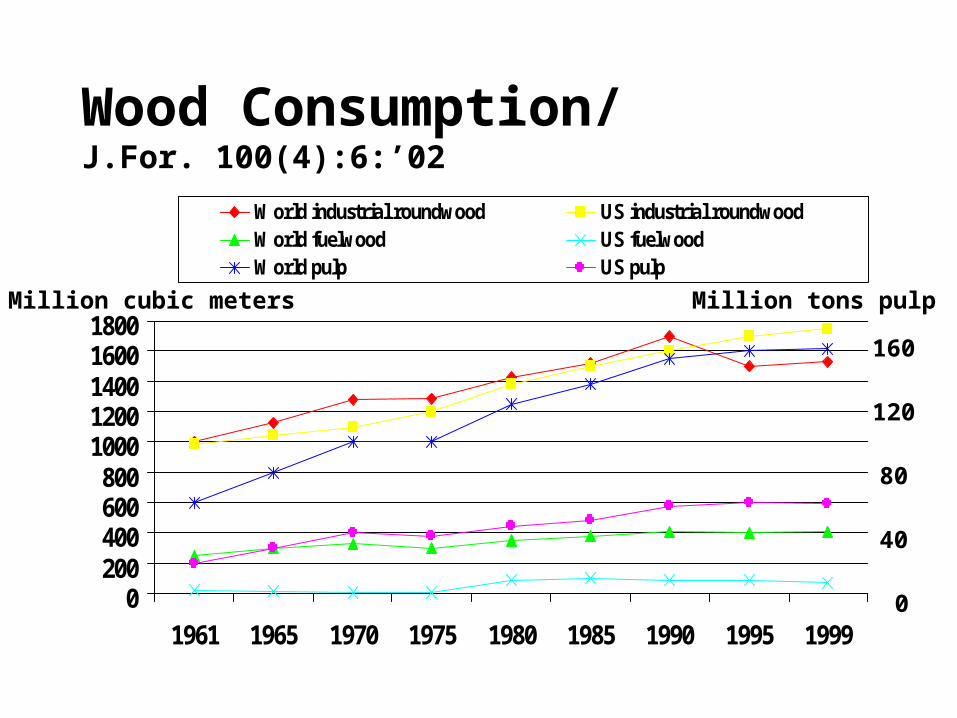
0200400600800
10001200140016001800
1961 1965 1970 1975 1980 1985 1990 1995 1999
World industrial roundwood US industrial roundwoodWorld fuelwood US fuelwoodWorld pulp US pulp
Wood Consumption/ J.For. 100(4):6:’02
Million cubic meters Million tons pulp
160
120
80
40
0
Forestry & Society
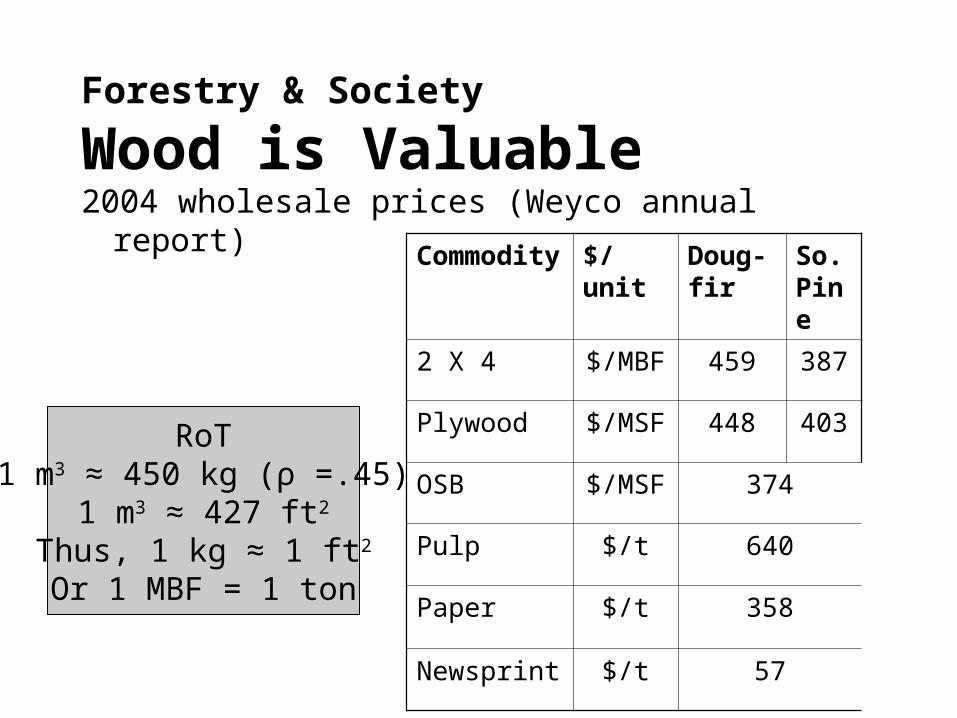
Wood is Valuable2004 wholesale prices (Weyco annual report)
Commodity $/unit Doug-fir
So. Pine
2 X 4 $/MBF 459 387
Plywood $/MSF 448 403
OSB $/MSF 374
Pulp $/t 640
Paper $/t 358
Newsprint $/t 57
RoT1 m3 ≈ 450 kg (ρ =.45)
1 m3 ≈ 427 ft2
Thus, 1 kg ≈ 1 ft2
Or 1 MBF = 1 ton
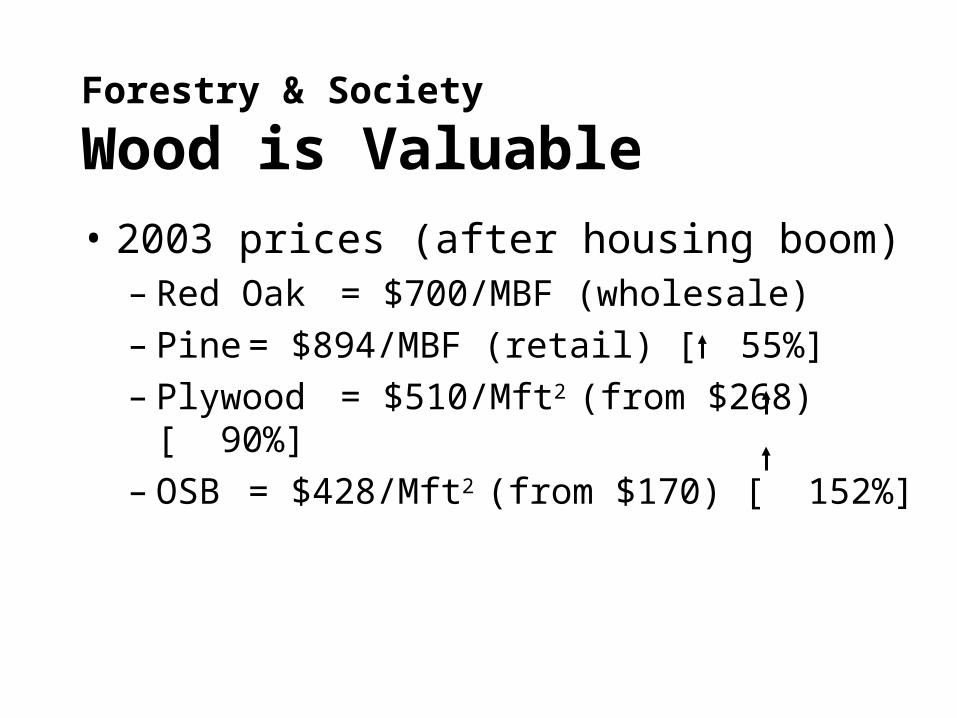
Forestry & Society
Wood is Valuable
• 2003 prices (after housing boom)– Red Oak = $700/MBF (wholesale)– Pine = $894/MBF (retail) [ 55%]– Plywood = $510/Mft2 (from $268) [ 90%]– OSB = $428/Mft2 (from $170) [ 152%]
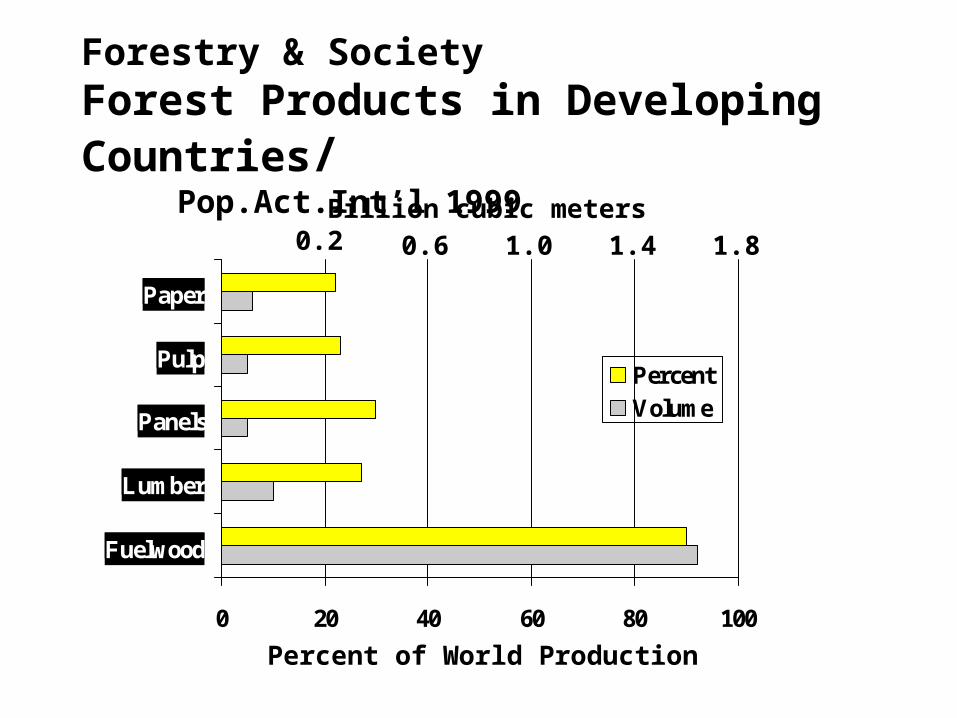
Forestry & Society
Forest Products in Developing Countries/ Pop.Act.Int’l
1999
0 20 40 60 80 100
Fuelwood
Lumber
Panels
Pulp
Paper
PercentVolume
Percent of World Production
0.2 0.6 1.0 1.4 1.8
Billion cubic meters
World:– 50% = fuel (cooking)
– 50% = lumber, paper
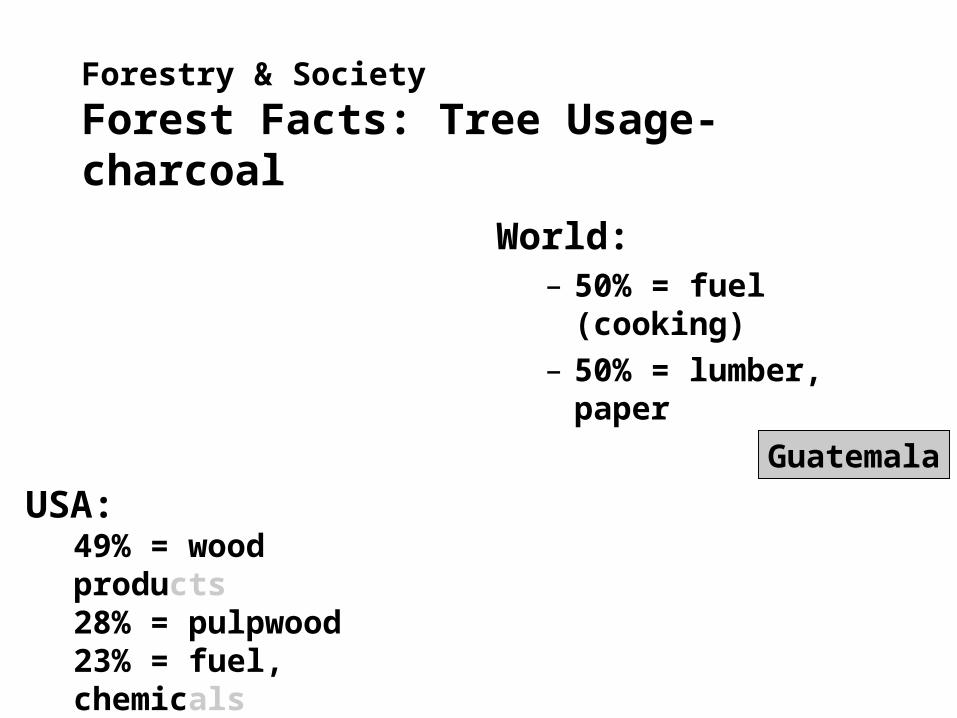
Forestry & Society
Forest Facts: Tree Usage- charcoal
Guatemala
USA:49% = wood products28% = pulpwood23% = fuel, chemicals
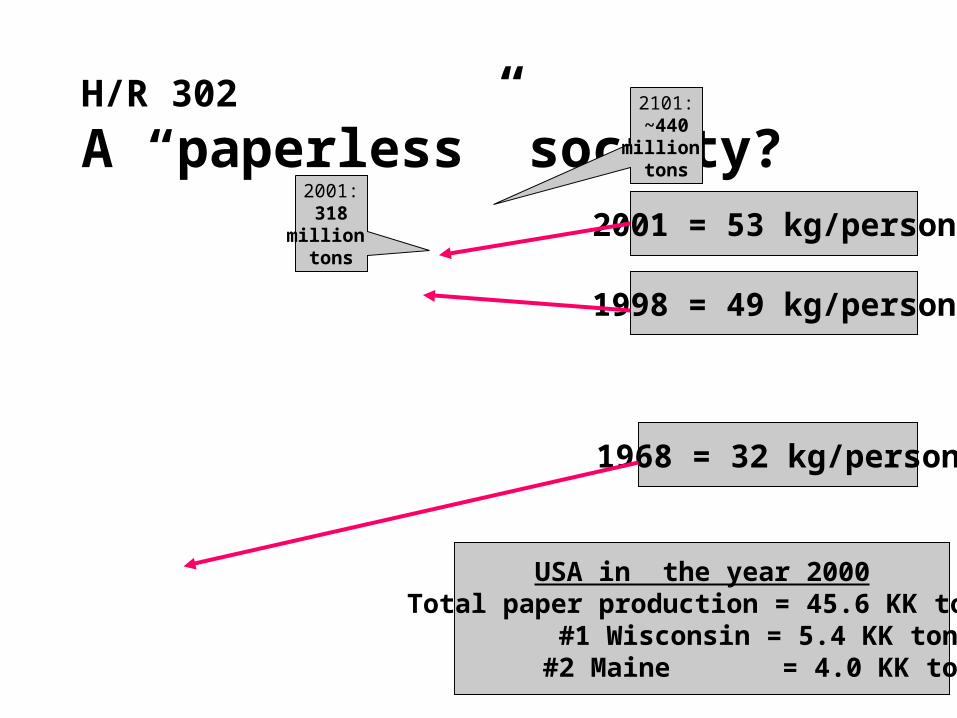
H/R 302
A “paperless” society?
1998 = 49 kg/person
1968 = 32 kg/person
USA in the year 2000Total paper production = 45.6 KK tons
#1 Wisconsin = 5.4 KK tons #2 Maine = 4.0 KK tons
2001 = 53 kg/person2001:318
million tons
2101:~440
million tons
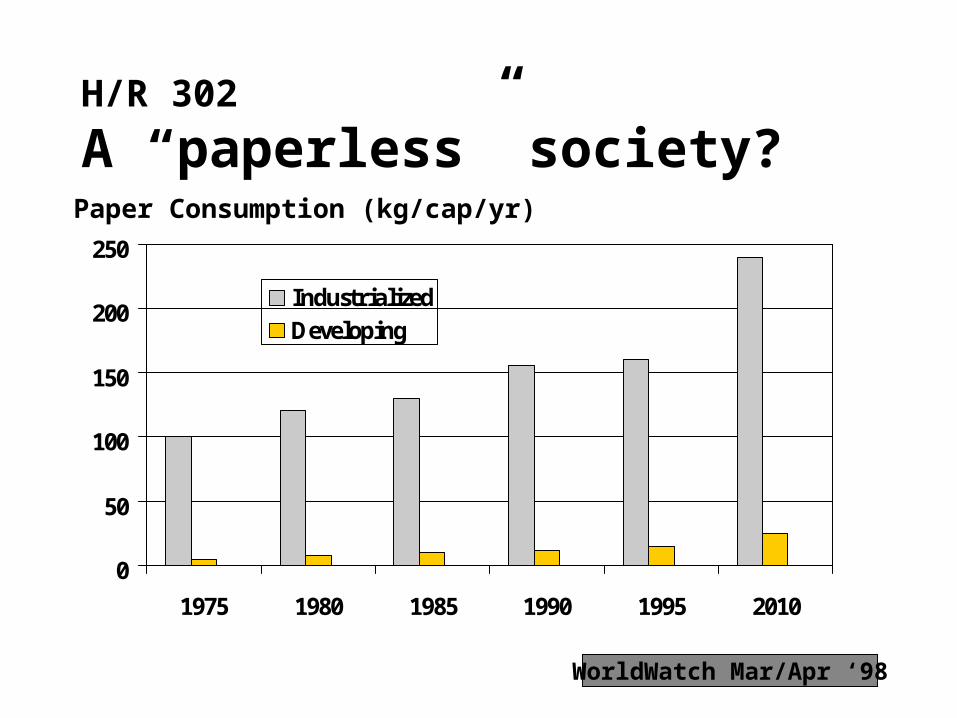
H/R 302
A “paperless” society?
0
50
100
150
200
250
1975 1980 1985 1990 1995 2010
IndustrializedDeveloping
Paper Consumption (kg/cap/yr)
WorldWatch Mar/Apr ‘98
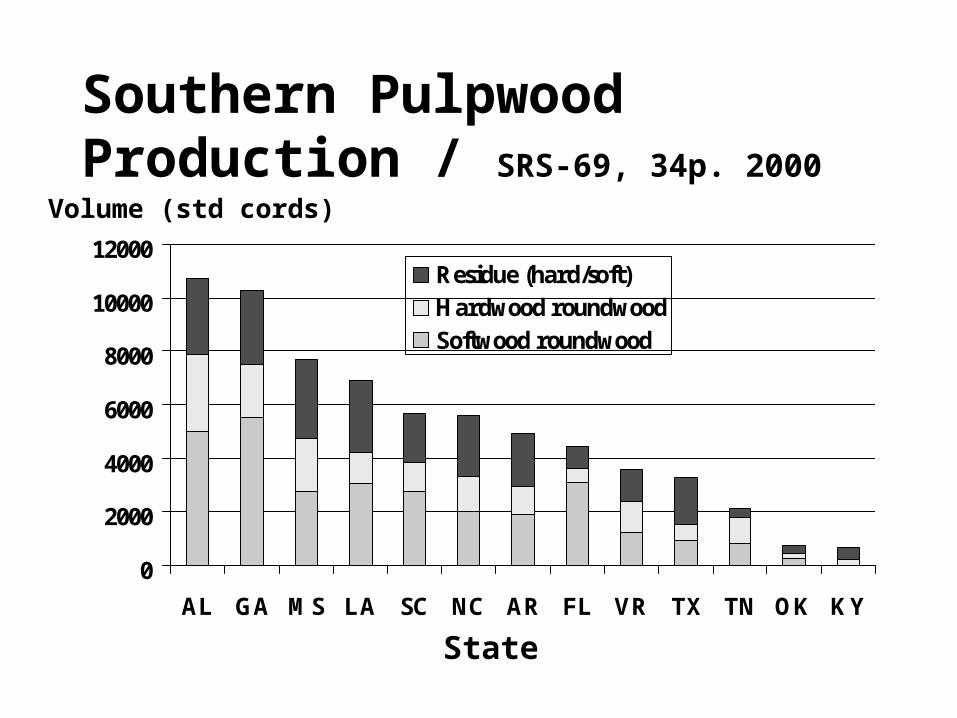
Southern Pulpwood Production / SRS-69, 34p. 2000
0
2000
4000
6000
8000
10000
12000
AL GA MS LA SC NC AR FL VR TX TN OK KY
Residue (hard/soft)Hardwood roundwoodSoftwood roundwood
State
Volume (std cords)
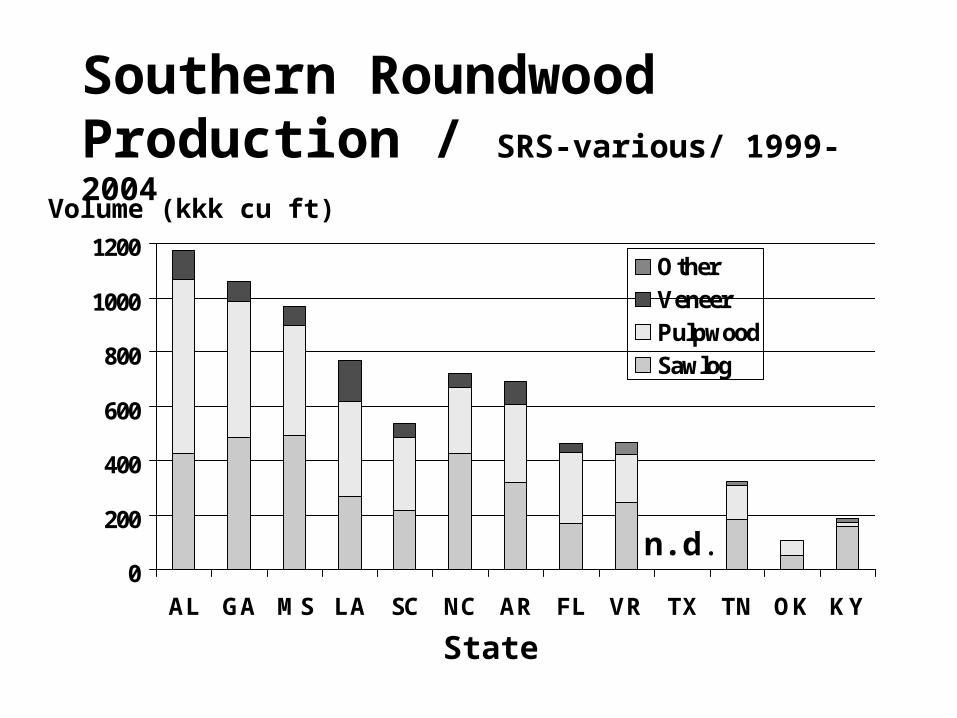
Southern Roundwood Production / SRS-various/ 1999-2004
0
200
400
600
800
1000
1200
AL GA MS LA SC NC AR FL VR TX TN OK KY
OtherVeneerPulpwoodSawlog
State
Volume (kkk cu ft)
n.d.
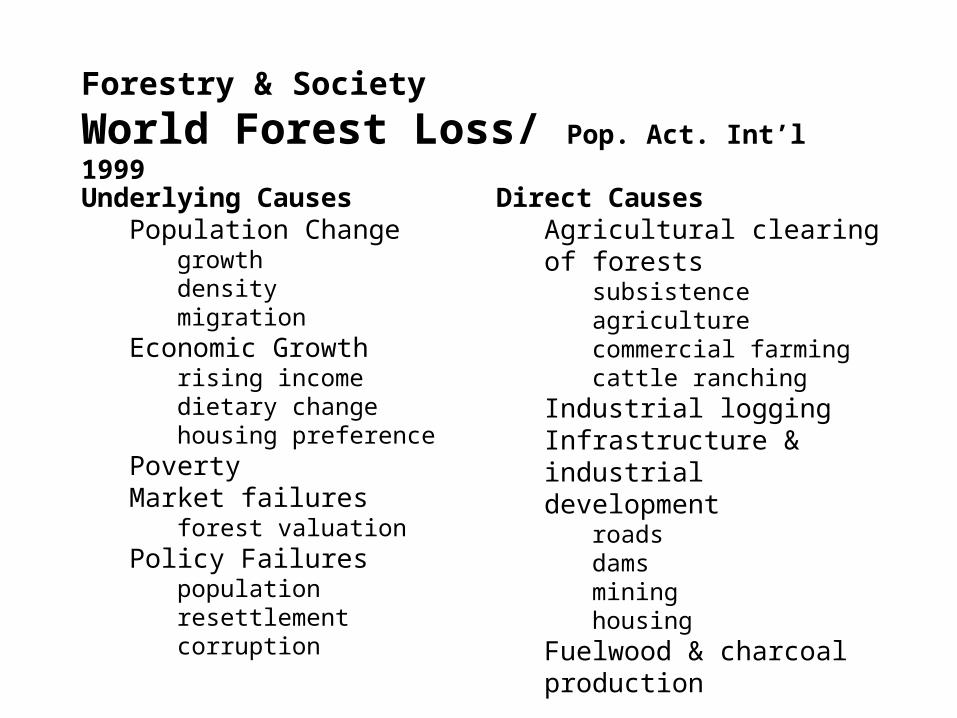
Forestry & Society
World Forest Loss/ Pop. Act. Int’l 1999
Underlying CausesPopulation Change
growthdensitymigration
Economic Growthrising incomedietary changehousing preference
PovertyMarket failures
forest valuationPolicy Failures
population resettlementcorruption
Direct CausesAgricultural clearing of forests
subsistence agriculturecommercial farmingcattle ranching
Industrial loggingInfrastructure & industrial development
roadsdamsmininghousing
Fuelwood & charcoal production
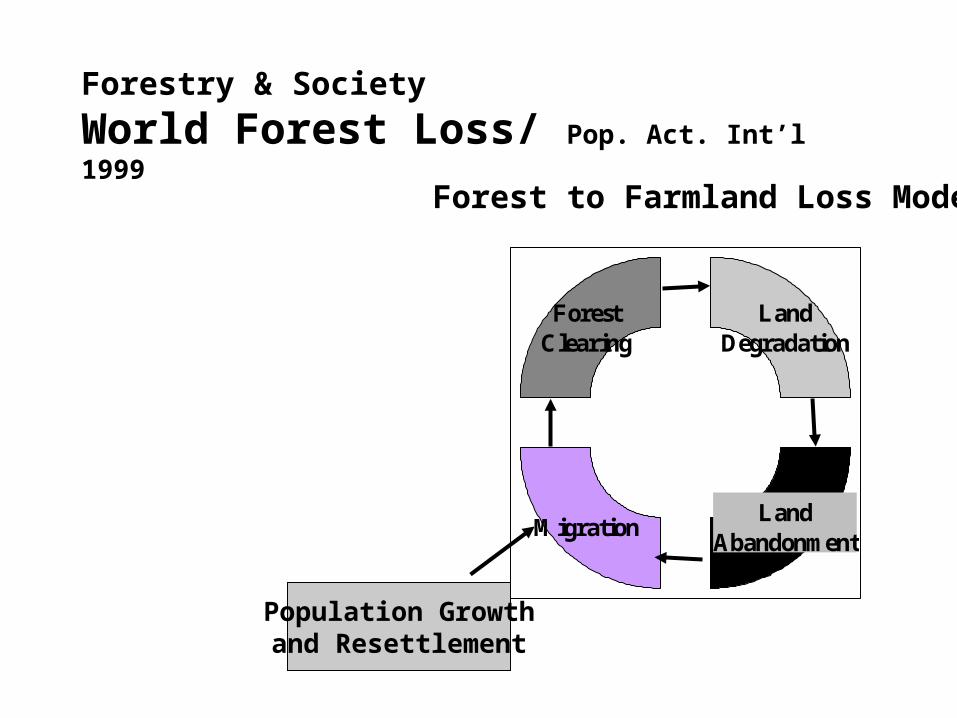
Forestry & Society
World Forest Loss/ Pop. Act. Int’l 1999
Land Degradation
Land Abandonment
Forest Clearing
Migration
Population Growthand Resettlement
Forest to Farmland Loss Model
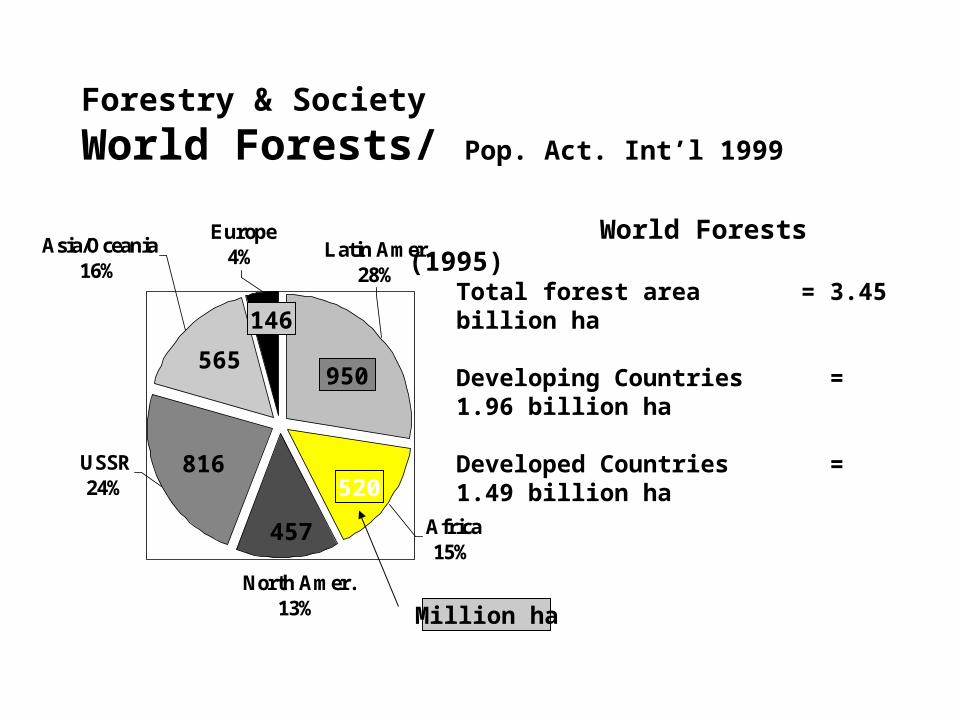
Forestry & Society
World Forests/ Pop. Act. Int’l 1999
North Amer.13%
Europe4%
Africa15%
USSR24%
Asia/Oceania16%
Latin Amer.28%
World Forests (1995)Total forest area = 3.45 billion ha
Developing Countries = 1.96 billion ha
Developed Countries = 1.49 billion ha950
520
457
816
565
146
Million ha
Forestry & Society
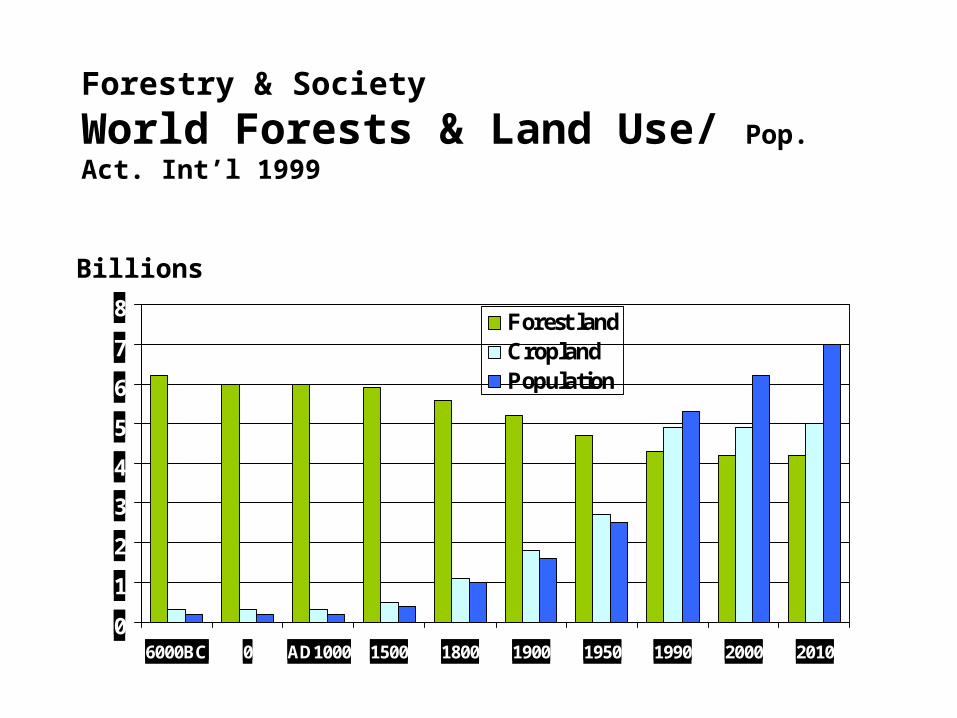
World Forests & Land Use/ Pop. Act. Int’l 1999
0
1
2
3
4
5
6
7
8
6000BC 0 AD1000 1500 1800 1900 1950 1990 2000 2010
Forest landCroplandPopulation
Billions
Forestry & Society
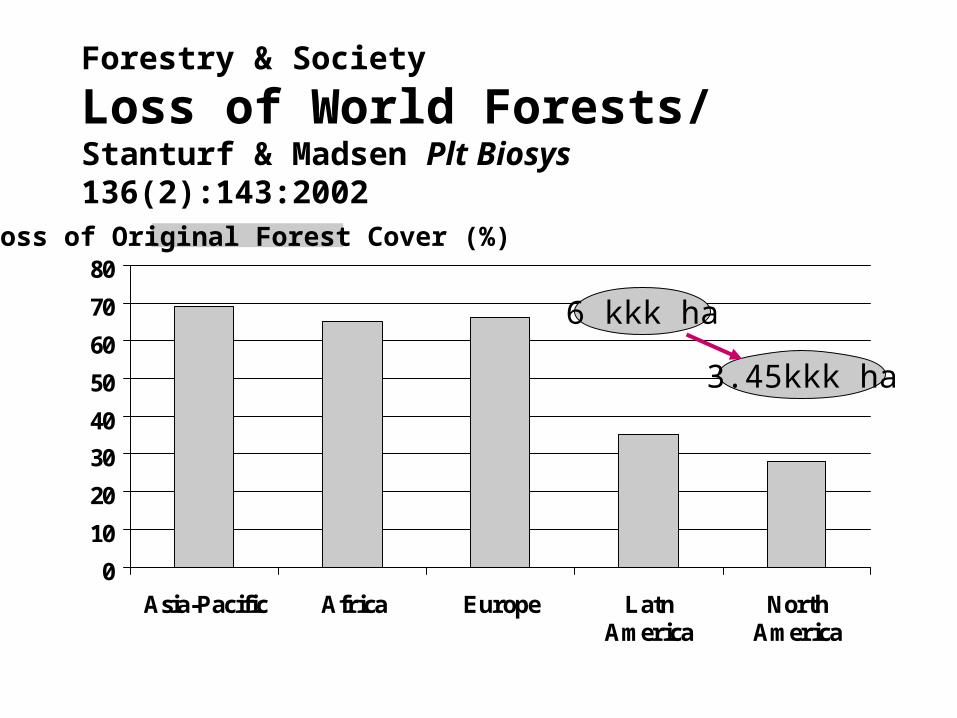
Loss of World Forests/ Stanturf & Madsen Plt Biosys 136(2):143:2002
0
10
20
30
40
50
60
70
80
Asia-Pacific Africa Europe LatnAmerica
NorthAmerica
Loss of Original Forest Cover (%)
6 kkk ha
3.45kkk ha
Forestry & Society
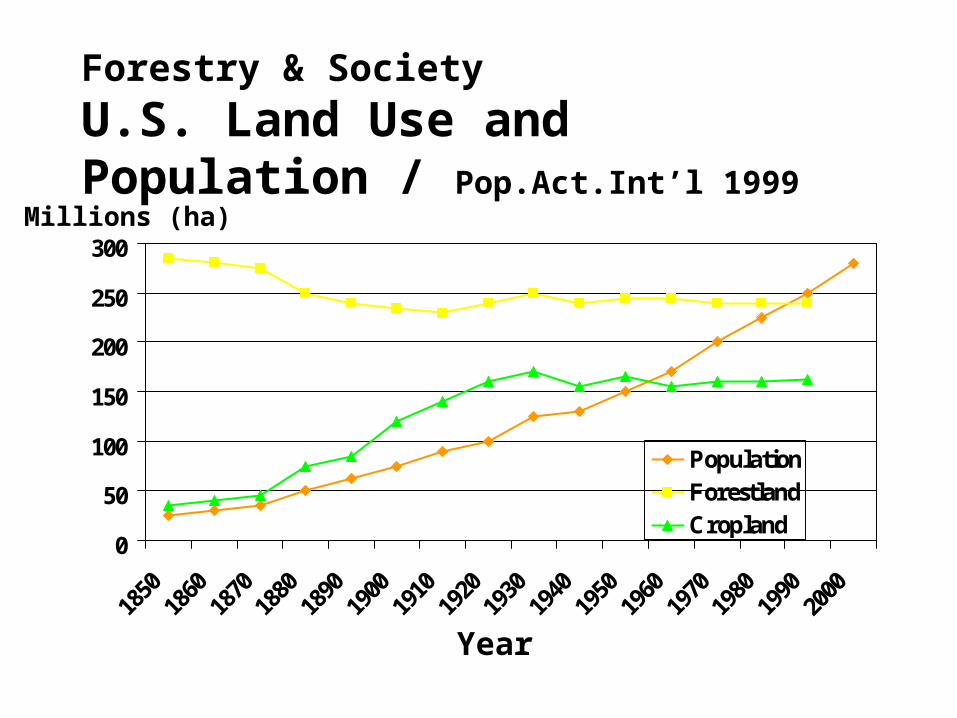
U.S. Land Use and Population / Pop.Act.Int’l 1999
0
50
100
150
200
250
300
PopulationForestlandCropland
Year
Millions (ha)
Forestry and Society
Trees are the Solution!
Most lands have been cutover -- and regenerated
• Europe: 400 years of forestry
• The Americas: the coastlines were cutover during the 1700s and 1800s
Some lands have not recovered:
• Middle east • Easter Island
• Iceland • Chaco Canyon
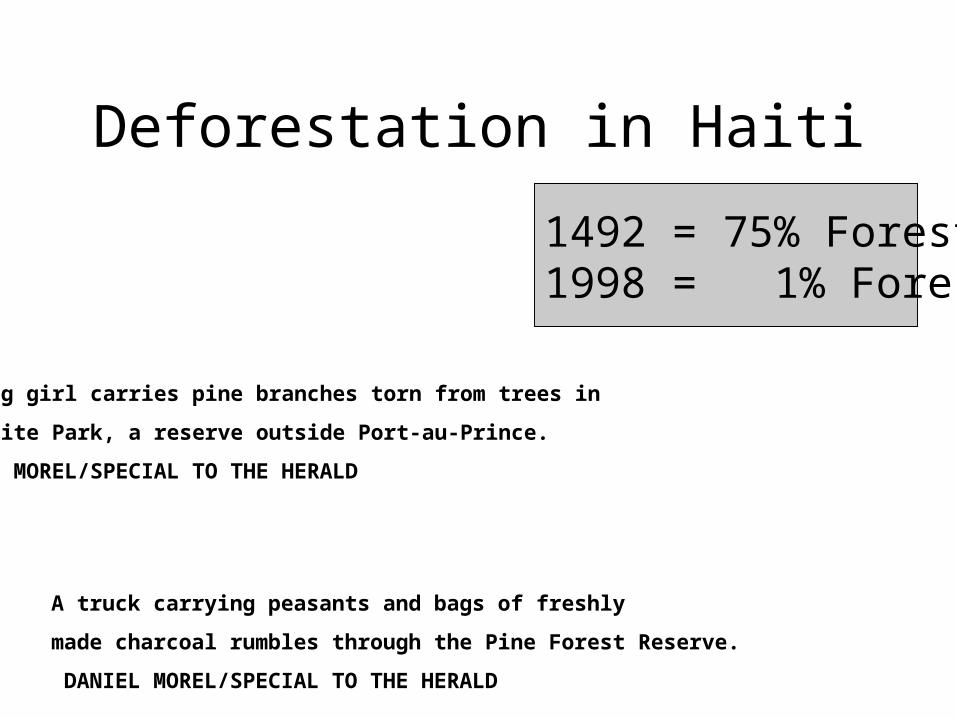
Deforestation in Haiti
A truck carrying peasants and bags of freshly
made charcoal rumbles through the Pine Forest Reserve.
DANIEL MOREL/SPECIAL TO THE HERALD
A young girl carries pine branches torn from trees in
La Visite Park, a reserve outside Port-au-Prince.
DANIEL MOREL/SPECIAL TO THE HERALD
1492 = 75% Forested1998 = 1% Forested
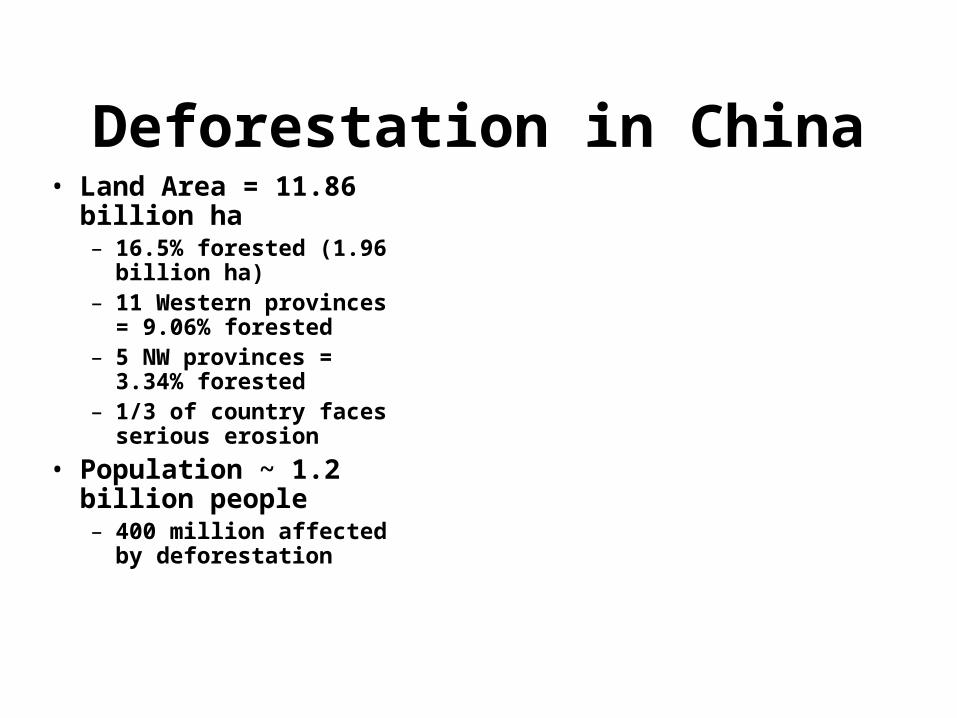
• Land Area = 11.86 billion ha– 16.5% forested (1.96
billion ha)– 11 Western provinces =
9.06% forested– 5 NW provinces = 3.34%
forested– 1/3 of country faces
serious erosion
• Population ~ 1.2 billion people– 400 million affected by
deforestation
Deforestation in China
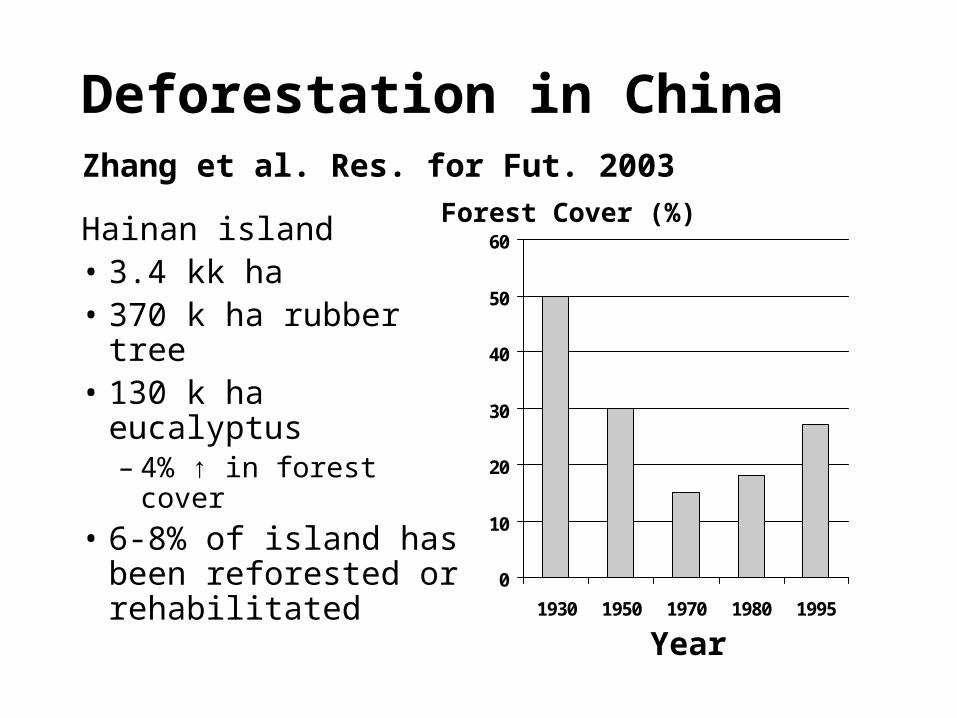
Hainan island• 3.4 kk ha • 370 k ha rubber tree• 130 k ha eucalyptus
– 4% ↑ in forest cover
• 6-8% of island has been reforested or rehabilitated
0
10
20
30
40
50
60
1930 1950 1970 1980 1995
Year
Forest Cover (%)
Deforestation in China Zhang et al. Res. for Fut. 2003
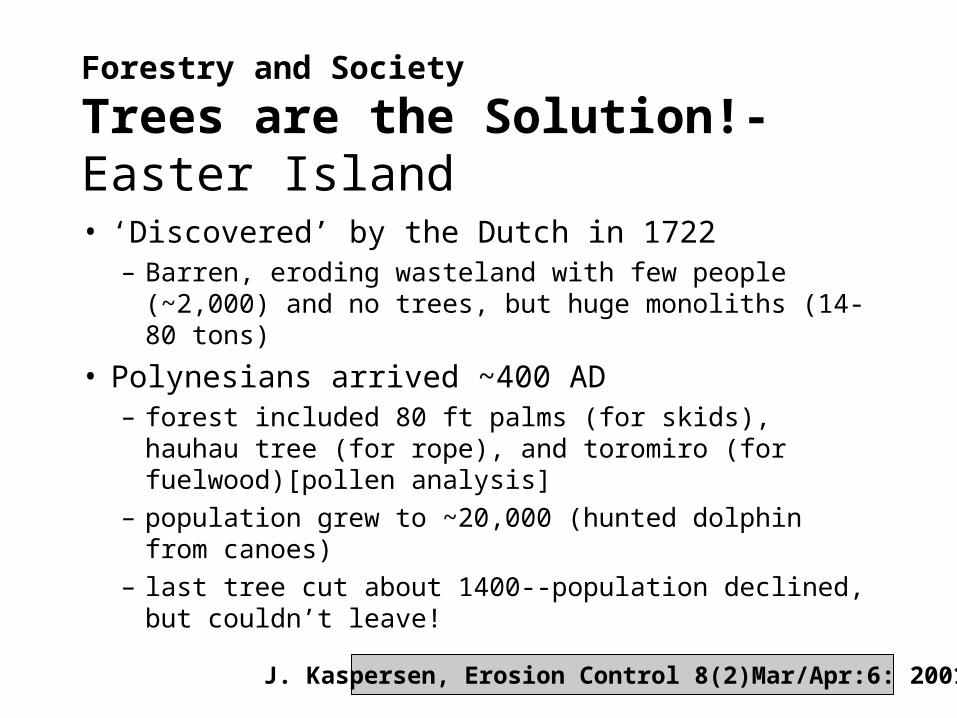
Forestry and Society
Trees are the Solution!- Easter Island
• ‘Discovered’ by the Dutch in 1722– Barren, eroding wasteland with few people (~2,000)
and no trees, but huge monoliths (14-80 tons)
• Polynesians arrived ~400 AD– forest included 80 ft palms (for skids), hauhau tree (for
rope), and toromiro (for fuelwood)[pollen analysis]
– population grew to ~20,000 (hunted dolphin from canoes)
– last tree cut about 1400--population declined, but couldn’t leave!
J. Kaspersen, Erosion Control 8(2)Mar/Apr:6: 2001
Forestry & Society
What is the Problem? Questions:
• How has forest use changed from historic times? What were the uses then and now?
• What products can be derived from trees? From what parts of trees?
• Compare tree usage in the US to world usage. Compare how much wood is used and what general products are made.
• What is deforestation? What is the global impact of deforestation? What are the immediate, short-term impacts of deforestation?

Forestry & Society
What is the Problem? Questions:
• If the world population in 1960 was 3.0 billion and the ‘forest-to-people’ ratio was 1.2 ha/person; and the world population in 1995 was 5.7 billion and the ‘forest-to-people’ ratio was 0.6 ha/person; how much forest land (in hectares [ha]) has been lost worldwide? Where did it go?
• How would you compare the forest situation in the US to world forests? Over the last 70 years? Over the last 150 years?
• What are the problems facing world forests? Where are the problems greatest? Least? Why?