for review only - prince of songkla universityrdo.psu.ac.th/sjstweb/ar-press/60-mar/24.pdffor review...
TRANSCRIPT

For Review O
nly
A Comparison Study on Elasticity of Rubberized Concrete
with and without PET fibre
Journal: Songklanakarin Journal of Science and Technology
Manuscript ID SJST-2016-0267.R1
Manuscript Type: Original Article
Date Submitted by the Author: 26-Jan-2017
Complete List of Authors: Wattanachai, Pitiwat; Chiang Mai University, Civil Engineering Sakulneya, Apidej; Chiang Mai University, Civil Engineering; Chiang Mai University, Civil Engineering
Keyword: Engineering and Industrial Research, Concrete, PET fibre, Crumb rubber, Strain energy
For Proof Read only
Songklanakarin Journal of Science and Technology SJST-2016-0267.R1 Wattanachai

For Review O
nly
Original Article
A Comparison Study on Elasticity of Rubberized Concrete with and without PET
Fibre
Author’s Full Name (Apidej Sakulneya , Pitiwat Wattanachai,*)
Department of Civil Engineering, Chiang Mai University, 239 Huay Kaew Road,
Muang District, Chiang Mai, Thailand, 50200
* Corresponding author, Email address: [email protected]
Abstract
This research intended to study the behaviour of concrete after adding recyclable
wastes in the mixture. According to a number of studies and reports widely publicized
on crumb rubber and PET fibre, both materials were of interest for this study. Based on
a structured mixing of 7 different proportions of crumb rubber up with 2 different
proportions of PET fibre, samples of 108 concrete cylinders were collected for testing
on compressive strength. There were 6 specimens concrete beams for which flexibility
and ductility were tested, and 6 of 2-meter reinforced concrete beams were monitored
on strain contour. As a result, it was found that concrete with recycling materials had
lower compressive strength than that of conventional concrete. Moreover, the finding in
terms of flexibility, energy dissipation, and strain capacity revealed that the adding of
PET fibre and crumb rubber as such had significantly improved the performance of
conventional concrete.
Keywords: Energy dissipation, Rubberized concrete, PET fibre, Image analysis, Strain
contour
Page 3 of 25
For Proof Read only
Songklanakarin Journal of Science and Technology SJST-2016-0267.R1 Wattanachai
123456789101112131415161718192021222324252627282930313233343536373839404142434445464748495051525354555657585960

For Review O
nly
1. Introduction
Thailand, one of the developing countries in Southeast Asia, has countless
industrial factories of tyre and plastic materials. Meanwhile, as her population is
somehow increasing along with ongoing economic development, an increased per capita
consumption of merchandise is concurrently obvious. As a result of modern lifestyle
rapidly changing toward new technology, many of consuming goods made up of such
non-biodegradable as rubber and plastic mostly as packaging, containers, and such like
have been found soaring. Consequently, these materials have finally become residual
substances and triggered numerous problems on locally waste management. Surveyed
data published on 12 January 2015 by Pollution Control Department showed that 77
provinces in Thailand had cumulative wastes of around 14.8 million tons with the
amount of wastes increasing per year bigger than 26.1 million tons. Moreover, only 4.8
million tons accounted for 18.41 percent could actually be recycled as waste utilization
whereas the rest went into various processes of waste disposal i.e. burning, landfills,
placing in waste collecting areas handled by various government bodies concerned. At
present, waste management hindrance in almost every Thai community seems to be an
importantly national agenda. Therefore, research regarding waste utilization on any
relevant topic, to a certain extent, will certainly contribute to tackle this problem.
This research aimed to figure out environmental issue impacted on society with regard
to applying crumb rubber and PET fibre in concrete mixture together with advantages in
engineering.
In this study crumb rubber was used to replace fine aggregate in concrete mixture.
Apparently, an existing research results show that while the rubberized concrete
improves performance of conventional one in hysteresis damping and energy dissipation
Page 4 of 25
For Proof Read only
Songklanakarin Journal of Science and Technology SJST-2016-0267.R1 Wattanachai
123456789101112131415161718192021222324252627282930313233343536373839404142434445464748495051525354555657585960

For Review O
nly
(Hernández et al., 2007; Kaloush et al., 2005; Youssf et al., 2015), significantly, it can
deteriorates mechanical properties such as compressive strength of concrete (Bentayneh
et al., 2008; Siddique et al., 2004). In order to rule such weakness out, this research was
conducted adding recycled PET fibre in rubberized concrete technically to regain some
mechanical and engineering properties of concrete (Fraternali et al., 2011; Foti, 2011;
Kim et al., 2010; Ochi et al., 2007; Pacheco et al., 2012; Pereira-de-Oliveira et al.,
2011). In this study, the comparisons among rubberized concrete, containing PET fibre,
and conventional concrete in a set of mixture were observed using reliable and valid
tools, equipment, and machines. Testing on compressive strength of concrete, flexural
strength of concrete beam, and flexural strength of reinforced concrete beam were also
applied. Relevant data such as modulus of rupture, first crack strength, ductility index,
energy dissipation, strain contour of beam were evaluated in the test.
2. Materials and Methods
2.1. Concrete mix
Concrete mix proportion requirements were shown in Table 1a. A mixed design
for conventional concrete was used as a reference mix design. Water-to-cement ratio
(W/C) of 0.397 was set as a reference in the mix design. Coarse aggregate with
maximum size of 20 mm was used. High range water-reducing concrete and retarding
concrete admixtures at 1500 cc. per 100 kg and 200 cc. per 100 kg of cement weight
were used respectively. The portion of fine aggregate to total aggregate was 43 percent
by volume. The variety of samples and the replacement of crumb rubber and PET fibre
were shown in Table 1b.
Page 5 of 25
For Proof Read only
Songklanakarin Journal of Science and Technology SJST-2016-0267.R1 Wattanachai
123456789101112131415161718192021222324252627282930313233343536373839404142434445464748495051525354555657585960
For Review O
nly
2.2. Recycled PET fibre
PET fibre is recycled material which is produced by Esterification process, Pre-
polymerization process and Polymerization process. PET fibre used in this experiment
was derived from recycled drinking water bottles in pieces, each with the cut size of 3 to
5 millimeter wide and 35 to 50 millimeter long.
2.3. Crumb rubber
Crumb rubber particles in this experiment were recycled from vehicle tyres with
the size ranging from 10 mesh to 30 mesh which means 10 holes and 30 holes in per
square inch respectively.
2.4. Preparation of concrete samplings
2.4.1. First series of experiments
The first series of experiment is as follows;
(1) Concrete mix design for the reference concrete was provided. At day 7th
compressive strength must be higher than 325 kg/cm^2 cube molded or equivalent to
275 kg/cm^2 cylinder molded because it is the minimum requirement of compressive
strength for rigid pavement of Department of Highways Thailand. (Department of
Highways, 2001)
(2) Cylinder samplings of conventional concrete and rubberized concrete ranging
from 2 to 100 percent of crumb rubber and 1 percent of PET fibre were collected.
Page 6 of 25
For Proof Read only
Songklanakarin Journal of Science and Technology SJST-2016-0267.R1 Wattanachai
123456789101112131415161718192021222324252627282930313233343536373839404142434445464748495051525354555657585960
For Review O
nly
(3) Selecting the replacing proportion of rubber quantity that provided appropriately
compressive strength and then varied the amount of PET fibre between 0.5 and 1
percent in rubberized concrete.
2.4.2. Second series of experiments
The experiments following the first series comprised;
(1) Selecting one of the maximum replacements from previous step that exceeded
the requirement of compressive strength appeared in the first experiment.
(2) Casting a specimen of plain concrete, rubberized concrete, and rubberized
concrete with PET fibre as indicated in Table 2.
2.5 Testing method
2.5.1. ASTM C31 Standard Practice for Making and Curing Concrete Test Specimens in
the Field.
2.5.2. ASTM C39 Standard Test Method for Compressive Strength of Cylindrical
Concrete Specimens.
2.5.3. ASTM C78 Standard Test Method for Flexural Strength of Concrete (Using
Simple Beam with Third Point Loading)
2.5.4. ASTM C192 Standard Practice for Making and Curing Concrete Test Specimens
in the Laboratory.
2.5.5. Flexural strength of reinforced Concrete Beam with Fourth Point Loading as
mentioned in 3.3 is indicated in Fig. 1.
2.5.6. Image analysis method
To determine strain contour by Image Analysis method, there were some procedures to
follow as listed below.
Page 7 of 25
For Proof Read only
Songklanakarin Journal of Science and Technology SJST-2016-0267.R1 Wattanachai
123456789101112131415161718192021222324252627282930313233343536373839404142434445464748495051525354555657585960

For Review O
nly
(1) DSLR camera specification should be equivalent to Canon 5D mark II or higher.
Also, remote shutter should be available.
(2) Distance between reinforced concrete beam and the camera is not greater than 1
meter.
(3) Reference nodes on reinforced concrete beam must be assembled as shown in
Figure 2. Distance between each node should not exceed 20 millimeter.
(4) Strain contour was analyzed by programming in MATLAB.
3. Results and Discussion
3.1. Compressive strength
Compressive strength after day 3, 7, and 28 of cylindrical specimens with a
diameter of 100 millimetres were investigated.
Table 3 showed the results of compression test on 12 different proportions of
specimens. A comparative chart in Figure 3 suggested that applicable value of crumb
rubber should not exceed 8 percent to meet the requirement.
3.2. Flexural strength and energy dissipation of prismatic concrete beam.
After 28 curing days, three point bending tests were observed on 100×100×500
mm prismatic beams based on ASTM C78. Three different mix proportions were used
in this test whereas two specimens of each CC, R8, and P1R8 were casted. A load on
the specimens was done by universal testing machine and the deflection at the mid span
of the beam was measured by dial indicator.
As a result of the test, the relationship between load and deflection of prismatic
Page 8 of 25
For Proof Read only
Songklanakarin Journal of Science and Technology SJST-2016-0267.R1 Wattanachai
123456789101112131415161718192021222324252627282930313233343536373839404142434445464748495051525354555657585960

For Review O
nly
beam was presented in Figure 4. A maximum load of each sample was illustrated in
Table 4. Flexural strength of P1R8 was 22.13 % and 24.71 % higher than those of R8
and CC, respectively. Moreover, it was observed that when the load reached its peak
level, R8 was consequently unable to bear the load and suddenly collapsed with lower
maximum deflection than did CC. Compared to P1R8, it performed outstandingly with
strain energy capacity to handle the load after ultimate strength reached. Also, it had the
highest energy dissipation when compared to others.
3.3. Flexural strength, ductility index, energy dissipation, and strain analysis of
reinforced concrete beam
The details and dimension of reinforced concrete specimens were depicted in
Figure 1. Figure 5 demonstrated the experimental set-up for reinforced concrete beam
with image analysis.
Six samples of reinforced concrete beam were evaluated after 28 days from
casted. The samples with hinge-roller support were tested by load on proving ring with
a maximum load capacity of 40000 Kg. Strain gauge attached on the beam could be
seem in Figure 6. Three of Liner Variable Differential Transducer (LVDT) were
installed at the middle of the beam and the support position as appeared in Figure 5.
Crack inspection was monitored by DSLR camera during testing and crack patterns
were captured.
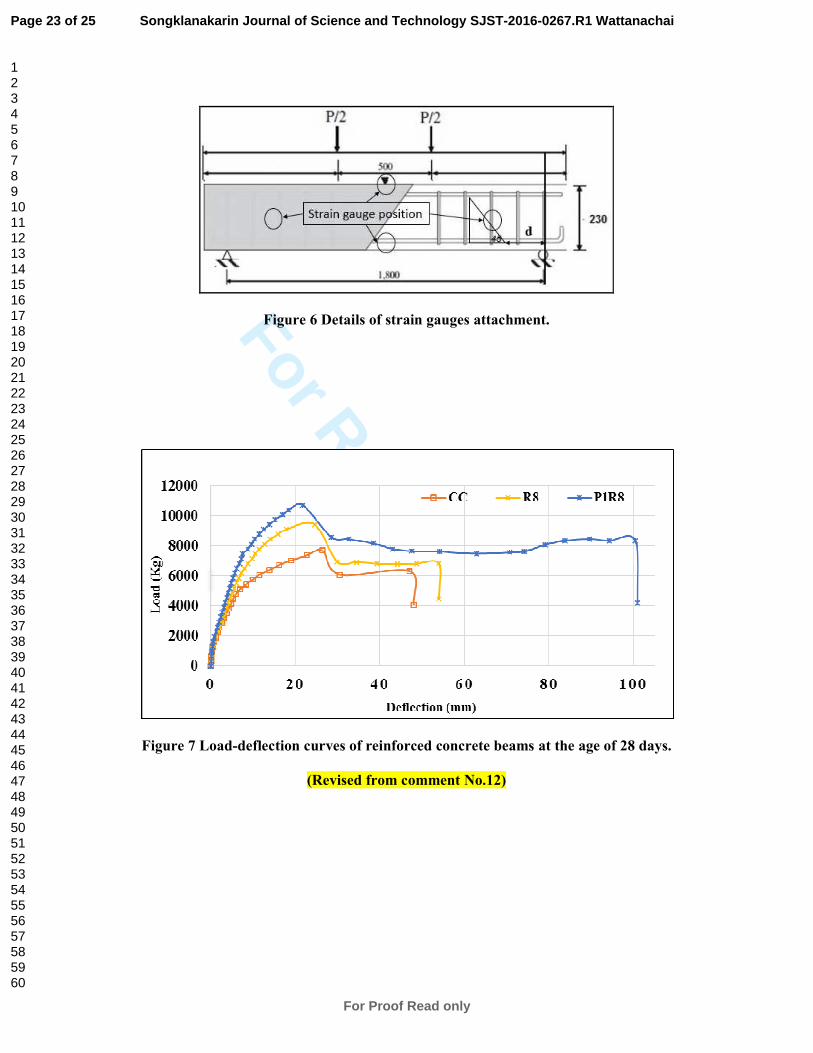
3.3.1. Load-deflection results
The relationships between load and deflection of reinforced concrete beams
were shown in Figure 7. It appeared that mechanical behaviour of all samples was
similar. However, CC began to crack, yield and rupture at lower load compared to R8
Page 9 of 25
For Proof Read only
Songklanakarin Journal of Science and Technology SJST-2016-0267.R1 Wattanachai
123456789101112131415161718192021222324252627282930313233343536373839404142434445464748495051525354555657585960

For Review O
nly
and P1R8 as indicated in Table 5 because it was able to dissipate energy less than R8
and P1R8 since in each load, the critical strain on CC was higher than the others as
shown in Figure 8 and Figure 9. Which means that at the same load, there was more
stress on critical point of CC than R8 and P1R8. Therefore, CC would begin to crack,
yield and rupture earlier than R8 and P1R8.
3.3.2. Energy dissipation results
Area under load-deflection curve was used to determine energy dissipation of
reinforced beam. The results in Table 6 showed that P1R8 dissipated higher energy
compared to CC and R8 by 285 and 211 percentages respectively.
3.3.3. Image analysis results
Strain contours at identical load were analysed by numerical approach and
shown in Figure 8. Also, a relationship between strain and applied load was plotted in
Figure 9. It showed that R8 and P1R8 both had the lowest compressive strain and tensile
strain respectively at vulnerable area of the beam. This means, at the same compressive
and tensile strains, R8 and P1R8 were capable to restrain higher load than CC since,
under the circumstances, rubber dissipates energy from compression and PET relieves
energy from tension.
4. Conclusions
This research was aimed to find out the advantages and disadvantages from
selecting PET fibre and crumb rubber as supplementary materials in structural concrete.
The experimental results in the study of PET fibre and crumb rubber in reinforced
concrete were shown and summarized as follows:
Page 10 of 25
For Proof Read only
Songklanakarin Journal of Science and Technology SJST-2016-0267.R1 Wattanachai
123456789101112131415161718192021222324252627282930313233343536373839404142434445464748495051525354555657585960

For Review O
nly
(1) With lower elastic modulus, P1R8 and R8 showed a reduction in compressive
strength by approximately 6% and 12% compared with CC.
(2) In terms of flexural strength of prismatic beam, P1R8 and R8 were increased by
24.7% and 2.1% relative to CC. Apart from that, energy dissipation of prismatic beam
calculated by area under load-deflection curves was noticeably improved with increased
values of 253% and 58%.
(3) Regarding the analysis on reinforced concrete beam, considerable evidences
were found. At the initial stage of loading, cracks formed in CC were ahead R8 and
P1R8 with lower deflection. Following that CC was yielded and collapsed preceding R8
and P1R8.
(4) From image and strain analysis on reinforced concrete beam with the same load
at middle of the beam, R8 has produced the lowest compressive strain as crumb rubber
was able to dissipated energy from compression. While P1R8 has had the lowest tensile
strain resulted from its ability to absorb PET fibre energy from tension, it delayed
cracks and failure of the specimens. As a result, ultimate loads of P1R8 and R8 were
increased from CC by 39.52 % and 22.61 % respectively.
(5) Sometimes, the compressive strength of rubberized concrete does not fix the
same pattern as conventional concrete. The result in Figure 3 showed that the
compressive strength of P1R4 was lower than P1R8. Which could be possible since
there was a claim that “rubberized concrete is unpredictable, failure stress strain
relationship does not follow a fixed pattern in experiments at same point” (Issa et al.,
2013).
Page 11 of 25
For Proof Read only
Songklanakarin Journal of Science and Technology SJST-2016-0267.R1 Wattanachai
123456789101112131415161718192021222324252627282930313233343536373839404142434445464748495051525354555657585960

For Review O
nly
Acknowledgments
The authors appreciate a valuable support from Dr. K. Patanukhom who help us
on numerical approach for image analysis. Also, the writers admiringly acknowledge
staffs in the Laboratory of Civil Engineering Chiang Mai University.
References
Batayneh, M.K., Marie, I., and Asi, I. 2008. Promoting the use of crumb rubber concrete
in developing countries. Waste Management. 28, 2171–2176.
Department of Highways. 2001, Standard No. DHS-309/2544, 1-21
Foti, D. 2011. Preliminary analysis of concrete reinforced with waste bottles PET fibers.
Construction and Building Materials. 25, 1906–1915.
Fraternali, F., Ciancia, V., Chechile, R., Rizzano, G., Feo, L., and Incarnato, L. 2011.
Experimental study of the thermo-mechanical properties of recycled PET fiber-
reinforced concrete. Composite Structures. 93, 2368–2374.
Hernández, O.F., Barluenga, G., Parga-Landa, B., Bollati, M., and Witoszek, B. 2007.
Fatigue behaviour of recycled tyre rubber-filled concrete and its implications in
the design of rigid pavements. Construction and Building Materials. 21, 1918–
1927.
Issa, C.A., and Salem, G. 2013. Utilization of recycled crumb rubber as fine aggregates
in concrete mix design. Construction and Building Materials. 42, 48-52.
Page 12 of 25
For Proof Read only
Songklanakarin Journal of Science and Technology SJST-2016-0267.R1 Wattanachai
123456789101112131415161718192021222324252627282930313233343536373839404142434445464748495051525354555657585960

For Review O
nly
Kaloush, K.E., and Way, G.B. 2005. Properties of Crumb Rubber Concrete.
Presentation and Publication at the 2005 Annual Meeting of the Transportation
Research Board.
Kim, S.B., Yi, N.H., Kim, H.Y., Kim, J.J., and Song, Y. 2010. Material and structural
performance evaluation of recycled PET fiber reinforced concrete. Cement &
Concrete Composites. 32, 232–240.
Ochi, T., Okubo, S., and Fukui, K. 2007. Development of recycled PET fiber and its
application as concrete-reinforcing fiber. Cement & Concrete Composites. 29, 448–455.
Pacheco, T.F., Ding, Y., and Jalali, S. 2012. Properties and durability of concrete
containing polymeric wastes (tyre rubber and polyethylene terephthalate
bottles): An overview. Construction and Building Materials. 30, 714–724.
Pereira-de-Oliveira, L.A., and Castro-Gomes, J.P. 2011. Physical and mechanical
behaviour of recycled PET fibre reinforced mortar. Construction and Building
Materials. 25, 1712–1717.
Siddique, R. 2004. Properties of concrete containing scrap-tire rubber – an overview.
Waste Management. 24, 563–569.
Youssf, O., ElGawady, M., and Mills, J. 2015. Experimental Investigation of Crumb
Rubber Concrete Columns under Seismic Loading. Structures. 3, 13–27.
Page 13 of 25
For Proof Read only
Songklanakarin Journal of Science and Technology SJST-2016-0267.R1 Wattanachai
123456789101112131415161718192021222324252627282930313233343536373839404142434445464748495051525354555657585960

For Review O
nly
Concrete Mix Requirements
W/C 0.397
Maximum
size of
aggregate
20 mm (3/4")
S/A 43%
Portland
Cement Type 3
Admixture
Superplasticizer 1500
ml / 100 kg of cement
Retarder 200 ml / 100
kg of cement
Table 1a. Concrete mix proportion requirements.
Page 14 of 25
For Proof Read only
Songklanakarin Journal of Science and Technology SJST-2016-0267.R1 Wattanachai
123456789101112131415161718192021222324252627282930313233343536373839404142434445464748495051525354555657585960

For Review O
nly
Mix proportion of concrete
Specimens
Replacement of recyclable material (%)
Recycled PET (by
volume of
concrete)
Crumb Rubber (by
volume of fine
aggregate)
CC - -
P1R100 1 100
P1R75 1 75
P1R50 1 50
P1R25 1 25
P1R8 1 8
P1R4 1 4
P1R2 1 2
P0.5R8 0.5 8
P0.5R4 0.5 4
P0.5R2 0.5 2
R8 - 8
Table 1b. Mix proportion of concrete.
Page 15 of 25
For Proof Read only
Songklanakarin Journal of Science and Technology SJST-2016-0267.R1 Wattanachai
123456789101112131415161718192021222324252627282930313233343536373839404142434445464748495051525354555657585960

For Review O
nly
Design of Experiment (No. of sample)
Mix/Test
Flexural test on
prismatic
concrete beam
Flexural test on
reinforced
concrete beam
CC 2 2
R8 2 2
P1R8 2 2
Table 2 Specimens in second series of experiments.
Page 16 of 25
For Proof Read only
Songklanakarin Journal of Science and Technology SJST-2016-0267.R1 Wattanachai
123456789101112131415161718192021222324252627282930313233343536373839404142434445464748495051525354555657585960

For Review O
nly
CODE
Compressive Strength (Ksc.)
3 days Compressive strength 7 days Compressive strength 28 days Compressive strength
1 2 3 Average SD 1 2 3 Average SD 1 2 3 Average SD
CC 377 328 336 347 26.42 364 306 432 367 63.27 402 466 443 437 32.54
P0.5R2 324 389 311 342 41.79 370 435 454 420 44.17 454 409 467 443 30.67
P1R2 0 350 324 337 18.36 376 428 467 424 45.58 428 428 422 426 3.75
P0.5R4 428 311 324 355 64.02 363 396 389 383 17.17 350 461 389 400 55.95
P1R4 279 305 266 283 19.83 324 344 305 324 19.47 318 357 363 346 24.57
P0.5R8 0 260 260 260 0.00 337 350 363 350 12.98 344 422 383 383 38.94
P1R8 324 357 299 327 29.26 350 350 324 342 14.99 415 376 441 411 32.66
R8 264 257 226 249 19.97 270 355 311 312 42.46 351 405 396 384 28.84
P1R25 234 247 257 246 11.71 266 247 266 260 11.24 273 286 247 268 19.83
P1R50 136 71 65 91 39.47 110 97 71 93 19.83 110 110 87 103 13.49
P1R75 45 53 53 51 4.50 64 64 62 63 0.75 74 65 65 68 5.25
P1R100 19 19 26 22 3.75 31 25 30 29 3.43 32 36 26 32 5.25
Table 3 The results of compression test.
Page 17 of 25
For Proof Read only
Songklanakarin Journal of Science and Technology SJST-2016-0267.R1 Wattanachai
123456789101112131415161718192021222324252627282930313233343536373839404142434445464748495051525354555657585960

For Review O
nly
Specimen CC1 CC2 R8/1 R8/2 P1R8/1 P1R8/2
Load (kg)
780 835 864 785 992 1022
807.5 824.5 1007
Table 4 Flexural strength of prismatic beam. (Revised from comment No.16 of
reviewer 1 and No.5 of reviewer 2)
Specimens
Compressive
Strength at 28
days (Ksc)
Pcr
(Kg)
∆cr
(mm) Py (Kg)
∆y
(mm) Pu (Kg) ∆u (mm)
CC 437 960 0.27 4800 6.00 7680 26.39
R8 384 1948 0.52 6169 7.19 9417 25.37
P1R8 411 2273 1.31 6169 5.65 10716 21.77
Table 5 Flexural strength test results of reinforced beam. (Revised from comment
No.16 of reviewer 1 and No.4 of reviewer 2)
Specimens Pu/Pu
(%)
Ductility
index
(∆u/∆y)
Energy
dissipation
(Kg m)
CC 100% 4.40 282.36
R8 123% 3.53 381.24
P1R8 140% 3.85 804.28
Table 6 Ductility index and energy dissipation of reinforced beam. (Revised from
comment No.16 of reviewer 1 and No.4 of reviewer 2)
Page 18 of 25
For Proof Read only
Songklanakarin Journal of Science and Technology SJST-2016-0267.R1 Wattanachai
123456789101112131415161718192021222324252627282930313233343536373839404142434445464748495051525354555657585960

For Review O
nly
Figure 1 Detail of reinforced concrete specimens.
Figure 2 Node assembly demonstration.
Figure 3 Compressive strength of concrete with 1% volume fraction of PET fibre.
Figure 4 Load-deflection of prismatic concrete beams
Figure 5 Experimental set-up for reinforced concrete beam.
Figure 6 Details of strain gauges attachment.
Figure 7 Load-deflection curves of reinforced concrete beams at the age of 28 days.
Figure 8 Strain contour of reinforced concrete beams while loading.
Figure 9 Relationship between strain and load of samples.
Figure 1 Detail of reinforced concrete specimens.
Page 19 of 25
For Proof Read only
Songklanakarin Journal of Science and Technology SJST-2016-0267.R1 Wattanachai
123456789101112131415161718192021222324252627282930313233343536373839404142434445464748495051525354555657585960

For Review O
nly
Figure 2 Node assembly demonstration.
Page 20 of 25
For Proof Read only
Songklanakarin Journal of Science and Technology SJST-2016-0267.R1 Wattanachai
123456789101112131415161718192021222324252627282930313233343536373839404142434445464748495051525354555657585960

For Review O
nly
Figure 3 Compressive strength of concrete with 1% volume fraction of PET fibre.
(Revised by cut out the title inside (comment No.9))
Page 21 of 25
For Proof Read only
Songklanakarin Journal of Science and Technology SJST-2016-0267.R1 Wattanachai
123456789101112131415161718192021222324252627282930313233343536373839404142434445464748495051525354555657585960

For Review O
nly
Figure 4 Load-deflection of prismatic concrete beams (Revised by cut out the title
inside and included the unit on the axis (comment No.10))
Figure 5 Experimental set-up for reinforced concrete beam.
Page 22 of 25
For Proof Read only
Songklanakarin Journal of Science and Technology SJST-2016-0267.R1 Wattanachai
123456789101112131415161718192021222324252627282930313233343536373839404142434445464748495051525354555657585960
For Review O
nly
Figure 6 Details of strain gauges attachment.
Figure 7 Load-deflection curves of reinforced concrete beams at the age of 28 days.
(Revised from comment No.12)
Page 23 of 25
For Proof Read only
Songklanakarin Journal of Science and Technology SJST-2016-0267.R1 Wattanachai
123456789101112131415161718192021222324252627282930313233343536373839404142434445464748495051525354555657585960

For Review O
nly
Figure 8 Strain contour of reinforced concrete beams while loading. (Revised from
comment No. 13)
Figure 9 Relationship between strain and load of samples. (Revised from comment
No. 14 of reviewer 1 and No.6 and 7 of reviewer 2)
Page 24 of 25
For Proof Read only
Songklanakarin Journal of Science and Technology SJST-2016-0267.R1 Wattanachai
123456789101112131415161718192021222324252627282930313233343536373839404142434445464748495051525354555657585960
For Review O
nly
Page 25 of 25
For Proof Read only
Songklanakarin Journal of Science and Technology SJST-2016-0267.R1 Wattanachai
123456789101112131415161718192021222324252627282930313233343536373839404142434445464748495051525354555657585960