for review only - prince of songkla universityrdo.psu.ac.th/sjstweb/ar-press/59-dec/4.pdf · for...
TRANSCRIPT
For Review O
nly
Silica Gel Derived from Palm Oil Mill Fly Ash
Journal: Songklanakarin Journal of Science and Technology
Manuscript ID SJST-2016-0170.R2
Manuscript Type: Original Article
Date Submitted by the Author: 01-Nov-2016
Complete List of Authors: Utama, Panca; Universitas Riau, Chemical Engineering; Prince of Songkla University, Chemical Engineering Yamsaengsung, Ram; Prince of Songkla University, Department of Chemical Engineering, Faculty of Engineering Sangwichien, Chayanoot; Prince of Songkla University, Chemical Engineering, Faculty of Engineering
Keyword: Engineering and Industrial Research
For Proof Read only
Songklanakarin Journal of Science and Technology SJST-2016-0170.R2 Utama
For Review O
nly
Original Article
Silica Gel Derived from Palm Oil Mill Fly Ash
Panca Setia Utama1, Ram Yamsaensung*
2, Chayanoot Sangwichien
2
1Chemical Engineering Department, Faculty of Engineering, Universitas Riau,
Pekanbaru, 28294, Indonesia
2Chemical Engineering Department, Faculty of Engineering, Prince of Songkla
University, 90112, Hatyai, Thailand
* Email address: [email protected]
Abstract
Agro-wastes, especially ash containing silica, are promising sources of silica for
synthetic amorphous silica production. In this research, Palm Oil Mill Fly Ash
(POMFA) was used as a raw material for silica gel production. The Response Surface
Method-Central Composite Design (RSM-CCD) was applied to study and to optimize
the temperature and stirring speed for silica extraction from POMFA using sodium
hydroxide solvent. The filtrates were analyzed using Inductively Plasma Optical
Emission Spectroscopy (ICP-OES) to measure their silica content. At the optimum
condition, 60.42 ± 0.83% of the silica can be extracted from the POMFA. The extract
silica was acidified using 10% (v/v) H2SO4 to form silica gel. The chemical
composition, the phases and the micrograph of silica gel product are similar to the
commercial silica gel.
Keywords: Extraction; Optimization; Palm Oil Mill Fly Ash; Response Surface
Methods; Silica gel
Page 3 of 22
For Proof Read only
Songklanakarin Journal of Science and Technology SJST-2016-0170.R2 Utama
123456789101112131415161718192021222324252627282930313233343536373839404142434445464748495051525354555657585960

For Review O
nly
1. Introduction
Synthetic Amorphous Silica (SAS), including silica gel, precipitated silica and
silica fume, is a highly versatile product because of its inherent properties and the
flexible manufacturing process. A wide variety of grades with a range of physical
properties of SAS can be produced. The characteristics of SAS which allow for its wide
use in chemical industries are good flowability, unique surface structure, and high
adsorptive characteristic. For example, precipitated silica is used as filler in rubber and
plastic industry to improve tensile strength, hardness, tear strength, and abrasion
resistance. The precipitated silica can also be used as a rheological agent and a thickener
for controlling the flow properties of products, such as paint and coating, tooth paste,
cosmetic creams, and lotion. The silica fume is used in electronic industry for chemical
mechanical wafer polishing (Sampat, 2008). The silica gel can be applied as an
absorbent, a desiccant, a catalyst, and a catalyst support (Prasad and Pandey, 2012). The
high temperature fusion for melting the silica sand and soda ash and the high
temperature digestion for dissolving the sodium silicate in the commercial process of
making the SAS use a huge amount of energy, which is expensive. In addition, the SAS
produced contains metal impurities, which are found in the earth in the amount ranging
from 400 to 10,000 ppm (Stephens et al., 2002). In order to search for a cost-effective
and eco-friendly process, many studies have been conducted regarding this issue. The
agro-waste, especially ash containing silica as the source for silica production, is
promising. One of the advantages is that the process involves fewer steps since each
plant species has a constant chemical composition, and the final product contains only a
narrow range of metal oxide impurities (Zemnukhova et al., 2006). However, until now
the studies focused on rice hull ash (Rozainee et al., 2008; Sousa et al., 2009; Lima et
Page 4 of 22
For Proof Read only
Songklanakarin Journal of Science and Technology SJST-2016-0170.R2 Utama
123456789101112131415161718192021222324252627282930313233343536373839404142434445464748495051525354555657585960
For Review O
nly
al., 2011), sugar cane bagasse ash (Affandi et al., 2009), and corn cob ash (Shim et al.,
2015) as the silica sources.
One of the agro-wastes containing silica, which is abundant in Indonesia,
Malaysia, and Thailand, is palm oil ash. In 2014 the estimated palm oil production in
those countries was 54,800 million tons or almost 89% of the world palm oil production
(Indexmundi, 2016). From mass balance, the production of 1 ton of crude palm oil
generates 1.41 tons of empty fruit bunch, 0.93 ton of fibers and 0.34 ton of shells as
solid waste (Kramanandita et al., 2014). About 85% of fibers and 15% of shells and
empty fruit bunches are used as fuel for steam production in boilers. It is estimated that
5% of the fuel will be unburned and generate ash. This amounts to more than 2,880
million tons of ash that is sent to landfills rather than put into productive usage (Tay and
Show, 1995). There are many studies on the utilization the palm oil ash as a
replacement of cementing material (Tay and Show, 1995; Sata et al., 2004; Bamaga et
al., 2013); however, only few studies have used the palm oil ash as a raw material for
silica production. The leaching process using citric acid has been studied to produce
silica from palm oil ash. This method can produce silica which has a purity of 92%
(Faizul et al., 2013). Nonetheless, the leaching process cannot separate the amorphous
silica and the crystalline silica which are found in the ash. In a previous work, the
extraction process of silica from Palm Oil Mill Fly Ash (POMFA) was optimized
(Utama et al., 2013). The variables optimized included time, ratio of POMFA mass to
NaOH volume and NaOH concentration. This research found that the optimum
conditions were extraction time of 50 min, sodium hydroxide concentration of 1.40 N,
and mass of ash to volume of solvent ratio of 0.23. In this work, the variables optimized
are temperature and the stirring speed. The sol-gel process was applied to obtain silica
Page 5 of 22
For Proof Read only
Songklanakarin Journal of Science and Technology SJST-2016-0170.R2 Utama
123456789101112131415161718192021222324252627282930313233343536373839404142434445464748495051525354555657585960

For Review O
nly
gel from extract silica. The physical and chemical properties of silica gel product were
characterized using the Fourier Transform Infrared (FTIR), the X-ray Flourescence
(XRF), X-ray Diffractometer (XRD), the Scanning Electron Microscope (SEM) and
Scanning Electron Microscope-Energy-dispersive X-ray (SEM-EDS). The results were
then compared with silica gel from the reference.
2. Materials and Methods
Materials
The POMFA was obtained from Sawee Industrial Palm Oil Ltd., Chumporn,
Thailand. The POMFA was dried at 110°C before being used as the raw material. The
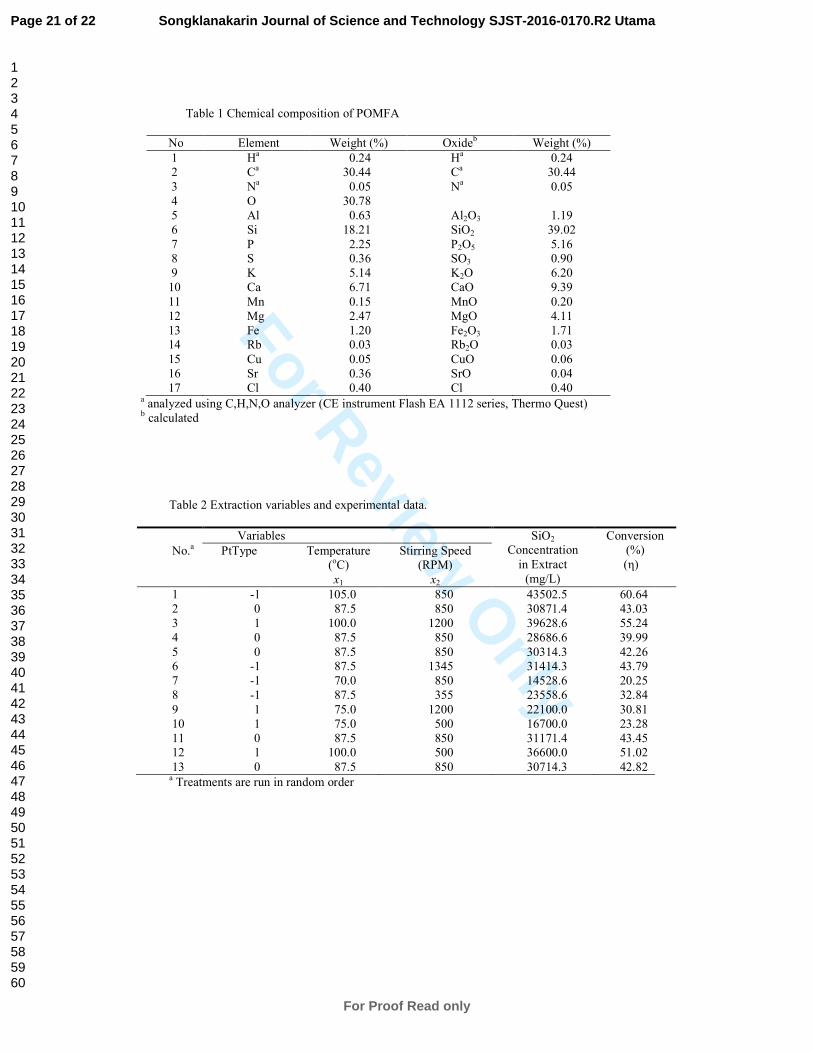
chemical composition of the sample POMFA obtained using the XRF and C, H, N and
O analyzer (CE instrument Flash EA 1112 series, Thermo Quest) are shown in Table 1.
<< Table 1>>
From the analysis, silica and carbon are the main components in the POMFA. The
laboratory grade sodium hydroxide with minimum NaOH content of 97% (dry basis)
was obtained from Boss Official Limited Partnership, Hat Yai, Thailand. The
commercial grade sulfuric acid (with minimum total acidity of 98% H2SO4 by mass)
was obtained from K.K. Superstore, Hat Yai, Thailand.
Methods
The extraction process was done in 2500 cm3 temperature controlled glass
extractor equipped with a 5 cm propeller stirrer driven by a variable speed motor for
mixing. The process variables studied and optimized were temperature (75-100°C) and
stirring speed (500-1200 RPM) in order to achieved highest silica conversion. The other
Page 6 of 22
For Proof Read only
Songklanakarin Journal of Science and Technology SJST-2016-0170.R2 Utama
123456789101112131415161718192021222324252627282930313233343536373839404142434445464748495051525354555657585960
For Review O
nly
process variables such as NaOH concentration, mass of POMFA to NaOH volume ratio
and extraction time were used the optimized variables obtained from the previous
research and set as fixed variables. The fixed variables used were NaOH concentration
1.4 N, mass of POMFA to NaOH volume ratio 468.2 g/2000 cm3 and extraction time 50
minutes (Utama et al., 2013). The optimization of the extraction process was done
using Response Surface Method-Central Composite Design (RSM-CCD). The full
factorial design with 4 cube points, 4 axial points and 5 cubic center points was used.
The proposed model for the response (η) was:
εββββββη ++++++= 2112
2
222
2
11122110 xxxxxx (1)
Where η is the predicted response for silica conversion (%); β0 is the constant
term; β1; β2 are the linear effects; β11 and β22 are the quadratic effects; β12 is the
interaction effect and ε is the random error. The independent variable x1 was the
temperature (°C) and x2 was the stirring speed (RPM). Regression analysis, ANOVA
and the optimization were done using the Minitab 16.1.1 software. ANOVA was used to
test the compatibility of the model with the experimental data by showing the Lack of
Fit (LoF) which can be used to investigate the adequacy of the model. The optimum
condition was verified by conducting experiments at that condition. Responses were
monitored and results were compared with model predictions (Ramos de la Pena et al.,
2012).
The ICP-OES (Perkin Elmer Optima 4300 DV) was used to analyze the silica
content in the extract. The sol gel process was applied to obtain silica gel. The extract
silica from the optimum conditions was acidified using 10% (v/v) H2SO4 to form silica
gel. The gel was aged for 18 h then crushed, washed and dried. The dried silica was then
crushed and washed with water, while maintaining the pH at 7 by adding H2SO4
Page 7 of 22
For Proof Read only
Songklanakarin Journal of Science and Technology SJST-2016-0170.R2 Utama
123456789101112131415161718192021222324252627282930313233343536373839404142434445464748495051525354555657585960

For Review O
nly
(Kalapathy et al., 2000). According Iler (1979), the silica gel is made up of
interconnected pore with a silicon dioxide core where water is entrapped and a surface
consisting of silanol group. The characterization below was done to confirm that the
product is silica gel. The SEM EDS (JEOL JSM-5800LV) was used to identify the
chemical composition of dried silica gel obtained to ensure that the silicon was more
abundant compared to other mineral in product. The characterization using The XRF
(PW 2400 Philips) was used to confirm the SEM EDS result. The characterization using
XRD (X-ray Diffractometer, Philips X'Pert MPD, Philips) was done to confirm that the
silicon dioxide in the product in the amorphous form. The FTIR (Vertex 70, Bruker) is
used to identify the chemical bonds in the product to ensure the existing of the silanol
group. The morphology of the dried silica gel was characterized using the SEM (FEI
Quanta 400). The properties of POMFA were studied using the SEM (FEI Quanta 400)
and the XRD (X’Pert MPD, Philips).
3. Results and Discussion
From Table 1, it can be calculated that the silica content of the POMFA free of
volatile matter is 57.04%. This result is in accordance with the finding that palm oil fuel
ash contains approximately 59.62% silica content (Awal and Shehu, 2013) and slightly
higher than the reported silica content in sugar cane baggase ash of 50.36% (Affandi et
al., 2009). Even though the silica contents of the POMFA and sugar baggase ash are
lower than silica content of rice husk ash which contains 95.03% (Sousa et al., 2009),
both POMFA and sugar cane baggase ash are industrial waste that are available in situ
in huge amount compared to rice husk ash.
Page 8 of 22
For Proof Read only
Songklanakarin Journal of Science and Technology SJST-2016-0170.R2 Utama
123456789101112131415161718192021222324252627282930313233343536373839404142434445464748495051525354555657585960
For Review O
nly
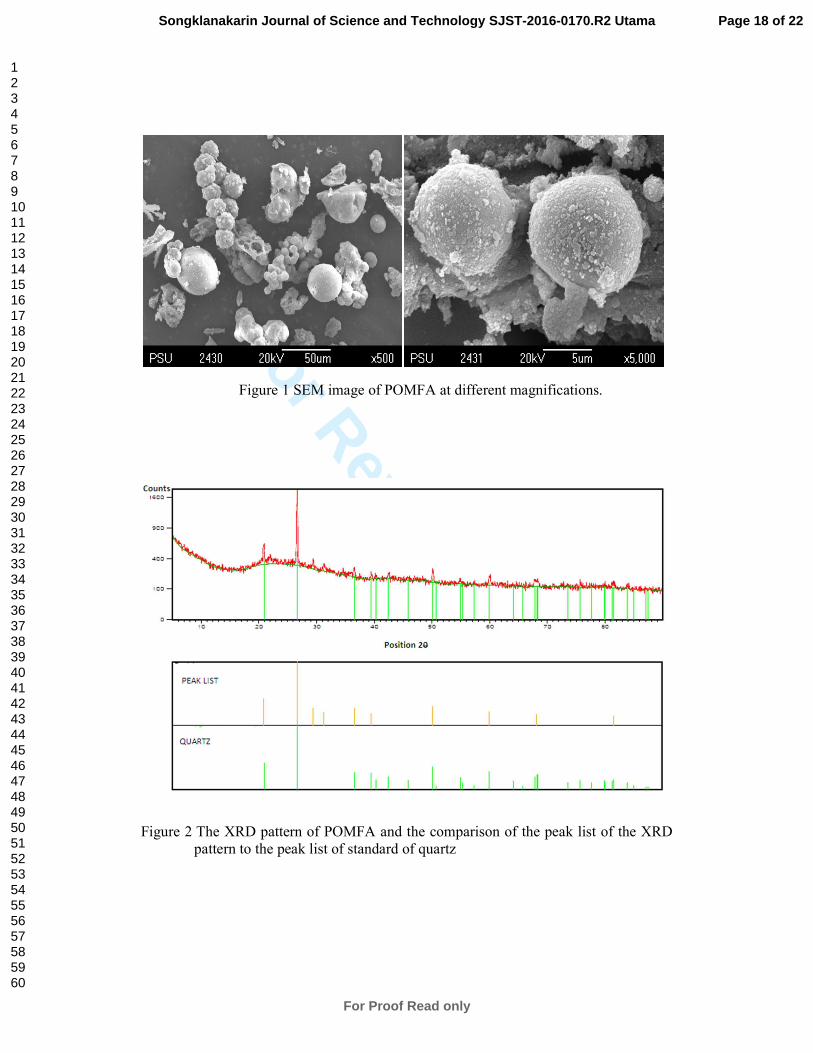
The morphology of POMFA is shown in Figure 1 at magnifications of 500 and
5000 times. In the palm oil plant, the fiber and 15 % of shell produced was burned as a
fuel in a boiler to produce steam. The fixed bed with overfeed combustion system is
used. The primary combustion air used to burn fixed carbon and cooled the grate is
passed below the grate in the combustion chamber and the secondary combustion air
used to burn the volatile matter produced in primary burning process is passed above
the grate. According to Kutchko and Kim (2006), the mineral in fly ash will appear to
be fused or partially melted because of heat, while the amorphous particles will tend to
form spherical particles. At high temperature combustion, the minerals will become
liquid and react with oxygen forming oxides. During the cooling process, the minerals
may become crystals or spherical amorphous particles. In the production of palm oil, the
waste materials from the shells, fibers and empty fruit bunch are used as fuel for the
boiler. The ash that is produced during this burning process is collected upstream of the
boiler and is called POMFA.
<<Figure 1>>
As shown in Figure 1, irregular shaped particles and spherical particles can be
seen in the POMFA, indicating the presence of silica crystals and amorphous silica. To
investigate whether the silica is in the form of crystalline or amorphous, the POMFA
was characterized using the XRD, as shown in Figure 2. The peak list of the XRD
pattern was compared with the standard quartz pattern from the Scientific Equipment
Center (SEC), Prince of Songkla University. The pattern is in accordance. Therefore, it
can be concluded that part of silica in the POMFA is in the form of quartz.
<<Figure 2>>
Page 9 of 22
For Proof Read only
Songklanakarin Journal of Science and Technology SJST-2016-0170.R2 Utama
123456789101112131415161718192021222324252627282930313233343536373839404142434445464748495051525354555657585960

For Review O
nly
Experimental results using the RSM experimental design are given in Table 2.
The data indicate that the highest conversion of silica occurred at 105°C and 850 RPM.
It can be seen that the higher the temperature used, the higher the conversion of the
silica extracted. At low stirring speed range (375 to 850 RPM), the higher the stirring
speed used, the higher the conversion of the silica extract; however, at the high stirring
speed range (850 – 1375 RPM), the increase in the conversion of the extracted silica
was small as the stirring speed increases.
<<Table 2>>
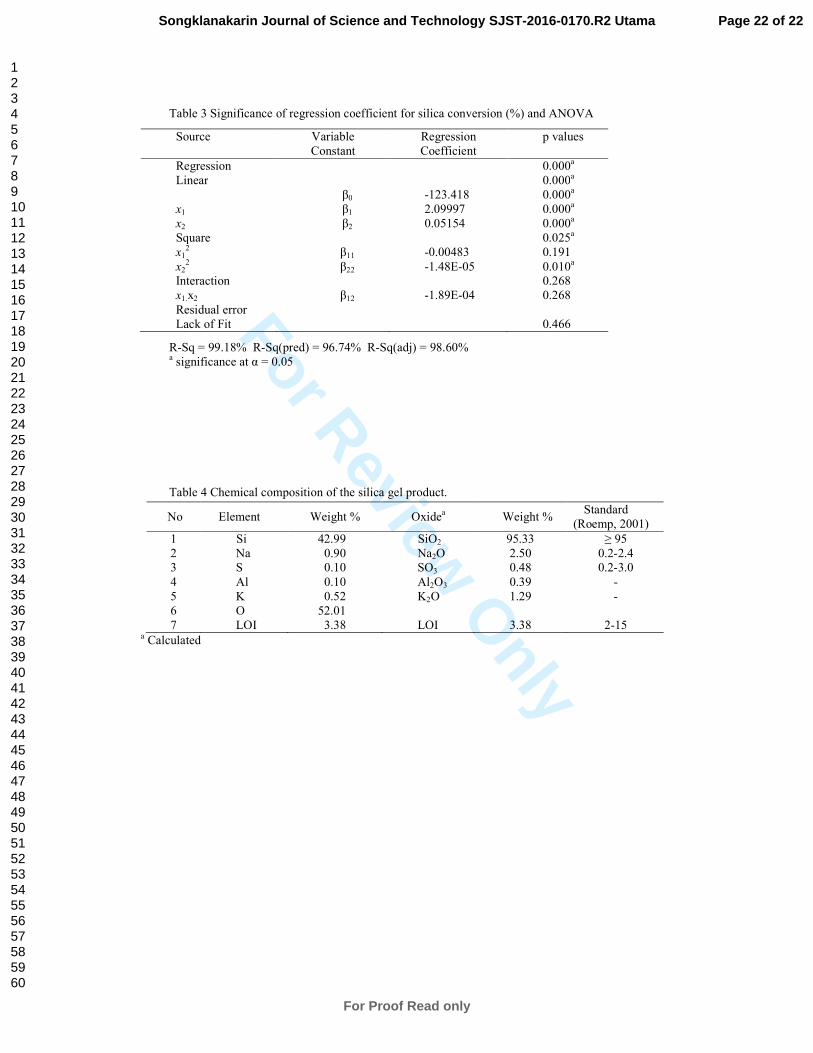
The response surface model proposed was fitted to the experimental data using
RSM procedure. The coefficients of the proposed model, the significance of variables
and adequacy of the model are shown in Table 3.
<<Table 2>>
From Table 3, it can be seen that the regression model for silica conversion is
significant (p-value = 0.000 < 0.05). At least, one of the terms in the regression equation
makes a significant impact on the silica conversion. All the p values for the linear effect
are less than 0.05. So, all variables give a significant linear effect. The p value of the
square effect for the silica conversion is 0.025 (p<0.05), so there is a significant
quadratic effect. Only the square of the stirring speed gives a significant effect. The p-
value of the interaction term is higher than 0.05. So, there is no significant effect to the
mean response.
The Lack of Fit test gives a p value of 0.466 (p >0.05), meaning that there is no
evidence that the model does not adequately explain the variation in the responses. The
statistical analysis above indicates that the proposed model is adequate. The empirical
Page 10 of 22
For Proof Read only
Songklanakarin Journal of Science and Technology SJST-2016-0170.R2 Utama
123456789101112131415161718192021222324252627282930313233343536373839404142434445464748495051525354555657585960
For Review O
nly
regression equation relationship between silica conversion (%) and the research variable
is given by the following equation:
21
2
2
2
121 0489.10548.100483.005154.009997.2418.123 xxExExxx −−−−−++−=η
with satisfactory value of R2 (0.9918).
The optimization process was done using Minitab 16.1.1. The goal is to
maximize the conversion of silica. The optimum operating conditions obtained were the
temperature of 105oC and the stirring speed of 1065 RPM. The predictive result for this
optimum operating condition for silica conversion was 60.79%. When the stirring speed
was over 1065 RPM, the effect of the increasing stirring speed to extraction process was
small. Normally, for diffusion-controlled extraction, increasing the stirring speed will
linearly increase the extraction rate. For stirring speed above 1065 RPM, the chemical
reaction or intra-particle diffusion may control the extraction process. In the chemical
reaction or intra-particle diffusion controlled extraction process the rate of extraction
will not change when the stirring speed reached the certain value (Zhou et al., 2014).
The optimization process was validated by performing additional laboratory
experiments under the optimum operating conditions. The conversion of silica
extraction from the experimentation was 60.42 ± 0.83% which is in agreement with the
predictive value. The low extraction efficiency may be caused by the presence of silica
in the form of quartz in the POMFA (Sousa et al., 2009).
The FTIR was used to characterize major chemical group in the silica gel
obtained. The FTIR spectra is depicted in Figure 3.
(2)
Page 11 of 22
For Proof Read only
Songklanakarin Journal of Science and Technology SJST-2016-0170.R2 Utama
123456789101112131415161718192021222324252627282930313233343536373839404142434445464748495051525354555657585960
For Review O
nly
<<Figure 3>>
The characteristic and peaks position of the FTIR spectra of the silica gel in
Figure 3 aligns well with the FTIR spectra of commercial silica which was reported by
Thuadaij and Nuntiya (2008). According Kamath and Proctor (1999) the broad peak
between 2800 and 3750 cm-1
is due to the silanol OH group and the adsorbed water
bond to silica surface by hydrogen bond and the peak shown at 1639 cm-1
is due to H-
OH bond. The strong peak at 1107 assigned to asymmetric Si-O-Si stretching vibrations
whiles the peak at 800 cm-1
assigned to symmetric Si-O-Si stretching vibrations and the
peaks at 473 cm-1
is due to O-Si-O bending vibrations (Music et al., 2011).
The XRD pattern of silica gel product is shown in Figure 4.
<<Figure 4>>
There is no sharp peak in XRD pattern indicating no crystalline mineral in the
product. The characteristic of amorphous material is given by the broad hump at the
diffraction angle 2Θ between 15-35 degree. The XRD pattern of the silica gel obtained
is in accordance with the XRD pattern of commercial silica gel Trysil 300 (Kamath and
Proctor, 1998).
The SEM images of the silica gel product with magnifications of 500 and 5000
times are shown in Figure 5.
<<Figure 5>>
From the above images, it can be estimated that the range of size of the
aggregate in the silica gel obtained is < 50 µm, which is almost the same as the range of
Page 12 of 22
For Proof Read only
Songklanakarin Journal of Science and Technology SJST-2016-0170.R2 Utama
123456789101112131415161718192021222324252627282930313233343536373839404142434445464748495051525354555657585960
For Review O
nly
size of the aggregate of Trysil 300, that is of < 25 µm. Furthermore, the shape of the
aggregate is similar to one another (Kamath and Proctor, 1998).
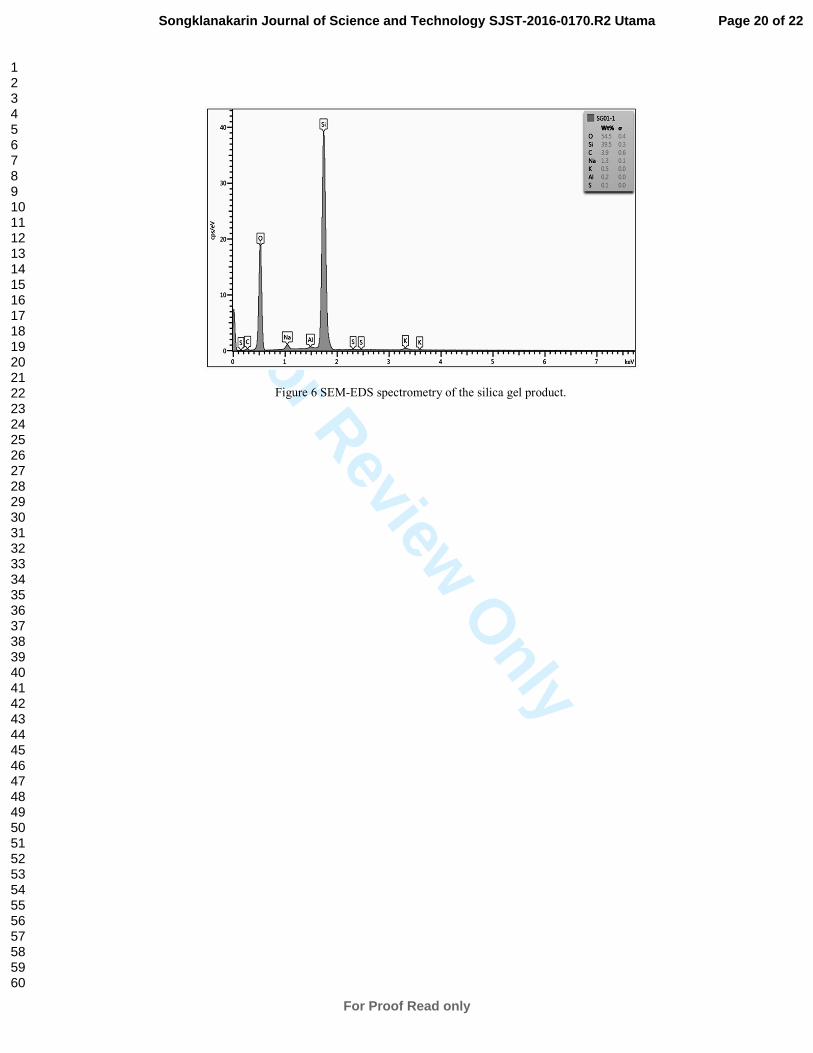
The SEM-EDS analysis of the silica gel product is depicted in Figure 6.
<<Figure 6>>
The SEM-EDS spectrometry shows the element contents of the silica gel
product. The silica gel product contains impurities of C, Na, K, Al and S. The elements
of C, K and Al are present in the POMFA and a small amount of those elements has
been carried over in the silica gel product. The Na and S elements are from the sodium
hydroxide and sulfuric acid, which were used in the extraction and sol-gel precipitation
process and cannot be washed completely in the washing process. The Na element in
the silica gel obtained is 1.3% (wt.) which is lower than Na element in the silica powder
made from sodium silicate using pressurized carbonation process reported by Chai et al.
(2009) which is 1.72% (wt.). The composition of silica gel which was analyzed using
XRF is shown in Table 4. The semi quantitative XRF analysis confirms the presence of
the impurities above. Both of the SEM-EDS and the XRF analysis are shown that the
silicon and oxygen element more abundant compare to other elements. This is
confirming that the presence of silica is predominant in the product obtained. The
chemical composition of silica gel derived from palm oil mill fly ash is in the range of
the standard of commercial silica gel.
<<Table 4>>
4. Conclusions
Page 13 of 22
For Proof Read only
Songklanakarin Journal of Science and Technology SJST-2016-0170.R2 Utama
123456789101112131415161718192021222324252627282930313233343536373839404142434445464748495051525354555657585960

For Review O
nly
The proposed model adequately explains the variations of the responses and can be used
for optimizing the operating conditions of silica extraction from POMFA. The optimum
operating conditions were at the temperature of 105oC and the stirring speed of 1065
RPM. The resulting 60.42 ± 0.83% of silica from the POMFA can be extracted under
the optimum condition. The chemical composition and physical characteristic of silica
gel product, which were analyzed with FTIR, XRD, SEM, SEM-EDS and XRF, are
similar to the commercial silica gel from the references.
Acknowledgments
This work was financially supported by the Graduate School Prince of Songkla
University. The author received the scholarship for his graduate degree from DGHE
Indonesia.
References
Affandi, S., Setyawan, H., Winardi, S., Purwanto, A. and Balgis, R. 2011. A
facile method for production of high-purity silica xerogels from bagasse ash. Advanced
Powder Technology. 20(5), 468–472.
Awal, A.A. and Shehu, I. 2013. Evaluation of heat of hydration of concrete
containing high volume palm oil fuel ash. Fuel. 105, 728-731.
Bamaga, S.O., Hussin, M.W. and Ismail, M.A. 2013. Palm oil fuel ash:
promising supplementary cementing materials. KSCE Journal of Civil Engineering.
17(7), 1708-1713.
Cai, X., Hong, R.Y., Wang, L.S., Wang, X.Y., Li, H.Z. and Wei, D.G. 2009.
Synthesis of silica powders by pressured carbonation. Chemical Engineering Journal.
151(1), 380-386.
Page 14 of 22
For Proof Read only
Songklanakarin Journal of Science and Technology SJST-2016-0170.R2 Utama
123456789101112131415161718192021222324252627282930313233343536373839404142434445464748495051525354555657585960
For Review O
nly
Faizul, C.P., Abdullah, C. and Fazlul, B. 2013. Extraction of silica via citric acid
leaching treatment. Advances in Environmental Biology. 7(12), 3690-3695.
Iler, R.K. 1979. The Chemistry of Silica, John Wiley and Sons, New York,
U.S.A., pp. 462-729.
Indexmundi. 2016. Palm oil production by country in 1000 MT. Available from
http://www.indexmundi.com/agriculture/?commodity=palm-oil&graph=production.
[January 15, 2016].
Kalapathy, U., Proctor, A. and Shultz, J. 2000. A simple method for production
of pure silica from rice hull ash. Bioresource Technology. 73(3), 257-262.
Kamath, S.R. and Proctor, A. 1998. Silica gel from rice hull ash: preparation and
characterization. Cereal Chemistry. 75(4), 484-487.
Kramanandita, R., Bantacut, T., Romli, M. and Makmoen, M. 2014. Utilizations
of palm oil mills wastes as source of energy and water in the production process of
crude palm oil. Chemistry and Materials Research. 6(8), 46-53.
Kutchko, B.G. and Kim, A.G. 2006. Fly ash characterization by SEM–EDS.
Fuel. 85(17), 2537-2544.
Lima, S.P.B.D., Vasconcelos, R.P.D., Paiva, O.A., Cordeiro, G.C., Chaves,
M.R.D.M., Toledo Filho, R.D. and Fairbairn, E.D.M.R. 2011. Production of silica gel
from residual rice husk ash. Química Nova. 34(1), 71-75.
Musić, S., Filipović-Vinceković, N. and Sekovanić, L. 2011. Precipitation of
amorphous SiO2 particles and their properties. Brazilian Journal of Chemical
Engineering. 28(1), 89-94.
Page 15 of 22
For Proof Read only
Songklanakarin Journal of Science and Technology SJST-2016-0170.R2 Utama
123456789101112131415161718192021222324252627282930313233343536373839404142434445464748495051525354555657585960
For Review O
nly
Prasad, R. and Pandey, M. 2012. Rice husk ash as a renewable source for the
production of value added silica gel and its application: an overview. Bulletin of
Chemical Reaction Engineering and Catalysis. 7(1), 1-25.
Ramos-de-la-Peña, A.M., Renard, C.M., Wicker, L., Montañez, J., de la Luz
Reyes-Vega, M. and Contreras-Esquivel, J.C. 2012. Optimization of the liquefaction
and saccharification of structural polysaccharides of jicama (Pachyrhizus erosus L.)
tissue by enzymatic pulping. LWT-Food Science and Technology. 46(1), 232-238.
Roempp, H. 2001. Roempp Lexikon Lacke und Druckfarben, ThiemeVerlag,
Stuttgart, Germany., p. 323
Rozainee, M., Ngo, S.P., Salema, A.A. and Tan, K.G. 2008. Fluidized bed
combustion of rice husk to produce amorphous siliceous ash. Energy for Sustainable
Development. 12(1), 33-42.
Sampat, B.G. 2008. Specialty silicas : A Techno-commercial profile – Part 2 :
International scenario. Chemical Weekly. 54(9), 203-207.
Sata, V., Jaturapitakkul, C. and Kiattikomol, K. 2004. Utilization of palm oil
fuel ash in high-strength concrete. Journal of Materials in Civil Engineering. 16(6), 623-
628.
Shim, J., Velmurugan, P. and Oh, B.T. 2015. Extraction and physical
characterization of amorphous silica made from corn cob ash at variable pH conditions
via sol gel processing. Journal of Industrial and Engineering Chemistry. 30, 249-253.
Sousa, A.M.D., Visconte, L., Mansur, C. and Furtado, C. 2009. Silica sol
obtained from rice husk ash. Chemical Technology. 3(4), 321-326.
Stephens, D.K., Wellen, C.W., Smith, J.B. and Kubiak, K.F. 2002. U.S. Patent
No. 6,375,735. Washington, DC: U.S. Patent and Trademark Office.
Page 16 of 22
For Proof Read only
Songklanakarin Journal of Science and Technology SJST-2016-0170.R2 Utama
123456789101112131415161718192021222324252627282930313233343536373839404142434445464748495051525354555657585960

For Review O
nly
Tay, J.H. and Show, K.Y. 1995. Use of ash derived from oil-palm waste
incineration as a cement replacement material. Resources, conservation and
recycling. 13(1), 27-36.
Thuadaij, N. and Nuntiya, A. 2008. Preparation of nanosilica powder from rice
husk ash by precipitation method. Chiang Mai Journal of Science. 35(1), 206-211.
Utama, P.S., Yamsaengsung, R. and Sangwichien, C. 2013. Optimization using
responds surface method on silica extraction from palm oil mill fly ash. Proceedings of
the 5th
Regional Conference on Chemical Engineering, Pattaya, Thailand, February 7-8,
2013, 41-44.
Zemnukhova, L.A., Egorov, A.G., Fedorishcheva, G.A., Barinov, N.N.,
Sokol’nitskaya, T.A. and Botsul, A.I. 2006. Properties of amorphous silica produced
from rice and oat processing waste. Inorganic Material. 42(1), 24-29.
Zhou, Y., Gao, F., Zhao, Y. and Lu, J. 2014. Study on the extraction kinetics of
phenolic compounds from petroleum refinery waste lye. Journal of Saudi Chemical
Society. 18(5), 589-592.
Page 17 of 22
For Proof Read only
Songklanakarin Journal of Science and Technology SJST-2016-0170.R2 Utama
123456789101112131415161718192021222324252627282930313233343536373839404142434445464748495051525354555657585960
For Review O
nly
Figure 1 SEM image of POMFA at different magnifications.
Figure 2 The XRD pattern of POMFA and the comparison of the peak list of the XRD
pattern to the peak list of standard of quartz
Page 18 of 22
For Proof Read only
Songklanakarin Journal of Science and Technology SJST-2016-0170.R2 Utama
123456789101112131415161718192021222324252627282930313233343536373839404142434445464748495051525354555657585960

For Review O
nly
Figure 3 FTIR spectra of the silica gel product
Figure 4 The XRD pattern of silica gel product.
Figure 5 SEM image of silica gel obtained at different magnifications.
Page 19 of 22
For Proof Read only
Songklanakarin Journal of Science and Technology SJST-2016-0170.R2 Utama
123456789101112131415161718192021222324252627282930313233343536373839404142434445464748495051525354555657585960
For Review O
nly
Figure 6 SEM-EDS spectrometry of the silica gel product.
Page 20 of 22
For Proof Read only
Songklanakarin Journal of Science and Technology SJST-2016-0170.R2 Utama
123456789101112131415161718192021222324252627282930313233343536373839404142434445464748495051525354555657585960
For Review O
nly
Table 1 Chemical composition of POMFA
a analyzed using C,H,N,O analyzer (CE instrument Flash EA 1112 series, Thermo Quest)
b calculated
Table 2 Extraction variables and experimental data.
Variables SiO2
Concentration
in Extract
(mg/L)
Conversion
(%)
(η)
No.a PtType Temperature
(oC)
x1
Stirring Speed
(RPM)
x2
1 -1 105.0 850 43502.5 60.64
2 0 87.5 850 30871.4 43.03
3 1 100.0 1200 39628.6 55.24
4 0 87.5 850 28686.6 39.99
5 0 87.5 850 30314.3 42.26
6 -1 87.5 1345 31414.3 43.79
7 -1 70.0 850 14528.6 20.25
8 -1 87.5 355 23558.6 32.84
9 1 75.0 1200 22100.0 30.81
10 1 75.0 500 16700.0 23.28
11 0 87.5 850 31171.4 43.45
12 1 100.0 500 36600.0 51.02
13 0 87.5 850 30714.3 42.82 a Treatments are run in random order
No Element Weight (%) Oxideb Weight (%)
1 Ha 0.24 H
a 0.24
2 Ca 30.44 Ca 30.44
3 Na 0.05 N
a 0.05
4 O 30.78
5 Al 0.63 Al2O3 1.19
6 Si 18.21 SiO2 39.02
7 P 2.25 P2O5 5.16
8 S 0.36 SO3 0.90
9 K 5.14 K2O 6.20
10 Ca 6.71 CaO 9.39
11 Mn 0.15 MnO 0.20
12 Mg 2.47 MgO 4.11
13 Fe 1.20 Fe2O3 1.71
14 Rb 0.03 Rb2O 0.03
15 Cu 0.05 CuO 0.06
16 Sr 0.36 SrO 0.04
17 Cl 0.40 Cl 0.40
Page 21 of 22
For Proof Read only
Songklanakarin Journal of Science and Technology SJST-2016-0170.R2 Utama
123456789101112131415161718192021222324252627282930313233343536373839404142434445464748495051525354555657585960
For Review O
nly
Table 3 Significance of regression coefficient for silica conversion (%) and ANOVA
R-Sq = 99.18% R-Sq(pred) = 96.74% R-Sq(adj) = 98.60% a significance at α = 0.05
Table 4 Chemical composition of the silica gel product.
a Calculated
Source
Variable
Constant
Regression
Coefficient
p values
Regression 0.000a
Linear 0.000a
β0 -123.418 0.000a
x1 β1 2.09997 0.000a
x2 β2 0.05154 0.000a
Square 0.025a
x12 β11 -0.00483 0.191
x22 β22 -1.48E-05 0.010
a
Interaction 0.268
x1.x2 β12 -1.89E-04 0.268
Residual error
Lack of Fit 0.466
No Element Weight % Oxidea Weight %
Standard
(Roemp, 2001)
1 Si 42.99 SiO2 95.33 ≥ 95
2 Na 0.90 Na2O 2.50 0.2-2.4
3 S 0.10 SO3 0.48 0.2-3.0
4 Al 0.10 Al2O3 0.39 -
5 K 0.52 K2O 1.29 -
6 O 52.01
7 LOI 3.38 LOI 3.38 2-15
Page 22 of 22
For Proof Read only
Songklanakarin Journal of Science and Technology SJST-2016-0170.R2 Utama
123456789101112131415161718192021222324252627282930313233343536373839404142434445464748495051525354555657585960