food and beverage - harriswilliams.com · page | vital signs 3 food and beverage industry update...
TRANSCRIPT
www.harriswilliams.com
Investment banking services are provided by Harris Williams LLC, a registered broker-dealer and member of FINRA and SIPC, and Harris Williams & Co. Ltd, which is a private limited company incorporated under English law with its registered office at 5th Floor, 6 St. Andrew Street, London EC4A 3AE, UK, registered with the Registrar of Companies for England and Wales (registration number 7078852). Harris Williams & Co. Ltd is authorized and regulated by the Financial Conduct Authority. Harris Williams & Co. is a trade name under which Harris Williams LLC and Harris Williams & Co. Ltd conduct business.
FOOD AND BEVERAGE
INDUSTRY UPDATE │ OCTOBER 2017
PAGE |
www.harriswilliams.com
WHAT WE’RE SEEING
1
CONTENTS
INDUSTRY VITAL SIGNS
EQUITY MARKET OVERVIEW
M&A MARKET OVERVIEW
DEBT MARKET OVERVIEW
RECENT M&A ACTIVITY
EARNINGS CALENDAR
GROUP OVERVIEW
Harris Williams & Co. is a leading advisor to the food and beverage market. Our significant experience covers a broad range of end markets, industries, and business models. This particular report focuses on trends and metrics in the following areas:
Agribusiness
Bakery
Beverages
Branded and Private Label
Dairy
Distribution
Ingredients
Meat and Protein
Natural and Organic
Processing
Produce
Restaurant and Retail
Snacks
CONTACTS
Tim AlexanderManaging [email protected]+1 (612) 359-2716
Ryan BudlongManaging [email protected]+1 (415) 217-3409
Brant [email protected]+1 (612) 359-2709
Ryan [email protected]+1 (612) 359-2703
Andy WarczakVice [email protected]+1 (612) 359-2714
MARKET UPDATE
FOOD AND BEVERAGE
INDUSTRY UPDATE │ OCTOBER 2017
a portfolio company of
has been acquired by
CLOSED HW&CO. TRANSACTIONS
WHAT WE’VE BEEN DOING
a portfolio company of
has been acquired by
a portfolio company of
has been acquired by
a subsidiary of
has been acquired by
a portfolio company of
has been acquired by
has been acquired by
a portfolio company of
has been acquired by
and
The food & beverage M&A market remains active through October, with several
notable transactions. Kellogg Company announced its acquisition of RXBAR,
demonstrating the continued appetite of large CPG companies to enter or
continue to expand in the high-protein snacking segment. Also notable is Post
Holding’s announced acquisition of Bob Evans Farms. Post Holdings is actively
looking for growth avenues, and the frozen meals and protein space is
experiencing outsized growth as compared to other packaged food categories.
a portfolio company of
has been acquired by
a portfolio company of
has been acquired byhas been acquired by
The Soup & Infant
Feeding Business of
has been acquired by
PizzaRev
Founders
a partnership of
&
has been acquired by
a division of
a portfolio company of
PAGE |
90
100
110
120
130
140
Sep-13 Mar-14 Sep-14 Mar-15 Sep-15 Mar-16 Sep-16 Mar-17 Sep-17
Pro
tein
Pri
ce
Ind
ex
Beef Pork Poult ry
-
20
40
60
80
100
120
Oct-12 Apr-13 Oct-13 Apr-14 Oct-14 Apr-15 Oct-15 Apr-16 Oct-16 Apr-17 Oct-17
Co
mm
od
ity
Pric
e In
de
x
Crude Oil Soybeans Wheat Corn
WHAT WE’VE BEEN READING
2
FOOD AND BEVERAGE
INDUSTRY UPDATE │ OCTOBER 2017
VITAL SIGNS
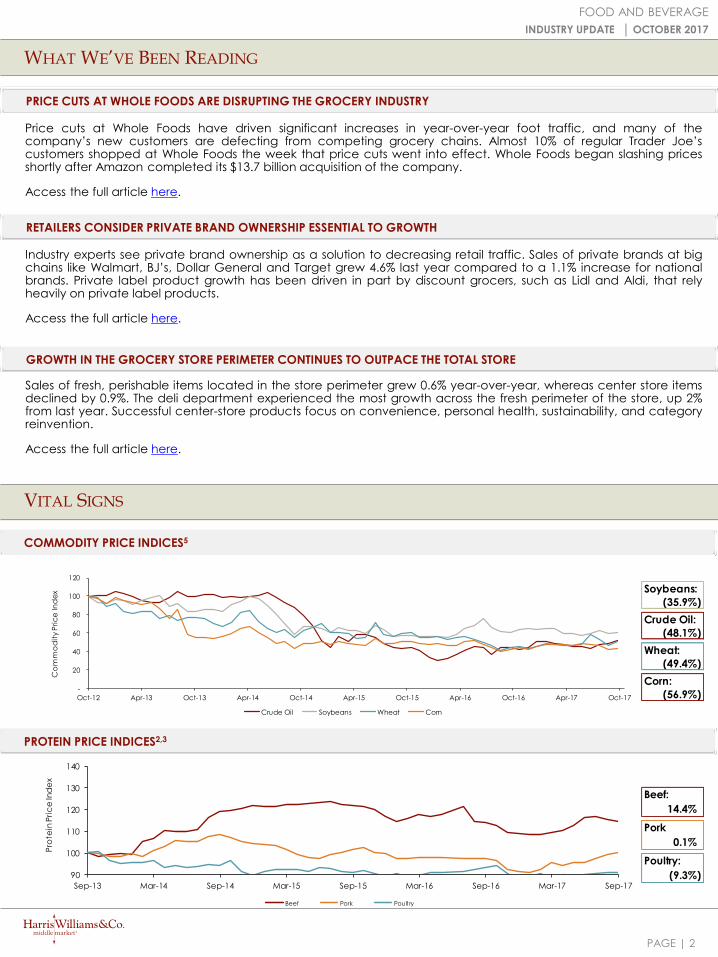
COMMODITY PRICE INDICES5
PROTEIN PRICE INDICES2,3
PRICE CUTS AT WHOLE FOODS ARE DISRUPTING THE GROCERY INDUSTRY
Sales of fresh, perishable items located in the store perimeter grew 0.6% year-over-year, whereas center store itemsdeclined by 0.9%. The deli department experienced the most growth across the fresh perimeter of the store, up 2%from last year. Successful center-store products focus on convenience, personal health, sustainability, and categoryreinvention.
Access the full article here.
GROWTH IN THE GROCERY STORE PERIMETER CONTINUES TO OUTPACE THE TOTAL STORE
RETAILERS CONSIDER PRIVATE BRAND OWNERSHIP ESSENTIAL TO GROWTH
Price cuts at Whole Foods have driven significant increases in year-over-year foot traffic, and many of thecompany’s new customers are defecting from competing grocery chains. Almost 10% of regular Trader Joe’scustomers shopped at Whole Foods the week that price cuts went into effect. Whole Foods began slashing pricesshortly after Amazon completed its $13.7 billion acquisition of the company.
Access the full article here.
Industry experts see private brand ownership as a solution to decreasing retail traffic. Sales of private brands at bigchains like Walmart, BJ’s, Dollar General and Target grew 4.6% last year compared to a 1.1% increase for nationalbrands. Private label product growth has been driven in part by discount grocers, such as Lidl and Aldi, that relyheavily on private label products.
Access the full article here.
Beef:
14.4%
Pork
0.1%
Poultry:
(9.3%)
Soybeans:
(35.9%)
Crude Oil:
(48.1%)
Wheat:
(49.4%)
Corn:
(56.9%)
PAGE |
VITAL SIGNS
3
FOOD AND BEVERAGE
INDUSTRY UPDATE │ OCTOBER 2017
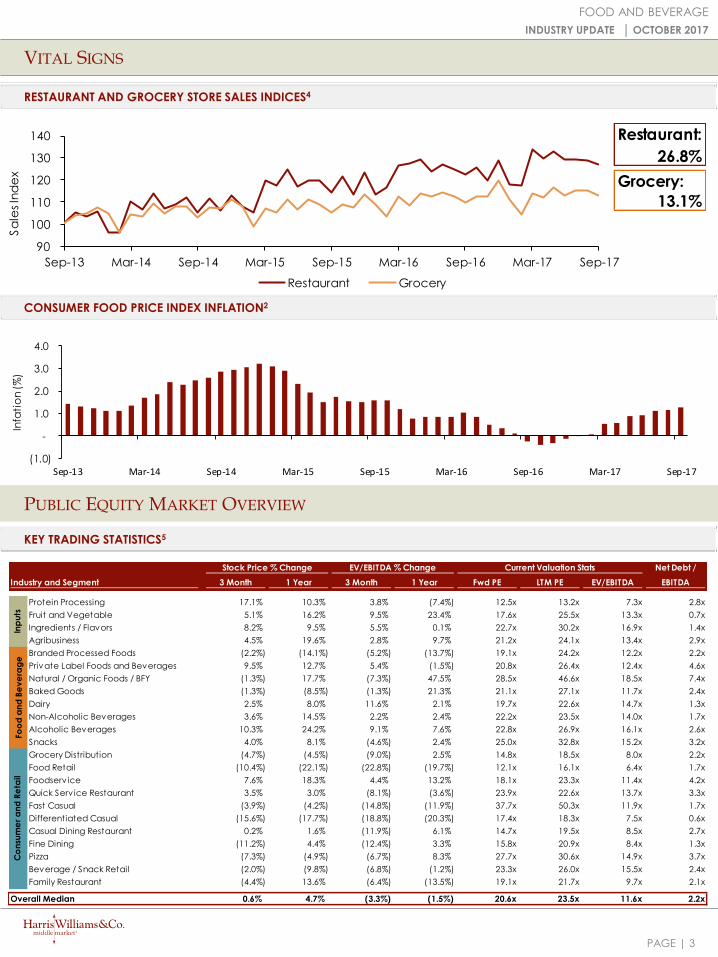
RESTAURANT AND GROCERY STORE SALES INDICES4
CONSUMER FOOD PRICE INDEX INFLATION2
PUBLIC EQUITY MARKET OVERVIEW
KEY TRADING STATISTICS5
Restaurant:
26.8%
Grocery:
13.1%
90
100
110
120
130
140
Sep-13 Mar-14 Sep-14 Mar-15 Sep-15 Mar-16 Sep-16 Mar-17 Sep-17
Sa
les
Ind
ex
Restaurant Grocery
Net Debt /
3 Month 1 Year 3 Month 1 Year Fwd PE LTM PE EV/EBITDA EBITDA
Protein Processing 17.1% 10.3% 3.8% (7.4%) 12.5x 13.2x 7.3x 2.8x
Fruit and Vegetable 5.1% 16.2% 9.5% 23.4% 17.6x 25.5x 13.3x 0.7x
Ingredients / Flavors 8.2% 9.5% 5.5% 0.1% 22.7x 30.2x 16.9x 1.4x
Agribusiness 4.5% 19.6% 2.8% 9.7% 21.2x 24.1x 13.4x 2.9x
Branded Processed Foods (2.2%) (14.1%) (5.2%) (13.7%) 19.1x 24.2x 12.2x 2.2x
Private Label Foods and Beverages 9.5% 12.7% 5.4% (1.5%) 20.8x 26.4x 12.4x 4.6x
Natural / Organic Foods / BFY (1.3%) 17.7% (7.3%) 47.5% 28.5x 46.6x 18.5x 7.4x
Baked Goods (1.3%) (8.5%) (1.3%) 21.3% 21.1x 27.1x 11.7x 2.4x
Dairy 2.5% 8.0% 11.6% 2.1% 19.7x 22.6x 14.7x 1.3x
Non-Alcoholic Beverages 3.6% 14.5% 2.2% 2.4% 22.2x 23.5x 14.0x 1.7x
Alcoholic Beverages 10.3% 24.2% 9.1% 7.6% 22.8x 26.9x 16.1x 2.6x
Snacks 4.0% 8.1% (4.6%) 2.4% 25.0x 32.8x 15.2x 3.2x
Grocery Distribution (4.7%) (4.5%) (9.0%) 2.5% 14.8x 18.5x 8.0x 2.2x
Food Retail (10.4%) (22.1%) (22.8%) (19.7%) 12.1x 16.1x 6.4x 1.7x
Foodserv ice 7.6% 18.3% 4.4% 13.2% 18.1x 23.3x 11.4x 4.2x
Quick Serv ice Restaurant 3.5% 3.0% (8.1%) (3.6%) 23.9x 22.6x 13.7x 3.3x
Fast Casual (3.9%) (4.2%) (14.8%) (11.9%) 37.7x 50.3x 11.9x 1.7x
Differentiated Casual (15.6%) (17.7%) (18.8%) (20.3%) 17.4x 18.3x 7.5x 0.6x
Casual Dining Restaurant 0.2% 1.6% (11.9%) 6.1% 14.7x 19.5x 8.5x 2.7x
Fine Dining (11.2%) 4.4% (12.4%) 3.3% 15.8x 20.9x 8.4x 1.3x
Pizza (7.3%) (4.9%) (6.7%) 8.3% 27.7x 30.6x 14.9x 3.7x
Beverage / Snack Retail (2.0%) (9.8%) (6.8%) (1.2%) 23.3x 26.0x 15.5x 2.4x
Family Restaurant (4.4%) 13.6% (6.4%) (13.5%) 19.1x 21.7x 9.7x 2.1x
Overall Median 0.6% 4.7% (3.3%) (1.5%) 20.6x 23.5x 11.6x 2.2x
Co
nsu
me
r a
nd
Re
tail
Industry and Segment
Stock Price % Change EV/EBITDA % Change Current Valuation Stats
Inp
uts
Fo
od
an
d B
ev
era
ge
(1.0)
-
1.0
2.0
3.0
4.0
Sep-13 Mar-14 Sep-14 Mar-15 Sep-15 Mar-16 Sep-16 Mar-17 Sep-17
Infa
tio
n (
%)
PAGE |
PUBLIC EQUITY MARKET OVERVIEW
4
FOOD AND BEVERAGE
INDUSTRY UPDATE │ OCTOBER 2017
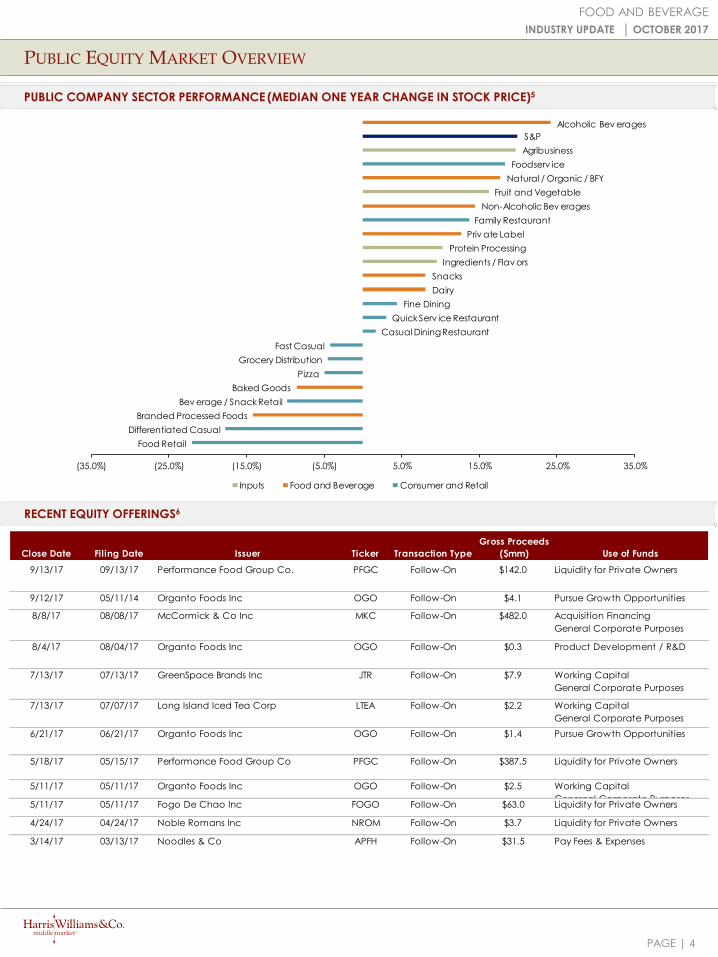
PUBLIC COMPANY SECTOR PERFORMANCE (MEDIAN ONE YEAR CHANGE IN STOCK PRICE)5
RECENT EQUITY OFFERINGS6
Close Date Filing Date Issuer Ticker Transaction Type
Gross Proceeds
($mm) Use of Funds
9/13/17 09/13/17 Performance Food Group Co. PFGC Follow-On $142.0 Liquidity for Private Owners
9/12/17 05/11/14 Organto Foods Inc OGO Follow-On $4.1 Pursue Growth Opportunities
8/8/17 08/08/17 McCormick & Co Inc MKC Follow-On $482.0 Acquisition Financing
General Corporate Purposes
8/4/17 08/04/17 Organto Foods Inc OGO Follow-On $0.3 Product Development / R&D
7/13/17 07/13/17 GreenSpace Brands Inc JTR Follow-On $7.9 Working Capital
General Corporate Purposes
7/13/17 07/07/17 Long Island Iced Tea Corp LTEA Follow-On $2.2 Working Capital
General Corporate Purposes
6/21/17 06/21/17 Organto Foods Inc OGO Follow-On $1.4 Pursue Growth Opportunities
5/18/17 05/15/17 Performance Food Group Co PFGC Follow-On $387.5 Liquidity for Private Owners
5/11/17 05/11/17 Organto Foods Inc OGO Follow-On $2.5 Working Capital
Genereal Corporate Purposes5/11/17 05/11/17 Fogo De Chao Inc FOGO Follow-On $63.0 Liquidity for Private Owners
4/24/17 04/24/17 Noble Romans Inc NROM Follow-On $3.7 Liquidity for Private Owners
3/14/17 03/13/17 Noodles & Co APFH Follow-On $31.5 Pay Fees & Expenses
Food Retail
Differentiated Casual
Branded Processed Foods
Bev erage / Snack Retail
Baked Goods
Pizza
Grocery Distribution
Fast Casual
Casual Dining Restaurant
Quick Serv ice Restaurant
Fine Dining
Dairy
Snacks
Ingredients / Flav ors
Protein Processing
Priv ate Label
Family Restaurant
Non-Alcoholic Bev erages
Fruit and Vegetable
Natural / Organic / BFY
Foodserv ice
Agribusiness
S&P
Alcoholic Bev erages
(35.0%) (25.0%) (15.0%) (5.0%) 5.0% 15.0% 25.0% 35.0%
Inputs Food and Beverage Consumer and Retail
PAGE |
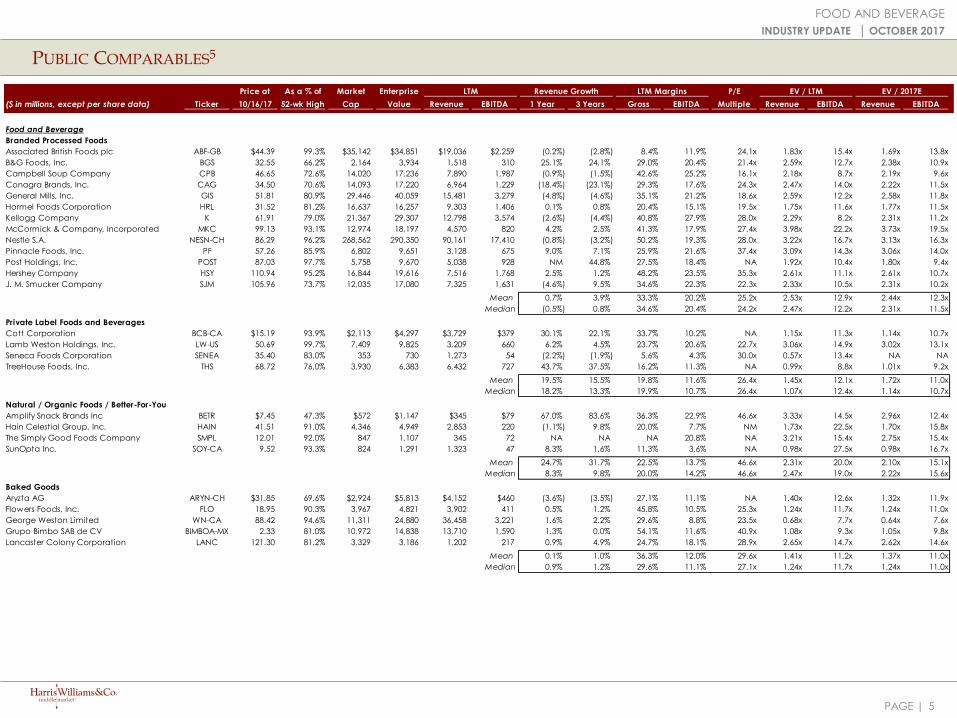
PUBLIC COMPARABLES5
5
FOOD AND BEVERAGE
INDUSTRY UPDATE │ OCTOBER 2017
Price at As a % of Market Enterprise P/E
($ in millions, except per share data) Ticker 10/16/17 52-wk High Cap Value Revenue EBITDA 1 Year 3 Years Gross EBITDA Multiple Revenue EBITDA Revenue EBITDA
Food and Beverage
Branded Processed Foods
Associated British Foods plc ABF-GB $44.39 99.3% $35,142 $34,851 $19,036 $2,259 (0.2%) (2.8%) 8.4% 11.9% 24.1x 1.83x 15.4x 1.69x 13.8x
B&G Foods, Inc. BGS 32.55 66.2% 2,164 3,934 1,518 310 25.1% 24.1% 29.0% 20.4% 21.4x 2.59x 12.7x 2.38x 10.9x
Campbell Soup Company CPB 46.65 72.6% 14,020 17,236 7,890 1,987 (0.9%) (1.5%) 42.6% 25.2% 16.1x 2.18x 8.7x 2.19x 9.6x
Conagra Brands, Inc. CAG 34.50 70.6% 14,093 17,220 6,964 1,229 (18.4%) (23.1%) 29.3% 17.6% 24.3x 2.47x 14.0x 2.22x 11.5x
General Mills, Inc. GIS 51.81 80.9% 29,446 40,059 15,481 3,279 (4.8%) (4.6%) 35.1% 21.2% 18.6x 2.59x 12.2x 2.58x 11.8x
Hormel Foods Corporation HRL 31.52 81.2% 16,637 16,257 9,303 1,406 0.1% 0.8% 20.4% 15.1% 19.5x 1.75x 11.6x 1.77x 11.5x
Kellogg Company K 61.91 79.0% 21,367 29,307 12,798 3,574 (2.6%) (4.4%) 40.8% 27.9% 28.0x 2.29x 8.2x 2.31x 11.2x
McCormick & Company, Incorporated MKC 99.13 93.1% 12,974 18,197 4,570 820 4.2% 2.5% 41.3% 17.9% 27.4x 3.98x 22.2x 3.73x 19.5x
Nestle S.A. NESN-CH 86.29 96.2% 268,562 290,350 90,161 17,410 (0.8%) (3.2%) 50.2% 19.3% 28.0x 3.22x 16.7x 3.13x 16.3x
Pinnacle Foods, Inc. PF 57.26 85.9% 6,802 9,651 3,128 675 9.0% 7.1% 25.9% 21.6% 37.4x 3.09x 14.3x 3.06x 14.0x
Post Holdings, Inc. POST 87.03 97.7% 5,758 9,670 5,038 928 NM 44.8% 27.5% 18.4% NA 1.92x 10.4x 1.80x 9.4x
Hershey Company HSY 110.94 95.2% 16,844 19,616 7,516 1,768 2.5% 1.2% 48.2% 23.5% 35.3x 2.61x 11.1x 2.61x 10.7x
J. M. Smucker Company SJM 105.96 73.7% 12,035 17,080 7,325 1,631 (4.6%) 9.5% 34.6% 22.3% 22.3x 2.33x 10.5x 2.31x 10.2x
Mean 0.7% 3.9% 33.3% 20.2% 25.2x 2.53x 12.9x 2.44x 12.3x
Median (0.5%) 0.8% 34.6% 20.4% 24.2x 2.47x 12.2x 2.31x 11.5x
Private Label Foods and Beverages
Cott Corporation BCB-CA $15.19 93.9% $2,113 $4,297 $3,729 $379 30.1% 22.1% 33.7% 10.2% NA 1.15x 11.3x 1.14x 10.7x
Lamb Weston Holdings, Inc. LW-US 50.69 99.7% 7,409 9,825 3,209 660 6.2% 4.5% 23.7% 20.6% 22.7x 3.06x 14.9x 3.02x 13.1x
Seneca Foods Corporation SENEA 35.40 83.0% 353 730 1,273 54 (2.2%) (1.9%) 5.6% 4.3% 30.0x 0.57x 13.4x NA NA
TreeHouse Foods, Inc. THS 68.72 76.0% 3,930 6,383 6,432 727 43.7% 37.5% 16.2% 11.3% NA 0.99x 8.8x 1.01x 9.2x
Mean 19.5% 15.5% 19.8% 11.6% 26.4x 1.45x 12.1x 1.72x 11.0x
Median 18.2% 13.3% 19.9% 10.7% 26.4x 1.07x 12.4x 1.14x 10.7x
Natural / Organic Foods / Better-For-You
Amplify Snack Brands Inc BETR $7.45 47.3% $572 $1,147 $345 $79 67.0% 83.6% 36.3% 22.9% 46.6x 3.33x 14.5x 2.96x 12.4x
Hain Celestial Group, Inc. HAIN 41.51 91.0% 4,346 4,949 2,853 220 (1.1%) 9.8% 20.0% 7.7% NM 1.73x 22.5x 1.70x 15.8x
The Simply Good Foods Company SMPL 12.01 92.0% 847 1,107 345 72 NA NA NA 20.8% NA 3.21x 15.4x 2.75x 15.4x
SunOpta Inc. SOY-CA 9.52 93.3% 824 1,291 1,323 47 8.3% 1.6% 11.3% 3.6% NA 0.98x 27.5x 0.98x 16.7x
Mean 24.7% 31.7% 22.5% 13.7% 46.6x 2.31x 20.0x 2.10x 15.1x
Median 8.3% 9.8% 20.0% 14.2% 46.6x 2.47x 19.0x 2.22x 15.6x
Baked Goods
Aryzta AG ARYN-CH $31.85 69.6% $2,924 $5,813 $4,152 $460 (3.6%) (3.5%) 27.1% 11.1% NA 1.40x 12.6x 1.32x 11.9x
Flowers Foods, Inc. FLO 18.95 90.3% 3,967 4,821 3,902 411 0.5% 1.2% 45.8% 10.5% 25.3x 1.24x 11.7x 1.24x 11.0x
George Weston Limited WN-CA 88.42 94.6% 11,311 24,880 36,458 3,221 1.6% 2.2% 29.6% 8.8% 23.5x 0.68x 7.7x 0.64x 7.6x
Grupo Bimbo SAB de CV BIMBOA-MX 2.33 81.0% 10,972 14,838 13,710 1,590 1.3% 0.0% 54.1% 11.6% 40.9x 1.08x 9.3x 1.05x 9.8x
Lancaster Colony Corporation LANC 121.30 81.2% 3,329 3,186 1,202 217 0.9% 4.9% 24.7% 18.1% 28.9x 2.65x 14.7x 2.62x 14.6x
Mean 0.1% 1.0% 36.3% 12.0% 29.6x 1.41x 11.2x 1.37x 11.0x
Median 0.9% 1.2% 29.6% 11.1% 27.1x 1.24x 11.7x 1.24x 11.0x
LTM EV / LTM EV / 2017ERevenue Growth LTM Margins
PAGE |
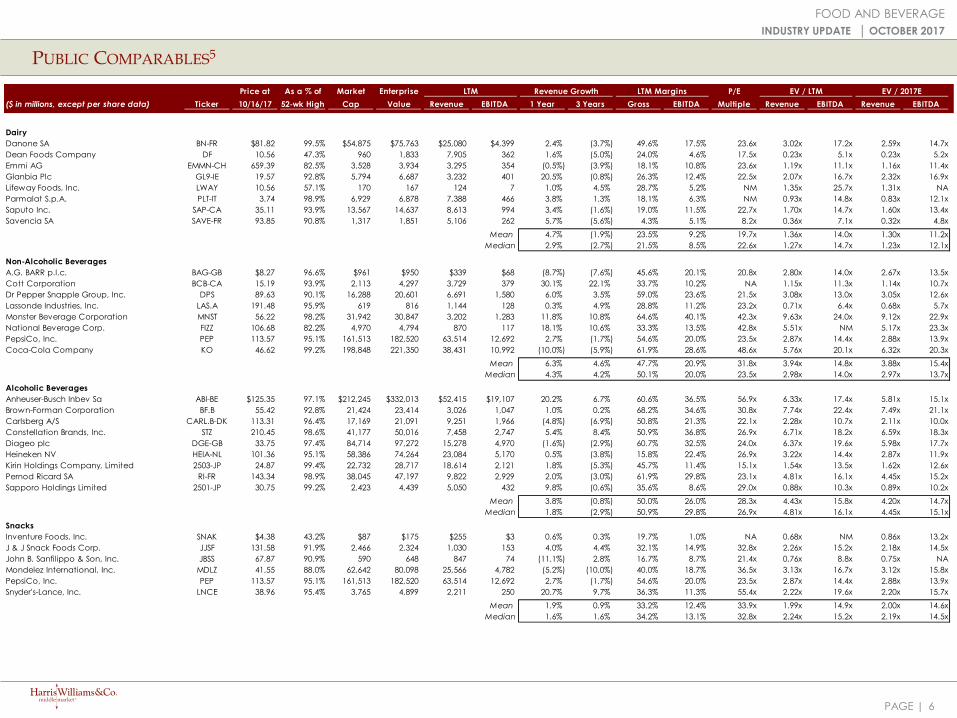
PUBLIC COMPARABLES5
FOOD AND BEVERAGE
INDUSTRY UPDATE │ OCTOBER 2017
6
Price at As a % of Market Enterprise P/E
($ in millions, except per share data) Ticker 10/16/17 52-wk High Cap Value Revenue EBITDA 1 Year 3 Years Gross EBITDA Multiple Revenue EBITDA Revenue EBITDA
Dairy
Danone SA BN-FR $81.82 99.5% $54,875 $75,763 $25,080 $4,399 2.4% (3.7%) 49.6% 17.5% 23.6x 3.02x 17.2x 2.59x 14.7x
Dean Foods Company DF 10.56 47.3% 960 1,833 7,905 362 1.6% (5.0%) 24.0% 4.6% 17.5x 0.23x 5.1x 0.23x 5.2x
Emmi AG EMMN-CH 659.39 82.5% 3,528 3,934 3,295 354 (0.5%) (3.9%) 18.1% 10.8% 23.6x 1.19x 11.1x 1.16x 11.4x
Glanbia Plc GL9-IE 19.57 92.8% 5,794 6,687 3,232 401 20.5% (0.8%) 26.3% 12.4% 22.5x 2.07x 16.7x 2.32x 16.9x
Lifeway Foods, Inc. LWAY 10.56 57.1% 170 167 124 7 1.0% 4.5% 28.7% 5.2% NM 1.35x 25.7x 1.31x NA
Parmalat S.p.A. PLT-IT 3.74 98.9% 6,929 6,878 7,388 466 3.8% 1.3% 18.1% 6.3% NM 0.93x 14.8x 0.83x 12.1x
Saputo Inc. SAP-CA 35.11 93.9% 13,567 14,637 8,613 994 3.4% (1.6%) 19.0% 11.5% 22.7x 1.70x 14.7x 1.60x 13.4x
Savencia SA SAVE-FR 93.85 90.8% 1,317 1,851 5,106 262 5.7% (5.6%) 4.3% 5.1% 8.2x 0.36x 7.1x 0.32x 4.8x
Mean 4.7% (1.9%) 23.5% 9.2% 19.7x 1.36x 14.0x 1.30x 11.2x
Median 2.9% (2.7%) 21.5% 8.5% 22.6x 1.27x 14.7x 1.23x 12.1x
Non-Alcoholic Beverages
A.G. BARR p.l.c. BAG-GB $8.27 96.6% $961 $950 $339 $68 (8.7%) (7.6%) 45.6% 20.1% 20.8x 2.80x 14.0x 2.67x 13.5x
Cott Corporation BCB-CA 15.19 93.9% 2,113 4,297 3,729 379 30.1% 22.1% 33.7% 10.2% NA 1.15x 11.3x 1.14x 10.7x
Dr Pepper Snapple Group, Inc. DPS 89.63 90.1% 16,288 20,601 6,691 1,580 6.0% 3.5% 59.0% 23.6% 21.5x 3.08x 13.0x 3.05x 12.6x
Lassonde Industries, Inc. LAS.A 191.48 95.9% 619 816 1,144 128 0.3% 4.9% 28.8% 11.2% 23.2x 0.71x 6.4x 0.68x 5.7x
Monster Beverage Corporation MNST 56.22 98.2% 31,942 30,847 3,202 1,283 11.8% 10.8% 64.6% 40.1% 42.3x 9.63x 24.0x 9.12x 22.9x
National Beverage Corp. FIZZ 106.68 82.2% 4,970 4,794 870 117 18.1% 10.6% 33.3% 13.5% 42.8x 5.51x NM 5.17x 23.3x
PepsiCo, Inc. PEP 113.57 95.1% 161,513 182,520 63,514 12,692 2.7% (1.7%) 54.6% 20.0% 23.5x 2.87x 14.4x 2.88x 13.9x
Coca-Cola Company KO 46.62 99.2% 198,848 221,350 38,431 10,992 (10.0%) (5.9%) 61.9% 28.6% 48.6x 5.76x 20.1x 6.32x 20.3x
Mean 6.3% 4.6% 47.7% 20.9% 31.8x 3.94x 14.8x 3.88x 15.4x
Median 4.3% 4.2% 50.1% 20.0% 23.5x 2.98x 14.0x 2.97x 13.7x
Alcoholic Beverages
Anheuser-Busch Inbev Sa ABI-BE $125.35 97.1% $212,245 $332,013 $52,415 $19,107 20.2% 6.7% 60.6% 36.5% 56.9x 6.33x 17.4x 5.81x 15.1x
Brown-Forman Corporation BF.B 55.42 92.8% 21,424 23,414 3,026 1,047 1.0% 0.2% 68.2% 34.6% 30.8x 7.74x 22.4x 7.49x 21.1x
Carlsberg A/S CARL.B-DK 113.31 96.4% 17,169 21,091 9,251 1,966 (4.8%) (6.9%) 50.8% 21.3% 22.1x 2.28x 10.7x 2.11x 10.0x
Constellation Brands, Inc. STZ 210.45 98.6% 41,177 50,016 7,458 2,747 5.4% 8.4% 50.9% 36.8% 26.9x 6.71x 18.2x 6.59x 18.3x
Diageo plc DGE-GB 33.75 97.4% 84,714 97,272 15,278 4,970 (1.6%) (2.9%) 60.7% 32.5% 24.0x 6.37x 19.6x 5.98x 17.7x
Heineken NV HEIA-NL 101.36 95.1% 58,386 74,264 23,084 5,170 0.5% (3.8%) 15.8% 22.4% 26.9x 3.22x 14.4x 2.87x 11.9x
Kirin Holdings Company, Limited 2503-JP 24.87 99.4% 22,732 28,717 18,614 2,121 1.8% (5.3%) 45.7% 11.4% 15.1x 1.54x 13.5x 1.62x 12.6x
Pernod Ricard SA RI-FR 143.34 98.9% 38,045 47,197 9,822 2,929 2.0% (3.0%) 61.9% 29.8% 23.1x 4.81x 16.1x 4.45x 15.2x
Sapporo Holdings Limited 2501-JP 30.75 99.2% 2,423 4,439 5,050 432 9.8% (0.6%) 35.6% 8.6% 29.0x 0.88x 10.3x 0.89x 10.2x
Mean 3.8% (0.8%) 50.0% 26.0% 28.3x 4.43x 15.8x 4.20x 14.7x
Median 1.8% (2.9%) 50.9% 29.8% 26.9x 4.81x 16.1x 4.45x 15.1x
Snacks
Inventure Foods, Inc. SNAK $4.38 43.2% $87 $175 $255 $3 0.6% 0.3% 19.7% 1.0% NA 0.68x NM 0.86x 13.2x
J & J Snack Foods Corp. JJSF 131.58 91.9% 2,466 2,324 1,030 153 4.0% 4.4% 32.1% 14.9% 32.8x 2.26x 15.2x 2.18x 14.5x
John B. Sanfilippo & Son, Inc. JBSS 67.87 90.9% 590 648 847 74 (11.1%) 2.8% 16.7% 8.7% 21.4x 0.76x 8.8x 0.75x NA
Mondelez International, Inc. MDLZ 41.55 88.0% 62,642 80,098 25,566 4,782 (5.2%) (10.0%) 40.0% 18.7% 36.5x 3.13x 16.7x 3.12x 15.8x
PepsiCo, Inc. PEP 113.57 95.1% 161,513 182,520 63,514 12,692 2.7% (1.7%) 54.6% 20.0% 23.5x 2.87x 14.4x 2.88x 13.9x
Snyder's-Lance, Inc. LNCE 38.96 95.4% 3,765 4,899 2,211 250 20.7% 9.7% 36.3% 11.3% 55.4x 2.22x 19.6x 2.20x 15.7x
Mean 1.9% 0.9% 33.2% 12.4% 33.9x 1.99x 14.9x 2.00x 14.6x
Median 1.6% 1.6% 34.2% 13.1% 32.8x 2.24x 15.2x 2.19x 14.5x
LTM EV / LTMRevenue Growth LTM Margins EV / 2017E
PAGE |
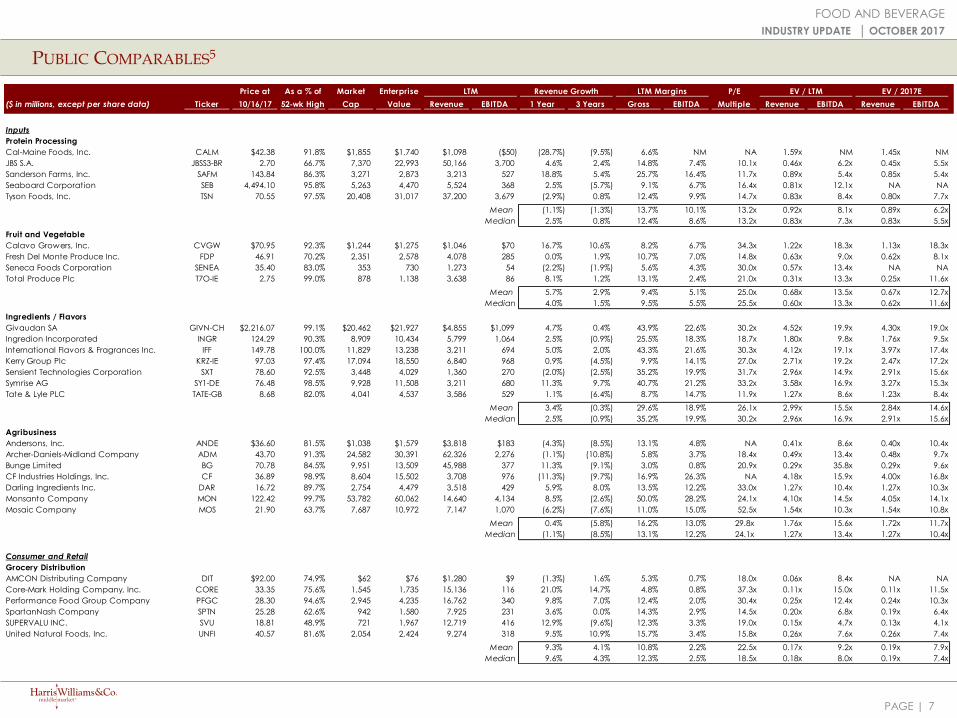
PUBLIC COMPARABLES5
FOOD AND BEVERAGE
INDUSTRY UPDATE │ OCTOBER 2017
7
Price at As a % of Market Enterprise P/E
($ in millions, except per share data) Ticker 10/16/17 52-wk High Cap Value Revenue EBITDA 1 Year 3 Years Gross EBITDA Multiple Revenue EBITDA Revenue EBITDA
Inputs
Protein Processing
Cal-Maine Foods, Inc. CALM $42.38 91.8% $1,855 $1,740 $1,098 ($50) (28.7%) (9.5%) 6.6% NM NA 1.59x NM 1.45x NM
JBS S.A. JBSS3-BR 2.70 66.7% 7,370 22,993 50,166 3,700 4.6% 2.4% 14.8% 7.4% 10.1x 0.46x 6.2x 0.45x 5.5x
Sanderson Farms, Inc. SAFM 143.84 86.3% 3,271 2,873 3,213 527 18.8% 5.4% 25.7% 16.4% 11.7x 0.89x 5.4x 0.85x 5.4x
Seaboard Corporation SEB 4,494.10 95.8% 5,263 4,470 5,524 368 2.5% (5.7%) 9.1% 6.7% 16.4x 0.81x 12.1x NA NA
Tyson Foods, Inc. TSN 70.55 97.5% 20,408 31,017 37,200 3,679 (2.9%) 0.8% 12.4% 9.9% 14.7x 0.83x 8.4x 0.80x 7.7x
Mean (1.1%) (1.3%) 13.7% 10.1% 13.2x 0.92x 8.1x 0.89x 6.2x
Median 2.5% 0.8% 12.4% 8.6% 13.2x 0.83x 7.3x 0.83x 5.5x
Fruit and Vegetable
Calavo Growers, Inc. CVGW $70.95 92.3% $1,244 $1,275 $1,046 $70 16.7% 10.6% 8.2% 6.7% 34.3x 1.22x 18.3x 1.13x 18.3x
Fresh Del Monte Produce Inc. FDP 46.91 70.2% 2,351 2,578 4,078 285 0.0% 1.9% 10.7% 7.0% 14.8x 0.63x 9.0x 0.62x 8.1x
Seneca Foods Corporation SENEA 35.40 83.0% 353 730 1,273 54 (2.2%) (1.9%) 5.6% 4.3% 30.0x 0.57x 13.4x NA NA
Total Produce Plc T7O-IE 2.75 99.0% 878 1,138 3,638 86 8.1% 1.2% 13.1% 2.4% 21.0x 0.31x 13.3x 0.25x 11.6x
Mean 5.7% 2.9% 9.4% 5.1% 25.0x 0.68x 13.5x 0.67x 12.7x
Median 4.0% 1.5% 9.5% 5.5% 25.5x 0.60x 13.3x 0.62x 11.6x
Ingredients / Flavors
Givaudan SA GIVN-CH $2,216.07 99.1% $20,462 $21,927 $4,855 $1,099 4.7% 0.4% 43.9% 22.6% 30.2x 4.52x 19.9x 4.30x 19.0x
Ingredion Incorporated INGR 124.29 90.3% 8,909 10,434 5,799 1,064 2.5% (0.9%) 25.5% 18.3% 18.7x 1.80x 9.8x 1.76x 9.5x
International Flavors & Fragrances Inc. IFF 149.78 100.0% 11,829 13,238 3,211 694 5.0% 2.0% 43.3% 21.6% 30.3x 4.12x 19.1x 3.97x 17.4x
Kerry Group Plc KRZ-IE 97.03 97.4% 17,094 18,550 6,840 968 0.9% (4.5%) 9.9% 14.1% 27.0x 2.71x 19.2x 2.47x 17.2x
Sensient Technologies Corporation SXT 78.60 92.5% 3,448 4,029 1,360 270 (2.0%) (2.5%) 35.2% 19.9% 31.7x 2.96x 14.9x 2.91x 15.6x
Symrise AG SY1-DE 76.48 98.5% 9,928 11,508 3,211 680 11.3% 9.7% 40.7% 21.2% 33.2x 3.58x 16.9x 3.27x 15.3x
Tate & Lyle PLC TATE-GB 8.68 82.0% 4,041 4,537 3,586 529 1.1% (6.4%) 8.7% 14.7% 11.9x 1.27x 8.6x 1.23x 8.4x
Mean 3.4% (0.3%) 29.6% 18.9% 26.1x 2.99x 15.5x 2.84x 14.6x
Median 2.5% (0.9%) 35.2% 19.9% 30.2x 2.96x 16.9x 2.91x 15.6x
Agribusiness
Andersons, Inc. ANDE $36.60 81.5% $1,038 $1,579 $3,818 $183 (4.3%) (8.5%) 13.1% 4.8% NA 0.41x 8.6x 0.40x 10.4x
Archer-Daniels-Midland Company ADM 43.70 91.3% 24,582 30,391 62,326 2,276 (1.1%) (10.8%) 5.8% 3.7% 18.4x 0.49x 13.4x 0.48x 9.7x
Bunge Limited BG 70.78 84.5% 9,951 13,509 45,988 377 11.3% (9.1%) 3.0% 0.8% 20.9x 0.29x 35.8x 0.29x 9.6x
CF Industries Holdings, Inc. CF 36.89 98.9% 8,604 15,502 3,708 976 (11.3%) (9.7%) 16.9% 26.3% NA 4.18x 15.9x 4.00x 16.8x
Darling Ingredients Inc. DAR 16.72 89.7% 2,754 4,479 3,518 429 5.9% 8.0% 13.5% 12.2% 33.0x 1.27x 10.4x 1.27x 10.3x
Monsanto Company MON 122.42 99.7% 53,782 60,062 14,640 4,134 8.5% (2.6%) 50.0% 28.2% 24.1x 4.10x 14.5x 4.05x 14.1x
Mosaic Company MOS 21.90 63.7% 7,687 10,972 7,147 1,070 (6.2%) (7.6%) 11.0% 15.0% 52.5x 1.54x 10.3x 1.54x 10.8x
Mean 0.4% (5.8%) 16.2% 13.0% 29.8x 1.76x 15.6x 1.72x 11.7x
Median (1.1%) (8.5%) 13.1% 12.2% 24.1x 1.27x 13.4x 1.27x 10.4x
Consumer and Retail
Grocery Distribution
AMCON Distributing Company DIT $92.00 74.9% $62 $76 $1,280 $9 (1.3%) 1.6% 5.3% 0.7% 18.0x 0.06x 8.4x NA NA
Core-Mark Holding Company, Inc. CORE 33.35 75.6% 1,545 1,735 15,136 116 21.0% 14.7% 4.8% 0.8% 37.3x 0.11x 15.0x 0.11x 11.5x
Performance Food Group Company PFGC 28.30 94.6% 2,945 4,235 16,762 340 9.8% 7.0% 12.4% 2.0% 30.4x 0.25x 12.4x 0.24x 10.3x
SpartanNash Company SPTN 25.28 62.6% 942 1,580 7,925 231 3.6% 0.0% 14.3% 2.9% 14.5x 0.20x 6.8x 0.19x 6.4x
SUPERVALU INC. SVU 18.81 48.9% 721 1,967 12,719 416 12.9% (9.6%) 12.3% 3.3% 19.0x 0.15x 4.7x 0.13x 4.1x
United Natural Foods, Inc. UNFI 40.57 81.6% 2,054 2,424 9,274 318 9.5% 10.9% 15.7% 3.4% 15.8x 0.26x 7.6x 0.26x 7.4x
Mean 9.3% 4.1% 10.8% 2.2% 22.5x 0.17x 9.2x 0.19x 7.9x
Median 9.6% 4.3% 12.3% 2.5% 18.5x 0.18x 8.0x 0.19x 7.4x
LTM Margins EV / 2017ELTM Revenue Growth EV / LTM
PAGE |
PUBLIC COMPARABLES5
FOOD AND BEVERAGE
INDUSTRY UPDATE │ OCTOBER 2017
8
Price at As a % of Market Enterprise P/E
($ in millions, except per share data) Ticker 10/16/17 52-wk High Cap Value Revenue EBITDA 1 Year 3 Years Gross EBITDA Multiple Revenue EBITDA Revenue EBITDA
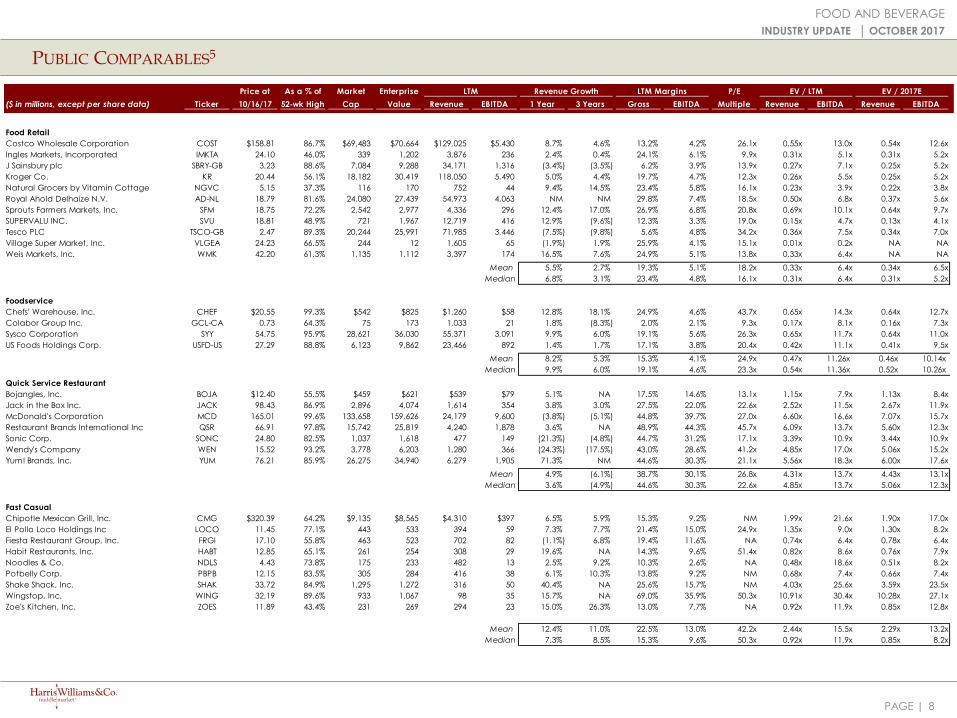
Food Retail
Costco Wholesale Corporation COST $158.81 86.7% $69,483 $70,664 $129,025 $5,430 8.7% 4.6% 13.2% 4.2% 26.1x 0.55x 13.0x 0.54x 12.6x
Ingles Markets, Incorporated IMKTA 24.10 46.0% 339 1,202 3,876 236 2.4% 0.4% 24.1% 6.1% 9.9x 0.31x 5.1x 0.31x 5.2x
J Sainsbury plc SBRY-GB 3.23 88.6% 7,084 9,288 34,171 1,316 (3.4%) (3.5%) 6.2% 3.9% 13.9x 0.27x 7.1x 0.25x 5.2x
Kroger Co. KR 20.44 56.1% 18,182 30,419 118,050 5,490 5.0% 4.4% 19.7% 4.7% 12.3x 0.26x 5.5x 0.25x 5.2x
Natural Grocers by Vitamin Cottage NGVC 5.15 37.3% 116 170 752 44 9.4% 14.5% 23.4% 5.8% 16.1x 0.23x 3.9x 0.22x 3.8x
Royal Ahold Delhaize N.V. AD-NL 18.79 81.6% 24,080 27,439 54,973 4,063 NM NM 29.8% 7.4% 18.5x 0.50x 6.8x 0.37x 5.6x
Sprouts Farmers Markets, Inc. SFM 18.75 72.2% 2,542 2,977 4,336 296 12.4% 17.0% 26.9% 6.8% 20.8x 0.69x 10.1x 0.64x 9.7x
SUPERVALU INC. SVU 18.81 48.9% 721 1,967 12,719 416 12.9% (9.6%) 12.3% 3.3% 19.0x 0.15x 4.7x 0.13x 4.1x
Tesco PLC TSCO-GB 2.47 89.3% 20,244 25,991 71,985 3,446 (7.5%) (9.8%) 5.6% 4.8% 34.2x 0.36x 7.5x 0.34x 7.0x
Village Super Market, Inc. VLGEA 24.23 66.5% 244 12 1,605 65 (1.9%) 1.9% 25.9% 4.1% 15.1x 0.01x 0.2x NA NA
Weis Markets, Inc. WMK 42.20 61.3% 1,135 1,112 3,397 174 16.5% 7.6% 24.9% 5.1% 13.8x 0.33x 6.4x NA NA
Mean 5.5% 2.7% 19.3% 5.1% 18.2x 0.33x 6.4x 0.34x 6.5x
Median 6.8% 3.1% 23.4% 4.8% 16.1x 0.31x 6.4x 0.31x 5.2x
Foodservice
Chefs' Warehouse, Inc. CHEF $20.55 99.3% $542 $825 $1,260 $58 12.8% 18.1% 24.9% 4.6% 43.7x 0.65x 14.3x 0.64x 12.7x
Colabor Group Inc. GCL-CA 0.73 64.3% 75 173 1,033 21 1.8% (8.3%) 2.0% 2.1% 9.3x 0.17x 8.1x 0.16x 7.3x
Sysco Corporation SYY 54.75 95.9% 28,621 36,030 55,371 3,091 9.9% 6.0% 19.1% 5.6% 26.3x 0.65x 11.7x 0.64x 11.0x
US Foods Holdings Corp. USFD-US 27.29 88.8% 6,123 9,862 23,466 892 1.4% 1.7% 17.1% 3.8% 20.4x 0.42x 11.1x 0.41x 9.5x
Mean 8.2% 5.3% 15.3% 4.1% 24.9x 0.47x 11.26x 0.46x 10.14x
Median 9.9% 6.0% 19.1% 4.6% 23.3x 0.54x 11.36x 0.52x 10.26x
Quick Service Restaurant
Bojangles, Inc. BOJA $12.40 55.5% $459 $621 $539 $79 5.1% NA 17.5% 14.6% 13.1x 1.15x 7.9x 1.13x 8.4x
Jack in the Box Inc. JACK 98.43 86.9% 2,896 4,074 1,614 354 3.8% 3.0% 27.5% 22.0% 22.6x 2.52x 11.5x 2.67x 11.9x
McDonald's Corporation MCD 165.01 99.6% 133,658 159,626 24,179 9,600 (3.8%) (5.1%) 44.8% 39.7% 27.0x 6.60x 16.6x 7.07x 15.7x
Restaurant Brands International Inc QSR 66.91 97.8% 15,742 25,819 4,240 1,878 3.6% NA 48.9% 44.3% 45.7x 6.09x 13.7x 5.60x 12.3x
Sonic Corp. SONC 24.80 82.5% 1,037 1,618 477 149 (21.3%) (4.8%) 44.7% 31.2% 17.1x 3.39x 10.9x 3.44x 10.9x
Wendy's Company WEN 15.52 93.2% 3,778 6,203 1,280 366 (24.3%) (17.5%) 43.0% 28.6% 41.2x 4.85x 17.0x 5.06x 15.2x
Yum! Brands, Inc. YUM 76.21 85.9% 26,275 34,940 6,279 1,905 71.3% NM 44.6% 30.3% 21.1x 5.56x 18.3x 6.00x 17.6x
Mean 4.9% (6.1%) 38.7% 30.1% 26.8x 4.31x 13.7x 4.43x 13.1x
Median 3.6% (4.9%) 44.6% 30.3% 22.6x 4.85x 13.7x 5.06x 12.3x
Fast Casual
Chipotle Mexican Grill, Inc. CMG $320.39 64.2% $9,135 $8,565 $4,310 $397 6.5% 5.9% 15.3% 9.2% NM 1.99x 21.6x 1.90x 17.0x
El Pollo Loco Holdings Inc LOCO 11.45 77.1% 443 533 394 59 7.3% 7.7% 21.4% 15.0% 24.9x 1.35x 9.0x 1.30x 8.2x
Fiesta Restaurant Group, Inc. FRGI 17.10 55.8% 463 523 702 82 (1.1%) 6.8% 19.4% 11.6% NA 0.74x 6.4x 0.78x 6.4x
Habit Restaurants, Inc. HABT 12.85 65.1% 261 254 308 29 19.6% NA 14.3% 9.6% 51.4x 0.82x 8.6x 0.76x 7.9x
Noodles & Co. NDLS 4.43 73.8% 175 233 482 13 2.5% 9.2% 10.3% 2.6% NA 0.48x 18.6x 0.51x 8.2x
Potbelly Corp. PBPB 12.15 83.5% 305 284 416 38 6.1% 10.3% 13.8% 9.2% NM 0.68x 7.4x 0.66x 7.4x
Shake Shack, Inc. SHAK 33.72 84.9% 1,295 1,272 316 50 40.4% NA 25.6% 15.7% NM 4.03x 25.6x 3.59x 23.5x
Wingstop, Inc. WING 32.19 89.6% 933 1,067 98 35 15.7% NA 69.0% 35.9% 50.3x 10.91x 30.4x 10.28x 27.1x
Zoe's Kitchen, Inc. ZOES 11.89 43.4% 231 269 294 23 15.0% 26.3% 13.0% 7.7% NA 0.92x 11.9x 0.85x 12.8x
Mean 12.4% 11.0% 22.5% 13.0% 42.2x 2.44x 15.5x 2.29x 13.2x
Median 7.3% 8.5% 15.3% 9.6% 50.3x 0.92x 11.9x 0.85x 8.2x
LTM Revenue Growth LTM Margins EV / LTM EV / 2017E
PAGE |
PUBLIC COMPARABLES5
FOOD AND BEVERAGE
INDUSTRY UPDATE │ OCTOBER 2017
9
Price at As a % of Market Enterprise P/E
($ in millions, except per share data) Ticker 10/16/17 52-wk High Cap Value Revenue EBITDA 1 Year 3 Years Gross EBITDA Multiple Revenue EBITDA Revenue EBITDA
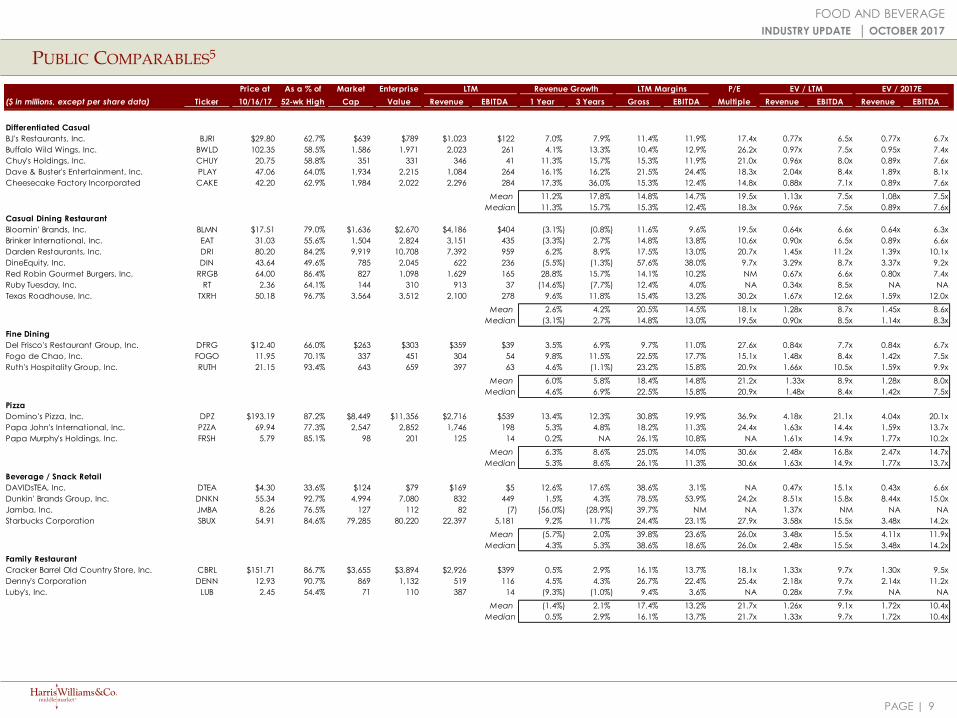
Differentiated Casual
BJ's Restaurants, Inc. BJRI $29.80 62.7% $639 $789 $1,023 $122 7.0% 7.9% 11.4% 11.9% 17.4x 0.77x 6.5x 0.77x 6.7x
Buffalo Wild Wings, Inc. BWLD 102.35 58.5% 1,586 1,971 2,023 261 4.1% 13.3% 10.4% 12.9% 26.2x 0.97x 7.5x 0.95x 7.4x
Chuy's Holdings, Inc. CHUY 20.75 58.8% 351 331 346 41 11.3% 15.7% 15.3% 11.9% 21.0x 0.96x 8.0x 0.89x 7.6x
Dave & Buster's Entertainment, Inc. PLAY 47.06 64.0% 1,934 2,215 1,084 264 16.1% 16.2% 21.5% 24.4% 18.3x 2.04x 8.4x 1.89x 8.1x
Cheesecake Factory Incorporated CAKE 42.20 62.9% 1,984 2,022 2,296 284 17.3% 36.0% 15.3% 12.4% 14.8x 0.88x 7.1x 0.89x 7.6x
Mean 11.2% 17.8% 14.8% 14.7% 19.5x 1.13x 7.5x 1.08x 7.5x
Median 11.3% 15.7% 15.3% 12.4% 18.3x 0.96x 7.5x 0.89x 7.6x
Casual Dining Restaurant
Bloomin' Brands, Inc. BLMN $17.51 79.0% $1,636 $2,670 $4,186 $404 (3.1%) (0.8%) 11.6% 9.6% 19.5x 0.64x 6.6x 0.64x 6.3x
Brinker International, Inc. EAT 31.03 55.6% 1,504 2,824 3,151 435 (3.3%) 2.7% 14.8% 13.8% 10.6x 0.90x 6.5x 0.89x 6.6x
Darden Restaurants, Inc. DRI 80.20 84.2% 9,919 10,708 7,392 959 6.2% 8.9% 17.5% 13.0% 20.7x 1.45x 11.2x 1.39x 10.1x
DineEquity, Inc. DIN 43.64 49.6% 785 2,045 622 236 (5.5%) (1.3%) 57.6% 38.0% 9.7x 3.29x 8.7x 3.37x 9.2x
Red Robin Gourmet Burgers, Inc. RRGB 64.00 86.4% 827 1,098 1,629 165 28.8% 15.7% 14.1% 10.2% NM 0.67x 6.6x 0.80x 7.4x
Ruby Tuesday, Inc. RT 2.36 64.1% 144 310 913 37 (14.6%) (7.7%) 12.4% 4.0% NA 0.34x 8.5x NA NA
Texas Roadhouse, Inc. TXRH 50.18 96.7% 3,564 3,512 2,100 278 9.6% 11.8% 15.4% 13.2% 30.2x 1.67x 12.6x 1.59x 12.0x
Mean 2.6% 4.2% 20.5% 14.5% 18.1x 1.28x 8.7x 1.45x 8.6x
Median (3.1%) 2.7% 14.8% 13.0% 19.5x 0.90x 8.5x 1.14x 8.3x
Fine Dining
Del Frisco's Restaurant Group, Inc. DFRG $12.40 66.0% $263 $303 $359 $39 3.5% 6.9% 9.7% 11.0% 27.6x 0.84x 7.7x 0.84x 6.7x
Fogo de Chao, Inc. FOGO 11.95 70.1% 337 451 304 54 9.8% 11.5% 22.5% 17.7% 15.1x 1.48x 8.4x 1.42x 7.5x
Ruth's Hospitality Group, Inc. RUTH 21.15 93.4% 643 659 397 63 4.6% (1.1%) 23.2% 15.8% 20.9x 1.66x 10.5x 1.59x 9.9x
Mean 6.0% 5.8% 18.4% 14.8% 21.2x 1.33x 8.9x 1.28x 8.0x
Median 4.6% 6.9% 22.5% 15.8% 20.9x 1.48x 8.4x 1.42x 7.5x
Pizza
Domino's Pizza, Inc. DPZ $193.19 87.2% $8,449 $11,356 $2,716 $539 13.4% 12.3% 30.8% 19.9% 36.9x 4.18x 21.1x 4.04x 20.1x
Papa John's International, Inc. PZZA 69.94 77.3% 2,547 2,852 1,746 198 5.3% 4.8% 18.2% 11.3% 24.4x 1.63x 14.4x 1.59x 13.7x
Papa Murphy's Holdings, Inc. FRSH 5.79 85.1% 98 201 125 14 0.2% NA 26.1% 10.8% NA 1.61x 14.9x 1.77x 10.2x
Mean 6.3% 8.6% 25.0% 14.0% 30.6x 2.48x 16.8x 2.47x 14.7x
Median 5.3% 8.6% 26.1% 11.3% 30.6x 1.63x 14.9x 1.77x 13.7x
Beverage / Snack Retail
DAVIDsTEA, Inc. DTEA $4.30 33.6% $124 $79 $169 $5 12.6% 17.6% 38.6% 3.1% NA 0.47x 15.1x 0.43x 6.6x
Dunkin' Brands Group, Inc. DNKN 55.34 92.7% 4,994 7,080 832 449 1.5% 4.3% 78.5% 53.9% 24.2x 8.51x 15.8x 8.44x 15.0x
Jamba, Inc. JMBA 8.26 76.5% 127 112 82 (7) (56.0%) (28.9%) 39.7% NM NA 1.37x NM NA NA
Starbucks Corporation SBUX 54.91 84.6% 79,285 80,220 22,397 5,181 9.2% 11.7% 24.4% 23.1% 27.9x 3.58x 15.5x 3.48x 14.2x
Mean (5.7%) 2.0% 39.8% 23.6% 26.0x 3.48x 15.5x 4.11x 11.9x
Median 4.3% 5.3% 38.6% 18.6% 26.0x 2.48x 15.5x 3.48x 14.2x
Family Restaurant
Cracker Barrel Old Country Store, Inc. CBRL $151.71 86.7% $3,655 $3,894 $2,926 $399 0.5% 2.9% 16.1% 13.7% 18.1x 1.33x 9.7x 1.30x 9.5x
Denny's Corporation DENN 12.93 90.7% 869 1,132 519 116 4.5% 4.3% 26.7% 22.4% 25.4x 2.18x 9.7x 2.14x 11.2x
Luby's, Inc. LUB 2.45 54.4% 71 110 387 14 (9.3%) (1.0%) 9.4% 3.6% NA 0.28x 7.9x NA NA
Mean (1.4%) 2.1% 17.4% 13.2% 21.7x 1.26x 9.1x 1.72x 10.4x
Median 0.5% 2.9% 16.1% 13.7% 21.7x 1.33x 9.7x 1.72x 10.4x
LTM Revenue Growth LTM Margins EV / LTM EV / 2017E
PAGE |
PUBLIC EQUITY MARKET OVERVIEW
10
INDUSTRY UPDATE │ OCTOBER 2017
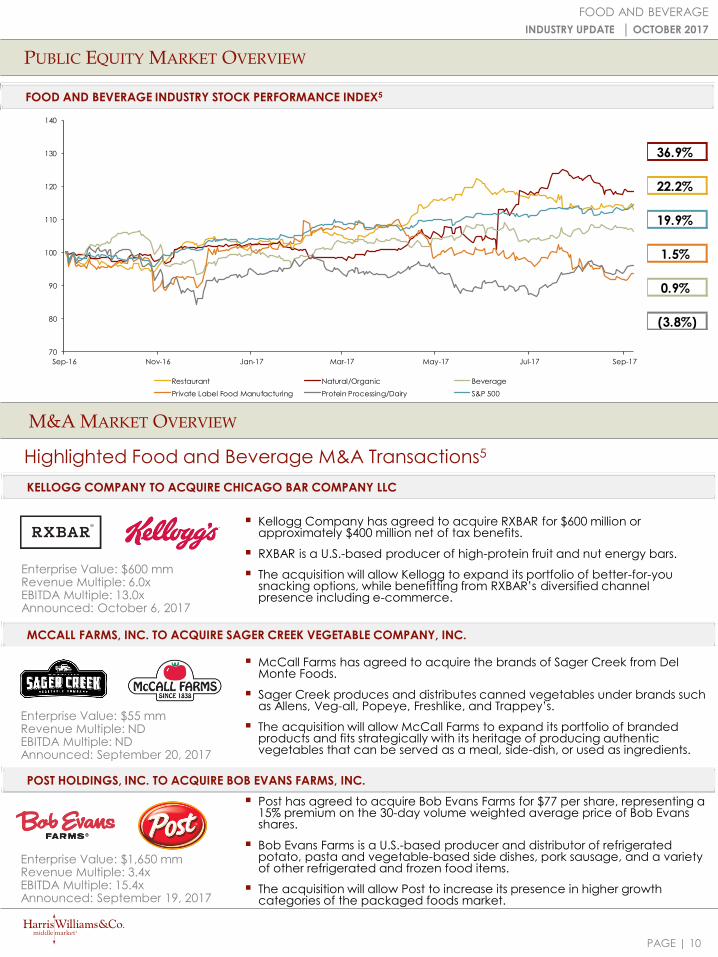
FOOD AND BEVERAGE INDUSTRY STOCK PERFORMANCE INDEX5
Highlighted Food and Beverage M&A Transactions5
M&A MARKET OVERVIEW
POST HOLDINGS, INC. TO ACQUIRE BOB EVANS FARMS, INC.
Enterprise Value: $1,650 mmRevenue Multiple: 3.4xEBITDA Multiple: 15.4xAnnounced: September 19, 2017
MCCALL FARMS, INC. TO ACQUIRE SAGER CREEK VEGETABLE COMPANY, INC.
KELLOGG COMPANY TO ACQUIRE CHICAGO BAR COMPANY LLC
Kellogg Company has agreed to acquire RXBAR for $600 million orapproximately $400 million net of tax benefits.
RXBAR is a U.S.-based producer of high-protein fruit and nut energy bars.
The acquisition will allow Kellogg to expand its portfolio of better-for-yousnacking options, while benefitting from RXBAR’s diversified channelpresence including e-commerce.
Enterprise Value: $55 mmRevenue Multiple: NDEBITDA Multiple: NDAnnounced: September 20, 2017
Post has agreed to acquire Bob Evans Farms for $77 per share, representing a15% premium on the 30-day volume weighted average price of Bob Evansshares.
Bob Evans Farms is a U.S.-based producer and distributor of refrigeratedpotato, pasta and vegetable-based side dishes, pork sausage, and a varietyof other refrigerated and frozen food items.
The acquisition will allow Post to increase its presence in higher growthcategories of the packaged foods market.
Enterprise Value: $600 mmRevenue Multiple: 6.0xEBITDA Multiple: 13.0xAnnounced: October 6, 2017
McCall Farms has agreed to acquire the brands of Sager Creek from DelMonte Foods.
Sager Creek produces and distributes canned vegetables under brands suchas Allens, Veg-all, Popeye, Freshlike, and Trappey’s.
The acquisition will allow McCall Farms to expand its portfolio of brandedproducts and fits strategically with its heritage of producing authenticvegetables that can be served as a meal, side-dish, or used as ingredients.
70
80
90
100
110
120
130
140
Sep-16 Nov-16 Jan-17 Mar-17 May-17 Jul-17 Sep-17
Restaurant Natural/Organic Beverage
Private Label Food Manufacturing Protein Processing/Dairy S&P 500
36.9%
22.2%
19.9%
1.5%
0.9%
(3.8%)
FOOD AND BEVERAGE
PAGE |
M&A MARKET OVERVIEW*
11
FOOD AND BEVERAGE
INDUSTRY UPDATE │ OCTOBER 2017
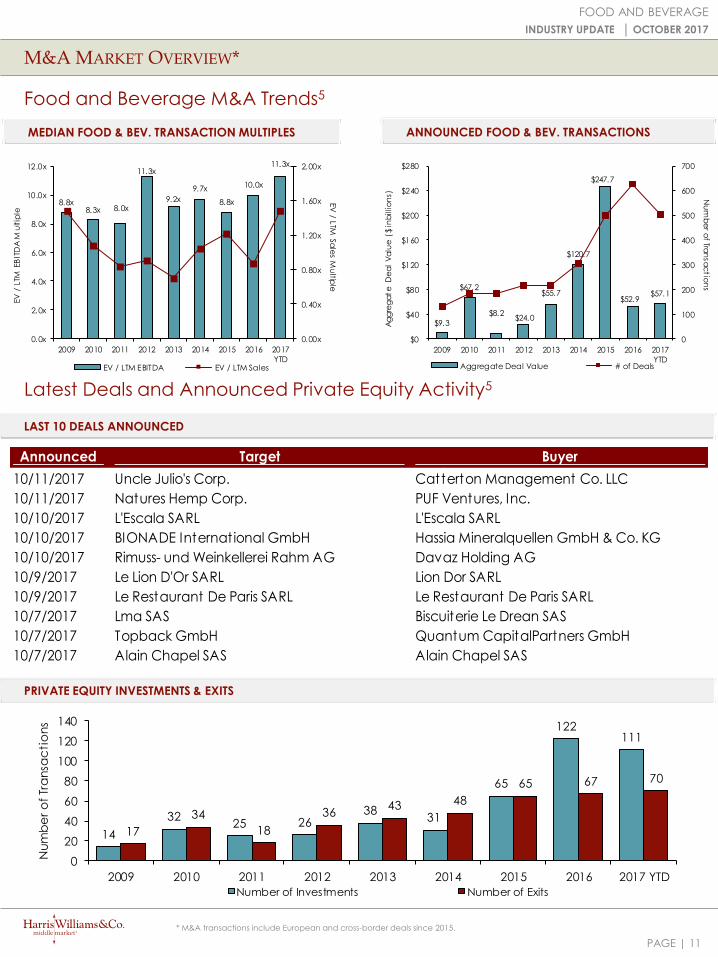
Food and Beverage M&A Trends5
MEDIAN FOOD & BEV. TRANSACTION MULTIPLES
PRIVATE EQUITY INVESTMENTS & EXITS
Latest Deals and Announced Private Equity Activity5
LAST 10 DEALS ANNOUNCED
ANNOUNCED FOOD & BEV. TRANSACTIONS
* M&A transactions include European and cross-border deals since 2015.
8.8x 8.3x 8.0x
11.3x
9.2x
9.7x
8.8x
10.0x
11.3x
0.00x
0.40x
0.80x
1.20x
1.60x
2.00x
0.0x
2.0x
4.0x
6.0x
8.0x
10.0x
12.0x
2009 2010 2011 2012 2013 2014 2015 2016 2017
YTD
EV
/ LTM
Sa
les M
ultip
le
EV
/ L
TM E
BIT
DA
Mu
ltip
le
EV / LTM EBITDA EV / LTM Sales
$9.3
$67.2
$8.2$24.0
$55.7
$120.7
$247.7
$52.9$57.1
0
100
200
300
400
500
600
700
$0
$40
$80
$120
$160
$200
$240
$280
2009 2010 2011 2012 2013 2014 2015 2016 2017
YTD
Nu
mb
er o
f Tran
sa
ctio
ns
Ag
gre
ga
te
D
ea
l V
alu
e (
$ in
billio
ns)
Aggregate Deal Value # of Deals
14
3225 26
3831
65
122111
17
34
18
3643 48
65 67 70
0
20
40
60
80
100
120
140
2009 2010 2011 2012 2013 2014 2015 2016 2017 YTD
Nu
mb
er
of
Tra
nsa
cti
on
s
Number of Investments Number of Exits
Announced Target Buyer1/0/1900 0 Cargill, Incorporated
10/11/2017 Uncle Julio's Corp. Catterton Management Co. LLC
10/11/2017 Natures Hemp Corp. PUF Ventures, Inc.
10/10/2017 L'Escala SARL L'Escala SARL
10/10/2017 BIONADE International GmbH Hassia Mineralquellen GmbH & Co. KG
10/10/2017 Rimuss- und Weinkellerei Rahm AG Davaz Holding AG
10/9/2017 Le Lion D'Or SARL Lion Dor SARL
10/9/2017 Le Restaurant De Paris SARL Le Restaurant De Paris SARL
10/7/2017 Lma SAS Biscuiterie Le Drean SAS
10/7/2017 Topback GmbH Quantum CapitalPartners GmbH
10/7/2017 Alain Chapel SAS Alain Chapel SAS
PAGE |
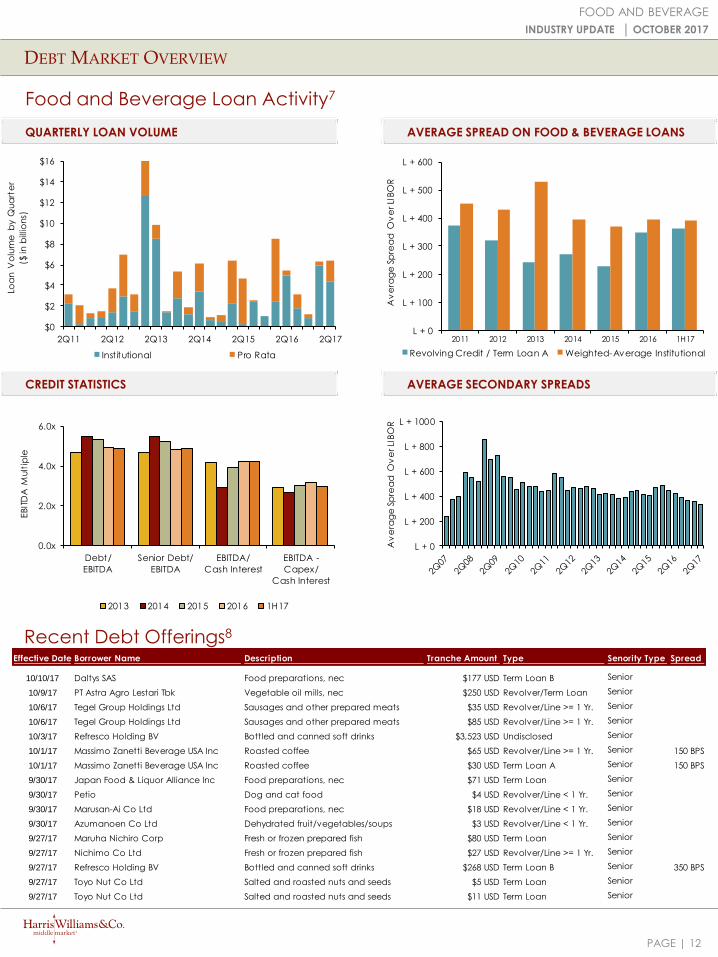
Effective Date Borrower Name Description Tranche Amount Type Senority Type Spread
10/10/17 Daltys SAS Food preparations, nec $177 USD Term Loan B Senior
10/9/17 PT Astra Agro Lestari Tbk Vegetable oil mills, nec $250 USD Revolver/Term Loan Senior
10/6/17 Tegel Group Holdings Ltd Sausages and other prepared meats $35 USD Revolver/Line >= 1 Yr. Senior
10/6/17 Tegel Group Holdings Ltd Sausages and other prepared meats $85 USD Revolver/Line >= 1 Yr. Senior
10/3/17 Refresco Holding BV Bottled and canned soft drinks $3,523 USD Undisclosed Senior
10/1/17 Massimo Zanetti Beverage USA Inc Roasted coffee $65 USD Revolver/Line >= 1 Yr. Senior 150 BPS
10/1/17 Massimo Zanetti Beverage USA Inc Roasted coffee $30 USD Term Loan A Senior 150 BPS
9/30/17 Japan Food & Liquor Alliance Inc Food preparations, nec $71 USD Term Loan Senior
9/30/17 Petio Dog and cat food $4 USD Revolver/Line < 1 Yr. Senior
9/30/17 Marusan-Ai Co Ltd Food preparations, nec $18 USD Revolver/Line < 1 Yr. Senior
9/30/17 Azumanoen Co Ltd Dehydrated fruit/vegetables/soups $3 USD Revolver/Line < 1 Yr. Senior
9/27/17 Maruha Nichiro Corp Fresh or frozen prepared fish $80 USD Term Loan Senior
9/27/17 Nichimo Co Ltd Fresh or frozen prepared fish $27 USD Revolver/Line >= 1 Yr. Senior
9/27/17 Refresco Holding BV Bottled and canned soft drinks $268 USD Term Loan B Senior 350 BPS
9/27/17 Toyo Nut Co Ltd Salted and roasted nuts and seeds $5 USD Term Loan Senior
9/27/17 Toyo Nut Co Ltd Salted and roasted nuts and seeds $11 USD Term Loan Senior
L + 0
L + 200
L + 400
L + 600
L + 800
L + 1000
Av
era
ge
Sp
rea
d O
ve
r LI
BO
R
$0
$2
$4
$6
$8
$10
$12
$14
$16
2Q11 2Q12 2Q13 2Q14 2Q15 2Q16 2Q17
Loa
n V
olu
me
by
Qu
art
er
($ in
bill
ion
s)
Inst itutional Pro Rata
AVERAGE SPREAD ON FOOD & BEVERAGE LOANS
DEBT MARKET OVERVIEW
12
FOOD AND BEVERAGE
INDUSTRY UPDATE │ OCTOBER 2017
Food and Beverage Loan Activity7
AVERAGE SECONDARY SPREADS
Recent Debt Offerings8
CREDIT STATISTICS
QUARTERLY LOAN VOLUME
0.0x
2.0x
4.0x
6.0x
Debt/
EBITDA
Senior Debt/
EBITDA
EBITDA/
Cash Interest
EBITDA -
Capex/
Cash Interest
EBIT
DA
Mult
iple
2013 2014 2015 2016 1H17
L + 0
L + 100
L + 200
L + 300
L + 400
L + 500
L + 600
2011 2012 2013 2014 2015 2016 1H17
Av
era
ge
Sp
rea
d O
ve
r LI
BO
R
Revolving Credit / Term Loan A Weighted-Average Institutional
PAGE |
Enterprise Enterprise Value Private Equity Geographic
Announced Target Seller Buyer
Value
($mm) Sales EBITDA EBIT Involvement Location
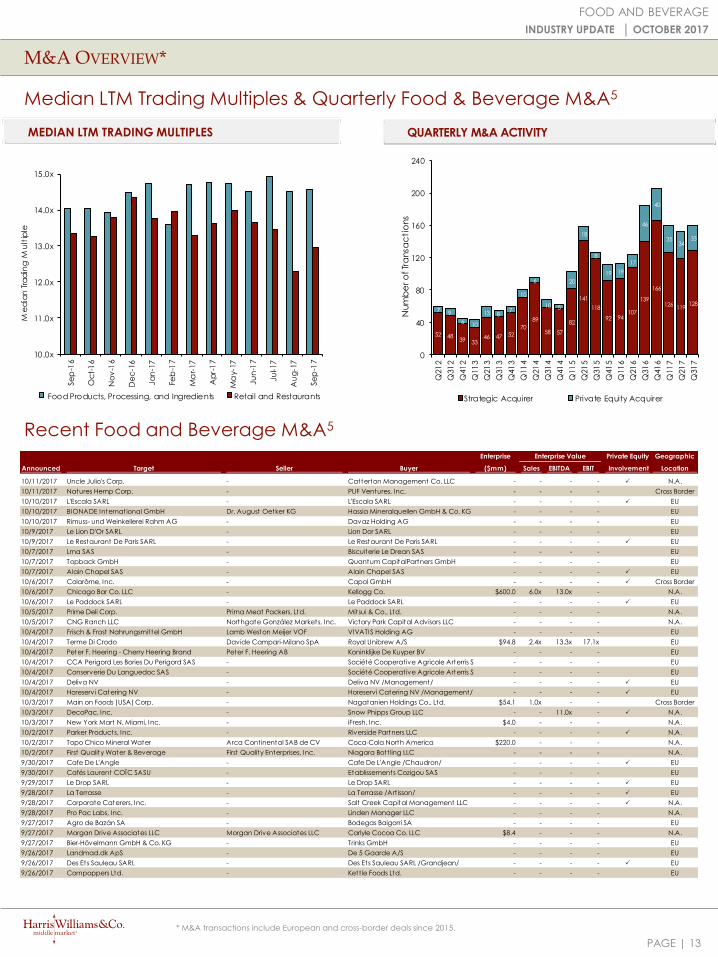
10/11/2017 Uncle Julio's Corp. - Catterton Management Co. LLC - - - - P N.A.
10/11/2017 Natures Hemp Corp. - PUF Ventures, Inc. - - - - Cross Border
10/10/2017 L'Escala SARL - L'Escala SARL - - - - P EU
10/10/2017 BIONADE International GmbH Dr. August Oetker KG Hassia Mineralquellen GmbH & Co. KG - - - - EU
10/10/2017 Rimuss- und Weinkellerei Rahm AG - Davaz Holding AG - - - - EU
10/9/2017 Le Lion D'Or SARL - Lion Dor SARL - - - - EU
10/9/2017 Le Restaurant De Paris SARL - Le Restaurant De Paris SARL - - - - P EU
10/7/2017 Lma SAS - Biscuiterie Le Drean SAS - - - - EU
10/7/2017 Topback GmbH - Quantum CapitalPartners GmbH - - - - EU
10/7/2017 Alain Chapel SAS - Alain Chapel SAS - - - - P EU
10/6/2017 Colarôme, Inc. - Capol GmbH - - - - P Cross Border
10/6/2017 Chicago Bar Co. LLC - Kellogg Co. $600.0 6.0x 13.0x - N.A.
10/6/2017 Le Paddock SARL - Le Paddock SARL - - - - P EU
10/5/2017 Prime Deli Corp. Prima Meat Packers, Ltd. Mitsui & Co., Ltd. - - - - N.A.
10/5/2017 CNG Ranch LLC Northgate González Markets, Inc. Victory Park Capital Advisors LLC - - - - N.A.
10/4/2017 Frisch & Frost Nahrungsmittel GmbH Lamb Weston Meijer VOF VIVATIS Holding AG - - - - EU
10/4/2017 Terme Di Crodo Davide Campari-Milano SpA Royal Unibrew A/S $94.8 2.4x 13.3x 17.1x EU
10/4/2017 Peter F. Heering - Cherry Heering Brand Peter F. Heering AB Koninklijke De Kuyper BV - - - - EU
10/4/2017 CCA Perigord Les Bories Du Perigord SAS - Société Cooperative Agricole Arterris SCA - - - - EU
10/4/2017 Conserverie Du Languedoc SAS - Société Cooperative Agricole Arterris SCA - - - - EU
10/4/2017 Deliva NV - Deliva NV /Management/ - - - - P EU
10/4/2017 Horeservi Catering NV - Horeservi Catering NV /Management/ - - - - P EU
10/3/2017 Main on Foods (USA) Corp. - Nagatanien Holdings Co., Ltd. $54.1 1.0x - - Cross Border
10/3/2017 DecoPac, Inc. - Snow Phipps Group LLC - - 11.0x - P N.A.
10/3/2017 New York Mart N. Miami, Inc. - iFresh, Inc. $4.0 - - - N.A.
10/2/2017 Parker Products, Inc. - Riverside Partners LLC - - - - P N.A.
10/2/2017 Topo Chico Mineral Water Arca Continental SAB de CV Coca-Cola North America $220.0 - - - N.A.
10/2/2017 First Quality Water & Beverage First Quality Enterprises, Inc. Niagara Bott ling LLC - - - - N.A.
9/30/2017 Cafe De L'Angle - Cafe De L'Angle /Chaudron/ - - - - P EU
9/30/2017 Cafés Laurent COÏC SASU - Etablissements Cozigou SAS - - - - EU
9/29/2017 Le Drop SARL - Le Drop SARL - - - - P EU
9/28/2017 La Terrasse - La Terrasse /Art isson/ - - - - P EU
9/28/2017 Corporate Caterers, Inc. - Salt Creek Capital Management LLC - - - - P N.A.
9/28/2017 Pro Pac Labs, Inc. - Linden Manager LLC - - - - N.A.
9/27/2017 Agro de Bazán SA - Bodegas Baigorri SA - - - - EU
9/27/2017 Morgan Drive Associates LLC Morgan Drive Associates LLC Carlyle Cocoa Co. LLC $8.4 - - - N.A.
9/27/2017 Bier-Hövelmann GmbH & Co. KG - Trinks GmbH - - - - EU
9/26/2017 Landmad.dk ApS - De 5 Gaarde A/S - - - - EU
9/26/2017 Des Ets Sauleau SARL - Des Ets Sauleau SARL /Grandjean/ - - - - P EU
9/26/2017 Cornpoppers Ltd. - Kett le Foods Ltd. - - - - EU
M&A OVERVIEW*
13
FOOD AND BEVERAGE
INDUSTRY UPDATE │ OCTOBER 2017
QUARTERLY M&A ACTIVITY
Median LTM Trading Multiples & Quarterly Food & Beverage M&A5
Recent Food and Beverage M&A5
MEDIAN LTM TRADING MULTIPLES
* M&A transactions include European and cross-border deals since 2015.
52 4839 33
46 47 52
70
89
58 57
82
141
118
92 94107
139
166
126 119128
7 9
610
13 87
10
6
10 5
20
18
8
19 19
17
46
40
3534
33
0
40
80
120
160
200
240
Q21
2
Q31
2
Q41
2
Q11
3
Q21
3
Q31
3
Q41
3
Q11
4
Q21
4
Q31
4
Q41
4
Q11
5
Q21
5
Q31
5
Q41
5
Q11
6
Q21
6
Q31
6
Q41
6
Q11
7
Q21
7
Q31
7
Nu
mb
er o
f Tr
an
sac
tio
ns
Strategic Acquirer Private Equity Acquirer
10.0x
11.0x
12.0x
13.0x
14.0x
15.0x
Se
p-1
6
Oc
t-1
6
No
v-1
6
De
c-1
6
Ja
n-1
7
Fe
b-1
7
Ma
r-17
Ap
r-1
7
Ma
y-1
7
Ju
n-1
7
Ju
l-17
Au
g-1
7
Se
p-1
7
Me
dia
n T
rad
ing
Mu
ltip
le
Food Products, Processing, and Ingredients Retail and Restaurants
PAGE |
Enterprise Enterprise Value Private Equity European
Announced Target Seller Buyer
Value
($mm) Sales EBITDA EBIT Involvement Transaction
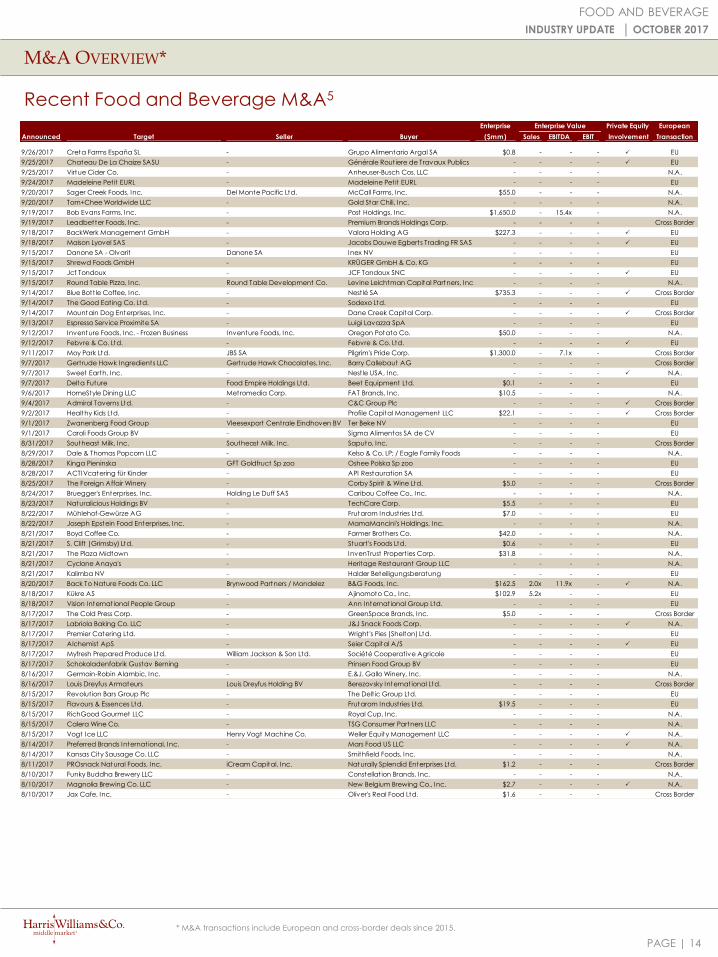
9/26/2017 Creta Farms España SL - Grupo Alimentario Argal SA $0.8 - - - P EU
9/25/2017 Chateau De La Chaize SASU - Générale Routiere de Travaux Publics - - - - P EU
9/25/2017 Virtue Cider Co. - Anheuser-Busch Cos. LLC - - - - N.A.
9/24/2017 Madeleine Petit EURL - Madeleine Petit EURL - - - - EU
9/20/2017 Sager Creek Foods, Inc. Del Monte Pacific Ltd. McCall Farms, Inc. $55.0 - - - N.A.
9/20/2017 Tom+Chee Worldwide LLC - Gold Star Chili, Inc. - - - - N.A.
9/19/2017 Bob Evans Farms, Inc. - Post Holdings, Inc. $1,650.0 - 15.4x - N.A.
9/19/2017 Leadbetter Foods, Inc. - Premium Brands Holdings Corp. - - - - Cross Border
9/18/2017 BackWerk Management GmbH - Valora Holding AG $227.3 - - - P EU
9/18/2017 Maison Lyovel SAS - Jacobs Douwe Egberts Trading FR SAS - - - - P EU
9/15/2017 Danone SA - Olvarit Danone SA Inex NV - - - - EU
9/15/2017 Shrewd Foods GmbH - KRÜGER GmbH & Co. KG - - - - EU
9/15/2017 Jcf Tondoux - JCF Tondoux SNC - - - - P EU
9/15/2017 Round Table Pizza, Inc. Round Table Development Co. Levine Leichtman Capital Partners, Inc. - - - - N.A.
9/14/2017 Blue Bott le Coffee, Inc. - Nest lé SA $735.3 - - - P Cross Border
9/14/2017 The Good Eating Co. Ltd. - Sodexo Ltd. - - - - EU
9/14/2017 Mountain Dog Enterprises, Inc. - Dane Creek Capital Corp. - - - - P Cross Border
9/13/2017 Espresso Service Proximite SA - Luigi Lavazza SpA - - - - EU
9/12/2017 Inventure Foods, Inc. - Frozen Business Inventure Foods, Inc. Oregon Potato Co. $50.0 - - - N.A.
9/12/2017 Febvre & Co. Ltd. - Febvre & Co. Ltd. - - - - P EU
9/11/2017 Moy Park Ltd. JBS SA Pilgrim's Pride Corp. $1,300.0 - 7.1x - Cross Border
9/7/2017 Gertrude Hawk Ingredients LLC Gertrude Hawk Chocolates, Inc. Barry Callebaut AG - - - - Cross Border
9/7/2017 Sweet Earth, Inc. - Nest le USA, Inc. - - - - P N.A.
9/7/2017 Delta Future Food Empire Holdings Ltd. Beet Equipment Ltd. $0.1 - - - EU
9/6/2017 HomeStyle Dining LLC Metromedia Corp. FAT Brands, Inc. $10.5 - - - N.A.
9/4/2017 Admiral Taverns Ltd. - C&C Group Plc - - - - P Cross Border
9/2/2017 Healthy Kids Ltd. - Profile Capital Management LLC $22.1 - - - P Cross Border
9/1/2017 Zwanenberg Food Group Vleesexport Centrale Eindhoven BV Ter Beke NV - - - - EU
9/1/2017 Caroli Foods Group BV - Sigma Alimentos SA de CV - - - - EU
8/31/2017 Southeast Milk, Inc. Southeast Milk, Inc. Saputo, Inc. - - - - Cross Border
8/29/2017 Dale & Thomas Popcorn LLC - Kelso & Co. LP; / Eagle Family Foods - - - - N.A.
8/28/2017 Kinga Pieninska GFT Goldfruct Sp zoo Oshee Polska Sp zoo - - - - EU
8/28/2017 ACTIVcatering für Kinder - API Restaurat ion SA - - - - EU
8/25/2017 The Foreign Affair Winery - Corby Spirit & Wine Ltd. $5.0 - - - Cross Border
8/24/2017 Bruegger's Enterprises, Inc. Holding Le Duff SAS Caribou Coffee Co., Inc. - - - - N.A.
8/23/2017 Naturalicious Holdings BV - TechCare Corp. $5.5 - - - EU
8/22/2017 Mühlehof-Gewürze AG - Frutarom Industries Ltd. $7.0 - - - EU
8/22/2017 Joseph Epstein Food Enterprises, Inc. - MamaMancini's Holdings, Inc. - - - - N.A.
8/21/2017 Boyd Coffee Co. - Farmer Brothers Co. $42.0 - - - N.A.
8/21/2017 S. Clift (Grimsby) Ltd. - Stuart 's Foods Ltd. $0.6 - - - EU
8/21/2017 The Plaza Midtown - InvenTrust Propert ies Corp. $31.8 - - - N.A.
8/21/2017 Cyclone Anaya's - Heritage Restaurant Group LLC - - - - N.A.
8/21/2017 Kalimba NV - Halder Beteiligungsberatung - - - - EU
8/20/2017 Back To Nature Foods Co. LLC Brynwood Partners / Mondelez B&G Foods, Inc. $162.5 2.0x 11.9x - P N.A.
8/18/2017 Kükre AS - Ajinomoto Co., Inc. $102.9 5.2x - - EU
8/18/2017 Vision International People Group - Ann International Group Ltd. - - - - EU
8/17/2017 The Cold Press Corp. - GreenSpace Brands, Inc. $5.0 - - - Cross Border
8/17/2017 Labriola Baking Co. LLC - J&J Snack Foods Corp. - - - - P N.A.
8/17/2017 Premier Catering Ltd. - Wright 's Pies (Shelton) Ltd. - - - - EU
8/17/2017 Alchemist ApS - Seier Capital A/S - - - - P EU
8/17/2017 Myfresh Prepared Produce Ltd. William Jackson & Son Ltd. Société Cooperative Agricole - - - - EU
8/17/2017 Schokoladenfabrik Gustav Berning - Prinsen Food Group BV - - - - EU
8/16/2017 Germain-Robin Alambic, Inc. - E.&J. Gallo Winery, Inc. - - - - N.A.
8/16/2017 Louis Dreyfus Armateurs Louis Dreyfus Holding BV Berezovsky International Ltd. - - - - Cross Border
8/15/2017 Revolut ion Bars Group Plc - The Delt ic Group Ltd. - - - - EU
8/15/2017 Flavours & Essences Ltd. - Frutarom Industries Ltd. $19.5 - - - EU
8/15/2017 RichGood Gourmet LLC - Royal Cup, Inc. - - - - N.A.
8/15/2017 Calera Wine Co. - TSG Consumer Partners LLC - - - - N.A.
8/15/2017 Vogt Ice LLC Henry Vogt Machine Co. Weller Equity Management LLC - - - - P N.A.
8/14/2017 Preferred Brands International, Inc. - Mars Food US LLC - - - - P N.A.
8/14/2017 Kansas City Sausage Co. LLC - Smithfield Foods, Inc. - - - - N.A.
8/11/2017 PROsnack Natural Foods, Inc. iCream Capital, Inc. Naturally Splendid Enterprises Ltd. $1.2 - - - Cross Border
8/10/2017 Funky Buddha Brewery LLC - Constellat ion Brands, Inc. - - - - N.A.
8/10/2017 Magnolia Brewing Co. LLC - New Belgium Brewing Co., Inc. $2.7 - - - P N.A.
8/10/2017 Jax Cafe, Inc. - Oliver's Real Food Ltd. $1.6 - - - Cross Border
M&A OVERVIEW*
14
FOOD AND BEVERAGE
INDUSTRY UPDATE │ OCTOBER 2017
Recent Food and Beverage M&A5
* M&A transactions include European and cross-border deals since 2015.
PAGE |
FOOD AND BEVERAGE EARNINGS RELEASE CALENDAR
15
FOOD AND BEVERAGE
INDUSTRY UPDATE │ OCTOBER 2017
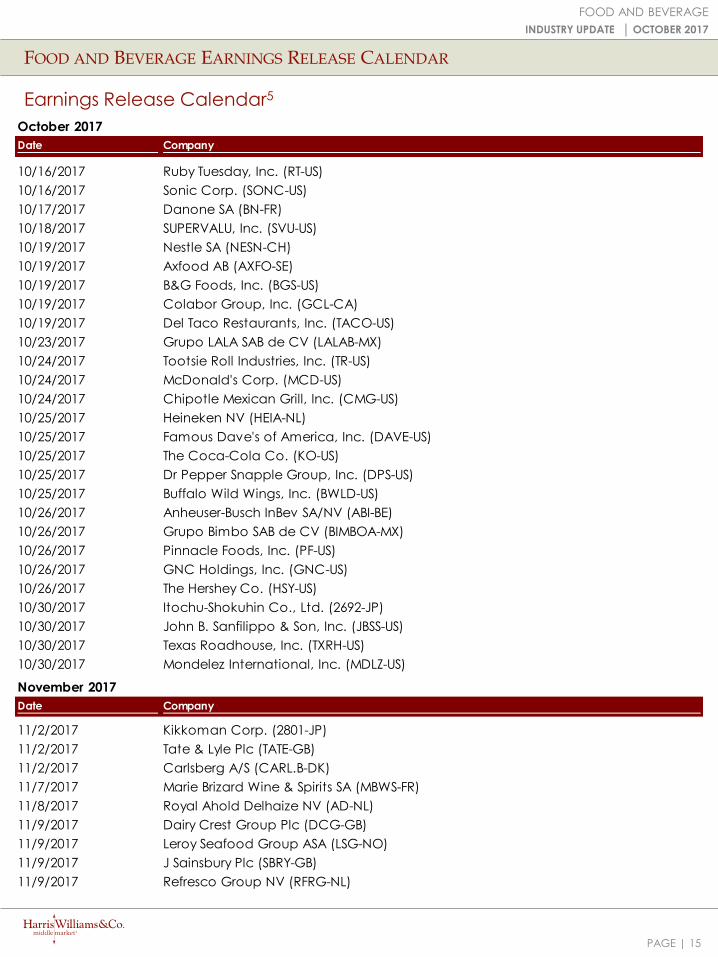
Earnings Release Calendar5
October 2017
Date Company
10/16/2017 Ruby Tuesday, Inc. (RT-US)
10/16/2017 Sonic Corp. (SONC-US)
10/17/2017 Danone SA (BN-FR)
10/18/2017 SUPERVALU, Inc. (SVU-US)
10/19/2017 Nestle SA (NESN-CH)
10/19/2017 Axfood AB (AXFO-SE)
10/19/2017 B&G Foods, Inc. (BGS-US)
10/19/2017 Colabor Group, Inc. (GCL-CA)
10/19/2017 Del Taco Restaurants, Inc. (TACO-US)
10/23/2017 Grupo LALA SAB de CV (LALAB-MX)
10/24/2017 Tootsie Roll Industries, Inc. (TR-US)
10/24/2017 McDonald's Corp. (MCD-US)
10/24/2017 Chipotle Mexican Grill, Inc. (CMG-US)
10/25/2017 Heineken NV (HEIA-NL)
10/25/2017 Famous Dave's of America, Inc. (DAVE-US)
10/25/2017 The Coca-Cola Co. (KO-US)
10/25/2017 Dr Pepper Snapple Group, Inc. (DPS-US)
10/25/2017 Buffalo Wild Wings, Inc. (BWLD-US)
10/26/2017 Anheuser-Busch InBev SA/NV (ABI-BE)
10/26/2017 Grupo Bimbo SAB de CV (BIMBOA-MX)
10/26/2017 Pinnacle Foods, Inc. (PF-US)
10/26/2017 GNC Holdings, Inc. (GNC-US)
10/26/2017 The Hershey Co. (HSY-US)
10/30/2017 Itochu-Shokuhin Co., Ltd. (2692-JP)
10/30/2017 John B. Sanfilippo & Son, Inc. (JBSS-US)
10/30/2017 Texas Roadhouse, Inc. (TXRH-US)
10/30/2017 Mondelez International, Inc. (MDLZ-US)
November 2017
Date Company
11/2/2017 Kikkoman Corp. (2801-JP)
11/2/2017 Tate & Lyle Plc (TATE-GB)
11/2/2017 Carlsberg A/S (CARL.B-DK)
11/7/2017 Marie Brizard Wine & Spirits SA (MBWS-FR)
11/8/2017 Royal Ahold Delhaize NV (AD-NL)
11/9/2017 Dairy Crest Group Plc (DCG-GB)
11/9/2017 Leroy Seafood Group ASA (LSG-NO)
11/9/2017 J Sainsbury Plc (SBRY-GB)
11/9/2017 Refresco Group NV (RFRG-NL)

Energy, Power& Infrastructure
IndustrialsHealthcare & Life Sciences
Transportation & Logistics
Aerospace, Defense & Government
Services
Business Services
Building Products & Materials
Technology, Media & Telecom
Specialty Distribution
Consumer
PAGE |
HARRIS WILLIAMS & CO. OFFICE LOCATIONS
UNITED STATES EUROPE
BostonOne International PlaceSuite 2620Boston, Massachusetts 02110Phone: +1 (617) 482-7501
Cleveland1900 East 9th Street20th FloorCleveland, Ohio 44114Phone: +1 (216) 689-2400
Minneapolis222 South 9th StreetSuite 3350Minneapolis, Minnesota 55402Phone: +1 (612) 359-2700
Richmond (Headquarters)1001 Haxall Point9th FloorRichmond, Virginia 23219Phone: +1 (804) 648-0072
San Francisco575 Market Street31st FloorSan Francisco, California 94105Phone: +1 (415) 288-4260
Washington, D.C. 800 17th St. NW2nd FloorWashington, D.C. 20006Phone: +1 (202) 207-2300
FrankfurtBockenheimer Landstrasse 33-3560325 FrankfurtGermanyPhone: +49 069 3650638 00
London63 Brook StreetLondon W1K 4HS, EnglandPhone: +44 (0) 20 7518 8900
NETWORK OFFICES
Beijing
Hong Kong
Mumbai
New Delhi
Shanghai
Consumer
OUR FIRM
FOOD AND BEVERAGE
INDUSTRY UPDATE │ OCTOBER 2017
16
Harris Williams & Co. has a broad range of industry expertise, which creates powerful opportunities.Our clients benefit from our deep-sector experience, integrated industry intelligence andcollaboration across the firm, and our commitment to learning what makes them unique. For moreinformation, visit our website at www.harriswilliams.com/industries.
PAGE |
HARRIS WILLIAMS & CO.
1. IMF
2. U.S. Bureau of Labor Statistics
3. Unweighted Average
4. U.S. Census Bureau
5. Factset
6. Thomson Financial
7. S&P
8. Reuters
SOURCES
FOOD AND BEVERAGE
INDUSTRY UPDATE │ OCTOBER 2017
DISCLOSURES
17
Harris Williams & Co. (www.harriswilliams.com) is a preeminent middle market investment bank focused on the advisory needs of clients worldwide. The firm has deep industry knowledge, global transaction expertise, and an unwavering commitment to excellence. Harris Williams & Co. provides sell-side and acquisition advisory, restructuring advisory, board advisory, private placements, and capital markets advisory services.
Investment banking services are provided by Harris Williams LLC, a registered broker-dealer and member of FINRA and SIPC, and Harris Williams & Co. Ltd, which is a private limited company incorporated under English law with its registered office at 5th Floor, 6 St. Andrew Street, London EC4A 3AE, UK, registered with the Registrar of Companies for England and Wales (registration number 7078852). Harris Williams & Co. Ltd is authorized and regulated by the Financial Conduct Authority. Harris Williams & Co. is a trade name under which Harris Williams LLC and Harris Williams & Co. Ltd conduct business.
THIS REPORT MAY CONTAIN REFERENCES TO REGISTERED TRADEMARKS, SERVICE MARKS AND COPYRIGHTS OWNED BY THIRD-PARTY INFORMATION PROVIDERS. NONE OF THE THIRD-PARTY INFORMATION PROVIDERS IS ENDORSING THE OFFERING OF, AND SHALL NOT IN ANY WAY BE DEEMED AN ISSUER OR UNDERWRITER OF, THE SECURITIES, FINANCIAL INSTRUMENTS OR OTHER INVESTMENTS DISCUSSED IN THIS REPORT, AND SHALL NOT HAVE ANY LIABILITY OR RESPONSIBILITY FOR ANY STATEMENTS MADE IN THE REPORT OR FOR ANY FINANCIAL STATEMENTS, FINANCIAL PROJECTIONS OR OTHER FINANCIAL INFORMATION CONTAINED OR ATTACHED AS AN EXHIBIT TO THE REPORT. FOR MORE INFORMATION ABOUT THE MATERIALS PROVIDED BY SUCH THIRD PARTIES, PLEASE CONTACT US.
The information and views contained in this report were prepared by Harris Williams & Co. (“Harris Williams”). It is not a research report, as such term is defined by applicable law and regulations, and is provided for informational purposes only. It is not to be construed as an offer to buy or sell or a solicitation of an offer to buy or sell any financial instruments or to participate in any particular trading strategy. The information contained herein is believed by Harris Williams to be reliable, but Harris Williams makes no representation as to the accuracy or completeness of such information. Harris Williams and/or its affiliates may be market makers or specialists in, act as advisers or lenders to, have positions in and effect transactions in securities of companies mentioned herein and also may provide, may have provided, or may seek to provide investment banking services for those companies. In addition, Harris Williams and/or its affiliates or their respective officers, directors and employees may hold long or short positions in the securities, options thereon or other related financial products of companies discussed herein. Opinions, estimates and projections in this report constitute Harris Williams’ judgment and are subject to change without notice. The financial instruments discussed in this report may not be suitable for all investors, and investors must make their own investment decisions using their own independent advisors as they believe necessary and based upon their specific financial situations and investment objectives. Also, past performance is not necessarily indicative of future results. No part of this material may be copied or duplicated in any form or by any means, or redistributed, without Harris Williams’ prior written consent.
Copyright© 2017 Harris Williams & Co., all rights reserved.