food and beverage - harriswilliams.com · food and beverage . industry update │ april 2017. a...
TRANSCRIPT
www.harriswilliams.com
Investment banking services are provided by Harris Williams LLC, a registered broker-dealer and member of FINRA and SIPC, and Harris Williams & Co. Ltd, which is a private limited company incorporated under English law with its registered office at 5th Floor, 6 St. Andrew Street, London EC4A 3AE, UK, registered with the Registrar of Companies for England and Wales (registration number 7078852). Harris Williams & Co. Ltd is authorized and regulated by the Financial Conduct Authority. Harris Williams & Co. is a trade name under which Harris Williams LLC and Harris Williams & Co. Ltd conduct business.
FOOD AND BEVERAGE
INDUSTRY UPDATE │ APRIL 2017
PAGE |
www.harriswilliams.com
WHAT WE’RE SEEING
1
CONTENTS
INDUSTRY VITAL SIGNS
EQUITY MARKET OVERVIEW
M&A MARKET OVERVIEW
DEBT MARKET OVERVIEW
RECENT M&A ACTIVITY
EARNINGS CALENDAR
GROUP OVERVIEW
Harris Williams & Co. is a leading advisor to the food and beverage market. Our significant experience covers a broad range of end markets, industries, and business models. This particular report focuses on trends and metrics in the following areas:
Agribusiness
Baked and Prepared Goods
Beverages
Branded and Private Label
Dairy
Distribution
Ingredients
Meat and Protein
Natural and Organic
Processing
Produce
Restaurant and Retail
Snacks
CONTACTS
Glenn GurtcheffManaging [email protected]+1 (612) 359-2702
Tim AlexanderManaging [email protected]+1 (612) 359-2716
Ryan BudlongManaging [email protected]+1 (415) 217-3409
Brant [email protected]+1 (612) 359-2709
Ryan [email protected]+1 (612) 359-2703
Andy WarczakVice [email protected]+1 (612) 359-2714
MARKET UPDATE
FOOD AND BEVERAGE
INDUSTRY UPDATE │ APRIL 2017
a portfolio company of
has been acquired by
has been acquired by
a portfolio company of
A Private Investor Group
a portfolio company of
has been acquired by
CLOSED HW&CO. TRANSACTIONS
WHAT WE’VE BEEN DOING
a portfolio company of
has been acquired by
a portfolio company of
has been acquired by
a subsidiary of
has been acquired by
a portfolio company of
has been acquired by
has been acquired byhas been acquired by
a portfolio company of
has been acquired by
and
The M&A market continues to benefit from strong momentum, with over 200 food
and beverage transactions announced so far in 2017. Recent transactions of note
include: SuperValu’s acquisition of Unified Grocers, Darden Restaurants’
acquisition of Cheddar’s Scratch Kitchen, and JAB Holdings acquisition of Panera
Bread. The latter transaction adds to JAB’s growing portfolio of brands that
includes Krispy Kreme, Caribou Coffee, Peet’s Coffee, Keurig Green Mountain,
and others.
a portfolio company of
has been acquired by
a portfolio company of
has been acquired by

PAGE |
WHAT WE’VE BEEN DOING (CONTINUED)
2
FOOD AND BEVERAGE
INDUSTRY UPDATE │ APRIL 2017
VITAL SIGNS
COMMODITY PRICE INDICES1
PROTEIN PRICE INDICES2,3
20
40
60
80
100
120
Mar-13 Sep-13 Mar-14 Sep-14 Mar-15 Sep-15 Mar-16 Sep-16 Mar-17
Co
mm
od
ity P
ric
e In
de
x
Corn Soybeans Wheat Crude Oil
90
100
110
120
130
140
Feb-13 Aug-13 Feb-14 Aug-14 Feb-15 Aug-15 Feb-16 Aug-16 Feb-17
Pro
tein
Pri
ce
Ind
ex
Beef Pork Poultry
Soybeans:
(31.7%)
Wheat:
(44.4%)
Corn:
(48.6%)
Crude Oil:
(50.4%)
Beef:
7.8%
Pork
(0.0%)
Poultry:
(4.5%)
Overview
On March 31, 2017 Country Fresh, a portfolio company of Eos Partners, was successfully sold to Kainos Capital. Building
on the sale of Ready Pac Foods to Bonduelle, the sale represents the latest in HW&Co.’s growing list of better-for-you
fresh produce transactions.
Company Description
Country Fresh is a leader in fresh-cut fruit and vegetable and snacking solutions, providing blue-chip retailers and
select foodservice customers with innovative, fresh, healthy, and convenient products. The Company serves as a
critical innovation partner to its customers, with customized merchandising and packaging solutions.
HW&CO. ADVISES ON THE SALE OF COUNTRY FRESH
Key Value Drivers for Country Fresh
Well positioned to capitalize on consumers’ demand for
healthy and convenient foods.
Blue-chip customer base consisting of well-known grocery
retailers.
Efficient operations featuring longstanding relationships
with a diverse set of growers and best-in-class processing
capabilities.
Strong free cash flow generation and high return on
investment for capacity and greenfield expansions.
has been acquired by
a portfolio company of
Representative Products
Fresh-Cut Veg.Fresh-Cut Fruit
SnacksSliced Apples
PAGE |
80
100
120
140
Mar-13 Sep-13 Mar-14 Sep-14 Mar-15 Sep-15 Mar-16 Sep-16 Mar-17
Sa
les
Ind
ex
Restaurant Grocery
VITAL SIGNS
3
FOOD AND BEVERAGE
INDUSTRY UPDATE │ APRIL 2017
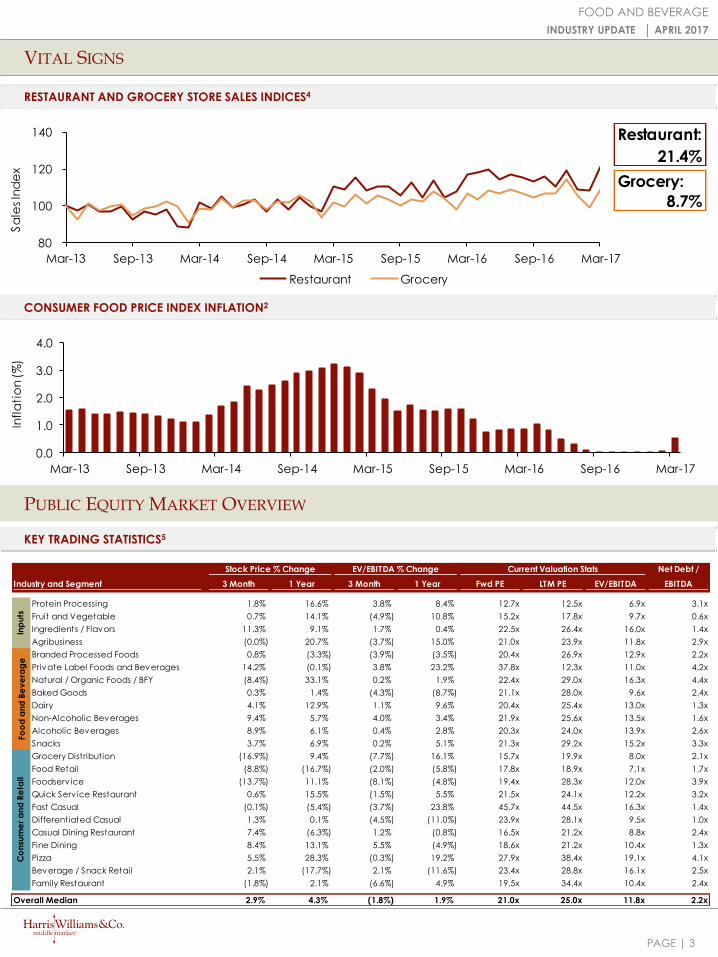
RESTAURANT AND GROCERY STORE SALES INDICES4
CONSUMER FOOD PRICE INDEX INFLATION2
PUBLIC EQUITY MARKET OVERVIEW
KEY TRADING STATISTICS5
Net Debt /
3 Month 1 Year 3 Month 1 Year Fwd PE LTM PE EV/EBITDA EBITDA
Protein Processing 1.8% 16.6% 3.8% 8.4% 12.7x 12.5x 6.9x 3.1x
Fruit and Vegetable 0.7% 14.1% (4.9%) 10.8% 15.2x 17.8x 9.7x 0.6x
Ingredients / Flavors 11.3% 9.1% 1.7% 0.4% 22.5x 26.4x 16.0x 1.4x
Agribusiness (0.0%) 20.7% (3.7%) 15.0% 21.0x 23.9x 11.8x 2.9x
Branded Processed Foods 0.8% (3.3%) (3.9%) (3.5%) 20.4x 26.9x 12.9x 2.2x
Private Label Foods and Beverages 14.2% (0.1%) 3.8% 23.2% 37.8x 12.3x 11.0x 4.2x
Natural / Organic Foods / BFY (8.4%) 33.1% 0.2% 1.9% 22.4x 29.0x 16.3x 4.4x
Baked Goods 0.3% 1.4% (4.3%) (8.7%) 21.1x 28.0x 9.6x 2.4x
Dairy 4.1% 12.9% 1.1% 9.6% 20.4x 25.4x 13.0x 1.3x
Non-Alcoholic Beverages 9.4% 5.7% 4.0% 3.4% 21.9x 25.6x 13.5x 1.6x
Alcoholic Beverages 8.9% 6.1% 0.4% 2.8% 20.3x 24.0x 13.9x 2.6x
Snacks 3.7% 6.9% 0.2% 5.1% 21.3x 29.2x 15.2x 3.3x
Grocery Distribution (16.9%) 9.4% (7.7%) 16.1% 15.7x 19.9x 8.0x 2.1x
Food Retail (8.8%) (16.7%) (2.0%) (5.8%) 17.8x 18.9x 7.1x 1.7x
Foodserv ice (13.7%) 11.1% (8.1%) (4.8%) 19.4x 28.3x 12.0x 3.9x
Quick Serv ice Restaurant 0.6% 15.5% (1.5%) 5.5% 21.5x 24.1x 12.2x 3.2x
Fast Casual (0.1%) (5.4%) (3.7%) 23.8% 45.7x 44.5x 16.3x 1.4x
Differentiated Casual 1.3% 0.1% (4.5%) (11.0%) 23.9x 28.1x 9.5x 1.0x
Casual Dining Restaurant 7.4% (6.3%) 1.2% (0.8%) 16.5x 21.2x 8.8x 2.4x
Fine Dining 8.4% 13.1% 5.5% (4.9%) 18.6x 21.2x 10.4x 1.3x
Pizza 5.5% 28.3% (0.3%) 19.2% 27.9x 38.4x 19.1x 4.1x
Beverage / Snack Retail 2.1% (17.7%) 2.1% (11.6%) 23.4x 28.8x 16.1x 2.5x
Family Restaurant (1.8%) 2.1% (6.6%) 4.9% 19.5x 34.4x 10.4x 2.4x
Overall Median 2.9% 4.3% (1.8%) 1.9% 21.0x 25.0x 11.8x 2.2x
Stock Price % Change EV/EBITDA % Change Current Valuation Stats
Inp
uts
Fo
od
an
d B
ev
era
ge
Co
nsu
me
r a
nd
Re
tail
Industry and Segment
Restaurant:
21.4%
Grocery:
8.7%
0.0
1.0
2.0
3.0
4.0
Mar-13 Sep-13 Mar-14 Sep-14 Mar-15 Sep-15 Mar-16 Sep-16 Mar-17
Infl
ati
on
(%
)
PAGE |
PUBLIC EQUITY MARKET OVERVIEW
4
FOOD AND BEVERAGE
INDUSTRY UPDATE │ APRIL 2017
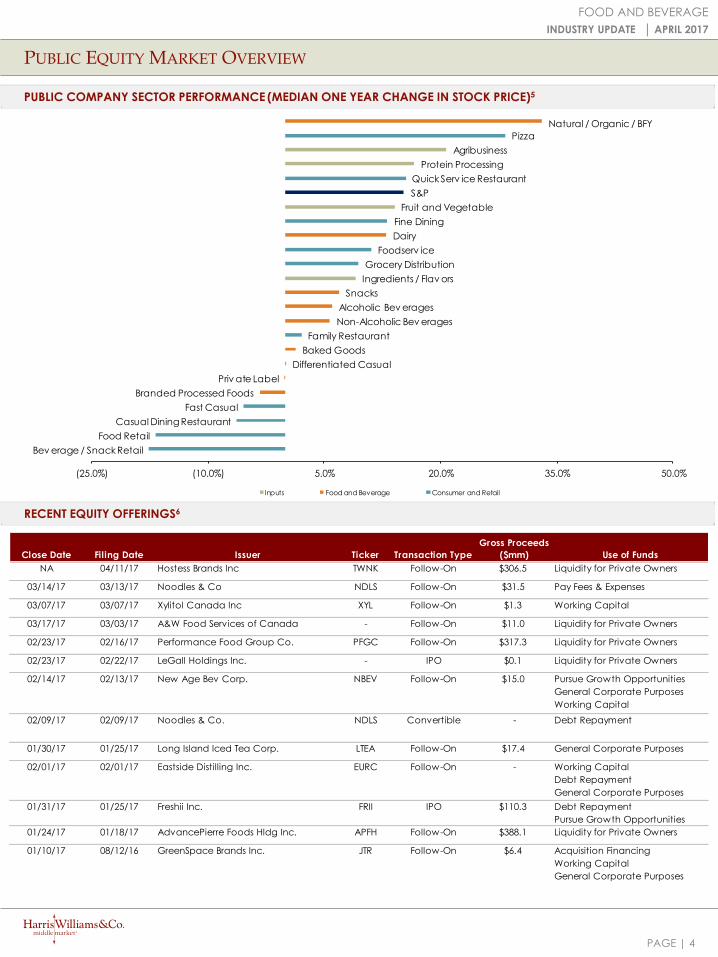
PUBLIC COMPANY SECTOR PERFORMANCE (MEDIAN ONE YEAR CHANGE IN STOCK PRICE)5
RECENT EQUITY OFFERINGS6
Close Date Filing Date Issuer Ticker Transaction Type
Gross Proceeds
($mm) Use of Funds
NA 04/11/17 Hostess Brands Inc TWNK Follow-On $306.5 Liquidity for Private Owners
03/14/17 03/13/17 Noodles & Co NDLS Follow-On $31.5 Pay Fees & Expenses
03/07/17 03/07/17 Xylitol Canada Inc XYL Follow-On $1.3 Working Capital
03/17/17 03/03/17 A&W Food Services of Canada - Follow-On $11.0 Liquidity for Private Owners
02/23/17 02/16/17 Performance Food Group Co. PFGC Follow-On $317.3 Liquidity for Private Owners
02/23/17 02/22/17 LeGall Holdings Inc. - IPO $0.1 Liquidity for Private Owners
02/14/17 02/13/17 New Age Bev Corp. NBEV Follow-On $15.0 Pursue Growth Opportunities
General Corporate Purposes
Working Capital
02/09/17 02/09/17 Noodles & Co. NDLS Convertible - Debt Repayment
01/30/17 01/25/17 Long Island Iced Tea Corp. LTEA Follow-On $17.4 General Corporate Purposes
02/01/17 02/01/17 Eastside Distilling Inc. EURC Follow-On - Working Capital
Debt Repayment
General Corporate Purposes
01/31/17 01/25/17 Freshii Inc. FRII IPO $110.3 Debt Repayment
Pursue Growth Opportunities
01/24/17 01/18/17 AdvancePierre Foods Hldg Inc. APFH Follow-On $388.1 Liquidity for Private Owners
01/10/17 08/12/16 GreenSpace Brands Inc. JTR Follow-On $6.4 Acquisition Financing
Working Capital
General Corporate Purposes
Bev erage / Snack Retail
Food Retail
Casual Dining Restaurant
Fast Casual
Branded Processed Foods
Priv ate Label
Differentiated Casual
Baked Goods
Family Restaurant
Non-Alcoholic Bev erages
Alcoholic Bev erages
Snacks
Ingredients / Flav ors
Grocery Distribution
Foodserv ice
Dairy
Fine Dining
Fruit and Vegetable
S&P
Quick Serv ice Restaurant
Protein Processing
Agribusiness
Pizza
Natural / Organic / BFY
(25.0%) (10.0%) 5.0% 20.0% 35.0% 50.0%
Inputs Food and Beverage Consumer and Retail

PAGE |
PUBLIC COMPARABLES5
5
FOOD AND BEVERAGE
INDUSTRY UPDATE │ APRIL 2017
Price at As a % of Market Enterprise P/E
($ in millions, except per share data) Ticker 4/12/17 52-wk High Cap Value Revenue EBITDA 1 Year 3 Years Gross EBITDA Multiple Revenue EBITDA Revenue EBITDA
Food and Beverage
Branded Processed Foods
Associated British Foods plc ABF-GB $32.71 66.0% $25,595 $25,976 $19,015 $2,171 (3.8%) (2.9%) 8.0% 11.4% 25.0x 1.37x 12.0x 1.38x 11.5x
B&G Foods, Inc. BGS 39.73 75.2% 2,656 4,353 1,391 317 44.0% 24.3% 24.9% 22.8% 23.1x 3.13x 13.7x 2.64x 11.8x
Campbell Soup Company CPB 57.10 84.1% 17,240 20,418 7,930 1,548 (0.8%) 0.4% 38.0% 19.5% 35.4x 2.57x 13.2x 2.56x 11.1x
Conagra Brands, Inc. CAG 40.50 82.9% 17,233 19,606 8,793 1,323 (2.6%) (21.1%) 31.6% 15.0% 29.3x 2.23x 14.8x 2.54x 13.1x
General Mills, Inc. GIS 57.50 78.8% 33,082 43,115 15,741 3,439 (7.0%) (4.4%) 35.4% 21.8% 21.3x 2.74x 12.5x 2.77x 12.3x
Hormel Foods Corporation HRL 34.23 83.0% 18,142 17,785 9,511 1,420 3.8% 2.3% 24.2% 14.9% 20.8x 1.87x 12.5x 1.92x 11.9x
Kellogg Company K 72.21 82.8% 25,256 32,759 13,014 2,174 (3.8%) (4.2%) 31.5% 16.7% 36.8x 2.52x 15.1x 2.58x 12.6x
McCormick & Company, Incorporated MKC 99.68 92.4% 12,423 14,003 4,425 779 2.5% 1.9% 39.5% 17.6% 26.9x 3.16x 18.0x 3.06x 16.7x
Nestle S.A. NESN-CH 76.28 91.5% 234,460 248,976 90,816 17,587 (1.5%) (3.0%) 50.4% 19.4% 27.5x 2.74x 14.2x 2.72x 14.2x
Post Holdings, Inc. POST 88.03 98.9% 5,676 9,356 5,028 899 NM 66.2% 27.3% 17.9% NM 1.86x 10.4x 1.82x 9.8x
Hershey Company HSY 108.73 92.3% 16,486 19,211 7,440 1,768 0.7% 1.4% 37.7% 23.8% 32.5x 2.58x 10.9x 2.53x 10.4x
J. M. Smucker Company SJM 128.01 81.4% 14,876 19,823 7,416 1,742 (0.5%) 9.1% 35.6% 23.5% 22.3x 2.67x 11.4x 2.66x 11.4x
Mean 2.8% 5.8% 32.0% 18.7% 27.3x 2.45x 13.2x 2.43x 12.2x
Median (0.8%) 0.9% 33.5% 18.6% 26.9x 2.58x 12.9x 2.57x 11.8x
Private Label Foods and Beverages
Cott Corporation BCB-CA $12.72 73.1% $1,752 $3,840 $3,236 $348 9.9% 15.6% 33.9% 10.8% NA 1.19x 11.0x 1.03x 8.7x
Seneca Foods Corporation SENEA 35.05 82.2% 348 720 1,283 78 2.7% (1.0%) 10.1% 6.1% 12.3x 0.56x 9.2x NA NA
TreeHouse Foods, Inc. THS 88.02 84.2% 5,022 7,738 6,185 643 92.9% 39.2% 18.0% 10.4% NA 1.25x 12.0x 1.19x 10.2x
Mean 35.2% 17.9% 20.7% 9.1% 12.3x 1.00x 10.8x 1.11x 9.5x
Median 9.9% 15.6% 18.0% 10.4% 12.3x 1.19x 11.0x 1.11x 9.5x
Natural / Organic Foods / Better-For-You
Amplify Snack Brands Inc BETR $8.82 50.3% $692 $1,274 $271 $78 47.2% NA 39.4% 28.9% 25.0x 4.70x 16.3x 3.14x 12.2x
SunOpta Inc. SOY-CA 6.72 87.4% 579 1,013 1,347 54 17.6% 4.4% 5.0% 4.0% NA 0.75x 18.9x 0.75x 12.0x
Pinnacle Foods, Inc. PF 59.20 99.5% 6,983 9,797 3,128 645 17.8% 8.3% 31.0% 20.6% 33.0x 3.13x 15.2x 3.04x 13.8x
Hain Celestial Group, Inc. HAIN 36.55 64.1% 3,807 4,599 2,888 374 12.2% 21.5% 22.1% 12.9% 18.4x 1.59x 12.3x 1.52x 11.5x
Mean 23.7% 11.4% 24.4% 16.6% 25.5x 2.55x 15.7x 2.11x 12.4x
Median 17.7% 8.3% 26.6% 16.8% 25.0x 2.36x 15.7x 2.28x 12.1x
Baked Goods
Aryzta AG ARYN-CH $32.99 71.1% $2,979 $4,978 $4,225 $596 15.7% (11.2%) 29.7% 14.1% NA 1.18x 8.4x 1.22x 9.7x
Flowers Foods, Inc. FLO 19.60 93.4% 4,072 5,040 3,927 438 3.9% 1.5% 45.5% 11.2% 25.0x 1.28x 11.5x 1.27x 11.0x
George Weston Limited WN-CA 87.44 95.3% 11,075 24,196 36,228 3,080 (1.2%) 3.6% 29.3% 8.5% 29.2x 0.67x 7.9x 0.66x 7.9x
Grupo Bimbo SAB de CV BIMBOA-MX 2.42 74.4% 11,518 15,299 13,488 1,598 (2.3%) (0.7%) 53.9% 11.9% 36.9x 1.13x 9.6x 1.05x 9.3x
Lancaster Colony Corporation LANC 128.56 86.1% 3,554 3,435 1,190 225 2.6% 0.6% 28.4% 18.9% 26.9x 2.89x 15.3x 2.82x 15.1x
Mean 3.8% (1.2%) 37.4% 12.9% 29.5x 1.43x 10.5x 1.40x 10.6x
Median 2.6% 0.6% 29.7% 11.9% 28.0x 1.18x 9.6x 1.22x 9.7x
EV / LTM EV / 2017ERevenue Growth LTM MarginsLTM

PAGE |
PUBLIC COMPARABLES5
FOOD AND BEVERAGE
INDUSTRY UPDATE │ APRIL 2017
Price at As a % of Market Enterprise P/E
($ in millions, except per share data) Ticker 4/12/17 52-wk High Cap Value Revenue EBITDA 1 Year 3 Years Gross EBITDA Multiple Revenue EBITDA Revenue EBITDA
Dairy
Danone SA BN-FR $68.22 86.5% $44,615 $52,273 $24,274 $3,808 (2.3%) (5.0%) 45.6% 15.7% 22.9x 2.15x 13.7x 1.98x 11.3x
Dean Foods Company DF 19.75 88.5% 1,822 2,690 7,710 455 (5.1%) (5.1%) 24.6% 5.9% 15.3x 0.35x 5.9x 0.33x 6.1x
Emmi AG EMMN-CH 695.59 98.5% 3,671 3,982 3,308 350 (0.9%) (2.4%) 19.6% 10.6% 26.3x 1.20x 11.4x 1.19x 11.8x
Glanbia Plc GL9-IE 19.59 95.5% 5,742 6,214 3,150 393 2.4% (0.1%) 9.0% 12.5% 25.4x 1.97x 15.8x 2.06x 16.0x
Lifeway Foods, Inc. LWAY 9.45 51.1% 160 158 124 9 4.5% 8.3% 28.0% 7.3% 45.0x 1.28x 17.4x 1.21x 14.0x
Parmalat S.p.A. PLT-IT 3.26 95.0% 6,112 5,698 7,179 463 0.9% 0.4% 19.6% 6.4% NM 0.79x 12.3x 0.80x 10.1x
Saputo Inc. SAP-CA 34.86 93.3% 13,373 14,299 8,413 995 0.1% (0.5%) 18.0% 11.8% 25.7x 1.70x 14.4x 1.62x 13.5x
Savencia SA SAVE-FR 78.05 89.5% 1,124 1,573 4,888 262 (0.8%) (4.3%) 4.3% 5.4% 10.1x 0.32x 6.0x 0.32x 4.7x
Mean (0.2%) (1.1%) 21.1% 9.5% 24.4x 1.22x 12.1x 1.19x 10.9x
Median (0.3%) (1.5%) 19.6% 9.0% 25.4x 1.24x 13.0x 1.20x 11.6x
Non-Alcoholic Beverages
A.G. BARR p.l.c. BAG-GB $7.71 85.9% $879 $866 $343 $68 (12.9%) (4.9%) 47.0% 19.8% 19.6x 2.53x 12.7x 2.63x 13.1x
Cott Corporation BCB-CA 12.72 73.1% 1,752 3,840 3,236 348 9.9% 15.6% 33.9% 10.8% NA 1.19x 11.0x 1.03x 8.7x
Dr Pepper Snapple Group, Inc. DPS 97.15 98.3% 17,850 20,522 6,519 1,653 3.8% 2.8% 58.7% 25.4% 21.4x 3.15x 12.4x 3.03x 12.3x
Lassonde Industries, Inc. LAS.A 180.89 100.0% 575 797 1,139 129 0.6% 4.1% 29.3% 11.3% 24.3x 0.70x 6.2x 0.69x 5.9x
Monster Beverage Corporation MNST 45.24 81.5% 25,702 25,104 3,044 1,205 13.5% 10.7% 66.0% 39.6% 38.1x 8.25x 20.8x 7.45x 18.6x
National Beverage Corp. FIZZ 85.67 98.9% 3,991 3,885 794 117 15.0% 7.2% 33.3% 14.8% 42.0x 4.89x 33.2x 4.25x 19.8x
PepsiCo, Inc. PEP 113.14 100.0% 159,578 180,502 62,801 12,683 (0.4%) (1.8%) 54.1% 20.2% 25.6x 2.87x 14.2x 2.85x 13.7x
Coca-Cola Company KO 42.90 91.7% 183,097 206,763 41,379 11,151 (5.3%) (4.0%) 59.7% 26.9% 28.6x 5.00x 18.5x 5.98x 18.6xNA
Mean 3.0% 3.7% 47.7% 21.1% 28.5x 3.57x 16.1x 3.49x 13.8x
Median 2.2% 3.5% 50.5% 20.0% 25.6x 3.01x 13.5x 2.94x 13.4x
Alcoholic Beverages
Anheuser-Busch Inbev Sa ABI-BE $109.97 81.9% $185,905 $303,525 $45,517 $16,399 4.4% 1.8% 61.3% 36.0% NM 6.67x 18.5x 5.35x 14.0x
Brown-Forman Corporation BF.B 45.85 88.9% 17,802 19,831 2,985 1,101 (1.4%) 0.3% 65.7% 36.9% 17.4x 6.64x 18.0x 6.35x 17.9x
Carlsberg A/S CARL.B-DK 94.47 91.7% 14,194 18,385 9,303 1,842 (4.3%) (6.7%) 50.6% 19.8% 22.3x 1.98x 10.0x 1.97x 9.6x
Constellation Brands, Inc. STZ 169.92 96.9% 33,436 42,490 7,332 2,431 12.0% 14.7% 48.4% 33.2% 25.2x 5.80x 17.5x 5.57x 15.6x
Diageo plc DGE-GB 28.84 98.2% 72,014 85,461 15,136 4,822 (5.5%) (4.9%) 61.6% 31.9% 24.5x 5.65x 17.7x 5.57x 16.2x
Heineken NV HEIA-NL 86.55 87.8% 49,619 63,230 23,000 5,049 1.1% (3.4%) 13.8% 22.0% 30.0x 2.75x 12.5x 2.75x 11.4x
Kirin Holdings Company, Limited 2503-JP 19.16 98.5% 17,633 25,468 19,097 2,128 5.2% (6.1%) 44.3% 11.1% 16.3x 1.33x 12.0x 1.36x 11.1x
Pernod Ricard SA RI-FR 120.86 99.1% 31,835 41,433 9,714 2,976 (0.5%) (4.0%) 62.4% 30.6% 23.6x 4.27x 13.9x 4.25x 14.3x
Sapporo Holdings Limited 2501-JP 27.11 87.4% 2,136 4,506 4,987 428 13.1% (1.5%) 34.6% 8.6% 24.5x 0.90x 10.5x 0.89x 10.3x
Mean 2.7% (1.1%) 49.2% 25.6% 23.0x 4.00x 14.5x 3.78x 13.4x
Median 1.1% (3.4%) 50.6% 30.6% 24.0x 4.27x 13.9x 4.25x 14.0x
Snacks
Inventure Foods, Inc. SNAK $3.99 39.3% $82 $196 $269 $5 (4.8%) 7.7% 9.1% 2.0% NA 0.73x NM 0.77x 15.4x
J & J Snack Foods Corp. JJSF 133.43 93.2% 2,494 2,329 996 154 0.9% 4.2% 29.2% 15.4% 32.7x 2.34x 15.2x 2.19x 13.9x
John B. Sanfilippo & Son, Inc. JBSS 71.85 97.4% 624 667 919 71 (1.8%) 7.3% 17.4% 7.7% 24.6x 0.73x 9.5x 0.77x NA
Mondelez International, Inc. MDLZ 44.34 95.6% 67,170 82,682 25,923 4,616 (12.5%) (9.8%) 37.6% 17.8% 42.9x 3.19x 17.9x 3.20x 16.4x
PepsiCo, Inc. PEP 113.14 100.0% 159,578 180,502 62,801 12,683 (0.4%) (1.8%) 54.1% 20.2% 25.6x 2.87x 14.2x 2.85x 13.7x
Snyder's-Lance, Inc. LNCE 40.74 100.0% 3,930 5,208 2,109 265 27.3% 6.2% 37.8% 12.5% NM 2.47x 19.7x 2.29x 15.4x
Mean 1.5% 2.3% 30.9% 12.6% 31.4x 2.05x 15.3x 2.01x 14.9x
Median (1.1%) 5.2% 33.4% 14.0% 29.2x 2.40x 15.2x 2.24x 15.4x
EV / 2017ELTM MarginsLTM EV / LTMRevenue Growth
6
PAGE |
PUBLIC COMPARABLES5
FOOD AND BEVERAGE
INDUSTRY UPDATE │ APRIL 2017
Price at As a % of Market Enterprise P/E
($ in millions, except per share data) Ticker 4/12/17 52-wk High Cap Value Revenue EBITDA 1 Year 3 Years Gross EBITDA Multiple Revenue EBITDA Revenue EBITDA
Inputs
Protein Processing
Cal-Maine Foods, Inc. CALM $38.78 73.1% $1,685 $1,521 $1,103 ($47) (45.1%) (7.5%) 12.8% NM NA 1.38x NM 1.22x 20.5x
JBS S.A. JBSS3-BR 3.22 79.6% 9,047 23,810 48,878 3,169 0.2% 4.3% 14.3% 6.5% NM 0.49x 7.5x 0.43x 5.0x
Sanderson Farms, Inc. SAFM 107.06 100.0% 2,428 2,203 2,899 398 5.8% 2.8% 11.9% 13.7% 12.1x 0.76x 5.5x 0.70x 5.6x
Seaboard Corporation SEB 4,029.85 88.7% 4,730 4,026 5,379 331 (3.8%) (6.9%) 9.9% 6.2% 15.2x 0.75x 12.2x NA NA
Tyson Foods, Inc. TSN 63.99 83.0% 18,038 23,711 36,942 3,745 (7.1%) 2.1% 15.7% 10.1% 12.5x 0.64x 6.3x 0.65x 6.4x
Mean (10.0%) (1.1%) 12.9% 9.1% 13.2x 0.80x 7.9x 0.75x 9.4x
Median (3.8%) 2.1% 12.8% 8.3% 12.5x 0.75x 6.9x 0.67x 6.0x
Fruit and Vegetable
Calavo Growers, Inc. CVGW $63.35 88.6% $1,088 $1,142 $958 $70 10.5% 10.0% 9.7% 7.3% 29.3x 1.19x 16.4x 1.08x 15.1x
Fresh Del Monte Produce Inc. FDP 59.26 88.6% 3,022 3,259 4,004 345 (2.2%) 2.8% 5.9% 8.6% 13.8x 0.81x 9.5x 0.78x 9.4x
Seneca Foods Corporation SENEA 35.05 82.2% 348 720 1,283 78 2.7% (1.0%) 10.1% 6.1% 12.3x 0.56x 9.2x NA NA
Total Produce Plc T7O-IE 2.11 99.1% 662 790 3,435 80 7.7% (0.6%) 13.7% 2.3% 21.9x 0.23x 9.9x 0.20x 9.0x
Mean 4.7% 2.8% 9.9% 6.1% 19.3x 0.70x 11.2x 0.68x 11.2x
Median 5.2% 1.1% 9.9% 6.7% 17.8x 0.69x 9.7x 0.78x 9.4x
Ingredients / Flavors
Givaudan SA GIVN-CH $1,893.72 87.9% $17,336 $18,238 $4,733 $1,098 3.7% 0.1% 42.6% 23.2% 27.0x 3.85x 16.6x 3.70x 16.4x
Ingredion Incorporated INGR 120.22 85.9% 8,663 10,133 5,704 1,069 1.5% (3.4%) 24.2% 18.7% 18.5x 1.78x 9.5x 1.69x 9.2x
International Flavors & Fragrances Inc. IFF 132.29 92.1% 10,535 11,541 3,116 714 3.1% 1.8% 42.9% 22.9% 26.4x 3.70x 16.2x 3.52x 15.2x
Kerry Group Plc KRZ-IE 81.88 85.6% 14,334 15,826 6,782 960 0.2% (4.3%) 40.1% 14.2% 25.3x 2.33x 16.5x 2.29x 15.9x
Sensient Technologies Corporation SXT 79.94 95.9% 3,575 4,153 1,383 260 0.5% (2.0%) 34.5% 18.8% 28.6x 3.00x 16.0x 2.95x 15.7x
Symrise AG SY1-DE 66.97 86.4% 8,618 10,197 3,211 680 11.3% 9.7% 40.7% 21.2% 32.0x 3.18x 15.0x 3.17x 14.5x
Tate & Lyle PLC TATE-GB 9.71 91.8% 4,483 4,935 3,555 488 (0.2%) (10.2%) 10.3% 13.7% 15.7x 1.39x 10.1x 1.42x 10.0x
Mean 2.9% (1.2%) 33.6% 19.0% 24.8x 2.75x 14.3x 2.68x 13.9x
Median 1.5% (2.0%) 40.1% 18.8% 26.4x 3.00x 16.0x 2.95x 15.2x
Agribusiness
Archer-Daniels-Midland Company ADM $44.45 92.8% $25,417 $30,841 $62,421 $2,794 (7.7%) (11.4%) 6.1% 4.5% 20.6x 0.49x 11.0x 0.48x 9.0x
Bunge Limited BG 77.25 93.5% 10,716 13,288 42,679 1,502 (1.8%) (11.4%) 5.6% 3.5% 16.1x 0.31x 8.8x 0.30x 6.7x
CF Industries Holdings, Inc. CF 28.62 77.0% 6,912 14,665 3,685 1,084 (14.5%) (12.4%) 0.3% 29.4% NA 3.98x 13.5x 3.44x 11.1x
Darling Ingredients Inc. DAR 14.78 92.7% 2,444 4,184 3,399 434 0.0% 25.4% 13.8% 12.8% 23.9x 1.23x 9.6x 1.21x 9.1x
Monsanto Company MON 116.20 99.7% 50,902 57,796 14,461 4,298 5.8% (2.1%) 58.4% 29.7% 26.7x 4.00x 13.4x 3.98x 13.8x
Andersons, Inc. ANDE 38.40 85.5% 1,100 1,497 3,925 126 (5.1%) (10.5%) 8.6% 3.2% NM 0.38x 11.8x 0.37x 7.8x
Mosaic Company MOS 28.25 82.2% 10,070 13,253 7,163 1,070 (19.5%) NA 11.1% 14.9% 33.8x 1.85x 12.4x 1.79x 10.3x
Mean (6.1%) (3.7%) 14.8% 14.0% 24.2x 1.75x 11.5x 1.65x 9.7x
Median (5.1%) (10.9%) 8.6% 12.8% 23.9x 1.23x 11.8x 1.21x 9.1x
Consumer and Retail
Grocery Distribution
AMCON Distributing Company DIT $98.65 80.3% $66 $79 $1,283 $13 (0.4%) 1.8% 5.7% 1.0% 12.1x 0.06x 6.3x NA NA
Core-Mark Holding Company, Inc. CORE 31.71 63.4% 1,457 1,763 14,529 133 31.3% 14.2% 5.1% 0.9% 26.9x 0.12x 13.2x 0.11x 10.3x
Performance Food Group Company PFGC 23.65 84.1% 2,463 3,804 16,380 316 7.3% 6.2% 12.8% 1.9% 33.1x 0.23x 12.0x 0.22x 9.5x
SpartanNash Company SPTN 35.23 87.2% 1,325 1,732 7,735 231 1.1% (0.8%) 14.2% 3.0% 23.4x 0.22x 7.5x 0.21x 6.9x
SUPERVALU INC. SVU 3.81 64.6% 1,071 3,574 13,519 508 (24.7%) 53.2% 13.2% 3.8% 10.4x 0.26x 7.0x 0.27x 7.1x
United Natural Foods, Inc. UNFI 41.48 79.5% 2,099 2,630 8,910 311 7.3% 11.3% 15.1% 3.5% 16.4x 0.30x 8.5x 0.27x 8.0x
Mean 3.6% 14.3% 11.0% 2.3% 20.4x 0.20x 9.1x 0.22x 8.4x
Median 4.2% 8.8% 13.0% 2.5% 19.9x 0.23x 8.0x 0.22x 8.0x
EV / 2017ELTM Revenue Growth EV / LTMLTM Margins
7

PAGE |
PUBLIC COMPARABLES5
FOOD AND BEVERAGE
INDUSTRY UPDATE │ APRIL 2017
Price at As a % of Market Enterprise P/E
($ in millions, except per share data) Ticker 4/12/17 52-wk High Cap Value Revenue EBITDA 1 Year 3 Years Gross EBITDA Multiple Revenue EBITDA Revenue EBITDA
Food Retail
Costco Wholesale Corporation COST $170.00 95.1% $74,897 $74,276 $121,194 $4,927 3.3% 4.0% 12.9% 4.1% 31.5x 0.61x 15.1x 0.57x 13.7x
Ingles Markets, Incorporated IMKTA 44.30 84.5% 637 1,522 3,827 236 1.6% 0.7% 24.1% 6.2% 16.5x 0.40x 6.4x 0.39x 6.4x
J Sainsbury plc SBRY-GB 3.23 75.6% 7,243 9,050 33,585 1,284 (7.1%) (3.3%) 5.9% 3.8% 10.6x 0.27x 7.0x 0.26x 5.3x
Royal Ahold Delhaize N.V. AD-NL 20.35 79.6% 25,888 29,248 54,973 4,063 NA 8.3% 29.8% 7.4% 23.8x 0.53x 7.2x 0.42x 6.4x
Natural Grocers by Vitamin Cottage NGVC 10.47 50.7% 236 288 721 44 11.6% 16.6% 24.7% 6.2% 23.9x 0.40x 6.5x 0.36x 5.6x
Sprouts Farmers Markets, Inc. SFM 22.91 78.6% 3,168 3,540 4,046 294 12.6% 18.4% 26.1% 7.3% 28.0x 0.87x 12.0x 0.78x 11.5x
SUPERVALU INC. SVU 3.81 64.6% 1,071 3,574 13,519 508 (24.7%) 53.2% 13.2% 3.8% 10.4x 0.26x 7.0x 0.27x 7.1x
Tesco PLC TSCO-GB 2.31 82.5% 19,968 27,871 78,545 3,432 (10.1%) (7.7%) 5.3% 4.4% NM 0.35x 8.1x 0.39x 8.2x
Kroger Co. KR 29.78 78.4% 27,034 39,891 115,337 5,775 5.0% 5.4% 20.1% 5.0% 14.5x 0.35x 6.9x 0.33x 6.6x
Village Super Market, Inc. VLGEA 26.66 73.2% 265 32 1,627 67 1.5% 3.1% 25.5% 4.1% 17.8x 0.02x 0.5x NA NA
Weis Markets, Inc. WMK 60.83 88.3% 1,648 1,625 3,137 66 9.0% 5.2% 24.9% 2.1% 18.9x 0.52x 24.8x NA NA
Whole Foods Market, Inc. WFM 34.19 96.1% 10,688 10,890 15,813 1,367 1.7% 5.9% 33.6% 8.6% 24.1x 0.69x 8.0x 0.68x 8.3x
Mean 0.4% 9.1% 20.5% 5.2% 20.0x 0.44x 9.1x 0.45x 7.9x
Median 1.7% 5.3% 24.4% 4.7% 18.9x 0.40x 7.1x 0.39x 6.8x
Foodservice
Colabor Group Inc. GCL-CA $0.86 75.3% $87 $177 $1,056 $23 20.4% (8.9%) 1.3% 2.2% NM 0.17x 7.7x 0.16x 7.3x
Sysco Corporation SYY 52.15 91.4% 28,134 35,711 53,077 2,955 8.6% 5.3% 19.1% 5.6% 28.3x 0.67x 12.1x 0.64x 11.0x
Chefs' Warehouse, Inc. CHEF 13.73 66.7% 368 668 1,193 56 (5.1%) 21.0% 26.0% 4.7% NM 0.56x 12.0x 0.53x 10.6x
Mean 8.0% 5.8% 15.5% 4.1% 28.3x 0.47x 10.6x 0.44x 9.6x
Median 8.6% 5.3% 19.1% 4.7% 28.3x 0.56x 12.0x 0.53x 10.6x
Quick Service Restaurant
Bojangles, Inc. BOJA $20.18 92.3% $748 $924 $532 $83 8.9% NA 20.9% 15.6% 20.5x 1.74x 11.1x 1.63x 11.2x
Jack in the Box Inc. JACK 100.11 88.4% 3,236 4,272 1,616 351 4.8% 3.1% 27.4% 21.7% 26.7x 2.64x 12.2x 2.70x 11.6x
McDonald's Corporation MCD 131.16 99.4% 107,452 132,184 24,622 9,320 (3.1%) (4.3%) 42.4% 37.9% 24.1x 5.37x 14.2x 6.09x 13.7x
Restaurant Brands International Inc QSR 56.32 97.1% 13,224 22,272 4,146 1,834 2.3% NA 48.1% 44.2% 38.1x 5.37x 12.1x 4.96x 10.8x
Sonic Corp. SONC 25.29 70.7% 1,089 1,660 557 159 (10.0%) 0.9% 33.1% 28.6% 18.7x 2.98x 10.4x 3.52x 11.0x
Wendy's Company WEN 13.59 93.9% 3,390 5,571 1,435 377 (23.3%) (16.7%) 44.7% 26.3% 27.8x 3.88x 14.8x 4.69x 13.9x
Yum! Brands, Inc. YUM 64.01 69.6% 22,598 30,832 6,366 1,885 (51.4%) (21.3%) 43.0% 29.6% 15.8x 4.84x 16.4x 5.49x 15.2x
Mean (10.2%) (7.7%) 37.1% 29.1% 24.5x 3.83x 13.0x 4.16x 12.5x
Median (3.1%) (4.3%) 42.4% 28.6% 24.1x 3.88x 12.2x 4.69x 11.6x
Fast Casual
Chipotle Mexican Grill, Inc. CMG $457.95 97.4% $12,993 $12,576 $3,904 $204 (13.3%) 6.7% 9.8% 5.2% NM 3.22x NM 2.74x 23.6x
El Pollo Loco Holdings Inc LOCO 12.33 82.3% 471 573 380 59 7.1% NA 18.3% 15.4% 26.1x 1.51x 9.8x 1.39x 8.8x
Fiesta Restaurant Group, Inc. FRGI 23.90 66.4% 638 707 712 91 3.5% 8.9% 17.5% 12.8% 38.2x 0.99x 7.8x 0.96x 7.7x
Habit Restaurants, Inc. HABT 17.88 89.3% 489 477 284 29 23.1% NA 15.1% 10.3% NM 1.68x 16.3x 1.40x 14.6x
Noodles & Co. NDLS 5.80 48.9% 150 233 487 14 7.0% 11.6% 7.3% 2.8% NA 0.48x 17.1x 0.49x 7.5x
Panera Bread Company PNRA 313.95 99.3% 6,698 7,023 2,795 403 4.2% 5.4% 16.7% 14.4% 50.8x 2.51x 17.4x 2.37x 15.8x
Potbelly Corp. PBPB 13.58 90.6% 346 323 407 40 9.2% 10.7% 14.3% 9.8% 44.5x 0.79x 8.1x 0.71x 7.4x
Shake Shack, Inc. SHAK 32.79 76.4% 1,261 1,237 268 42 40.9% 48.2% 22.0% 15.8% NM 4.61x 29.2x 3.48x 22.6x
Wingstop, Inc. WING 28.37 84.9% 821 966 91 32 17.2% NA 68.6% 35.3% 53.7x 10.57x 30.0x 9.64x 24.3x
Zoe's Kitchen, Inc. ZOES 17.17 42.3% 341 365 276 23 21.8% 33.3% 10.2% 8.3% NM 1.32x 16.0x 1.13x 14.9x
Mean 12.1% 17.8% 20.0% 13.0% 42.7x 2.77x 16.8x 2.43x 14.7x
Median 8.1% 10.7% 15.9% 11.6% 44.5x 1.59x 16.3x 1.40x 14.7x
LTM Revenue Growth LTM Margins EV / LTM EV / 2017E
8
PAGE |
PUBLIC COMPARABLES5
FOOD AND BEVERAGE
INDUSTRY UPDATE │ APRIL 2017
Price at As a % of Market Enterprise P/E
($ in millions, except per share data) Ticker 4/12/17 52-wk High Cap Value Revenue EBITDA 1 Year 3 Years Gross EBITDA Multiple Revenue EBITDA Revenue EBITDA
Differentiated Casual
BJ's Restaurants, Inc. BJRI $41.03 86.3% $887 $1,013 $993 $129 8.0% 8.6% 12.6% 13.0% 21.6x 1.02x 7.8x 0.97x 8.3x
Buffalo Wild Wings, Inc. BWLD 151.70 86.6% 2,440 2,533 1,987 297 9.6% 16.2% 11.9% 15.0% 29.5x 1.27x 8.5x 1.18x 8.2x
Chuy's Holdings, Inc. CHUY 28.58 75.6% 483 470 331 41 15.2% 17.4% 12.2% 12.4% 28.1x 1.42x 11.5x 1.23x 10.1x
Dave & Buster's Entertainment, Inc. PLAY 59.78 94.7% 2,513 2,757 1,005 239 15.9% 16.5% 23.7% 23.8% 28.4x 2.74x 11.5x 2.39x 10.1x
Ignite Restaurant Group, Inc. IRG 0.07 1.8% 2 121 450 23 17.3% 36.0% NM 5.1% NA 0.27x 5.3x NA NA
Cheesecake Factory Incorporated CAKE 62.25 95.6% 3,008 3,054 2,276 289 17.3% 36.0% 15.4% 12.7% 22.3x 1.34x 10.6x 1.30x 10.6x
Mean 13.9% 21.8% 15.1% 13.7% 26.0x 1.34x 9.2x 1.41x 9.5x
Median 15.6% 17.0% 12.6% 12.9% 28.1x 1.31x 9.5x 1.23x 10.1x
Casual Dining Restaurant
Bloomin' Brands, Inc. BLMN $19.69 98.2% $2,035 $3,002 $4,252 $420 (2.9%) 1.0% 11.0% 9.9% 53.4x 0.71x 7.1x 0.70x 7.0x
Brinker International, Inc. EAT 43.64 78.2% 2,123 3,509 3,236 468 4.4% 4.2% 12.5% 14.5% 13.5x 1.08x 7.5x 1.10x 8.2x
Darden Restaurants, Inc. DRI 82.20 97.2% 10,313 10,362 7,026 946 0.1% (7.0%) 19.7% 13.5% 21.2x 1.47x 10.9x 1.39x 10.0x
DineEquity, Inc. DIN 55.28 59.0% 993 2,232 634 253 (6.9%) (0.3%) 57.4% 39.9% 10.4x 3.52x 8.8x 3.56x 9.4x
Red Robin Gourmet Burgers, Inc. RRGB 58.40 87.1% 740 1,075 1,296 137 3.1% 8.4% 12.4% 10.5% NM 0.83x 7.9x 0.78x 7.3x
Ruby Tuesday, Inc. RT 2.61 56.7% 158 339 976 37 (11.9%) (6.1%) 11.6% 3.8% NA 0.35x 9.2x NA NA
Texas Roadhouse, Inc. TXRH 44.80 88.7% 3,204 3,152 1,991 262 10.1% 11.9% 13.2% 13.2% 27.7x 1.58x 12.0x 1.44x 11.0x
Mean (0.6%) 1.7% 19.7% 15.0% 25.2x 1.36x 9.1x 1.50x 8.8x
Median 0.1% 1.0% 12.5% 13.2% 21.2x 1.08x 8.8x 1.25x 8.8x
Fine Dining
Del Frisco's Restaurant Group, Inc. DFRG $17.98 97.2% $394 $379 $352 $46 6.1% 9.0% 20.8% 13.0% 23.7x 1.08x 8.3x 1.03x 7.9x
Fogo de Chao, Inc. FOGO 15.45 86.4% 442 564 288 54 6.1% NA 26.3% 18.9% 18.4x 1.96x 10.4x 1.77x 9.3x
Ruth's Hospitality Group, Inc. RUTH 20.05 98.8% 643 664 386 61 3.4% (1.7%) 27.0% 15.8% 21.2x 1.72x 10.9x 1.59x 9.9x
Mean 5.2% 3.6% 24.7% 15.9% 21.1x 1.58x 9.9x 1.47x 9.0x
Median 6.1% 3.6% 26.3% 15.8% 21.2x 1.72x 10.4x 1.59x 9.3x
Pizza
Domino's Pizza, Inc. DPZ $175.46 91.4% $8,431 $10,449 $2,473 $492 11.6% 11.1% 31.1% 19.9% 40.8x 4.23x 21.2x 3.82x 18.6x
Papa John's International, Inc. PZZA 79.90 88.3% 3,005 3,312 1,714 195 4.7% 6.0% 18.6% 11.4% 29.8x 1.93x 17.0x 1.85x 15.8x
Papa Murphy's Holdings, Inc. FRSH 6.51 50.2% 104 (295) 127 22 5.6% NA 30.2% 17.3% 38.4x NM NM NM NM
Mean 7.3% 8.6% 26.6% 16.2% 36.3x 3.08x 19.1x 2.84x 17.2x
Median 5.6% 8.6% 30.2% 17.3% 38.4x 3.08x 19.1x 2.84x 17.2x
Beverage / Snack Retail
DAVIDsTEA, Inc. DTEA $7.50 52.4% $193 $167 $159 $18 NA NA 41.3% 11.6% 28.8x 1.05x 9.1x 0.92x 7.9x
Dunkin' Brands Group, Inc. DNKN 54.04 92.5% 4,996 6,999 829 433 2.2% 5.1% 79.4% 52.3% 25.7x 8.44x 16.1x 8.27x 14.7x
Jamba, Inc. JMBA 8.60 63.1% 133 118 82 (7) (56.0%) (28.9%) 39.7% NM NA 1.44x NM 1.56x 11.3x
Starbucks Corporation SBUX 57.66 93.9% 84,354 85,371 21,672 4,992 9.9% 12.2% 24.4% 23.0% 29.7x 3.94x 17.1x 3.63x 14.5x
Mean (9.9%) (1.6%) 40.6% 25.3% 28.1x 3.72x 14.1x 3.60x 12.1x
Median 3.3% 5.2% 39.7% 18.6% 28.8x 2.69x 16.1x 2.60x 12.9x
Family Restaurant
Cracker Barrel Old Country Store, Inc. CBRL $156.14 89.2% $3,775 $3,990 $2,928 $385 2.1% 3.2% 15.2% 13.2% 18.8x 1.36x 10.4x 1.33x 9.9x
Denny's Corporation DENN 12.39 86.9% 881 1,124 507 96 3.2% 3.1% 27.7% 19.0% 50.0x 2.22x 11.7x 2.13x 10.9x
Luby's, Inc. LUB 3.22 63.1% 94 132 396 15 (7.4%) (0.2%) 6.8% 3.7% NA 0.33x 9.0x NA NA
Mean (0.7%) 2.1% 16.6% 11.9% 34.4x 1.30x 10.4x 1.73x 10.4x
Median 2.1% 3.1% 15.2% 13.2% 34.4x 1.36x 10.4x 1.73x 10.4x
LTM Revenue Growth LTM Margins EV / LTM EV / 2017E
9
PAGE |
PUBLIC EQUITY MARKET OVERVIEW
10
FOOD AND BEVERAGE
INDUSTRY UPDATE │ APRIL 2017
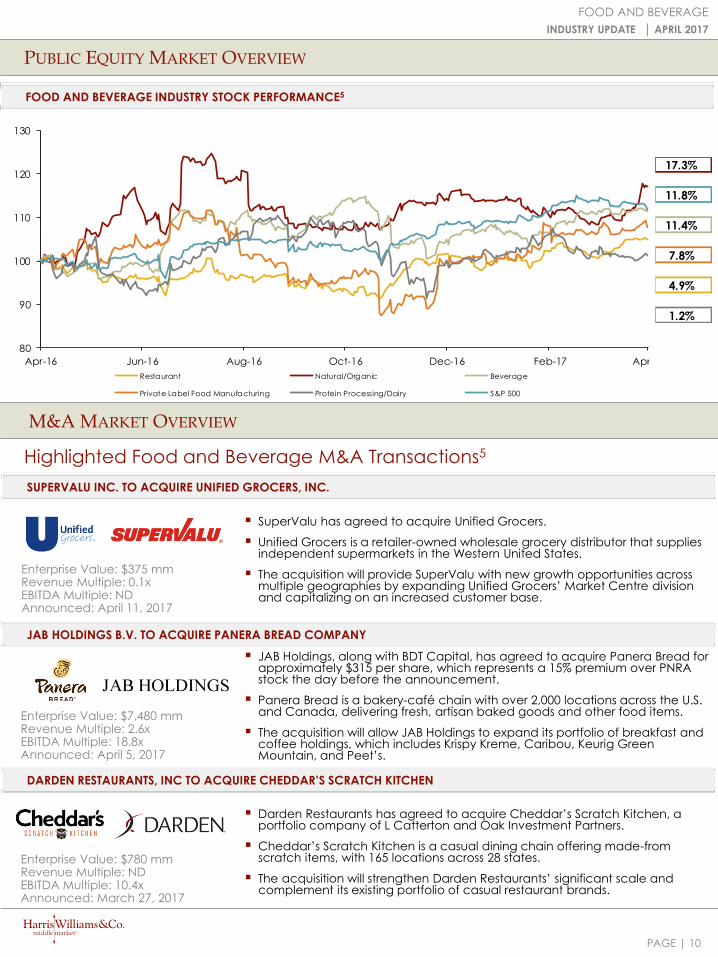
FOOD AND BEVERAGE INDUSTRY STOCK PERFORMANCE5
Highlighted Food and Beverage M&A Transactions5
M&A MARKET OVERVIEW
DARDEN RESTAURANTS, INC TO ACQUIRE CHEDDAR’S SCRATCH KITCHEN
Enterprise Value: $780 mmRevenue Multiple: NDEBITDA Multiple: 10.4xAnnounced: March 27, 2017
JAB HOLDINGS B.V. TO ACQUIRE PANERA BREAD COMPANY
SUPERVALU INC. TO ACQUIRE UNIFIED GROCERS, INC.
SuperValu has agreed to acquire Unified Grocers.
Unified Grocers is a retailer-owned wholesale grocery distributor that supplies independent supermarkets in the Western United States.
The acquisition will provide SuperValu with new growth opportunities across multiple geographies by expanding Unified Grocers’ Market Centre division and capitalizing on an increased customer base.
Enterprise Value: $7,480 mmRevenue Multiple: 2.6xEBITDA Multiple: 18.8xAnnounced: April 5, 2017
Darden Restaurants has agreed to acquire Cheddar’s Scratch Kitchen, a portfolio company of L Catterton and Oak Investment Partners.
Cheddar’s Scratch Kitchen is a casual dining chain offering made-from scratch items, with 165 locations across 28 states.
The acquisition will strengthen Darden Restaurants’ significant scale and complement its existing portfolio of casual restaurant brands.
80
90
100
110
120
130
Apr-16 Jun-16 Aug-16 Oct-16 Dec-16 Feb-17 Apr-17
Restaurant Natural/Organic Beverage
Private Label Food Manufacturing Protein Processing/Dairy S&P 500
Enterprise Value: $375 mmRevenue Multiple: 0.1xEBITDA Multiple: NDAnnounced: April 11, 2017
17.3%
11.8%
11.4%
7.8%
4.9%
1.2%
JAB Holdings, along with BDT Capital, has agreed to acquire Panera Bread for approximately $315 per share, which represents a 15% premium over PNRA stock the day before the announcement.
Panera Bread is a bakery-café chain with over 2,000 locations across the U.S. and Canada, delivering fresh, artisan baked goods and other food items.
The acquisition will allow JAB Holdings to expand its portfolio of breakfast and coffee holdings, which includes Krispy Kreme, Caribou, Keurig Green Mountain, and Peet’s.

PAGE |
M&A MARKET OVERVIEW*
11
FOOD AND BEVERAGE
INDUSTRY UPDATE │ APRIL 2017
Food and Beverage M&A Trends5
MEDIAN FOOD & BEV. TRANSACTION MULTIPLES
PRIVATE EQUITY INVESTMENTS & EXITS
Latest Deals and Announced Private Equity Activity5
LAST 10 DEALS ANNOUNCED
ANNOUNCED FOOD & BEV. TRANSACTIONS
* M&A transactions include European and cross-border deals since 2015.
8.8x 8.3x 8.0x
11.3x
9.2x
9.7x
8.8x
10.0x 10.4x
0.00x
0.40x
0.80x
1.20x
1.60x
2.00x
0.0x
2.0x
4.0x
6.0x
8.0x
10.0x
12.0x
2009 2010 2011 2012 2013 2014 2015 2016 2017
YTD
EV
/ LTM
Sa
les M
ultip
le
EV
/ L
TM E
BIT
DA
Mu
ltip
le
EV / LTM EBITDA EV / LTM Sales
$9.3
$67.2
$8.2$24.0
$55.7
$120.7
$247.7
$52.9
$16.2
0
100
200
300
400
500
600
700
$0
$40
$80
$120
$160
$200
$240
$280
2009 2010 2011 2012 2013 2014 2015 2016 2017
YTD
Nu
mb
er o
f Tran
sa
ctio
ns
Ag
gre
ga
te
D
ea
l V
alu
e (
$ in
billio
ns)
Aggregate Deal Value # of Deals
14
3225 26
3831
65
122
39
17
34
18
3643 48
65 67
24
-10
10
30
50
70
90
110
130
2009 2010 2011 2012 2013 2014 2015 2016 2017 YTD
Nu
mb
er
of
Tra
nsa
cti
on
s
Number of Investments Number of Exits
Announced Target Buyer1/0/1900 0 Cargill, Incorporated
4/10/2017 Unified Grocers, Inc. SUPERVALU, Inc.
4/10/2017 Nest le Italiana - Frozen Food Business FRoSTA AG
4/10/2017 The New Pub Co. Ltd The Laine Pub Co. Ltd.
4/10/2017 Columbia Phytotechnology LLC International Flavors & Fragrances, Inc.
4/6/2017 Nobleza Iberica SA Bell AG
4/6/2017 Passport Food Group LLC Swander Pace Capital LLC
4/5/2017 Panera Bread Co. JAB Holdings, BDT Capital Partners
4/5/2017 Brighter Foods Ltd. Real Good Food Plc
4/5/2017 Oscar Mayer Ltd. Deutsche Beteiligungs AG
4/5/2017 Verquin Confiseur SAS Sucralliance SAS
PAGE |
L + 0
L + 200
L + 400
L + 600
L + 800
L + 1000
Av
era
ge
Sp
rea
d O
ve
r LI
BO
R
$0
$2
$4
$6
$8
$10
$12
$14
$16
1Q11 1Q12 1Q13 1Q14 1Q15 1Q16 1Q17
Loa
n V
olu
me
by
Qu
art
er
($ in
bill
ion
s)
Inst itutional Pro Rata
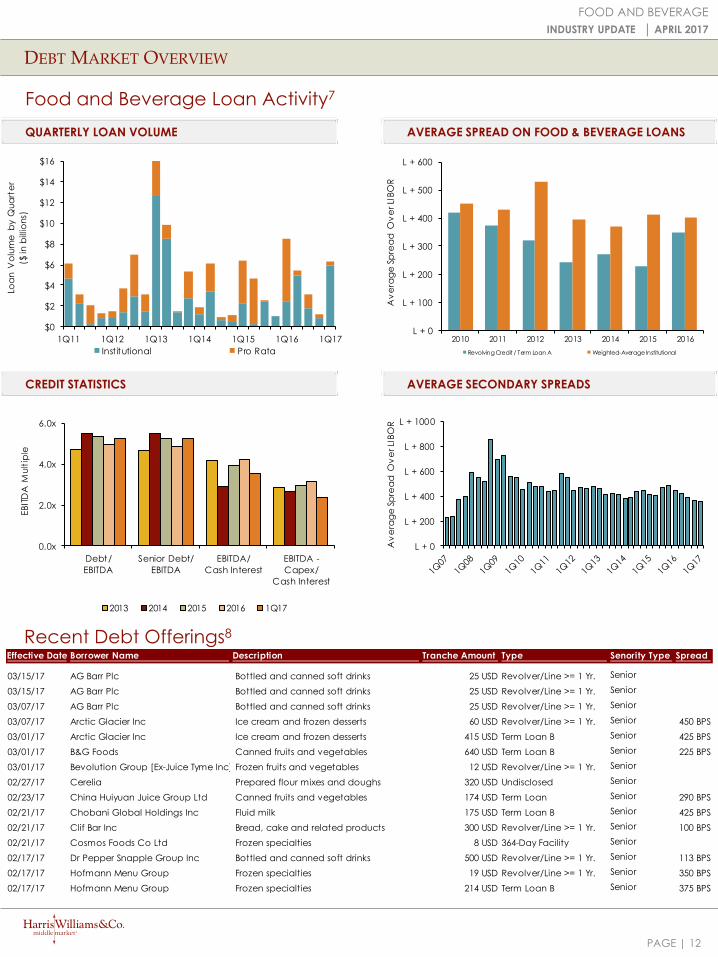
Effective Date Borrower Name Description Tranche Amount Type Senority Type Spread
03/15/17 AG Barr Plc Bottled and canned soft drinks 25 USD Revolver/Line >= 1 Yr. Senior
03/15/17 AG Barr Plc Bottled and canned soft drinks 25 USD Revolver/Line >= 1 Yr. Senior
03/07/17 AG Barr Plc Bottled and canned soft drinks 25 USD Revolver/Line >= 1 Yr. Senior
03/07/17 Arctic Glacier Inc Ice cream and frozen desserts 60 USD Revolver/Line >= 1 Yr. Senior 450 BPS
03/01/17 Arctic Glacier Inc Ice cream and frozen desserts 415 USD Term Loan B Senior 425 BPS
03/01/17 B&G Foods Canned fruits and vegetables 640 USD Term Loan B Senior 225 BPS
03/01/17 Bevolution Group [Ex-Juice Tyme Inc] Frozen fruits and vegetables 12 USD Revolver/Line >= 1 Yr. Senior
02/27/17 Cerelia Prepared flour mixes and doughs 320 USD Undisclosed Senior
02/23/17 China Huiyuan Juice Group Ltd Canned fruits and vegetables 174 USD Term Loan Senior 290 BPS
02/21/17 Chobani Global Holdings Inc Fluid milk 175 USD Term Loan B Senior 425 BPS
02/21/17 Clif Bar Inc Bread, cake and related products 300 USD Revolver/Line >= 1 Yr. Senior 100 BPS
02/21/17 Cosmos Foods Co Ltd Frozen specialties 8 USD 364-Day Facility Senior
02/17/17 Dr Pepper Snapple Group Inc Bottled and canned soft drinks 500 USD Revolver/Line >= 1 Yr. Senior 113 BPS
02/17/17 Hofmann Menu Group Frozen specialties 19 USD Revolver/Line >= 1 Yr. Senior 350 BPS
02/17/17 Hofmann Menu Group Frozen specialties 214 USD Term Loan B Senior 375 BPS
AVERAGE SPREAD ON FOOD & BEVERAGE LOANS
DEBT MARKET OVERVIEW
12
FOOD AND BEVERAGE
INDUSTRY UPDATE │ APRIL 2017
Food and Beverage Loan Activity7
AVERAGE SECONDARY SPREADS
Recent Debt Offerings8
CREDIT STATISTICS
QUARTERLY LOAN VOLUME
0.0x
2.0x
4.0x
6.0x
Debt/
EBITDA
Senior Debt/
EBITDA
EBITDA/
Cash Interest
EBITDA -
Capex/
Cash Interest
EB
ITD
A M
ult
iple
2013 2014 2015 2016 1Q17
L + 0
L + 100
L + 200
L + 300
L + 400
L + 500
L + 600
2010 2011 2012 2013 2014 2015 2016
Av
era
ge
Sp
rea
d O
ve
r LI
BO
R
Revolving Credit / Term Loan A Weighted-Average Institutional

PAGE |
Enterprise Enterprise Value Private Equity Geographic
Announced Target Seller Buyer
Value
($mm) Sales EBITDA EBIT Involvement Location
4/10/2017 Unified Grocers, Inc. - SUPERVALU, Inc. $375.0 0.1x - - N.A.
4/10/2017 Nest le Italiana - Frozen Food Business Nest lé Italiana SpA FRoSTA AG - - - - EU
4/10/2017 The New Pub Co. Ltd - The Laine Pub Co. Ltd. $5.0 - - - EU
4/10/2017 Columbia Phytotechnology LLC - International Flavors & Fragrances, Inc. - - - - N.A.
4/6/2017 Nobleza Iberica SA Nobleza Iberica SA Bell AG - - - - EU
4/6/2017 Passport Food Group LLC - Swander Pace Capital LLC - - - - P N.A.
4/5/2017 Panera Bread Co. - JAB Holdings, BDT Capital Partners $7,480.2 2.6x 18.8x - P N.A.
4/5/2017 Brighter Foods Ltd. - Real Good Food Plc $13.3 - - - EU
4/5/2017 Oscar Mayer Ltd. - Deutsche Beteiligungs AG - - - - P EU
4/5/2017 Verquin Confiseur SAS - Sucralliance SAS - - - - EU
4/5/2017 Treasury Wine Estates Ltd. Treasury Wine Estates Ltd. Delicato Family Vineyards LLC - - - - N.A.
4/4/2017 Rene Laurent - Frutarom Industries Ltd. $21.3 1.7x - - EU
4/4/2017 Custom Made Meals LLC - New Water Capital LP - - - - P N.A.
4/4/2017 CLEARLY DRINKS LTD - NorthEdge Capital LLP - - - - P EU
4/4/2017 Wozl 4 BV Wozl 4 BV Limburg Catering BV - - - - EU
4/3/2017 English Bay Batter, Inc. Kilmer Group Cérélia SAS - - - - Cross Border
4/3/2017 Truitt Bros., Inc. - Seneca Foods Corp. - - - - N.A.
4/3/2017 Westbridge Food Group Ltd. - CPF Investment Ltd. $75.0 0.2x - - EU
4/3/2017 PB Bake Off Special Products BV - Standard Investment Management - - - - EU
4/3/2017 Guckenheimer Enterprises, Inc. - ISS A/S $225.0 - - - Cross Border
3/31/2017 Country Fresh, Inc. Eos Partners Kainos Capital - - - - P N.A.
3/31/2017 Halieut is Fish & Co SAS Compagnie Financière et de Part icipations Roullier SACite Marine SAS - - - - EU
3/31/2017 GFA Chateau Haut-Batailley - Chateau Haut Batailley - - - - P EU
3/31/2017 Les Gâteaux de la Cousine SAS - Notus Technologies SAS - - - - P EU
3/31/2017 Maverick Brands LLC - New Age Beverages Corp. $11.1 - - - N.A.
3/31/2017 Kar Nut Products Co. - Palladium Equity Partners Advisor LLC - - - - N.A.
3/30/2017 Groupe Flo SA - Naxicap Partners SA - - - - EU
3/30/2017 Sombra Mezcal - Davos Brand - - - - N.A.
3/30/2017 Octane Coffee Company LLC - Revelator Coffee Co. - - - - N.A.
3/29/2017 Marley Beverage Co. LLC - New Age Beverages Corp. $13.0 - - - N.A.
3/29/2017 Oliver Conti SL - Grupo Perelada - - - - EU
3/29/2017 Más Que Menos 2010 SL Grup Cacheiro 2000 SL Nazca Capital SGECR SA - - - - P EU
3/29/2017 Vermont Butter & Cheese Creamery, Inc. - Land O'Lakes, Inc. - - - - P N.A.
3/28/2017 Confectionary Gran LLC - KDV Group OOO $17.5 0.7x - - EU
3/28/2017 Strauss Coffee BV - Strauss Group Ltd. $1,114.5 - - - P EU
3/28/2017 Wcrowe Falmouth Ltd. - Iberia Industry Capital Group SARL - - - - P EU
3/28/2017 The Head of Steam Ltd. Whitbread Plc Mi Viejo Fruta Ltd. - - - - EU
3/27/2017 Potel & Chabot SA - Accor SA - - - - P EU
3/27/2017 Cheddar's Scratch Kitchen - Darden Restaurants, Inc. $780.0 - 10.4x - P N.A.
3/27/2017 Supremia Grup SRL - Ardian SA - - - - EU
M&A OVERVIEW*
13
FOOD AND BEVERAGE
INDUSTRY UPDATE │ APRIL 2017
QUARTERLY M&A ACTIVITY
Median LTM Trading Multiples & Quarterly Food & Beverage M&A5
Recent Food and Beverage M&A5
MEDIAN LTM TRADING MULTIPLES
* M&A transactions include European and cross-border deals since 2015.
10.0x
11.0x
12.0x
13.0x
14.0x
15.0x
16.0x
Fe
b-1
6
Ma
r-16
Ap
r-1
6
Ma
y-1
6
Ju
n-1
6
Ju
l-16
Au
g-1
6
Se
p-1
6
Oc
t-1
6
No
v-1
6
De
c-1
6
Ja
n-1
7
Fe
b-1
7
Me
dia
n T
rad
ing
Mu
ltip
le
Food Products, Processing, and Ingredients Retail and Restaurants
53 52 4839 33
46 47 52
70
89
58 57
82
141
118
92 94107
139
166
126
16
4 79
610
13 87
10
6
105
20
18
8
19 19
17
46
40
35
4
0
20
40
60
80
100
120
140
160
180
200
Q11
2
Q21
2
Q31
2
Q41
2
Q11
3
Q21
3
Q31
3
Q41
3
Q11
4
Q21
4
Q31
4
Q41
4
Q11
5
Q21
5
Q31
5
Q41
5
Q11
6
Q21
6
Q31
6
Q41
6
Q11
7
Q21
7
Num
be
r o
f Tr
an
sac
tio
ns
Strategic Acquirer Private Equity Acquirer

PAGE |
Enterprise Enterprise Value Private Equity European
Announced Target Seller Buyer
Value
($mm) Sales EBITDA EBIT Involvement Transaction
3/25/2017 Reflex Nutrit ion Ltd. - Associated Brit ish Foods Plc - - - - P EU
3/23/2017 Checkers Drive-In Restaurants, Inc. - Oak Hill Capital Management LLC $525.0 - - - P N.A.
3/23/2017 The Rancher's Grill Steakhouse - Star Buffet, Inc. - - - - N.A.
3/23/2017 Fresh Frozen Foods LLC Inventure Foods, Inc. The Pictsweet Co. $23.7 - - - N.A.
3/20/2017 Park Cakes Ltd. Eliot Luxembourg Holdco SARL Park Cakes Ltd. - - - - P EU
3/20/2017 Prosol Gest ion SASU - Ardian SA - - - - P EU
3/20/2017 Compound Photonics Ltd. Compound Photonics Ltd. KAIAM Corp. - - - - Cross Border
3/20/2017 Arct ic Glacier Group Holdings, Inc. - The Carlyle Group LP $723.0 - - - P N.A.
3/18/2017 M St ill Catering Ltd - The Liberat ion Group Ltd. - - - - EU
3/17/2017 Bioferme Oy - Karl Fazer Oy AB - - - - EU
3/16/2017 Chateau Trianon SARL - Trianon Ltd - - - - EU
3/16/2017 Thanasi Foods LLC - Conagra Brands, Inc. - - - - P N.A.
3/15/2017 Restaurant Simplicissimus - Hotel zum Ritter St Georg - - - - EU
3/14/2017 Pelican Rouge Group BV - Selecta Group BV - - - - P EU
3/13/2017 Euromar Commodit ies GmbH Transmar Group LLC Ecom Agroindustrial Corp. Ltd. - - - - EU
3/13/2017 Wrawby Street Hostelry Wrawby Street Hostelry Bermondsey Pub Co. Ltd. - - - - EU
3/10/2017 Goodfood Market, Inc. - Mira VII Acquisit ion Corp. - - - - P Cross Border
3/9/2017 Bird Rock Coffee Roasters, Inc. - Coffee Roast ing Co. - - - - N.A.
3/8/2017 Mé Fresh Markets SA - Juan Fornés Fornés SA - - - - EU
3/8/2017 Goethe SL - Damm SA - - - - EU
3/8/2017 Bio-Zentrale Naturprodukte GmbH LINDHORST- Gruppe ZERTUS GmbH - - - - EU
3/7/2017 SRA Foods, Inc. - US Foods Holding Corp. - - - - N.A.
3/7/2017 Groupe Commensal, Inc. Imvescor Restaurant Group, Inc. Food Pasta Romana, Inc. $3.1 - - - Cross Border
3/7/2017 Grenade (UK) Ltd. - Lion Capital LLP $88.2 - - - P EU
3/6/2017 Chris Candies, Inc. - Cemoi Chocolat ier SAS - - - - Cross Border
3/5/2017 Laan Heiloo BV - Idun Industri AS - - - - EU
3/3/2017 Dok Dall'Ava Srl - CA Traiteur et Salaisons SAS - - - - EU
3/2/2017 O Olive Oil, Inc. - Landec Corp. $10.0 - - - N.A.
3/2/2017 Westfälische Lebensmittelwerke Lindemann - Bunge Deutschland GmbH - - - - EU
3/2/2017 Hawkshead Brewery Ltd. - Halewood International Ltd. - - - - EU
3/2/2017 Johnson Industries International, Inc. - Tetra Pak International SA - - - - Cross Border
2/27/2017 Berlypan SL - Berlys Corporación Alimentaria SA - - - - EU
2/24/2017 PIZZA-BLITZ Godly AG - Telepizza Group SA - - - - EU
2/24/2017 frostkrone Tiefkühlkost GmbH - EMERAM Capital Partners GmbH - - - - P EU
2/24/2017 Remke Markets, Inc. - Fresh Encounter, Inc. - - - - N.A.
2/24/2017 Intercontinental Coffee Trading, Inc. - Hamburg Coffee Co. Hacofco mbH - - - - Cross Border
2/23/2017 Ready Pac Foods, Inc. - Bonduelle SA $409.0 - - - Cross Border
2/23/2017 Latvijas Piens SIA Latraps Trade SIA EXIMO Agro-Marketing AG - - - - P EU
2/23/2017 Jan Schots NV - Breydel Chimay Group NV - - - - EU
2/22/2017 Rhenser Mineralbrunnen GmbH - Rhenser Mineralbrunnen GmbH - - - - P EU
2/21/2017 Popeyes Louisiana Kitchen, Inc. - Restaurant Brands International, Inc. $1,768.0 6.6x 20.8x 22.5x Cross Border
2/21/2017 Zabka Polska Sp zoo - CVC Capital Partners Ltd. $1,230.8 0.9x - - P EU
2/21/2017 365 Matins SA - Poulaillon SA $1.5 0.8x - - P EU
2/20/2017 La Versa Vit icoltori dal 1905 SpA - Cavit Cantina Vit icoltori Consorzio $4.5 0.6x - - EU
2/17/2017 Candyking Holding AB - Cloetta AB $62.1 0.4x 7.9x 18.3x P EU
2/17/2017 Walden Farms, Inc. - PANOS Holdings - - - - N.A.
2/16/2017 The Yorkshire Provender Ltd. - Hain Celest ial Group, Inc. - - - - Cross Border
2/16/2017 D. Brickman, Inc. - Metropolitan Foods, Inc. - - - - N.A.
2/16/2017 Kombinat Myasnoy Kalacheyevskiy OAO Kamdel OOO Kombinat Myasnoy Kalacheyevskiy OAO $0.0 0.0x - - P EU
2/16/2017 Open Road Snacks, Inc. - Pasta Fresca, Inc. - - - - N.A.
2/16/2017 Gourmand In - Gourmand Inn - - - - P EU
2/15/2017 Maka 2 SAS - Maka 2 SAS - - - - P EU
2/14/2017 All American Foods, Inc. - US Foods Holding Corp. - - - - N.A.
2/13/2017 WELL PLUS TRADE Vertriebs GmbH & Co. KG - HQ Equita GmbH; WELL PLUS TRADE Vertriebs GmbH /Private Group/- - - - P EU
2/9/2017 Ruggeri & C. SpA - Rotkäppchen-Mumm Sektkellereien - - - - EU
2/9/2017 Diamant Nahrungsmittel GmbH Wilhelm Werhahn KG Puratos NV - - - - EU
2/9/2017 02 Breathe LLC - Elev8 Brands, Inc. - - - - N.A.
2/9/2017 Grozette BV - Vandersterre Groep Bedrijven BV - - - - P EU
2/8/2017 Lyaxovichsky Molochny Zavod COAO - B.S.A. International SA (Belgium) $13.5 - - - EU
2/8/2017 Coca-Cola Southwest Beverages LLC The Coca-Cola Co. AC Bebidas S de RL de CV - - - - Cross Border
2/7/2017 Sema E SASU - BNP Paribas Développement SA - - - - P EU
2/7/2017 Nest lé Waters Deutschland GmbH Nest lé SA HANSA-HEEMAN AG - - - - EU
2/7/2017 PS Bageri AB - Lantmännen Unibake Danmark A/S - - - - EU
2/6/2017 Body & Fit Sportsnutrit ion BV - Glanbia Plc - - - - EU
2/6/2017 Grass Advantage LLC - Glanbia Plc - - - - Cross Border
M&A OVERVIEW*
14
FOOD AND BEVERAGE
INDUSTRY UPDATE │ APRIL 2017
Recent Food and Beverage M&A5
* M&A transactions include European and cross-border deals since 2015.
PAGE |
FOOD AND BEVERAGE EARNINGS RELEASE CALENDAR
15
FOOD AND BEVERAGE
INDUSTRY UPDATE │ APRIL 2017
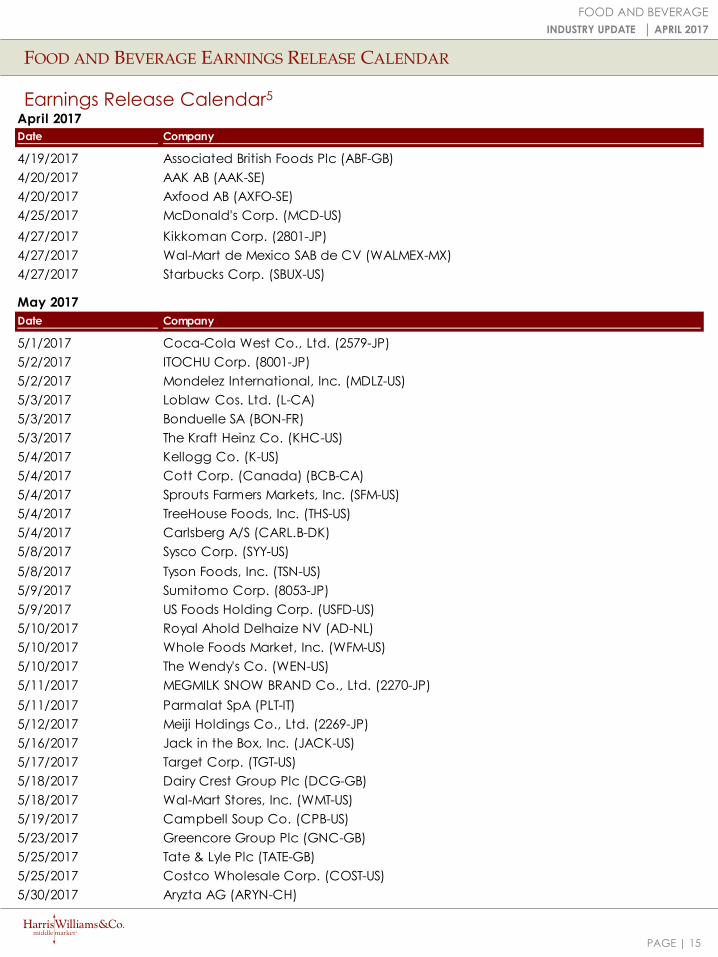
Earnings Release Calendar5
April 2017
Date Company
4/19/2017 Associated British Foods Plc (ABF-GB)
4/20/2017 AAK AB (AAK-SE)
4/20/2017 Axfood AB (AXFO-SE)
4/25/2017 McDonald's Corp. (MCD-US)4/25/2017 Brinker International, Inc. (EAT-US)
4/27/2017 Kikkoman Corp. (2801-JP)
4/27/2017 Wal-Mart de Mexico SAB de CV (WALMEX-MX)
4/27/2017 Starbucks Corp. (SBUX-US)
May 2017
Date Company
5/1/2017 Coca-Cola West Co., Ltd. (2579-JP)
5/2/2017 ITOCHU Corp. (8001-JP)
5/2/2017 Mondelez International, Inc. (MDLZ-US)
5/3/2017 Loblaw Cos. Ltd. (L-CA)
5/3/2017 Bonduelle SA (BON-FR)
5/3/2017 The Kraft Heinz Co. (KHC-US)
5/4/2017 Kellogg Co. (K-US)
5/4/2017 Cott Corp. (Canada) (BCB-CA)
5/4/2017 Sprouts Farmers Markets, Inc. (SFM-US)
5/4/2017 TreeHouse Foods, Inc. (THS-US)
5/4/2017 Carlsberg A/S (CARL.B-DK)
5/8/2017 Sysco Corp. (SYY-US)
5/8/2017 Tyson Foods, Inc. (TSN-US)
5/9/2017 Sumitomo Corp. (8053-JP)
5/9/2017 US Foods Holding Corp. (USFD-US)
5/10/2017 Royal Ahold Delhaize NV (AD-NL)
5/10/2017 Whole Foods Market, Inc. (WFM-US)
5/10/2017 The Wendy's Co. (WEN-US)
5/11/2017 MEGMILK SNOW BRAND Co., Ltd. (2270-JP)
5/11/2017 Parmalat SpA (PLT-IT)
5/12/2017 Meiji Holdings Co., Ltd. (2269-JP)
5/16/2017 Jack in the Box, Inc. (JACK-US)
5/17/2017 Target Corp. (TGT-US)
5/18/2017 Dairy Crest Group Plc (DCG-GB)
5/18/2017 Wal-Mart Stores, Inc. (WMT-US)
5/19/2017 Campbell Soup Co. (CPB-US)
5/23/2017 Greencore Group Plc (GNC-GB)
5/25/2017 Tate & Lyle Plc (TATE-GB)
5/25/2017 Costco Wholesale Corp. (COST-US)
5/30/2017 Aryzta AG (ARYN-CH)

Energy, Power& Infrastructure
IndustrialsHealthcare & Life Sciences
Transportation & Logistics
Aerospace, Defense & Government
Services
Business Services
Building Products & Materials
Technology, Media & Telecom
Specialty Distribution
Consumer
PAGE |
HARRIS WILLIAMS & CO. OFFICE LOCATIONS
UNITED STATES EUROPE
BostonOne International PlaceSuite 2620Boston, Massachusetts 02110Phone: +1 (617) 482-7501
Cleveland1900 East 9th Street20th FloorCleveland, Ohio 44114Phone: +1 (216) 689-2400
Minneapolis222 South 9th StreetSuite 3350Minneapolis, Minnesota 55402Phone: +1 (612) 359-2700
Richmond (Headquarters)1001 Haxall Point9th FloorRichmond, Virginia 23219Phone: +1 (804) 648-0072
San Francisco575 Market Street31st FloorSan Francisco, California 94105Phone: +1 (415) 288-4260
Washington, D.C. 800 17th St. NW2nd FloorWashington, D.C. 20006Phone: +1 202-207-2300
FrankfurtBockenheimer Landstrasse 33-3560325 FrankfurtGermanyPhone: +49 069 3650638 00
London63 Brook StreetLondon W1K 4HS, EnglandPhone: +44 (0) 20 7518 8900
NETWORK OFFICES
Beijing
Hong Kong
Mumbai
New Delhi
Shanghai
Consumer
OUR FIRM
FOOD AND BEVERAGE
INDUSTRY UPDATE │ APRIL 2017
16
Harris Williams & Co. has a broad range of industry expertise, which creates powerful opportunities.Our clients benefit from our deep-sector experience, integrated industry intelligence andcollaboration across the firm, and our commitment to learning what makes them unique. For moreinformation, visit our website at www.harriswilliams.com/industries.

PAGE |
HARRIS WILLIAMS & CO.
1. IMF
2. U.S. Bureau of Labor Statistics
3. Unweighted Average
4. U.S. Census Bureau
5. Factset
6. Thomson Financial
7. S&P
8. Reuters
SOURCES
FOOD AND BEVERAGE
INDUSTRY UPDATE │ APRIL 2017
DISCLOSURES
17
Harris Williams & Co. (www.harriswilliams.com) is a preeminent middle market investment bank focused on the advisory needs of clients worldwide. The firm has deep industry knowledge, global transaction expertise, and an unwavering commitment to excellence. Harris Williams & Co. provides sell-side and acquisition advisory, restructuring advisory, board advisory, private placements, and capital markets advisory services.
Investment banking services are provided by Harris Williams LLC, a registered broker-dealer and member of FINRA and SIPC, and Harris Williams & Co. Ltd, which is a private limited company incorporated under English law with its registered office at 5th Floor, 6 St. Andrew Street, London EC4A 3AE, UK, registered with the Registrar of Companies for England and Wales (registration number 7078852). Harris Williams & Co. Ltd is authorized and regulated by the Financial Conduct Authority. Harris Williams & Co. is a trade name under which Harris Williams LLC and Harris Williams & Co. Ltd conduct business.
THIS REPORT MAY CONTAIN REFERENCES TO REGISTERED TRADEMARKS, SERVICE MARKS AND COPYRIGHTS OWNED BY THIRD-PARTY INFORMATION PROVIDERS. NONE OF THE THIRD-PARTY INFORMATION PROVIDERS IS ENDORSING THE OFFERING OF, AND SHALL NOT IN ANY WAY BE DEEMED AN ISSUER OR UNDERWRITER OF, THE SECURITIES, FINANCIAL INSTRUMENTS OR OTHER INVESTMENTS DISCUSSED IN THIS REPORT, AND SHALL NOT HAVE ANY LIABILITY OR RESPONSIBILITY FOR ANY STATEMENTS MADE IN THE REPORT OR FOR ANY FINANCIAL STATEMENTS, FINANCIAL PROJECTIONS OR OTHER FINANCIAL INFORMATION CONTAINED OR ATTACHED AS AN EXHIBIT TO THE REPORT. FOR MORE INFORMATION ABOUT THE MATERIALS PROVIDED BY SUCH THIRD PARTIES, PLEASE CONTACT US.
The information and views contained in this report were prepared by Harris Williams & Co. (“Harris Williams”). It is not a research report, as such term is defined by applicable law and regulations, and is provided for informational purposes only. It is not to be construed as an offer to buy or sell or a solicitation of an offer to buy or sell any financial instruments or to participate in any particular trading strategy. The information contained herein is believed by Harris Williams to be reliable, but Harris Williams makes no representation as to the accuracy or completeness of such information. Harris Williams and/or its affiliates may be market makers or specialists in, act as advisers or lenders to, have positions in and effect transactions in securities of companies mentioned herein and also may provide, may have provided, or may seek to provide investment banking services for those companies. In addition, Harris Williams and/or its affiliates or their respective officers, directors and employees may hold long or short positions in the securities, options thereon or other related financial products of companies discussed herein. Opinions, estimates and projections in this report constitute Harris Williams’ judgment and are subject to change without notice. The financial instruments discussed in this report may not be suitable for all investors, and investors must make their own investment decisions using their own independent advisors as they believe necessary and based upon their specific financial situations and investment objectives. Also, past performance is not necessarily indicative of future results. No part of this material may be copied or duplicated in any form or by any means, or redistributed, without Harris Williams’ prior written consent.
Copyright© 2017 Harris Williams & Co., all rights reserved.