food and beverage - harriswilliams.com and beverage manufacturers have ... 10/14/17 09/29/17 long...
TRANSCRIPT
www.harriswilliams.com
Investment banking services are provided by Harris Williams LLC, a registered broker-dealer and member of FINRA and SIPC, and Harris Williams & Co. Ltd, which is a private limited company incorporated under English law with its registered office at 5th Floor, 6 St. Andrew Street, London EC4A 3AE, UK, registered with the Registrar of Companies for England and Wales (registration number 07078852). Harris Williams & Co. Ltd is authorized and regulated by the Financial Conduct Authority. Harris Williams & Co. is a trade name under which Harris Williams LLC and Harris Williams & Co. Ltd conduct business.
FOOD AND BEVERAGEINDUSTRY UPDATE │ NOVEMBER 2017
PAGE |
www.harriswilliams.com
WHAT WE’RE SEEING
1
CONTENTS INDUSTRY VITAL SIGNS EQUITY MARKET OVERVIEW M&A MARKET OVERVIEW DEBT MARKET OVERVIEW RECENT M&A ACTIVITY EARNINGS CALENDAR
GROUP OVERVIEWHarris Williams & Co. is a leading advisor to the food and beverage market. Our significant experience covers a broad range of end markets, industries, and business models. This particular report focuses on trends and metrics in the following areas: Agribusiness Bakery Beverages Branded and Private Label Dairy Distribution Ingredients Meat and Protein Natural and Organic Processing Produce Restaurant and Retail Snacks
CONTACTS
Tim AlexanderManaging [email protected]+1 (612) 359-2716Ryan BudlongManaging [email protected]+1 (415) 217-3409Brant [email protected]+1 (612) 359-2709Ryan [email protected]+1 (612) 359-2703Andy WarczakVice [email protected]+1 (612) 359-2714
MARKET UPDATE
FOOD AND BEVERAGE INDUSTRY UPDATE │ NOVEMBER 2017
a portfolio company of
has been acquired by
CLOSED HW&CO. TRANSACTIONS
WHAT WE’VE BEEN DOING
a portfolio company of
has been acquired by
a portfolio company of
has been acquired by
a subsidiary of
has been acquired by
a portfolio company of
has been acquired by
has been acquired by
a portfolio company of
has been acquired by
and
The food & beverage M&A market remains active through November, with several
notable transactions. Hormel Foods announced its acquisition of Columbus
Manufacturing, demonstrating the continued appetite of large CPG companies to
enter or continue to expand their offerings in the perimeter of the store. Also
notable is Unilever’s announced acquisition of Tazo. Unilever is actively looking for
growth avenues, and the beverage space is experiencing outsized growth as
compared to other packaged food categories.
a portfolio company of
has been acquired by
a portfolio company of
has been acquired byhas been acquired by
The Soup & Infant Feeding Business of
has been acquired by
PizzaRev Founders
a partnership of
&
has been acquired by
a division of
a portfolio company of
PAGE |
90
100
110
120
130
140
Oct-13 Apr-14 Oct-14 Apr-15 Oct-15 Apr-16 Oct-16 Apr-17 Oct-17
Prot
ein
Pric
e In
dex
Beef Pork Poult ry
WHAT WE’VE BEEN READING
2
FOOD AND BEVERAGEINDUSTRY UPDATE │ NOVEMBER 2017
VITAL SIGNS
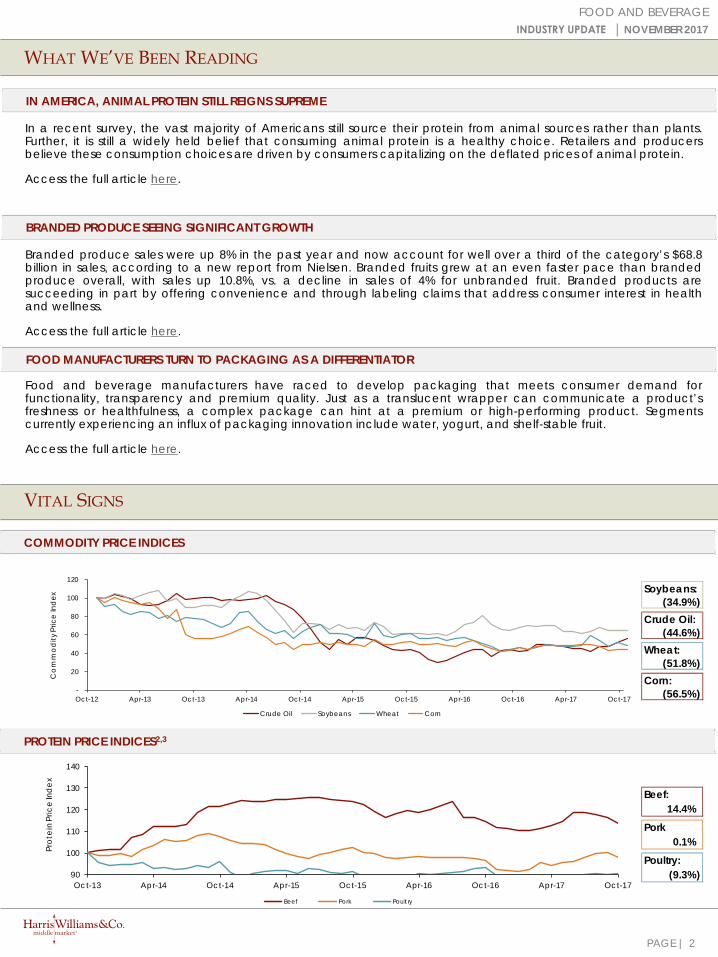
COMMODITY PRICE INDICES
PROTEIN PRICE INDICES2,3
IN AMERICA, ANIMAL PROTEIN STILL REIGNS SUPREME
Food and beverage manufacturers have raced to develop packaging that meets consumer demand forfunctionality, transparency and premium quality. Just as a translucent wrapper can communicate a product’sfreshness or healthfulness, a complex package can hint at a premium or high-performing product. Segmentscurrently experiencing an influx of packaging innovation include water, yogurt, and shelf-stable fruit.
Access the full article here.
FOOD MANUFACTURERS TURN TO PACKAGING AS A DIFFERENTIATOR
BRANDED PRODUCE SEEING SIGNIFICANT GROWTH
In a recent survey, the vast majority of Americans still source their protein from animal sources rather than plants.Further, it is still a widely held belief that consuming animal protein is a healthy choice. Retailers and producersbelieve these consumption choices are driven by consumers capitalizing on the deflated prices of animal protein.
Access the full article here.
Branded produce sales were up 8% in the past year and now account for well over a third of the category’s $68.8billion in sales, according to a new report from Nielsen. Branded fruits grew at an even faster pace than brandedproduce overall, with sales up 10.8%, vs. a decline in sales of 4% for unbranded fruit. Branded products aresucceeding in part by offering convenience and through labeling claims that address consumer interest in healthand wellness.
Access the full article here.
Beef:14.4%
Pork0.1%
Poultry:(9.3%)
Soybeans:(34.9%)
Crude Oil:(44.6%)
Wheat:(51.8%)
Corn:(56.5%)-
20
40
60
80
100
120
Oct-12 Apr-13 Oct-13 Apr-14 Oct-14 Apr-15 Oct-15 Apr-16 Oct-16 Apr-17 Oct-17
Co
mm
od
ity P
rice
Ind
ex
Crude Oil Soybeans Wheat Corn
PAGE |
VITAL SIGNS
3
FOOD AND BEVERAGEINDUSTRY UPDATE │ NOVEMBER 2017
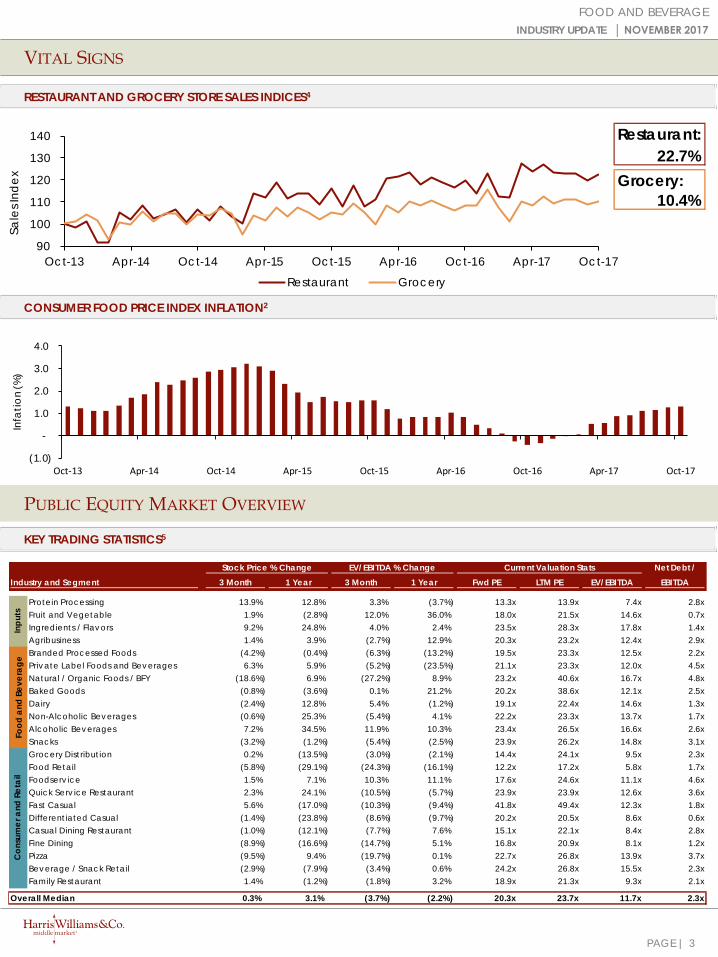
RESTAURANT AND GROCERY STORE SALES INDICES4
CONSUMER FOOD PRICE INDEX INFLATION2
PUBLIC EQUITY MARKET OVERVIEW
KEY TRADING STATISTICS5
Restaurant:22.7%
Grocery:10.4%
90
100
110
120
130
140
Oct-13 Apr-14 Oct-14 Apr-15 Oct-15 Apr-16 Oct-16 Apr-17 Oct-17
Sale
s Ind
ex
Restaurant Grocery
Net Debt /3 Month 1 Year 3 Month 1 Year Fwd PE LTM PE EV/EBITDA EBITDA
Protein Processing 13.9% 12.8% 3.3% (3.7%) 13.3x 13.9x 7.4x 2.8xFruit and Vegetable 1.9% (2.8%) 12.0% 36.0% 18.0x 21.5x 14.6x 0.7xIngredients / Flavors 9.2% 24.8% 4.0% 2.4% 23.5x 28.3x 17.8x 1.4xAgribusiness 1.4% 3.9% (2.7%) 12.9% 20.3x 23.2x 12.4x 2.9xBranded Processed Foods (4.2%) (0.4%) (6.3%) (13.2%) 19.5x 23.3x 12.5x 2.2xPrivate Label Foods and Beverages 6.3% 5.9% (5.2%) (23.5%) 21.1x 23.3x 12.0x 4.5xNatural / Organic Foods / BFY (18.6%) 6.9% (27.2%) 8.9% 23.2x 40.6x 16.7x 4.8xBaked Goods (0.8%) (3.6%) 0.1% 21.2% 20.2x 38.6x 12.1x 2.5xDairy (2.4%) 12.8% 5.4% (1.2%) 19.1x 22.4x 14.6x 1.3xNon-Alcoholic Beverages (0.6%) 25.3% (5.4%) 4.1% 22.2x 23.3x 13.7x 1.7xAlcoholic Beverages 7.2% 34.5% 11.9% 10.3% 23.4x 26.5x 16.6x 2.6xSnacks (3.2%) (1.2%) (5.4%) (2.5%) 23.9x 26.2x 14.8x 3.1xGrocery Distribution 0.2% (13.5%) (3.0%) (2.1%) 14.4x 24.1x 9.5x 2.3xFood Retail (5.8%) (29.1%) (24.3%) (16.1%) 12.2x 17.2x 5.8x 1.7xFoodserv ice 1.5% 7.1% 10.3% 11.1% 17.6x 24.6x 11.1x 4.6xQuick Serv ice Restaurant 2.3% 24.1% (10.5%) (5.7%) 23.9x 23.9x 12.6x 3.6xFast Casual 5.6% (17.0%) (10.3%) (9.4%) 41.8x 49.4x 12.3x 1.8xDifferentiated Casual (1.4%) (23.8%) (8.6%) (9.7%) 20.2x 20.5x 8.6x 0.6xCasual Dining Restaurant (1.0%) (12.1%) (7.7%) 7.6% 15.1x 22.1x 8.4x 2.8xFine Dining (8.9%) (16.6%) (14.7%) 5.1% 16.8x 20.9x 8.1x 1.2xPizza (9.5%) 9.4% (19.7%) 0.1% 22.7x 26.8x 13.9x 3.7xBeverage / Snack Retail (2.9%) (7.9%) (3.4%) 0.6% 24.2x 26.8x 15.5x 2.3xFamily Restaurant 1.4% (1.2%) (1.8%) 3.2% 18.9x 21.3x 9.3x 2.1x
Overall Median 0.3% 3.1% (3.7%) (2.2%) 20.3x 23.7x 11.7x 2.3x
Con
sum
er a
nd R
etai
l
Industry and SegmentStock Price % Change EV/EBITDA % Change Current Valuation Stats
Inpu
tsFo
od a
nd B
ever
age
(1.0)
-
1.0
2.0
3.0
4.0
Oct-13 Apr-14 Oct-14 Apr-15 Oct-15 Apr-16 Oct-16 Apr-17 Oct-17
Infa
tion
(%)

PAGE |
PUBLIC EQUITY MARKET OVERVIEW
4
FOOD AND BEVERAGEINDUSTRY UPDATE │ NOVEMBER 2017
PUBLIC COMPANY SECTOR PERFORMANCE (MEDIAN ONE YEAR CHANGE IN STOCK PRICE)5
RECENT EQUITY OFFERINGS6
Close Date Filing Date Issuer Ticker Transaction TypeGross Proceeds
($mm) Use of Funds11/1/17 11/01/17 Naturally Splendid Entrps LTD NSP Follow-On $0.6 General Working Capital
Purposes10/23/17 10/23/17 Fat Brands Inc FAT IPO $24.0 Pursue Growth Opportunities
1/0/00 09/21/17 Muscle Maker Inc MMB IPO $20.0 General Working Capital Purposes
10/14/17 09/29/17 Long Island Iced Tea Corp LTEA Follow-On $1.3 General Corporate Purposes
9/14/17 09/14/17 RAVE Restaurant Group Inc RAVE Rights $5.0 Repay IndebtednessGeneral Corporate Purposes
9/13/17 09/13/17 Performance Food Group Co PFGC Follow-On $142.0 Liquidity for Private Owners
9/12/17 05/11/14 Organto Foods Inc OGO Follow-On $4.1 Pursue Growth Opportunities
8/15/17 08/09/17 Eastside Distilling Inc ESDI Follow-On $5.4 General Corporate Purposes
8/8/17 08/08/17 McCormick & Co Inc MKC Follow-On $482.0 Acquisition FinancingGeneral Corporate Purposes
8/4/17 08/04/17 Organto Foods Inc OGO Follow-On $0.3 Product Development / R&D7/13/17 07/13/17 GreenSpace Brands Inc JTR Follow-On $7.9 Working Capital
General Corporate Purposes6/21/17 06/21/17 Organto Foods Inc OGO Follow-On $1.4 Pursue Growth Opportunities
Food RetailDifferentiated Casual
Fast CasualFine Dining
Grocery DistributionCasual Dining Restaurant
Bev erage / Snack RetailBaked Goods
Fruit and VegetableSnacks
Family RestaurantBranded Processed Foods
AgribusinessPriv ate Label
Natural / Organic / BFYFoodserv ice
PizzaDairyProtein Processing
S&PQuick Serv ice Restaurant
Ingredients / Flav orsNon-Alcoholic Bev erages
Alcoholic Bev erages
(35.0%) (25.0%) (15.0%) (5.0%) 5.0% 15.0% 25.0% 35.0%
Inputs Food and Beverage Consumer and Retail
PAGE |
PUBLIC COMPARABLES5
5
FOOD AND BEVERAGE
INDUSTRY UPDATE │ NOVEMBER 2017
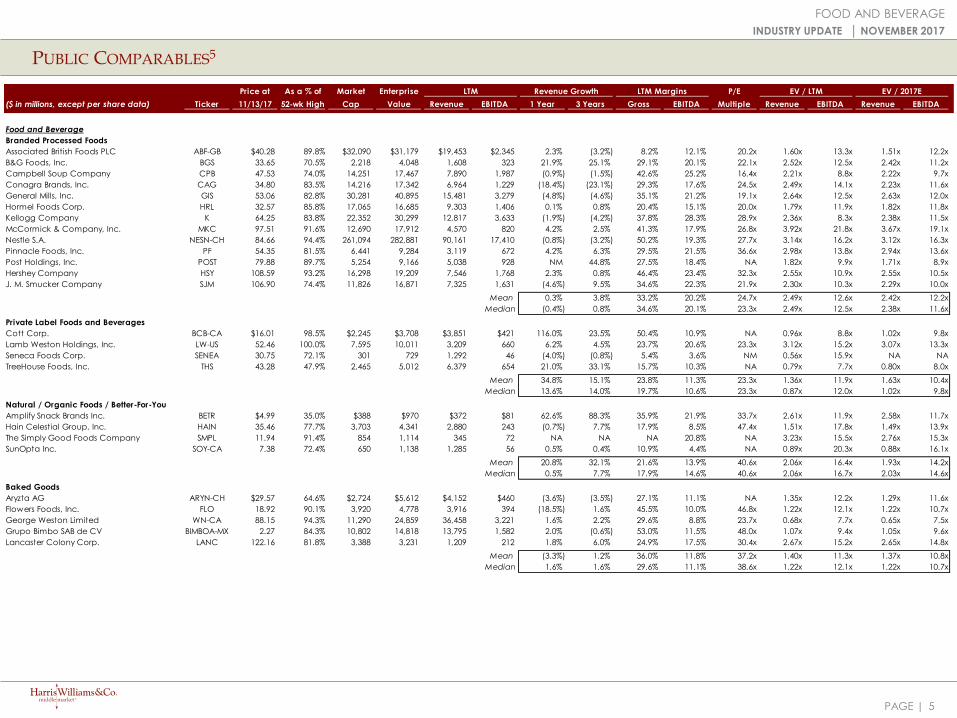
Price at As a % of Market Enterprise P/E
($ in millions, except per share data) Ticker 11/13/17 52-wk High Cap Value Revenue EBITDA 1 Year 3 Years Gross EBITDA Multiple Revenue EBITDA Revenue EBITDA
Food and Beverage
Branded Processed Foods
Associated British Foods PLC ABF-GB $40.28 89.8% $32,090 $31,179 $19,453 $2,345 2.3% (3.2%) 8.2% 12.1% 20.2x 1.60x 13.3x 1.51x 12.2x
B&G Foods, Inc. BGS 33.65 70.5% 2,218 4,048 1,608 323 21.9% 25.1% 29.1% 20.1% 22.1x 2.52x 12.5x 2.42x 11.2x
Campbell Soup Company CPB 47.53 74.0% 14,251 17,467 7,890 1,987 (0.9%) (1.5%) 42.6% 25.2% 16.4x 2.21x 8.8x 2.22x 9.7x
Conagra Brands, Inc. CAG 34.80 83.5% 14,216 17,342 6,964 1,229 (18.4%) (23.1%) 29.3% 17.6% 24.5x 2.49x 14.1x 2.23x 11.6x
General Mills, Inc. GIS 53.06 82.8% 30,281 40,895 15,481 3,279 (4.8%) (4.6%) 35.1% 21.2% 19.1x 2.64x 12.5x 2.63x 12.0x
Hormel Foods Corp. HRL 32.57 85.8% 17,065 16,685 9,303 1,406 0.1% 0.8% 20.4% 15.1% 20.0x 1.79x 11.9x 1.82x 11.8x
Kellogg Company K 64.25 83.8% 22,352 30,299 12,817 3,633 (1.9%) (4.2%) 37.8% 28.3% 28.9x 2.36x 8.3x 2.38x 11.5x
McCormick & Company, Inc. MKC 97.51 91.6% 12,690 17,912 4,570 820 4.2% 2.5% 41.3% 17.9% 26.8x 3.92x 21.8x 3.67x 19.1x
Nestle S.A. NESN-CH 84.66 94.4% 261,094 282,881 90,161 17,410 (0.8%) (3.2%) 50.2% 19.3% 27.7x 3.14x 16.2x 3.12x 16.3x
Pinnacle Foods, Inc. PF 54.35 81.5% 6,441 9,284 3,119 672 4.2% 6.3% 29.5% 21.5% 36.6x 2.98x 13.8x 2.94x 13.6x
Post Holdings, Inc. POST 79.88 89.7% 5,254 9,166 5,038 928 NM 44.8% 27.5% 18.4% NA 1.82x 9.9x 1.71x 8.9x
Hershey Company HSY 108.59 93.2% 16,298 19,209 7,546 1,768 2.3% 0.8% 46.4% 23.4% 32.3x 2.55x 10.9x 2.55x 10.5x
J. M. Smucker Company SJM 106.90 74.4% 11,826 16,871 7,325 1,631 (4.6%) 9.5% 34.6% 22.3% 21.9x 2.30x 10.3x 2.29x 10.0x
Mean 0.3% 3.8% 33.2% 20.2% 24.7x 2.49x 12.6x 2.42x 12.2x
Median (0.4%) 0.8% 34.6% 20.1% 23.3x 2.49x 12.5x 2.38x 11.6x
Private Label Foods and Beverages
Cott Corp. BCB-CA $16.01 98.5% $2,245 $3,708 $3,851 $421 116.0% 23.5% 50.4% 10.9% NA 0.96x 8.8x 1.02x 9.8x
Lamb Weston Holdings, Inc. LW-US 52.46 100.0% 7,595 10,011 3,209 660 6.2% 4.5% 23.7% 20.6% 23.3x 3.12x 15.2x 3.07x 13.3x
Seneca Foods Corp. SENEA 30.75 72.1% 301 729 1,292 46 (4.0%) (0.8%) 5.4% 3.6% NM 0.56x 15.9x NA NA
TreeHouse Foods, Inc. THS 43.28 47.9% 2,465 5,012 6,379 654 21.0% 33.1% 15.7% 10.3% NA 0.79x 7.7x 0.80x 8.0x
Mean 34.8% 15.1% 23.8% 11.3% 23.3x 1.36x 11.9x 1.63x 10.4x
Median 13.6% 14.0% 19.7% 10.6% 23.3x 0.87x 12.0x 1.02x 9.8x
Natural / Organic Foods / Better-For-You
Amplify Snack Brands Inc. BETR $4.99 35.0% $388 $970 $372 $81 62.6% 88.3% 35.9% 21.9% 33.7x 2.61x 11.9x 2.58x 11.7x
Hain Celestial Group, Inc. HAIN 35.46 77.7% 3,703 4,341 2,880 243 (0.7%) 7.7% 17.9% 8.5% 47.4x 1.51x 17.8x 1.49x 13.9x
The Simply Good Foods Company SMPL 11.94 91.4% 854 1,114 345 72 NA NA NA 20.8% NA 3.23x 15.5x 2.76x 15.3x
SunOpta Inc. SOY-CA 7.38 72.4% 650 1,138 1,285 56 0.5% 0.4% 10.9% 4.4% NA 0.89x 20.3x 0.88x 16.1x
Mean 20.8% 32.1% 21.6% 13.9% 40.6x 2.06x 16.4x 1.93x 14.2x
Median 0.5% 7.7% 17.9% 14.6% 40.6x 2.06x 16.7x 2.03x 14.6x
Baked Goods
Aryzta AG ARYN-CH $29.57 64.6% $2,724 $5,612 $4,152 $460 (3.6%) (3.5%) 27.1% 11.1% NA 1.35x 12.2x 1.29x 11.6x
Flowers Foods, Inc. FLO 18.92 90.1% 3,920 4,778 3,916 394 (18.5%) 1.6% 45.5% 10.0% 46.8x 1.22x 12.1x 1.22x 10.7x
George Weston Limited WN-CA 88.15 94.3% 11,290 24,859 36,458 3,221 1.6% 2.2% 29.6% 8.8% 23.7x 0.68x 7.7x 0.65x 7.5x
Grupo Bimbo SAB de CV BIMBOA-MX 2.27 84.3% 10,802 14,818 13,795 1,582 2.0% (0.6%) 53.0% 11.5% 48.0x 1.07x 9.4x 1.05x 9.6x
Lancaster Colony Corp. LANC 122.16 81.8% 3,388 3,231 1,209 212 1.8% 6.0% 24.9% 17.5% 30.4x 2.67x 15.2x 2.65x 14.8x
Mean (3.3%) 1.2% 36.0% 11.8% 37.2x 1.40x 11.3x 1.37x 10.8x
Median 1.6% 1.6% 29.6% 11.1% 38.6x 1.22x 12.1x 1.22x 10.7x
EV / LTM EV / 2017ERevenue Growth LTM MarginsLTM
PAGE |
PUBLIC COMPARABLES5
FOOD AND BEVERAGE
INDUSTRY UPDATE │ NOVEMBER 2017
6
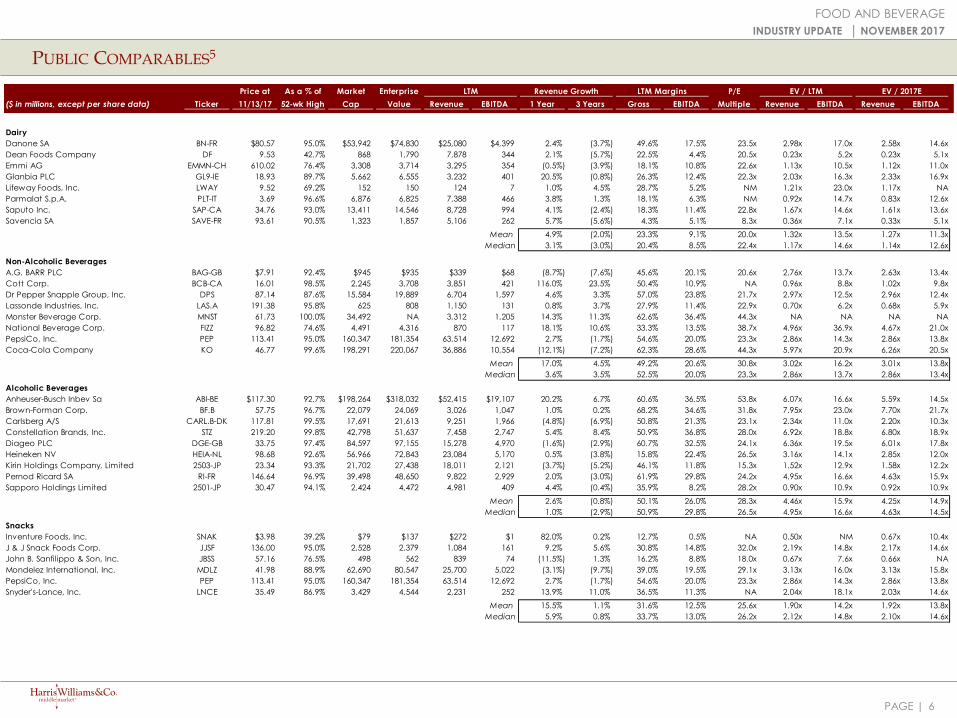
Price at As a % of Market Enterprise P/E
($ in millions, except per share data) Ticker 11/13/17 52-wk High Cap Value Revenue EBITDA 1 Year 3 Years Gross EBITDA Multiple Revenue EBITDA Revenue EBITDA
Dairy
Danone SA BN-FR $80.57 95.0% $53,942 $74,830 $25,080 $4,399 2.4% (3.7%) 49.6% 17.5% 23.5x 2.98x 17.0x 2.58x 14.6x
Dean Foods Company DF 9.53 42.7% 868 1,790 7,878 344 2.1% (5.7%) 22.5% 4.4% 20.5x 0.23x 5.2x 0.23x 5.1x
Emmi AG EMMN-CH 610.02 76.4% 3,308 3,714 3,295 354 (0.5%) (3.9%) 18.1% 10.8% 22.6x 1.13x 10.5x 1.12x 11.0x
Glanbia PLC GL9-IE 18.93 89.7% 5,662 6,555 3,232 401 20.5% (0.8%) 26.3% 12.4% 22.3x 2.03x 16.3x 2.33x 16.9x
Lifeway Foods, Inc. LWAY 9.52 69.2% 152 150 124 7 1.0% 4.5% 28.7% 5.2% NM 1.21x 23.0x 1.17x NA
Parmalat S.p.A. PLT-IT 3.69 96.6% 6,876 6,825 7,388 466 3.8% 1.3% 18.1% 6.3% NM 0.92x 14.7x 0.83x 12.6x
Saputo Inc. SAP-CA 34.76 93.0% 13,411 14,546 8,728 994 4.1% (2.4%) 18.3% 11.4% 22.8x 1.67x 14.6x 1.61x 13.6x
Savencia SA SAVE-FR 93.61 90.5% 1,323 1,857 5,106 262 5.7% (5.6%) 4.3% 5.1% 8.3x 0.36x 7.1x 0.33x 5.1x
Mean 4.9% (2.0%) 23.3% 9.1% 20.0x 1.32x 13.5x 1.27x 11.3x
Median 3.1% (3.0%) 20.4% 8.5% 22.4x 1.17x 14.6x 1.14x 12.6x
Non-Alcoholic Beverages
A.G. BARR PLC BAG-GB $7.91 92.4% $945 $935 $339 $68 (8.7%) (7.6%) 45.6% 20.1% 20.6x 2.76x 13.7x 2.63x 13.4x
Cott Corp. BCB-CA 16.01 98.5% 2,245 3,708 3,851 421 116.0% 23.5% 50.4% 10.9% NA 0.96x 8.8x 1.02x 9.8x
Dr Pepper Snapple Group, Inc. DPS 87.14 87.6% 15,584 19,889 6,704 1,597 4.6% 3.3% 57.0% 23.8% 21.7x 2.97x 12.5x 2.96x 12.4x
Lassonde Industries, Inc. LAS.A 191.38 95.8% 625 808 1,150 131 0.8% 3.7% 27.9% 11.4% 22.9x 0.70x 6.2x 0.68x 5.9x
Monster Beverage Corp. MNST 61.73 100.0% 34,492 NA 3,312 1,205 14.3% 11.3% 62.6% 36.4% 44.3x NA NA NA NA
National Beverage Corp. FIZZ 96.82 74.6% 4,491 4,316 870 117 18.1% 10.6% 33.3% 13.5% 38.7x 4.96x 36.9x 4.67x 21.0x
PepsiCo, Inc. PEP 113.41 95.0% 160,347 181,354 63,514 12,692 2.7% (1.7%) 54.6% 20.0% 23.3x 2.86x 14.3x 2.86x 13.8x
Coca-Cola Company KO 46.77 99.6% 198,291 220,067 36,886 10,554 (12.1%) (7.2%) 62.3% 28.6% 44.3x 5.97x 20.9x 6.26x 20.5x
Mean 17.0% 4.5% 49.2% 20.6% 30.8x 3.02x 16.2x 3.01x 13.8x
Median 3.6% 3.5% 52.5% 20.0% 23.3x 2.86x 13.7x 2.86x 13.4x
Alcoholic Beverages
Anheuser-Busch Inbev Sa ABI-BE $117.30 92.7% $198,264 $318,032 $52,415 $19,107 20.2% 6.7% 60.6% 36.5% 53.8x 6.07x 16.6x 5.59x 14.5x
Brown-Forman Corp. BF.B 57.75 96.7% 22,079 24,069 3,026 1,047 1.0% 0.2% 68.2% 34.6% 31.8x 7.95x 23.0x 7.70x 21.7x
Carlsberg A/S CARL.B-DK 117.81 99.5% 17,691 21,613 9,251 1,966 (4.8%) (6.9%) 50.8% 21.3% 23.1x 2.34x 11.0x 2.20x 10.3x
Constellation Brands, Inc. STZ 219.20 99.8% 42,798 51,637 7,458 2,747 5.4% 8.4% 50.9% 36.8% 28.0x 6.92x 18.8x 6.80x 18.9x
Diageo PLC DGE-GB 33.75 97.4% 84,597 97,155 15,278 4,970 (1.6%) (2.9%) 60.7% 32.5% 24.1x 6.36x 19.5x 6.01x 17.8x
Heineken NV HEIA-NL 98.68 92.6% 56,966 72,843 23,084 5,170 0.5% (3.8%) 15.8% 22.4% 26.5x 3.16x 14.1x 2.85x 12.0x
Kirin Holdings Company, Limited 2503-JP 23.34 93.3% 21,702 27,438 18,011 2,121 (3.7%) (5.2%) 46.1% 11.8% 15.3x 1.52x 12.9x 1.58x 12.2x
Pernod Ricard SA RI-FR 146.64 96.9% 39,498 48,650 9,822 2,929 2.0% (3.0%) 61.9% 29.8% 24.2x 4.95x 16.6x 4.63x 15.9x
Sapporo Holdings Limited 2501-JP 30.47 94.1% 2,424 4,472 4,981 409 4.4% (0.4%) 35.9% 8.2% 28.2x 0.90x 10.9x 0.92x 10.9x
Mean 2.6% (0.8%) 50.1% 26.0% 28.3x 4.46x 15.9x 4.25x 14.9x
Median 1.0% (2.9%) 50.9% 29.8% 26.5x 4.95x 16.6x 4.63x 14.5x
Snacks
Inventure Foods, Inc. SNAK $3.98 39.2% $79 $137 $272 $1 82.0% 0.2% 12.7% 0.5% NA 0.50x NM 0.67x 10.4x
J & J Snack Foods Corp. JJSF 136.00 95.0% 2,528 2,379 1,084 161 9.2% 5.6% 30.8% 14.8% 32.0x 2.19x 14.8x 2.17x 14.6x
John B. Sanfilippo & Son, Inc. JBSS 57.16 76.5% 498 562 839 74 (11.5%) 1.3% 16.2% 8.8% 18.0x 0.67x 7.6x 0.66x NA
Mondelez International, Inc. MDLZ 41.98 88.9% 62,690 80,547 25,700 5,022 (3.1%) (9.7%) 39.0% 19.5% 29.1x 3.13x 16.0x 3.13x 15.8x
PepsiCo, Inc. PEP 113.41 95.0% 160,347 181,354 63,514 12,692 2.7% (1.7%) 54.6% 20.0% 23.3x 2.86x 14.3x 2.86x 13.8x
Snyder's-Lance, Inc. LNCE 35.49 86.9% 3,429 4,544 2,231 252 13.9% 11.0% 36.5% 11.3% NA 2.04x 18.1x 2.03x 14.6x
Mean 15.5% 1.1% 31.6% 12.5% 25.6x 1.90x 14.2x 1.92x 13.8x
Median 5.9% 0.8% 33.7% 13.0% 26.2x 2.12x 14.8x 2.10x 14.6x
EV / 2017ELTM EV / LTMRevenue Growth LTM Margins
PAGE |
PUBLIC COMPARABLES5
FOOD AND BEVERAGE
INDUSTRY UPDATE │ NOVEMBER 2017
7
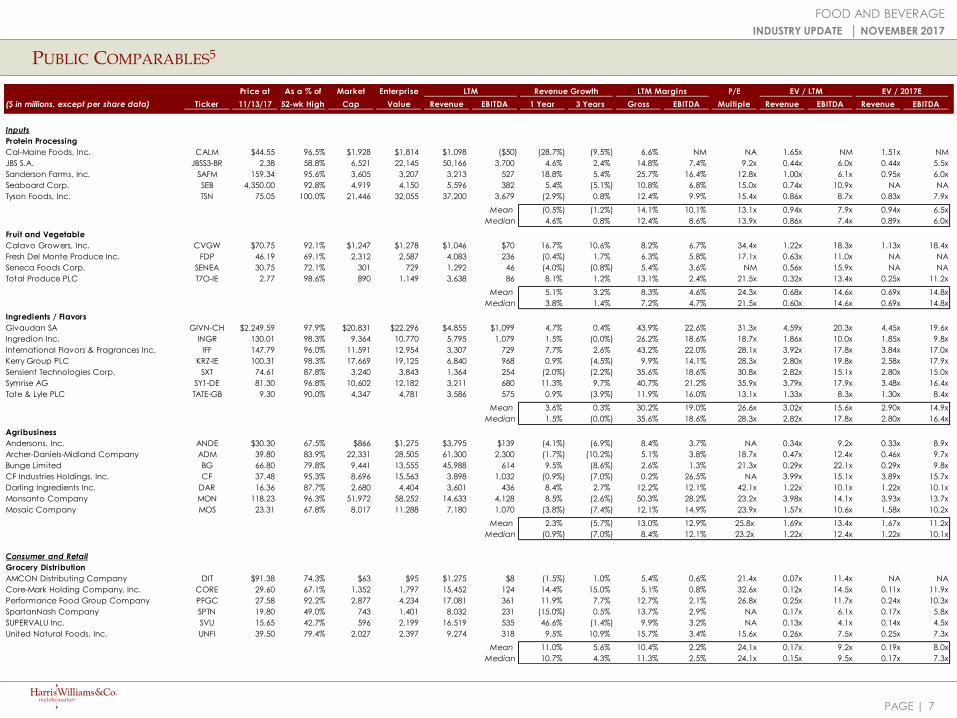
Price at As a % of Market Enterprise P/E
($ in millions, except per share data) Ticker 11/13/17 52-wk High Cap Value Revenue EBITDA 1 Year 3 Years Gross EBITDA Multiple Revenue EBITDA Revenue EBITDA
Inputs
Protein Processing
Cal-Maine Foods, Inc. CALM $44.55 96.5% $1,928 $1,814 $1,098 ($50) (28.7%) (9.5%) 6.6% NM NA 1.65x NM 1.51x NM
JBS S.A. JBSS3-BR 2.38 58.8% 6,521 22,145 50,166 3,700 4.6% 2.4% 14.8% 7.4% 9.2x 0.44x 6.0x 0.44x 5.5x
Sanderson Farms, Inc. SAFM 159.34 95.6% 3,605 3,207 3,213 527 18.8% 5.4% 25.7% 16.4% 12.8x 1.00x 6.1x 0.95x 6.0x
Seaboard Corp. SEB 4,350.00 92.8% 4,919 4,150 5,596 382 5.4% (5.1%) 10.8% 6.8% 15.0x 0.74x 10.9x NA NA
Tyson Foods, Inc. TSN 75.05 100.0% 21,446 32,055 37,200 3,679 (2.9%) 0.8% 12.4% 9.9% 15.4x 0.86x 8.7x 0.83x 7.9x
Mean (0.5%) (1.2%) 14.1% 10.1% 13.1x 0.94x 7.9x 0.94x 6.5x
Median 4.6% 0.8% 12.4% 8.6% 13.9x 0.86x 7.4x 0.89x 6.0x
Fruit and Vegetable
Calavo Growers, Inc. CVGW $70.75 92.1% $1,247 $1,278 $1,046 $70 16.7% 10.6% 8.2% 6.7% 34.4x 1.22x 18.3x 1.13x 18.4x
Fresh Del Monte Produce Inc. FDP 46.19 69.1% 2,312 2,587 4,083 236 (0.4%) 1.7% 6.3% 5.8% 17.1x 0.63x 11.0x NA NA
Seneca Foods Corp. SENEA 30.75 72.1% 301 729 1,292 46 (4.0%) (0.8%) 5.4% 3.6% NM 0.56x 15.9x NA NA
Total Produce PLC T7O-IE 2.77 98.6% 890 1,149 3,638 86 8.1% 1.2% 13.1% 2.4% 21.5x 0.32x 13.4x 0.25x 11.2x
Mean 5.1% 3.2% 8.3% 4.6% 24.3x 0.68x 14.6x 0.69x 14.8x
Median 3.8% 1.4% 7.2% 4.7% 21.5x 0.60x 14.6x 0.69x 14.8x
Ingredients / Flavors
Givaudan SA GIVN-CH $2,249.59 97.9% $20,831 $22,296 $4,855 $1,099 4.7% 0.4% 43.9% 22.6% 31.3x 4.59x 20.3x 4.45x 19.6x
Ingredion Inc. INGR 130.01 98.3% 9,364 10,770 5,795 1,079 1.5% (0.0%) 26.2% 18.6% 18.7x 1.86x 10.0x 1.85x 9.8x
International Flavors & Fragrances Inc. IFF 147.79 96.0% 11,591 12,954 3,307 729 7.7% 2.6% 43.2% 22.0% 28.1x 3.92x 17.8x 3.84x 17.0x
Kerry Group PLC KRZ-IE 100.31 98.3% 17,669 19,125 6,840 968 0.9% (4.5%) 9.9% 14.1% 28.3x 2.80x 19.8x 2.58x 17.9x
Sensient Technologies Corp. SXT 74.61 87.8% 3,240 3,843 1,364 254 (2.0%) (2.2%) 35.6% 18.6% 30.8x 2.82x 15.1x 2.80x 15.0x
Symrise AG SY1-DE 81.30 96.8% 10,602 12,182 3,211 680 11.3% 9.7% 40.7% 21.2% 35.9x 3.79x 17.9x 3.48x 16.4x
Tate & Lyle PLC TATE-GB 9.30 90.0% 4,347 4,781 3,586 575 0.9% (3.9%) 11.9% 16.0% 13.1x 1.33x 8.3x 1.30x 8.4x
Mean 3.6% 0.3% 30.2% 19.0% 26.6x 3.02x 15.6x 2.90x 14.9x
Median 1.5% (0.0%) 35.6% 18.6% 28.3x 2.82x 17.8x 2.80x 16.4x
Agribusiness
Andersons, Inc. ANDE $30.30 67.5% $866 $1,275 $3,795 $139 (4.1%) (6.9%) 8.4% 3.7% NA 0.34x 9.2x 0.33x 8.9x
Archer-Daniels-Midland Company ADM 39.80 83.9% 22,331 28,505 61,300 2,300 (1.7%) (10.2%) 5.1% 3.8% 18.7x 0.47x 12.4x 0.46x 9.7x
Bunge Limited BG 66.80 79.8% 9,441 13,555 45,988 614 9.5% (8.6%) 2.6% 1.3% 21.3x 0.29x 22.1x 0.29x 9.8x
CF Industries Holdings, Inc. CF 37.48 95.3% 8,696 15,563 3,898 1,032 (0.9%) (7.0%) 0.2% 26.5% NA 3.99x 15.1x 3.89x 15.7x
Darling Ingredients Inc. DAR 16.36 87.7% 2,680 4,404 3,601 436 8.4% 2.7% 12.2% 12.1% 42.1x 1.22x 10.1x 1.22x 10.1x
Monsanto Company MON 118.23 96.3% 51,972 58,252 14,633 4,128 8.5% (2.6%) 50.3% 28.2% 23.2x 3.98x 14.1x 3.93x 13.7x
Mosaic Company MOS 23.31 67.8% 8,017 11,288 7,180 1,070 (3.8%) (7.4%) 12.1% 14.9% 23.9x 1.57x 10.6x 1.58x 10.2x
Mean 2.3% (5.7%) 13.0% 12.9% 25.8x 1.69x 13.4x 1.67x 11.2x
Median (0.9%) (7.0%) 8.4% 12.1% 23.2x 1.22x 12.4x 1.22x 10.1x
Consumer and Retail
Grocery Distribution
AMCON Distributing Company DIT $91.38 74.3% $63 $95 $1,275 $8 (1.5%) 1.0% 5.4% 0.6% 21.4x 0.07x 11.4x NA NA
Core-Mark Holding Company, Inc. CORE 29.60 67.1% 1,352 1,797 15,452 124 14.4% 15.0% 5.1% 0.8% 32.6x 0.12x 14.5x 0.11x 11.9x
Performance Food Group Company PFGC 27.58 92.2% 2,877 4,234 17,081 361 11.9% 7.7% 12.7% 2.1% 26.8x 0.25x 11.7x 0.24x 10.3x
SpartanNash Company SPTN 19.80 49.0% 743 1,401 8,032 231 (15.0%) 0.5% 13.7% 2.9% NA 0.17x 6.1x 0.17x 5.8x
SUPERVALU Inc. SVU 15.65 42.7% 596 2,199 16,519 535 46.6% (1.4%) 9.9% 3.2% NA 0.13x 4.1x 0.14x 4.5x
United Natural Foods, Inc. UNFI 39.50 79.4% 2,027 2,397 9,274 318 9.5% 10.9% 15.7% 3.4% 15.6x 0.26x 7.5x 0.25x 7.3x
Mean 11.0% 5.6% 10.4% 2.2% 24.1x 0.17x 9.2x 0.19x 8.0x
Median 10.7% 4.3% 11.3% 2.5% 24.1x 0.15x 9.5x 0.17x 7.3x
EV / 2017ELTM Revenue Growth EV / LTMLTM Margins
PAGE |
PUBLIC COMPARABLES5
FOOD AND BEVERAGE
INDUSTRY UPDATE │ NOVEMBER 2017
8
Price at As a % of Market Enterprise P/E
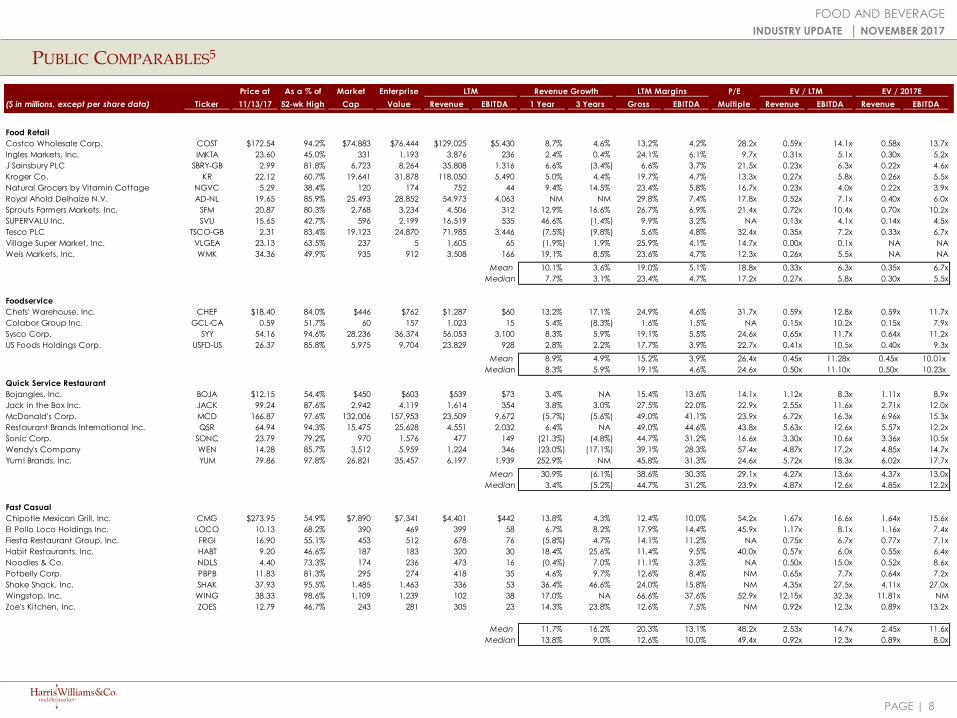
($ in millions, except per share data) Ticker 11/13/17 52-wk High Cap Value Revenue EBITDA 1 Year 3 Years Gross EBITDA Multiple Revenue EBITDA Revenue EBITDA
Food Retail
Costco Wholesale Corp. COST $172.54 94.2% $74,883 $76,444 $129,025 $5,430 8.7% 4.6% 13.2% 4.2% 28.2x 0.59x 14.1x 0.58x 13.7x
Ingles Markets, Inc. IMKTA 23.60 45.0% 331 1,193 3,876 236 2.4% 0.4% 24.1% 6.1% 9.7x 0.31x 5.1x 0.30x 5.2x
J Sainsbury PLC SBRY-GB 2.99 81.8% 6,723 8,264 35,808 1,316 6.6% (3.4%) 6.6% 3.7% 21.5x 0.23x 6.3x 0.22x 4.6x
Kroger Co. KR 22.12 60.7% 19,641 31,878 118,050 5,490 5.0% 4.4% 19.7% 4.7% 13.3x 0.27x 5.8x 0.26x 5.5x
Natural Grocers by Vitamin Cottage NGVC 5.29 38.4% 120 174 752 44 9.4% 14.5% 23.4% 5.8% 16.7x 0.23x 4.0x 0.22x 3.9x
Royal Ahold Delhaize N.V. AD-NL 19.65 85.9% 25,493 28,852 54,973 4,063 NM NM 29.8% 7.4% 17.8x 0.52x 7.1x 0.40x 6.0x
Sprouts Farmers Markets, Inc. SFM 20.87 80.3% 2,768 3,234 4,506 312 12.9% 16.6% 26.7% 6.9% 21.4x 0.72x 10.4x 0.70x 10.2x
SUPERVALU Inc. SVU 15.65 42.7% 596 2,199 16,519 535 46.6% (1.4%) 9.9% 3.2% NA 0.13x 4.1x 0.14x 4.5x
Tesco PLC TSCO-GB 2.31 83.4% 19,123 24,870 71,985 3,446 (7.5%) (9.8%) 5.6% 4.8% 32.4x 0.35x 7.2x 0.33x 6.7x
Village Super Market, Inc. VLGEA 23.13 63.5% 237 5 1,605 65 (1.9%) 1.9% 25.9% 4.1% 14.7x 0.00x 0.1x NA NA
Weis Markets, Inc. WMK 34.36 49.9% 935 912 3,508 166 19.1% 8.5% 23.6% 4.7% 12.3x 0.26x 5.5x NA NA
Mean 10.1% 3.6% 19.0% 5.1% 18.8x 0.33x 6.3x 0.35x 6.7x
Median 7.7% 3.1% 23.4% 4.7% 17.2x 0.27x 5.8x 0.30x 5.5x
Foodservice
Chefs' Warehouse, Inc. CHEF $18.40 84.0% $446 $762 $1,287 $60 13.2% 17.1% 24.9% 4.6% 31.7x 0.59x 12.8x 0.59x 11.7x
Colabor Group Inc. GCL-CA 0.59 51.7% 60 157 1,023 15 5.4% (8.3%) 1.6% 1.5% NA 0.15x 10.2x 0.15x 7.9x
Sysco Corp. SYY 54.16 94.6% 28,236 36,374 56,053 3,100 8.3% 5.9% 19.1% 5.5% 24.6x 0.65x 11.7x 0.64x 11.2x
US Foods Holdings Corp. USFD-US 26.37 85.8% 5,975 9,704 23,829 928 2.8% 2.2% 17.7% 3.9% 22.7x 0.41x 10.5x 0.40x 9.3x
Mean 8.9% 4.9% 15.2% 3.9% 26.4x 0.45x 11.28x 0.45x 10.01x
Median 8.3% 5.9% 19.1% 4.6% 24.6x 0.50x 11.10x 0.50x 10.23x
Quick Service Restaurant
Bojangles, Inc. BOJA $12.15 54.4% $450 $603 $539 $73 3.4% NA 15.4% 13.6% 14.1x 1.12x 8.3x 1.11x 8.9x
Jack in the Box Inc. JACK 99.24 87.6% 2,942 4,119 1,614 354 3.8% 3.0% 27.5% 22.0% 22.9x 2.55x 11.6x 2.71x 12.0x
McDonald's Corp. MCD 166.87 97.6% 132,006 157,953 23,509 9,672 (5.7%) (5.6%) 49.0% 41.1% 23.9x 6.72x 16.3x 6.96x 15.3x
Restaurant Brands International Inc. QSR 64.94 94.3% 15,475 25,628 4,551 2,032 6.4% NA 49.0% 44.6% 43.8x 5.63x 12.6x 5.57x 12.2x
Sonic Corp. SONC 23.79 79.2% 970 1,576 477 149 (21.3%) (4.8%) 44.7% 31.2% 16.6x 3.30x 10.6x 3.36x 10.5x
Wendy's Company WEN 14.28 85.7% 3,512 5,959 1,224 346 (23.0%) (17.1%) 39.1% 28.3% 57.4x 4.87x 17.2x 4.85x 14.7x
Yum! Brands, Inc. YUM 79.86 97.8% 26,821 35,457 6,197 1,939 252.9% NM 45.8% 31.3% 24.6x 5.72x 18.3x 6.02x 17.7x
Mean 30.9% (6.1%) 38.6% 30.3% 29.1x 4.27x 13.6x 4.37x 13.0x
Median 3.4% (5.2%) 44.7% 31.2% 23.9x 4.87x 12.6x 4.85x 12.2x
Fast Casual
Chipotle Mexican Grill, Inc. CMG $273.95 54.9% $7,890 $7,341 $4,401 $442 13.8% 4.3% 12.4% 10.0% 54.2x 1.67x 16.6x 1.64x 15.6x
El Pollo Loco Holdings Inc. LOCO 10.13 68.2% 390 469 399 58 6.7% 8.2% 17.9% 14.4% 45.9x 1.17x 8.1x 1.16x 7.4x
Fiesta Restaurant Group, Inc. FRGI 16.90 55.1% 453 512 678 76 (5.8%) 4.7% 14.1% 11.2% NA 0.75x 6.7x 0.77x 7.1x
Habit Restaurants, Inc. HABT 9.20 46.6% 187 183 320 30 18.4% 25.6% 11.4% 9.5% 40.0x 0.57x 6.0x 0.55x 6.4x
Noodles & Co. NDLS 4.40 73.3% 174 236 473 16 (0.4%) 7.0% 11.1% 3.3% NA 0.50x 15.0x 0.52x 8.6x
Potbelly Corp. PBPB 11.83 81.3% 295 274 418 35 4.6% 9.7% 12.6% 8.4% NM 0.65x 7.7x 0.64x 7.2x
Shake Shack, Inc. SHAK 37.93 95.5% 1,485 1,463 336 53 36.4% 46.6% 24.0% 15.8% NM 4.35x 27.5x 4.11x 27.0x
Wingstop, Inc. WING 38.33 98.6% 1,109 1,239 102 38 17.0% NA 66.6% 37.6% 52.9x 12.15x 32.3x 11.81x NM
Zoe's Kitchen, Inc. ZOES 12.79 46.7% 243 281 305 23 14.3% 23.8% 12.6% 7.5% NM 0.92x 12.3x 0.89x 13.2x
Mean 11.7% 16.2% 20.3% 13.1% 48.2x 2.53x 14.7x 2.45x 11.6x
Median 13.8% 9.0% 12.6% 10.0% 49.4x 0.92x 12.3x 0.89x 8.0x
LTM Revenue Growth LTM Margins EV / LTM EV / 2017E
PAGE |
PUBLIC COMPARABLES5
FOOD AND BEVERAGE
INDUSTRY UPDATE │ NOVEMBER 2017
9
Price at As a % of Market Enterprise P/E
($ in millions, except per share data) Ticker 11/13/17 52-wk High Cap Value Revenue EBITDA 1 Year 3 Years Gross EBITDA Multiple Revenue EBITDA Revenue EBITDA
Differentiated Casual
BJ's Restaurants, Inc. BJRI $31.43 66.1% $644 $809 $1,036 $117 7.9% 7.6% 7.1% 11.3% 20.5x 0.78x 6.9x 0.79x 7.5x
Buffalo Wild Wings, Inc. BWLD 118.00 67.4% 1,844 2,214 2,026 259 2.2% 11.8% 13.0% 12.8% 31.0x 1.09x 8.6x 1.07x 8.0x
Chuy's Holdings, Inc. CHUY 22.80 64.6% 385 367 353 39 9.3% 14.6% 11.9% 11.0% 25.0x 1.04x 9.4x 0.99x 8.8x
Dave & Buster's Entertainment, Inc. PLAY 49.23 67.0% 2,007 2,288 1,084 264 16.1% 16.2% 21.5% 24.4% 19.0x 2.11x 8.7x 1.98x 8.4x
Cheesecake Factory Inc. CAKE 44.16 65.8% 2,029 2,153 2,292 268 17.3% 36.0% 13.2% 11.7% 16.4x 0.94x 8.0x 0.95x 8.4x
Mean 10.6% 17.3% 13.3% 14.2% 22.4x 1.19x 8.3x 1.16x 8.2x
Median 9.3% 14.6% 13.0% 11.7% 20.5x 1.04x 8.6x 0.99x 8.4x
Casual Dining Restaurant
Bloomin' Brands, Inc. BLMN $16.94 76.4% $1,550 $2,718 $4,130 $392 (3.9%) (2.0%) 9.3% 9.5% 22.1x 0.66x 6.9x 0.65x 6.7x
Brinker International, Inc. EAT 33.51 60.0% 1,562 2,916 3,132 429 (3.7%) 2.2% 10.0% 13.7% 12.2x 0.93x 6.8x 0.93x 6.9x
Darden Restaurants, Inc. DRI 82.54 86.7% 10,220 11,010 7,392 959 6.2% 8.9% 17.5% 13.0% 21.4x 1.49x 11.5x 1.43x 10.4x
DineEquity, Inc. DIN 45.35 51.5% 839 2,106 610 223 (6.3%) (2.0%) 53.6% 36.5% NA 3.45x 9.5x 3.48x 9.8x
Red Robin Gourmet Burgers, Inc. RRGB 47.25 63.8% 607 879 1,330 131 3.0% 6.3% 11.3% 9.8% 49.4x 0.66x 6.7x 0.64x 6.4x
Ruby Tuesday, Inc. RT 2.38 64.7% 144 309 913 37 (14.6%) (7.7%) 12.4% 4.0% NA 0.34x 8.4x NA NA
Texas Roadhouse, Inc. TXRH 49.44 92.2% 3,487 3,437 2,159 287 10.1% 11.6% 14.1% 13.3% 28.3x 1.59x 12.0x 1.55x 11.6x
Mean (1.3%) 2.5% 18.3% 14.3% 26.7x 1.30x 8.8x 1.45x 8.6x
Median (3.7%) 2.2% 12.4% 13.0% 22.1x 0.93x 8.4x 1.18x 8.3x
Fine Dining
Del Frisco's Restaurant Group, Inc. DFRG $13.35 71.0% $279 $319 $359 $39 3.5% 6.9% 9.7% 11.0% 29.2x 0.89x 8.1x 0.88x 7.1x
Fogo de Chao, Inc. FOGO 10.75 63.0% 304 414 307 56 7.9% 11.9% 18.1% 18.2% 14.9x 1.35x 7.4x 1.33x 7.6x
Ruth's Hospitality Group, Inc. RUTH 19.78 87.3% 622 648 398 60 4.0% (1.1%) 15.7% 15.2% 20.9x 1.63x 10.7x 1.58x 10.0x
Mean 5.1% 5.9% 14.5% 14.8% 21.7x 1.29x 8.7x 1.26x 8.2x
Median 4.0% 6.9% 15.7% 15.2% 20.9x 1.35x 8.1x 1.33x 7.6x
Pizza
Domino's Pizza, Inc. DPZ $174.57 78.8% $7,580 $10,487 $2,716 $539 13.4% 12.3% 30.8% 19.9% 33.1x 3.86x 19.4x 3.73x 18.5x
Papa John's International, Inc. PZZA 59.87 66.2% 2,086 2,465 1,755 198 3.8% 4.0% 16.4% 11.3% 20.5x 1.40x 12.4x 1.38x 12.3x
Papa Murphy's Holdings, Inc. FRSH 5.78 85.0% 97 196 123 14 (1.4%) NA 29.2% 11.4% NA 1.59x 13.9x 1.66x 10.2x
Mean 5.3% 8.2% 25.5% 14.2% 26.8x 2.29x 15.3x 2.26x 13.7x
Median 3.8% 8.2% 29.2% 11.4% 26.8x 1.59x 13.9x 1.66x 12.3x
Beverage / Snack Retail
DAVIDsTEA, Inc. DTEA $4.15 37.9% $120 $74 $169 $5 12.6% 17.6% 38.6% 3.1% NA 0.44x 14.3x 0.41x 6.4x
Dunkin' Brands Group, Inc. DNKN 56.65 93.4% 5,107 7,185 849 464 3.9% 4.8% 79.9% 54.7% 24.7x 8.46x 15.5x 8.42x 14.8x
Jamba, Inc. JMBA 7.98 73.9% 122 108 82 (7) (56.0%) (28.9%) 39.7% NM NA 1.32x NM NA NA
Starbucks Corp. SBUX 57.03 87.9% 81,658 82,907 22,387 4,975 5.0% 10.8% 23.3% 22.2% 29.0x 3.70x 16.7x 3.62x 15.0x
Mean (6.0%) 1.9% 39.9% 23.5% 26.8x 3.48x 15.5x 4.15x 12.1x
Median 4.3% 5.3% 38.6% 18.2% 26.8x 2.51x 15.5x 3.62x 14.8x
Family Restaurant
Cracker Barrel Old Country Store, Inc. CBRL $155.47 88.8% $3,726 $3,965 $2,926 $399 0.5% 2.9% 16.1% 13.7% 18.5x 1.35x 9.9x 1.33x 9.7x
Denny's Corp. DENN 12.27 86.1% 803 1,093 523 117 4.4% 4.6% 26.9% 22.4% 24.1x 2.09x 9.3x 2.06x 10.8x
Luby's, Inc. LUB 2.59 57.6% 76 106 376 12 (6.6%) (1.6%) 7.3% 3.1% NA 0.28x 9.0x NA NA
Mean (0.6%) 2.0% 16.8% 13.0% 21.3x 1.24x 9.4x 1.70x 10.3x
Median 0.5% 2.9% 16.1% 13.7% 21.3x 1.35x 9.3x 1.70x 10.3x
LTM Revenue Growth LTM Margins EV / LTM EV / 2017E
PAGE |
PUBLIC EQUITY MARKET OVERVIEW
10
INDUSTRY UPDATE │ NOVEMBER 2017
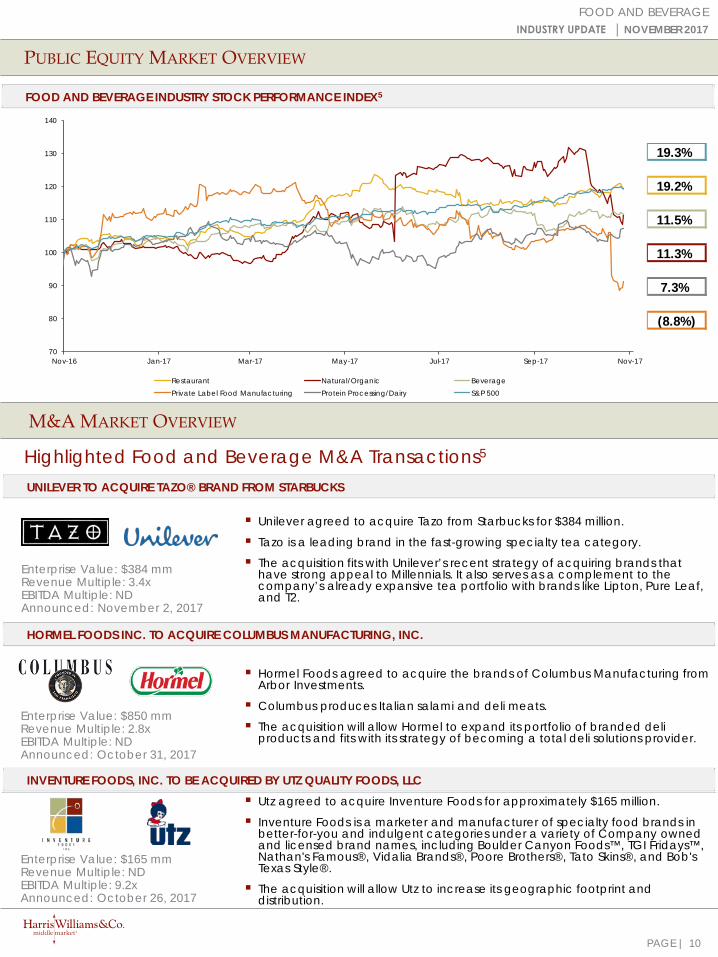
FOOD AND BEVERAGE INDUSTRY STOCK PERFORMANCE INDEX5
Highlighted Food and Beverage M&A Transactions5
M&A MARKET OVERVIEW
INVENTURE FOODS, INC. TO BE ACQUIRED BY UTZ QUALITY FOODS, LLC
Enterprise Value: $165 mmRevenue Multiple: NDEBITDA Multiple: 9.2xAnnounced: October 26, 2017
HORMEL FOODS INC. TO ACQUIRE COLUMBUS MANUFACTURING, INC.
UNILEVER TO ACQUIRE TAZO® BRAND FROM STARBUCKS
Unilever agreed to acquire Tazo from Starbucks for $384 million.
Tazo is a leading brand in the fast-growing specialty tea category.
The acquisition fits with Unilever’s recent strategy of acquiring brands that have strong appeal to Millennials. It also serves as a complement to the company’s already expansive tea portfolio with brands like Lipton, Pure Leaf, and T2.
Enterprise Value: $850 mmRevenue Multiple: 2.8xEBITDA Multiple: NDAnnounced: October 31, 2017
Utz agreed to acquire Inventure Foods for approximately $165 million.
Inventure Foods is a marketer and manufacturer of specialty food brands in better-for-you and indulgent categories under a variety of Company owned and licensed brand names, including Boulder Canyon Foods™, TGI Fridays™, Nathan's Famous®, Vidalia Brands®, Poore Brothers®, Tato Skins®, and Bob's Texas Style®.
The acquisition will allow Utz to increase its geographic footprint and distribution.
Enterprise Value: $384 mmRevenue Multiple: 3.4xEBITDA Multiple: NDAnnounced: November 2, 2017
Hormel Foods agreed to acquire the brands of Columbus Manufacturing from Arbor Investments.
Columbus produces Italian salami and deli meats.
The acquisition will allow Hormel to expand its portfolio of branded deli products and fits with its strategy of becoming a total deli solutions provider.
70
80
90
100
110
120
130
140
Nov-16 Jan-17 Mar-17 May-17 Jul-17 Sep-17 Nov-17
Restaurant Natural/Organic BeveragePrivate Label Food Manufacturing Protein Processing/Dairy S&P 500
19.3%
19.2%
11.5%
11.3%
7.3%
(8.8%)
FOOD AND BEVERAGE
PAGE |
M&A MARKET OVERVIEW*
11
FOOD AND BEVERAGEINDUSTRY UPDATE │ NOVEMBER 2017
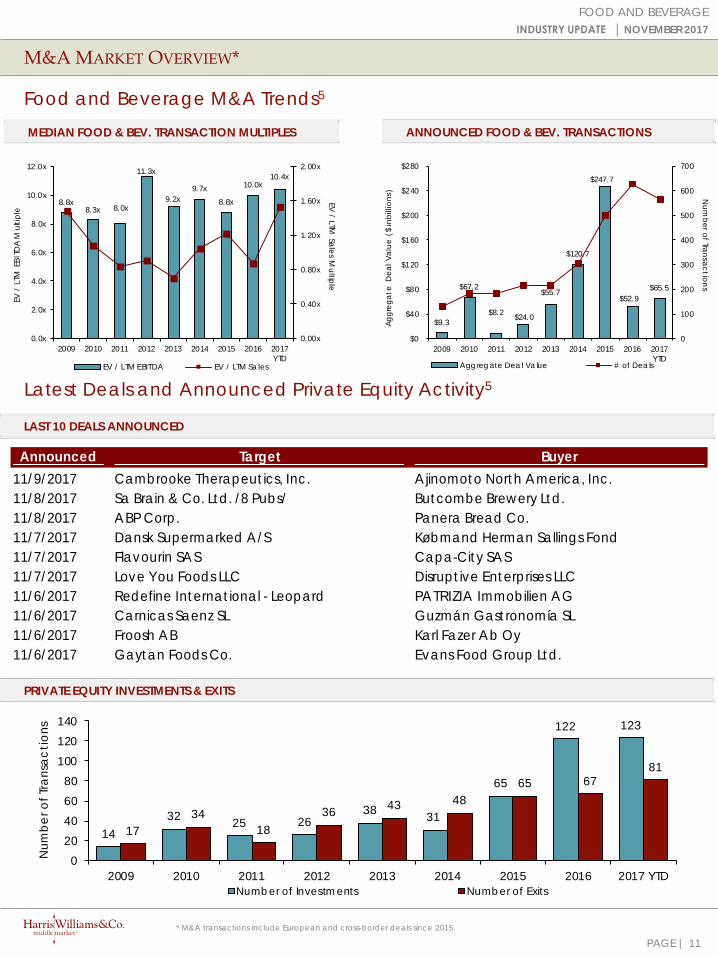
Food and Beverage M&A Trends5
MEDIAN FOOD & BEV. TRANSACTION MULTIPLES
PRIVATE EQUITY INVESTMENTS & EXITS
Latest Deals and Announced Private Equity Activity5
LAST 10 DEALS ANNOUNCED
ANNOUNCED FOOD & BEV. TRANSACTIONS
* M&A transactions include European and cross-border deals since 2015.
8.8x 8.3x 8.0x
11.3x
9.2x 9.7x
8.8x
10.0x 10.4x
0.00x
0.40x
0.80x
1.20x
1.60x
2.00x
0.0x
2.0x
4.0x
6.0x
8.0x
10.0x
12.0x
2009 2010 2011 2012 2013 2014 2015 2016 2017YTD
EV / LTM Sales M
ultiple
EV /
LTM
EBI
TDA
Mul
tiple
EV / LTM EBITDA EV / LTM Sales
$9.3
$67.2
$8.2 $24.0
$55.7
$120.7
$247.7
$52.9$65.5
0
100
200
300
400
500
600
700
$0
$40
$80
$120
$160
$200
$240
$280
2009 2010 2011 2012 2013 2014 2015 2016 2017YTD
Num
ber of Transactions
Aggr
egat
e D
eal V
alue
($
inbi
llion
s)
Aggregate Deal Value # of Deals
1432 25 26
38 31
65
122 123
1734
1836 43 48
65 6781
020406080
100120140
2009 2010 2011 2012 2013 2014 2015 2016 2017 YTD
Num
ber o
f Tra
nsac
tions
Number of Investments Number of Exits
Announced Target Buyerg p11/9/2017 Cambrooke Therapeutics, Inc. Ajinomoto North America, Inc.11/8/2017 Sa Brain & Co. Ltd. /8 Pubs/ Butcombe Brewery Ltd.11/8/2017 ABP Corp. Panera Bread Co.11/7/2017 Dansk Supermarked A/S Købmand Herman Sallings Fond11/7/2017 Flavourin SAS Capa-City SAS11/7/2017 Love You Foods LLC Disruptive Enterprises LLC11/6/2017 Redefine International - Leopard PATRIZIA Immobilien AG11/6/2017 Carnicas Saenz SL Guzmán Gastronomía SL11/6/2017 Froosh AB Karl Fazer Ab Oy11/6/2017 Gaytan Foods Co. Evans Food Group Ltd.
PAGE |
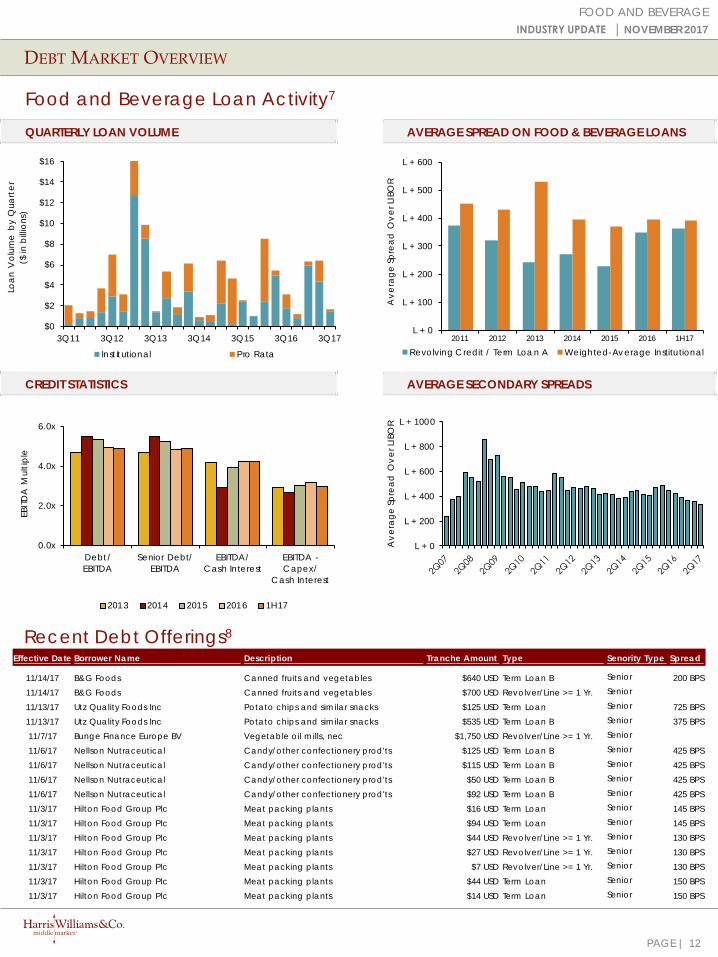
Effective Date Borrower Name Description Tranche Amount Type Senority Type Spread
11/14/17 B&G Foods Canned fruits and vegetables $640 USD Term Loan B Senior 200 BPS11/14/17 B&G Foods Canned fruits and vegetables $700 USD Revolver/Line >= 1 Yr. Senior
11/13/17 Utz Quality Foods Inc Potato chips and similar snacks $125 USD Term Loan Senior 725 BPS11/13/17 Utz Quality Foods Inc Potato chips and similar snacks $535 USD Term Loan B Senior 375 BPS11/7/17 Bunge Finance Europe BV Vegetable oil mills, nec $1,750 USD Revolver/Line >= 1 Yr. Senior
11/6/17 Nellson Nutraceutical Candy/other confectionery prod'ts $125 USD Term Loan B Senior 425 BPS11/6/17 Nellson Nutraceutical Candy/other confectionery prod'ts $115 USD Term Loan B Senior 425 BPS11/6/17 Nellson Nutraceutical Candy/other confectionery prod'ts $50 USD Term Loan B Senior 425 BPS11/6/17 Nellson Nutraceutical Candy/other confectionery prod'ts $92 USD Term Loan B Senior 425 BPS11/3/17 Hilton Food Group Plc Meat packing plants $16 USD Term Loan Senior 145 BPS11/3/17 Hilton Food Group Plc Meat packing plants $94 USD Term Loan Senior 145 BPS11/3/17 Hilton Food Group Plc Meat packing plants $44 USD Revolver/Line >= 1 Yr. Senior 130 BPS11/3/17 Hilton Food Group Plc Meat packing plants $27 USD Revolver/Line >= 1 Yr. Senior 130 BPS11/3/17 Hilton Food Group Plc Meat packing plants $7 USD Revolver/Line >= 1 Yr. Senior 130 BPS11/3/17 Hilton Food Group Plc Meat packing plants $44 USD Term Loan Senior 150 BPS11/3/17 Hilton Food Group Plc Meat packing plants $14 USD Term Loan Senior 150 BPS
L + 0
L + 200
L + 400
L + 600
L + 800
L + 1000
Ave
rage
Spre
ad O
ver L
IBO
R
$0
$2
$4
$6
$8
$10
$12
$14
$16
3Q11 3Q12 3Q13 3Q14 3Q15 3Q16 3Q17
Loan
Vol
ume
by Q
uart
er
($ in
billi
ons)
Inst itutional Pro Rata
AVERAGE SPREAD ON FOOD & BEVERAGE LOANS
DEBT MARKET OVERVIEW
12
FOOD AND BEVERAGEINDUSTRY UPDATE │ NOVEMBER 2017
Food and Beverage Loan Activity7
AVERAGE SECONDARY SPREADS
Recent Debt Offerings8
CREDIT STATISTICS
QUARTERLY LOAN VOLUME
0.0x
2.0x
4.0x
6.0x
Debt/EBITDA
Senior Debt/EBITDA
EBITDA/Cash Interest
EBITDA -Capex/
Cash Interest
EBITD
A M
ultip
le
2013 2014 2015 2016 1H17
L + 0
L + 100
L + 200
L + 300
L + 400
L + 500
L + 600
2011 2012 2013 2014 2015 2016 1H17
Ave
rage
Spre
ad O
ver L
IBO
R
Revolving Credit / Term Loan A Weighted-Average Institutional
PAGE |
Enterprise Enterprise Value Private Equity Geographic
Announced Target Seller Buyer ($mm) Sales EBITDA EBIT Involvement Location
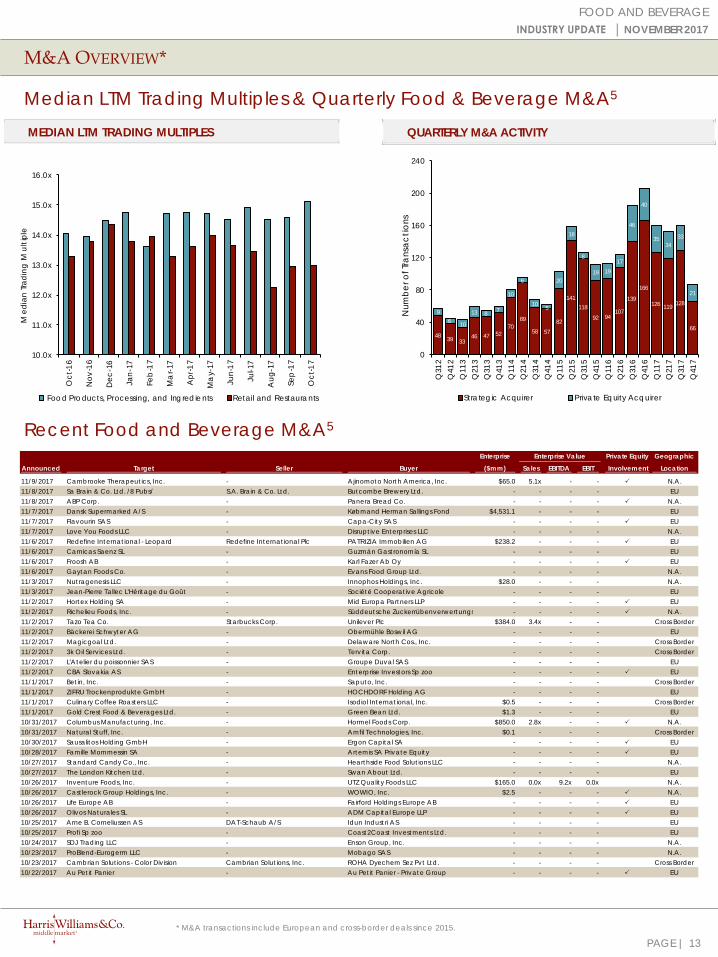
11/9/2017 Cambrooke Therapeutics, Inc. - Ajinomoto North America, Inc. $65.0 5.1x - - N.A.11/8/2017 Sa Brain & Co. Ltd. /8 Pubs/ S.A. Brain & Co. Ltd. Butcombe Brewery Ltd. - - - - EU11/8/2017 ABP Corp. - Panera Bread Co. - - - - N.A.11/7/2017 Dansk Supermarked A/S - Købmand Herman Sallings Fond $4,531.1 - - - EU11/7/2017 Flavourin SAS - Capa-City SAS - - - - EU11/7/2017 Love You Foods LLC - Disruptive Enterprises LLC - - - - N.A.11/6/2017 Redefine International - Leopard Redefine International Plc PATRIZIA Immobilien AG $238.2 - - - EU11/6/2017 Carnicas Saenz SL - Guzmán Gastronomía SL - - - - EU11/6/2017 Froosh AB - Karl Fazer Ab Oy - - - - EU11/6/2017 Gaytan Foods Co. - Evans Food Group Ltd. - - - - N.A.11/3/2017 Nutragenesis LLC - Innophos Holdings, Inc. $28.0 - - - N.A.11/3/2017 Jean-Pierre Tallec L'Héritage du Goût - Société Cooperative Agricole - - - - EU11/2/2017 Hortex Holding SA - Mid Europa Partners LLP - - - - EU11/2/2017 Richelieu Foods, Inc. - Süddeutsche Zuckerrübenverwertungs - - - - N.A.11/2/2017 Tazo Tea Co. Starbucks Corp. Unilever Plc $384.0 3.4x - - Cross Border11/2/2017 Bäckerei Schwyter AG - Obermühle Boswil AG - - - - EU11/2/2017 Magicgoal Ltd. - Delaware North Cos., Inc. - - - - Cross Border11/2/2017 3k Oil Services Ltd. - Tervita Corp. - - - - Cross Border11/2/2017 L'Atelier du poissonnier SAS - Groupe Duval SAS - - - - EU11/2/2017 CBA Slovakia AS - Enterprise Investors Sp zoo - - - - EU11/1/2017 Betin, Inc. - Saputo, Inc. - - - - Cross Border11/1/2017 ZIFRU Trockenprodukte GmbH - HOCHDORF Holding AG - - - - EU11/1/2017 Culinary Coffee Roasters LLC - Isodiol International, Inc. $0.5 - - - Cross Border11/1/2017 Gold Crest Food & Beverages Ltd. - Green Bean Ltd. $1.3 - - - EU10/31/2017 Columbus Manufacturing, Inc. - Hormel Foods Corp. $850.0 2.8x - - N.A.10/31/2017 Natural Stuff, Inc. - Amfil Technologies, Inc. $0.1 - - - Cross Border10/30/2017 Sausalitos Holding GmbH - Ergon Capital SA - - - - EU10/28/2017 Famille Mommessin SA - Artemis SA Private Equity - - - - EU10/27/2017 Standard Candy Co., Inc. - Hearthside Food Solut ions LLC - - - - N.A.10/27/2017 The London Kitchen Ltd. - Swan About Ltd. - - - - EU10/26/2017 Inventure Foods, Inc. - UTZ Quality Foods LLC $165.0 0.0x 9.2x 0.0x N.A.10/26/2017 Cast lerock Group Holdings, Inc. - WOWIO, Inc. $2.5 - - - N.A.10/26/2017 Life Europe AB - Fairford Holdings Europe AB - - - - EU10/26/2017 Olivos Naturales SL - ADM Capital Europe LLP - - - - EU10/25/2017 Arne B. Corneliussen AS DAT-Schaub A/S Idun Industri AS - - - - EU10/25/2017 Profi Sp zoo - Coast2Coast Investments Ltd. - - - - EU10/24/2017 SDJ Trading LLC - Enson Group, Inc. - - - - N.A.10/23/2017 ProBlend-Eurogerm LLC - Mobago SAS - - - - N.A.10/23/2017 Cambrian Solut ions - Color Division Cambrian Solut ions, Inc. ROHA Dyechem Sez Pvt Ltd. - - - - Cross Border10/22/2017 Au Petit Panier - Au Petit Panier - Private Group - - - - EU
M&A OVERVIEW*
13
FOOD AND BEVERAGEINDUSTRY UPDATE │ NOVEMBER 2017
QUARTERLY M&A ACTIVITY
Median LTM Trading Multiples & Quarterly Food & Beverage M&A5
Recent Food and Beverage M&A5
MEDIAN LTM TRADING MULTIPLES
* M&A transactions include European and cross-border deals since 2015.
48 39 3346 47 52
7089
58 5782
141118
92 94107
139
166
126 119 128
66
96 10
13 8 7
10
6
10 5
20
18
8
19 1917
46
40
3534
33
21
0
40
80
120
160
200
240
Q31
2Q
412
Q11
3Q
213
Q31
3Q
413
Q11
4Q
214
Q31
4Q
414
Q11
5Q
215
Q31
5Q
415
Q11
6Q
216
Q31
6Q
416
Q11
7Q
217
Q31
7Q
417
Num
ber o
f Tra
nsac
tions
Strategic Acquirer Private Equity Acquirer
10.0x
11.0x
12.0x
13.0x
14.0x
15.0x
16.0x
Oct
-16
Nov
-16
Dec
-16
Jan-
17
Feb
-17
Ma
r-17
Apr
-17
Ma
y-17
Jun-
17
Jul-1
7
Aug
-17
Sep
-17
Oct
-17
Med
ian
Tradi
ng M
ultip
le
Food Products, Processing, and Ingredients Retail and Restaurants
PAGE |
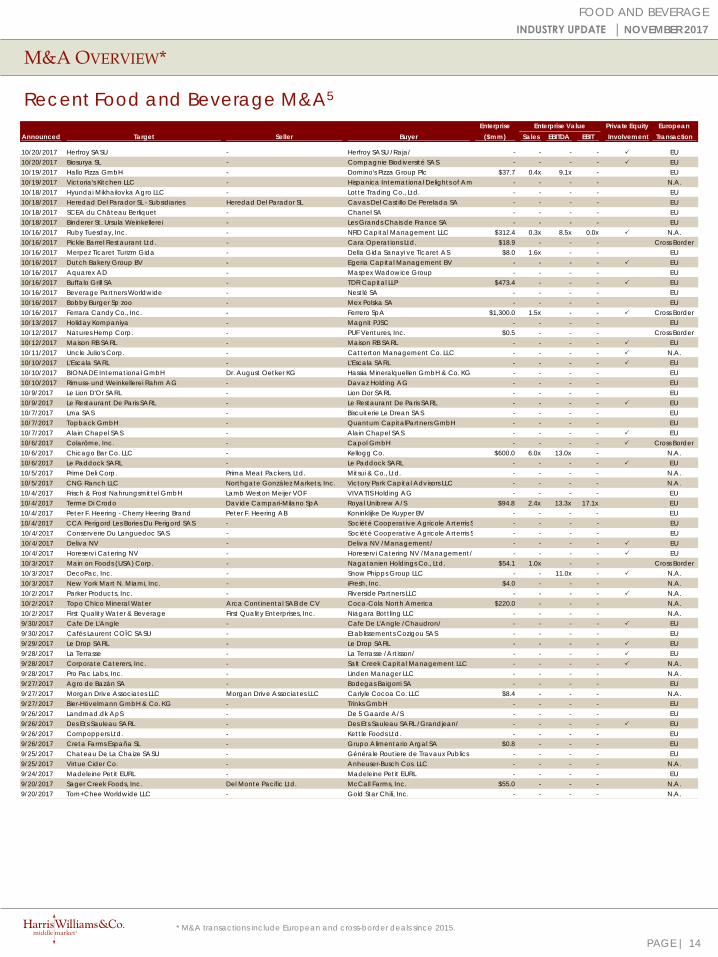
Enterprise Enterprise Value Private Equity EuropeanAnnounced Target Seller Buyer
($mm) Sales EBITDA EBIT Involvement Transaction
10/20/2017 Herfroy SASU - Herfroy SASU /Raja/ - - - - EU10/20/2017 Biosurya SL - Compagnie Biodiversité SAS - - - - EU10/19/2017 Hallo Pizza GmbH - Domino's Pizza Group Plc $37.7 0.4x 9.1x - EU10/19/2017 Victoria's Kitchen LLC - Hispanica International Delights of Ame - - - - N.A.10/18/2017 Hyundai Mikhailovka Agro LLC - Lotte Trading Co., Ltd. - - - - EU10/18/2017 Heredad Del Parador SL - Subsidiaries Heredad Del Parador SL Cavas Del Cast illo De Perelada SA - - - - EU10/18/2017 SCEA du Château Berliquet - Chanel SA - - - - EU10/18/2017 Binderer St. Ursula Weinkellerei - Les Grands Chais de France SA - - - - EU10/16/2017 Ruby Tuesday, Inc. - NRD Capital Management LLC $312.4 0.3x 8.5x 0.0x N.A.10/16/2017 Pickle Barrel Restaurant Ltd. - Cara Operations Ltd. $18.9 - - - Cross Border10/16/2017 Merpez Ticaret Turizm Gida - Della Gida Sanayi ve Ticaret AS $8.0 1.6x - - EU10/16/2017 Dutch Bakery Group BV - Egeria Capital Management BV - - - - EU10/16/2017 Aquarex AD - Maspex Wadowice Group - - - - EU10/16/2017 Buffalo Grill SA - TDR Capital LLP $473.4 - - - EU10/16/2017 Beverage Partners Worldwide - Nest lé SA - - - - EU10/16/2017 Bobby Burger Sp zoo - Mex Polska SA - - - - EU10/16/2017 Ferrara Candy Co., Inc. - Ferrero SpA $1,300.0 1.5x - - Cross Border10/13/2017 Holiday Kompaniya - Magnit PJSC - - - - EU10/12/2017 Natures Hemp Corp. - PUF Ventures, Inc. $0.5 - - - Cross Border10/12/2017 Maison RB SARL - Maison RB SARL - - - - EU10/11/2017 Uncle Julio's Corp. - Catterton Management Co. LLC - - - - N.A.10/10/2017 L'Escala SARL - L'Escala SARL - - - - EU10/10/2017 BIONADE International GmbH Dr. August Oetker KG Hassia Mineralquellen GmbH & Co. KG - - - - EU10/10/2017 Rimuss- und Weinkellerei Rahm AG - Davaz Holding AG - - - - EU10/9/2017 Le Lion D'Or SARL - Lion Dor SARL - - - - EU10/9/2017 Le Restaurant De Paris SARL - Le Restaurant De Paris SARL - - - - EU10/7/2017 Lma SAS - Biscuiterie Le Drean SAS - - - - EU10/7/2017 Topback GmbH - Quantum CapitalPartners GmbH - - - - EU10/7/2017 Alain Chapel SAS - Alain Chapel SAS - - - - EU10/6/2017 Colarôme, Inc. - Capol GmbH - - - - Cross Border10/6/2017 Chicago Bar Co. LLC - Kellogg Co. $600.0 6.0x 13.0x - N.A.10/6/2017 Le Paddock SARL - Le Paddock SARL - - - - EU10/5/2017 Prime Deli Corp. Prima Meat Packers, Ltd. Mitsui & Co., Ltd. - - - - N.A.10/5/2017 CNG Ranch LLC Northgate González Markets, Inc. Victory Park Capital Advisors LLC - - - - N.A.10/4/2017 Frisch & Frost Nahrungsmittel GmbH Lamb Weston Meijer VOF VIVATIS Holding AG - - - - EU10/4/2017 Terme Di Crodo Davide Campari-Milano SpA Royal Unibrew A/S $94.8 2.4x 13.3x 17.1x EU10/4/2017 Peter F. Heering - Cherry Heering Brand Peter F. Heering AB Koninklijke De Kuyper BV - - - - EU10/4/2017 CCA Perigord Les Bories Du Perigord SAS - Société Cooperative Agricole Arterris SC - - - - EU10/4/2017 Conserverie Du Languedoc SAS - Société Cooperative Agricole Arterris SC - - - - EU10/4/2017 Deliva NV - Deliva NV /Management/ - - - - EU10/4/2017 Horeservi Catering NV - Horeservi Catering NV /Management/ - - - - EU10/3/2017 Main on Foods (USA) Corp. - Nagatanien Holdings Co., Ltd. $54.1 1.0x - - Cross Border10/3/2017 DecoPac, Inc. - Snow Phipps Group LLC - - 11.0x - N.A.10/3/2017 New York Mart N. Miami, Inc. - iFresh, Inc. $4.0 - - - N.A.10/2/2017 Parker Products, Inc. - Riverside Partners LLC - - - - N.A.10/2/2017 Topo Chico Mineral Water Arca Continental SAB de CV Coca-Cola North America $220.0 - - - N.A.10/2/2017 First Quality Water & Beverage First Quality Enterprises, Inc. Niagara Bott ling LLC - - - - N.A.9/30/2017 Cafe De L'Angle - Cafe De L'Angle /Chaudron/ - - - - EU9/30/2017 Cafés Laurent COÏC SASU - Etablissements Cozigou SAS - - - - EU9/29/2017 Le Drop SARL - Le Drop SARL - - - - EU9/28/2017 La Terrasse - La Terrasse /Art isson/ - - - - EU9/28/2017 Corporate Caterers, Inc. - Salt Creek Capital Management LLC - - - - N.A.9/28/2017 Pro Pac Labs, Inc. - Linden Manager LLC - - - - N.A.9/27/2017 Agro de Bazán SA - Bodegas Baigorri SA - - - - EU9/27/2017 Morgan Drive Associates LLC Morgan Drive Associates LLC Carlyle Cocoa Co. LLC $8.4 - - - N.A.9/27/2017 Bier-Hövelmann GmbH & Co. KG - Trinks GmbH - - - - EU9/26/2017 Landmad.dk ApS - De 5 Gaarde A/S - - - - EU9/26/2017 Des Ets Sauleau SARL - Des Ets Sauleau SARL /Grandjean/ - - - - EU9/26/2017 Cornpoppers Ltd. - Kett le Foods Ltd. - - - - EU9/26/2017 Creta Farms España SL - Grupo Alimentario Argal SA $0.8 - - - EU9/25/2017 Chateau De La Chaize SASU - Générale Routiere de Travaux Publics - - - - EU9/25/2017 Virtue Cider Co. - Anheuser-Busch Cos. LLC - - - - N.A.9/24/2017 Madeleine Petit EURL - Madeleine Petit EURL - - - - EU9/20/2017 Sager Creek Foods, Inc. Del Monte Pacific Ltd. McCall Farms, Inc. $55.0 - - - N.A.9/20/2017 Tom+Chee Worldwide LLC - Gold Star Chili, Inc. - - - - N.A.
M&A OVERVIEW*
14
FOOD AND BEVERAGEINDUSTRY UPDATE │ NOVEMBER 2017
Recent Food and Beverage M&A5
* M&A transactions include European and cross-border deals since 2015.
PAGE |
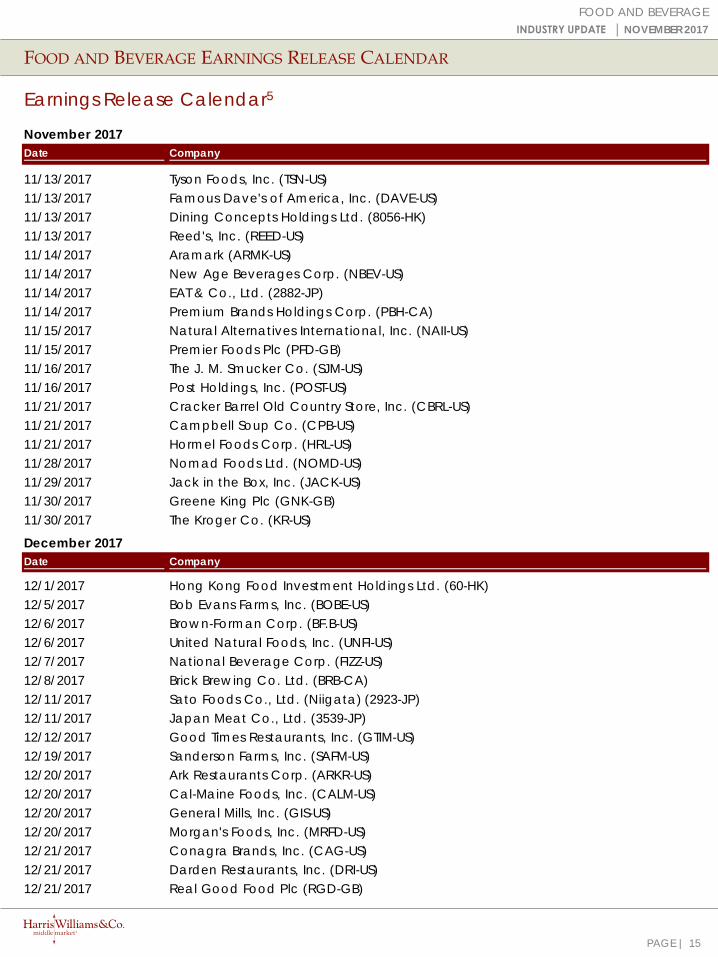
FOOD AND BEVERAGE EARNINGS RELEASE CALENDAR
15
FOOD AND BEVERAGEINDUSTRY UPDATE │ NOVEMBER 2017
Earnings Release Calendar5
November 2017Date Company
11/13/2017 Tyson Foods, Inc. (TSN-US)11/13/2017 Famous Dave's of America, Inc. (DAVE-US)11/13/2017 Dining Concepts Holdings Ltd. (8056-HK)11/13/2017 Reed's, Inc. (REED-US)11/14/2017 Aramark (ARMK-US)11/14/2017 New Age Beverages Corp. (NBEV-US)11/14/2017 EAT & Co., Ltd. (2882-JP)11/14/2017 Premium Brands Holdings Corp. (PBH-CA)11/15/2017 Natural Alternatives International, Inc. (NAII-US)11/15/2017 Premier Foods Plc (PFD-GB)11/16/2017 The J. M. Smucker Co. (SJM-US)11/16/2017 Post Holdings, Inc. (POST-US)11/21/2017 Cracker Barrel Old Country Store, Inc. (CBRL-US)11/21/2017 Campbell Soup Co. (CPB-US)11/21/2017 Hormel Foods Corp. (HRL-US)11/28/2017 Nomad Foods Ltd. (NOMD-US)11/29/2017 Jack in the Box, Inc. (JACK-US)11/30/2017 Greene King Plc (GNK-GB)11/30/2017 The Kroger Co. (KR-US)
December 2017Date Company
12/1/2017 Hong Kong Food Investment Holdings Ltd. (60-HK)12/5/2017 Bob Evans Farms, Inc. (BOBE-US)12/6/2017 Brown-Forman Corp. (BF.B-US)12/6/2017 United Natural Foods, Inc. (UNFI-US)12/7/2017 National Beverage Corp. (FIZZ-US)12/8/2017 Brick Brewing Co. Ltd. (BRB-CA)12/11/2017 Sato Foods Co., Ltd. (Niigata) (2923-JP)12/11/2017 Japan Meat Co., Ltd. (3539-JP)12/12/2017 Good Times Restaurants, Inc. (GTIM-US)12/19/2017 Sanderson Farms, Inc. (SAFM-US)12/20/2017 Ark Restaurants Corp. (ARKR-US)12/20/2017 Cal-Maine Foods, Inc. (CALM-US)12/20/2017 General Mills, Inc. (GIS-US)12/20/2017 Morgan's Foods, Inc. (MRFD-US)12/21/2017 Conagra Brands, Inc. (CAG-US)12/21/2017 Darden Restaurants, Inc. (DRI-US)12/21/2017 Real Good Food Plc (RGD-GB)

Energy, Power& Infrastructure
IndustrialsHealthcare & Life Sciences
Transportation & Logistics
Aerospace, Defense & Government
Services
Business Services
Building Products & Materials
Technology, Media & Telecom
Specialty Distribution
Consumer
PAGE |
HARRIS WILLIAMS & CO. OFFICE LOCATIONS
UNITED STATES EUROPE
BostonOne International PlaceSuite 2620Boston, Massachusetts 02110Phone: +1 (617) 482-7501
Cleveland1900 East 9th Street20th FloorCleveland, Ohio 44114Phone: +1 (216) 689-2400
Minneapolis222 South 9th StreetSuite 3350Minneapolis, Minnesota 55402Phone: +1 (612) 359-2700
Richmond (Headquarters)1001 Haxall Point9th FloorRichmond, Virginia 23219Phone: +1 (804) 648-0072
San Francisco575 Market Street31st FloorSan Francisco, California 94105Phone: +1 (415) 288-4260
Washington, D.C. 800 17th St. NW2nd FloorWashington, D.C. 20006Phone: +1 (202) 207-2300
FrankfurtBockenheimer Landstrasse 33-3560325 FrankfurtGermanyPhone: +49 069 3650638 00
London63 Brook StreetLondon W1K 4HS, EnglandPhone: +44 (0) 20 7518 8900
NETWORK OFFICES
BeijingHong KongMumbai
New DelhiShanghai
Consumer
OUR FIRM
FOOD AND BEVERAGEINDUSTRY UPDATE │ NOVEMBER 2017
16
Harris Williams & Co. has a broad range of industry expertise, which creates powerful opportunities.Our clients benefit from our deep-sector experience, integrated industry intelligence andcollaboration across the firm, and our commitment to learning what makes them unique. For moreinformation, visit our website at www.harriswilliams.com/industries.
PAGE |
HARRIS WILLIAMS & CO.
1. IMF
2. U.S. Bureau of Labor Statistics
3. Unweighted Average
4. U.S. Census Bureau
5. Factset
6. Thomson Financial
7. S&P
8. Reuters
SOURCES
FOOD AND BEVERAGEINDUSTRY UPDATE │ NOVEMBER 2017
DISCLOSURES
17
Harris Williams & Co. (www.harriswilliams.com) is a preeminent middle market investment bank focused on the advisory needs of clients worldwide. The firm has deep industry knowledge, global transaction expertise, and an unwavering commitment to excellence. Harris Williams & Co. provides sell-side and acquisition advisory, restructuring advisory, board advisory, private placements, and capital markets advisory services.
Investment banking services are provided by Harris Williams LLC, a registered broker-dealer and member of FINRA and SIPC, and Harris Williams & Co. Ltd, which is a private limited company incorporated under English law with its registered office at 5th Floor, 6 St. Andrew Street, London EC4A 3AE, UK, registered with the Registrar of Companies for England and Wales (registration number 07078852). Harris Williams & Co. Ltd is authorized and regulated by the Financial Conduct Authority. Harris Williams & Co. is a trade name under which Harris Williams LLC and Harris Williams & Co. Ltd conduct business.
THIS REPORT MAY CONTAIN REFERENCES TO REGISTERED TRADEMARKS, SERVICE MARKS AND COPYRIGHTS OWNED BY THIRD-PARTY INFORMATION PROVIDERS. NONE OF THE THIRD-PARTY INFORMATION PROVIDERS IS ENDORSING THE OFFERING OF, AND SHALL NOT IN ANY WAY BE DEEMED AN ISSUER OR UNDERWRITER OF, THE SECURITIES, FINANCIAL INSTRUMENTS OR OTHER INVESTMENTS DISCUSSED IN THIS REPORT, AND SHALL NOT HAVE ANY LIABILITY OR RESPONSIBILITY FOR ANY STATEMENTS MADE IN THE REPORT OR FOR ANY FINANCIAL STATEMENTS, FINANCIAL PROJECTIONS OR OTHER FINANCIAL INFORMATION CONTAINED OR ATTACHED AS AN EXHIBIT TO THE REPORT. FOR MORE INFORMATION ABOUT THE MATERIALS PROVIDED BY SUCH THIRD PARTIES, PLEASE CONTACT US.
The information and views contained in this report were prepared by Harris Williams & Co. (“Harris Williams”). It is not a research report, as such term is defined by applicable law and regulations, and is provided for informational purposes only. It is not to be construed as an offer to buy or sell or a solicitation of an offer to buy or sell any financial instruments or to participate in any particular trading strategy. The information contained herein is believed by Harris Williams to be reliable, but Harris Williams makes no representation as to the accuracy or completeness of such information. Harris Williams and/or its affiliates may be market makers or specialists in, act as advisers or lenders to, have positions in and effect transactions in securities of companies mentioned herein and also may provide, may have provided, or may seek to provide investment banking services for those companies. In addition, Harris Williams and/or its affiliates or their respective officers, directors and employees may hold long or short positions in the securities, options thereon or other related financial products of companies discussed herein. Opinions, estimates and projections in this report constitute Harris Williams’ judgment and are subject to change without notice. The financial instruments discussed in this report may not be suitable for all investors, and investors must make their own investment decisions using their own independent advisors as they believe necessary and based upon their specific financial situations and investment objectives. Also, past performance is not necessarily indicative of future results. No part of this material may be copied or duplicated in any form or by any means, or redistributed, without Harris Williams’ prior written consent.
Copyright© 2017 Harris Williams & Co., all rights reserved.