fom 12 polynomial functions unit practice test
TRANSCRIPT

FOM 12 Polynomial Functions Unit PRACTICE TEST
Name: ______________________________
Learning Goals Beginning Developing Proficient Sophisticated I can describe characteristics of polynomial graphs I can use technology to perform lines/curves of regression
Learning Goals #1: I can describe characteristics of polynomial graphs
Circle which graphs are functions:
Graph the following polynomial function by hand and state the following: y = 𝟐𝟐
𝟑𝟑𝒙𝒙 − 𝟒𝟒
a) Number of turns b) Degree of polynomial c) Number of x-intercepts d) Co-ordinates of y-intercepts e) End behaviour f) Domain g) Range

Graph the following polynomial function by hand and state the following: y = (x – 2)2 + 3 a) Number of turns b) Degree of polynomial c) Number of x-intercepts d) Co-ordinates of y-intercepts e) End behaviour f) Domain g) Range
Graph the following polynomial function by hand and state the following: y = (x + 1)3 - 2
a) Number of turns b) Degree of polynomial c) Number of x-intercepts d) Co-ordinates of y-intercepts e) End behaviour f) Domain g) Range

Graph the following function: f(x) = -4
Graph the following function: f(x) = - 1
2𝑥𝑥 + 4
Graph the following function: y = - 𝑥𝑥2 + 4
Graph the following function: y – 3 = 2(x + 1)
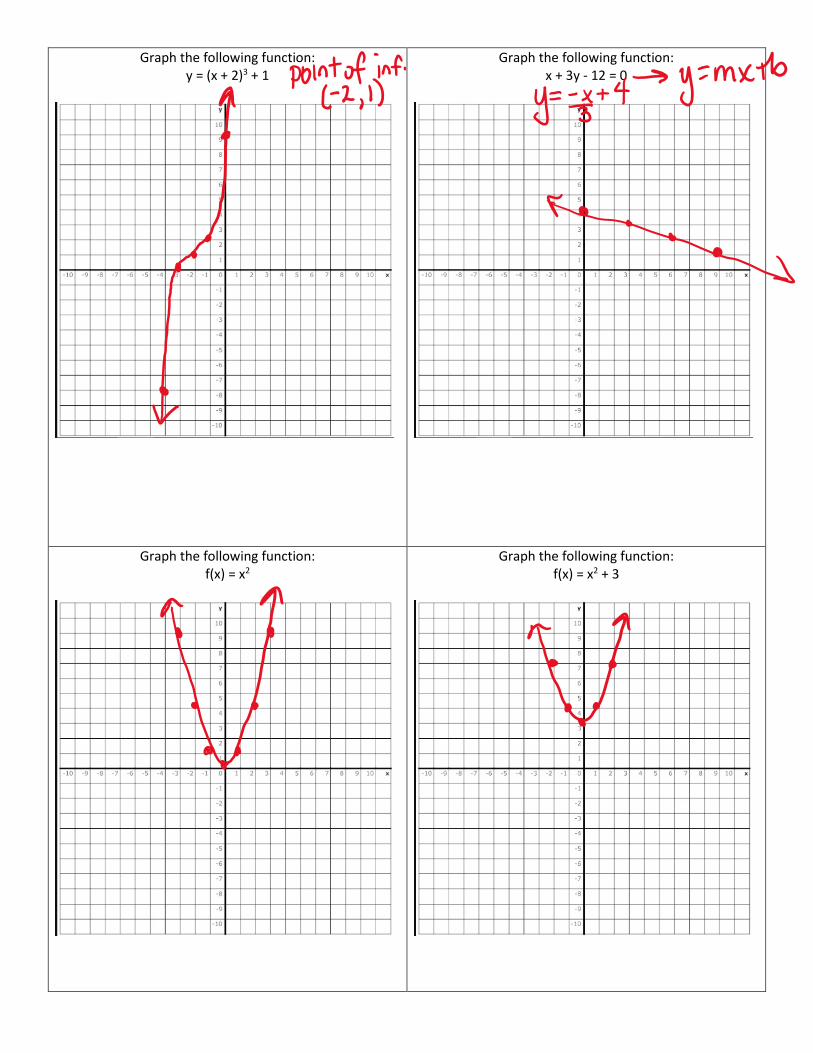
Graph the following function: y = (x + 2)3 + 1
Graph the following function: x + 3y - 12 = 0
Graph the following function: f(x) = x2
Graph the following function: f(x) = x2 + 3

Graph the following function: y = (x - 2)(x + 4)
Graph the following function: y = 2(x + 2)2
Graph the following function: y = 1
2𝑥𝑥2 + 1
Graph the following function: y = (x + 1)3 + 2

Learning Goal #2: I can use technology to perform a line/curve of regression
The cost of a taxi ride in Calgary, for several distances, is given in the table below.
Distance (km) Cost ($) 37.95 70.49 2.22 8.40
86.47 152.77 3.55 10.89
19.16 37.76 34.66 64.16 21.17 40.93 12.22 26.55 27.72 52.09
a) Use DESMOS to create a scatterplot, and describe the relationship that you observe b) Determine the equation of the linear regression function that models the data c) Use your equation to estimate…
a. The cost of a 50 km trip b. The fixed cost for any taxi trip
The following tables shows the number of females who entered a trade program in Canada in selected years after 1990.
Years After 1990 Number of Females 1 8 245 5 11 425 7 13 305 9 15 675
13 24 280 15 28 755 17 38 070
a) Use DESMOS to create a scatterplot, and describe the relationship that you observe b) Determine the equation of the regression function that models the data c) Use your equation to estimate…
a. In which year does the number of females who entered the trades program reach 20 000? b. What is the program population at 50 000?
A dolphin jumped out of the water in a tank and then dove back in. The dolphin’s height, in meters, above the water is given in the table below. Using quadratic regression, estimate the maximum height of the dolphin during the jump.
Height (m) 0.59 1.22 1.39 0.73 -1.45 Time (s) 0.5 1.0 1.5 2.5 3.5

Statistics Canada recorded the following data for the incidence of lung cancer per 100,000 Canadian males in the years after 1976.
Years After 1976
Cancer Incidence
Years After 1976
Cancer Incidence
Years After 1976
Cancer Incidence
0 75.7 10 96.4 20 82.2 1 78.6 11 95.0 21 79.3 2 85.1 12 95.5 22 80.5 3 83.9 13 93.6 23 79.5 4 83.2 14 92.7 24 77.1 5 91.2 15 90.7 25 75.8 6 92.6 16 90.5 26 73.0 7 95.2 17 91.5 27 70.0 8 97.1 18 86.7 28 69.6 9 93.2 19 84.6
a. Use a cubic regression function to model the data and extrapolate the incidence of lung cancer in 2010 b. According to your polynomial model, when should Canada expect to see the incidence of lung cancer drop
below 65 per 100 000 males?
Audrey is interested in how speed plays a role in car accidents. She knows that there is a relationship between the speed of a car and the distance needed to stop. She collected the following
Speed (km/h) Distance (m) Speed (km/h) Distance (m) Speed (km/h) Distance (m)
90 94.4 38 21 83 130.4 36 17 92 111 50 29.1 65 49.2 22 5.6 48 37 56 50.3 31 16.8 45 20.7 65 43.1 50 40 81 86 24 10.9 52 51.2 42 20.6 35 14.2 33 15.9 31 14 55 57.3 27 7.4 38 21 81 76.5 33 20.7 29 11 83 100.3 32 17.9 77 112.3 25 9.1 47 41.9 76 84.1 25 10 95 105.2 55 35.3 77 77.8 24 6.7 79 81.8 32 14.9 23 6.9 23 6.2 76 67.3 79 63.6 49 35
a. Use a quadratic regression function to model the data b. According to your polynomial model, compare the stopping distance at 30 km/h with the stopping distance at
50 km/h, to the nearest tenth of a metre c. Determine the maximum speed that a car should be travelling in order to stop within 4m, the average length
of a car.