finnair group interim report 1 january – 30 june 2009
TRANSCRIPT

Finnair GroupInterim Report 1 January – 30 June 2009

A Sector in Crisis
Passenger and cargo demand clearly below last yearAverage prices low due to 30-40 per cent reduction in business travelOvercapacity slowly being removedHuge losses for second quarter, September will show whether business travel will start to recoverFall in cargo demand has levelled offCash and financial position becoming critical for airlinesIATA’s loss forecast for this year slumps to nine billion dollars

Finnair’s result in line with the sectorNet sales declined in the second quarter by more than 20 per centOperational loss 56.9 million euros, result before taxes -35,3 million eurosPrice level weakened in April-June by more than 18 per centPassenger load factor remained good Scheduled Passenger Traffic’s profitability clearly loss-makingCosts adjusted in line with falling volume, no ability so far to compensate falling price levelOf efficiency programme totalling 200 million euros, more than half is being implemented, 120 million euros of savings in personnel costsMarket share in Asian traffic has grownBalance sheet position remains strongPunctuality and customer satisfaction are on a high level

New structure to improve clarity and efficiency
New structure for Finnair Group from beginning of OctoberScheduled traffic and leisure traffic will merge Support functions within Group Administration: Financial Management, Resource Management, Business Development, HR, IT and Legal AffairsRoute network and resources (fleet, personnel) will be coordinated centrally, partial optimisation reducedOverlaps removed

Poor operational resultQ2/09 Q2/08 Change %
Turnover mill. euro 427.4 545.2 -21.6
Adjusted EBITDAR* mill. euro -8.6 49.5-
Adjusted EBIT* i.e. Operational result mill. euro -56.9 4.6 -
One off items/ capital gains mill. euro 0.2 2.9 -
Fair value changes of derivatives mill. euro 24.2 12.6 -
Operating profit/loss (EBIT) mill. euro -32.5 20.1 -
Profit before tax mill. euro -35.3 18.5 -
*excl. capital gains, fair values changes of derivatives and non recurring items

Negative trend in profitability expected to level off
-80
-60
-40
-20
0
20
40
60
Q1 Q2 Q3 Q4 Q1 Q2 Q3 Q4 Q1 Q2 Q3 Q4 Q1 Q2 Q3 Q4 Q1 Q2 Q3 Q4 Q1 Q2
MEUR
2005 2006 20072004 2008 2009
Change in EBIT* per quarter
*excl. capital gains, fair value changes of derivatives and non recurring items

Unit costs not in parity with declining revenues Change YoY
-20
-15
-10
-5
0
5
10
15
Q1 Q2 Q3 Q4 Q1 Q2 Q3 Q4 Q1 Q2 Q3 Q4 Q1 Q2 Q3 Q4 Q1 Q2 Q3 Q4 Q1 Q2
% Yield (EUR/RTK) Unit costs (EUR/ATK)
2006 2007 200820052004 2009

Unit costs in the biggest components adjusted in line with volume drop, not price drop
Q2/09 Q2/08
Unit costs of flight operations* c/ATK +2,8% -4,6%
Unit costs of flight operations* excl. fuel c/ATK +5,6% -10,4%
Personnel expenses c/ATK -0,9% -8,7%
Fuel costs** c/ATK -4,3% +14,1%
Traffic charges c/ATK +4,8% -5,5%
Ground handling and catering €/psgr. -4,8% +21,2%
Sales and marketing €/psgr. -8,3% +2,4%
Aircraft lease payments and depreciation c/ATK +28,2% -13,6%
Other costs* c/ATK +8,1% -12,4%
* excluding fair value changes of derivatives and restructuring items** includes realized fuel and currency hedging outside hedge accounting ATK = Available Tonne Kilometre

200 million euro efficiency programmes Programmes totalling 200 million euros under wayTargets amounting to more than 100 million euros identified100 million euro result impact this year; 100 million euros next yearSavings in personnel costs total 120 million euros• 600 fewer employees than last year, more than 6,000 subject to
temporary lay-offs
Key efficiency areas:• Organisational reform will bring increase efficiency by centralising
functions• Scheduled traffic capacity cut by over 8% v. 2008• Improvement of network cost-efficiency
Stabilisation agreement in Finnair Technical Services will bring around 14 million in savingsStatutory employer-employee ‘YT’ negotiations lie ahead

Finnair Technical Services’ stabilisation agreement
Agreed with all five personnel organisations
Planned savings of around 14 million euros
Working time flexibilities
Resources directed better at available work
Will enable new customer relationships outside the Group
Agreement includes performance-based bonus model for 2010-13

Number of staff declining in 2009
0
2000
4000
6000
8000
10000
12000
2000 2001 2002 2003 2004 2005 2006 2007 2008 Q2 2009
Personnel on averagePersonnel

Hedges above the spot price

Change in fuel costs in Q2
30
39
108
134
-76
-19
0
50
100
150
2008Q2 Volume Price Currency Hedging 2009Q2
MEUR

Finnair continues its hedging policy
0%
20%
40%
60%
80%
100%
20
09
Q3
20
09
Q4
20
10
Q1
20
10
Q2
20
10
Q3
20
10
Q4
20
11
Q1
20
11
Q2
20
11
Q3
20
11
Q4
20
12
Q1
20
12
Q2
20
12
Q3
hedge ratio
upper
lower

Fuel costs a fifth of turnover
2004: 12.6% of turnover2005: 15.6% of turnover2006: 19.4% of turnover2007: 20.3% of turnover2008: 24.6% of turnover2009: ~24% of turnover
Finnair scheduled traffic has hedged 71% of its fuel purchases for the next six months, thereafter for the following 24 months with a decreasing level.

Investments made mainly in H1 Cash flow statement
Q1-Q2/2009 Q1-Q2/2008
Cash flow from operations mill. euro-115
87
Investments and sale of assets mill. euro -304 -109
Investments mill. euro -328 -145
Change of advances and others mill. euro +24 +36
mill. euro
Cash flow from financing mill. euro 293 -81
Liquid funds at the beginning mill. euro 392 540
Change in liquid funds mill. euro -126 -103
Liquid funds* at the end mill. euro 266 437
*incl. financial interest bearing assets at fair value

Balance sheet still strongEquity ratio and adjusted gearing
0
20
40
60
80
100
120
140
2004 2005 2006 2007 2008 Q2 2009
Equity ratio Adjusted Gearing%

Fleet renewal programme6 E1701* E1901 A340
2006
5* E1902 A340
2007
2 A3402* E1902008
5 A3302 E1902009
3 A330Embraer orders postponed
2010
*) Yhteensä neljälle E190-koneelle tehty myynti-takaisinvuokrausjärjestely
Total capex of over €400m in 2009 and less than €300m in 2010

Funding secured until spring 2010
Funding of Finnair investment programme ensured for this year Aim is to relax investment scheduleCash reserves 266 million eurosFunding sources total more than 400 million euros• European Investment Bank – 250 million euros• Export Credit Agencies• Sale and lease-back of properties – 90 million euros
In addition, credit facilities requiring a bank guarantee• Loan-back of TyEL pension fund reserves – 350 million euros
remaining Agreed, but unused credit facilities – 200 million euros200 million euro commercial paper programme

Finnair's full year clearly loss-making
Passenger and cargo traffic prices will remain at a low level Bottom expected to be reached; September will show whether business travel and cargo demand will recoverEfficiency programme and structural change will be implementedFunding for investments arranged for this yearAim is to relax investment scheduleFleet arrangements will be decided on soonSecond half of year better than first, but third quarter and full year clearly loss-making

Appendices

Segment results*
Mill. euro Q2/2009 Q2/2008Scheduled Passenger Traffic -55.9 1.3Leisure Traffic 2.9 -2.5Aviation Services -0.2 4.4Travel Services -0.9 1.4Unallocated items -2.8 0.0Total -56.9 4.6
* Operating profit, excluding capital gains, fair value changes of derivatives and non restructuring items

Segment results*
Mill. euro Q1-Q2/2009 Q1-Q2/2008Scheduled Passenger Traffic -106.2 -2.4Leisure Traffic 8.4 8.6Aviation Services 2.1 6.9Travel Services -2.4 1.8Unallocated items -6.3 -2.5Total -104.4 12.4
* Operating profit, excluding capital gains, fair value changes of derivatives and non restructuring items
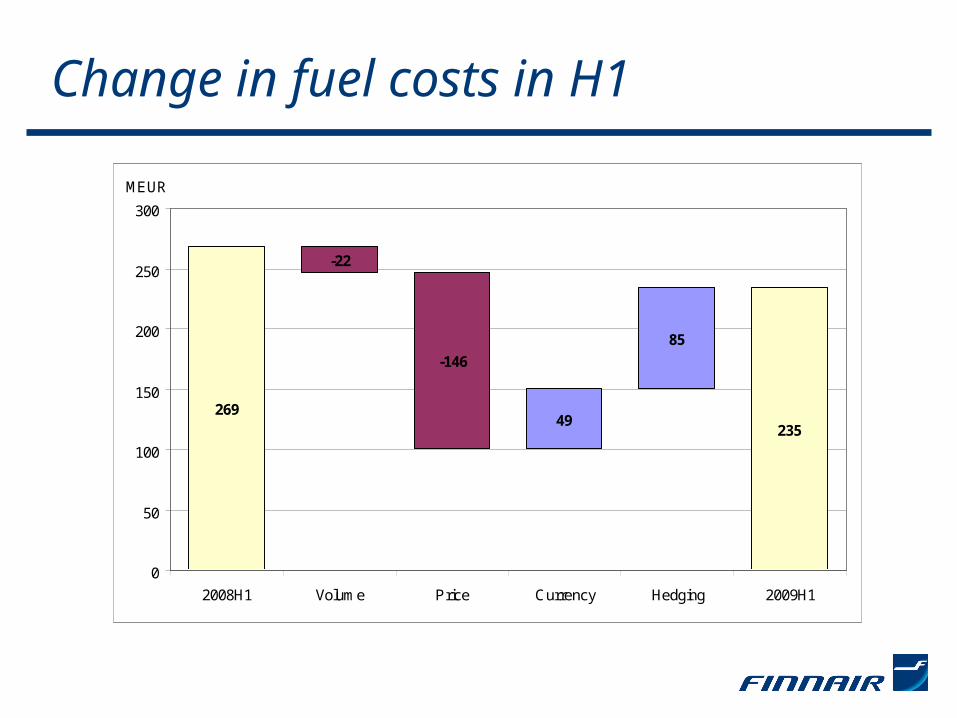
Change in fuel costs in H1
49
85
235
269
-22
-146
0
50
100
150
200
250
300
2008H1 Volume Price Currency Hedging 2009H1
MEUR

ROE and ROCE Rolling 12 months
-15
-10
-5
0
5
10
15
20
Q1 200
4
Q2 200
4
Q3 200
4
Q4 200
4
Q1 200
5
Q2 200
5
Q3 200
5
Q4 200
5
Q1 200
6
Q2 200
6
Q3 200
6
Q4 200
6
Q1 200
7
Q2 200
7
Q3 200
7
Q4 200
7
Q1 200
8
Q2 200
8
Q3 200
8
Q4 200
8
Q1 200
9
Q2 200
9
% ROE ROCE

Average yield and costs EUR c/RTK & EUR c/ATK
0
10
20
30
40
50
60
70
80
90
Q1 Q2 Q3 Q4 Q1 Q2 Q3 Q4 Q1 Q2 Q3 Q4 Q1 Q2 Q3 Q4 Q1 Q2 Q3 Q4 Q1 Q2
Yield (EUR/RTK) Unit costs (EUR/ATK)
2006 2007 200820052004 2009

Investments and cash flowfrom operations
-150
-100
-50
0
50
100
150
200
250
300
350
400
2004 2005 2006 2007 2008 Q1-Q2 2009
Operational net cash flow InvestmentsMEUR

Aircraft operating lease liabilities
0
100
200
300
400
500
600
2004 2005 2006 2007 2008 Q2 2009
MEUR Flexibility, costs, risk management
On 30 June all leases were operating leases. If capitalised using the common method of multiplying annual aircraft lease payments byseven, the adjusted gearing on 30 June 2009 would have been117,1%

Finnair Financial Targets
”Sustainable value creation”
Operating profit (EBIT)
EBIT margin at least 6% => over 120 mill. € in the coming few years
EBITDAREBITDAR margin at least 17% => over 350 mill. € in the coming few years
Economic profit
Pay out ratio Minimum one third of the EPS
Adjusted Gearing
Gearing adjusted for aircraft lease liabilities not to exceed 140 %
To create positive value over pretax WACC of 9,5%

Finnair’s Financial Targets Description of targets
Operating profit (EBIT)
EBITDAR
Economic profit
Pay out ratio
Adjusted Gearing
Turnover + other operating revenues – operating costs
Result before depreciation, aircraft lease payments and capital gains
Operating profit EBIT – Weighted Average Cost of Capital
Interest bearing debt + 7*Aircraft lease payments – liquid funds) / (Equity + minority interests)
Dividend per share / Earnings per share

www.finnair.com/group
Finnair Group Investor Relationsemail: [email protected]
tel: +358-9-818 4951fax: +358-9-818 4092