valmet’s interim review, january march 2017 | 1 filevalmet’s interim review, january–march...
TRANSCRIPT
Valmet’s Interim Review, January–March 2017 | 1
Valmet’s Interim Review, January–March 2017 | 2
Valmet’s Interim Review January 1 – March 31, 2017
Orders received increased – especially in the Paper business line
Figures in brackets, unless otherwise stated, refer to the comparison period, i.e. the same period of the
previous year.
January–March 2017: Order backlog at a record-high level following the increase
in orders received Orders received increased to EUR 1,005 million (EUR 803 million).
- Orders received increased in all business lines. - Orders received increased in Asia-Pacific, North America and EMEA, remained at the previous
year’s level in China and decreased in South America.
Net sales remained at the previous year’s level at EUR 671 million (EUR 652 million). - Net sales increased in the Pulp and Energy business line and remained at the previous year’s
level in the Automation, Paper, and Services business lines.
Comparable earnings before interest, taxes and amortization (Comparable EBITA) were EUR 35 million (EUR 31 million) and the corresponding Comparable EBITA margin was 5.1 percent (4.8%).
- Profitability improved due to higher gross profit and lower selling, general and administrative expenses.
Earnings per share were EUR 0.12 (EUR 0.08).
Items affecting comparability amounted to EUR 3 million (EUR -2 million).
Cash flow provided by operating activities was EUR 94 million (EUR 3 million).
Guidance for 2017 On April 12, 2017, Valmet revised upwards its net sales guidance for 2017. According to the revised
guidance, Valmet estimates that net sales in 2017 will increase in comparison with 2016 (EUR 2,926 million)
and Comparable EBITA in 2017 will increase in comparison with 2016 (EUR 196 million).
Short-term outlook
General economic outlook
Global economic activity is picking up with a cyclical recovery in investment, manufacturing, and trade.
World growth is expected to rise from 3.1 percent in 2016 to 3.5 percent in 2017 and 3.6 percent in 2018.
Stronger activity, expectations of more robust global demand, reduced deflationary pressures, and
optimistic financial markets are all upside developments. However, structural impediments to a stronger
recovery and a balance of risks that remains tilted to the downside remain important challenges.
(International Monetary Fund, April 18, 2017)
Short-term market outlook
Valmet estimates that the short-term market outlook has increased to a good level in services (previously
satisfactory level) and decreased to a weak level in pulp (previously satisfactory level).
Valmet reiterates the good short-term market outlook for energy, board and paper, and tissue, and the
satisfactory short-term market outlook for automation.
Valmet’s Interim Review, January–March 2017 | 3
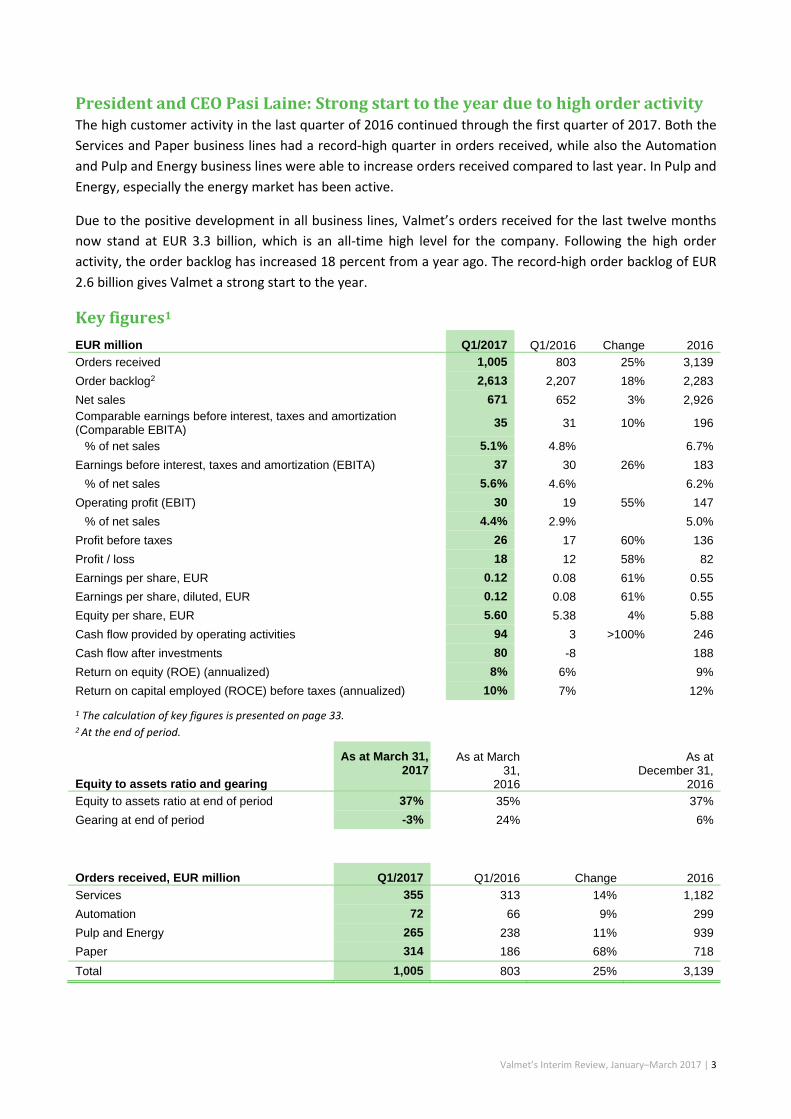
President and CEO Pasi Laine: Strong start to the year due to high order activity The high customer activity in the last quarter of 2016 continued through the first quarter of 2017. Both the
Services and Paper business lines had a record-high quarter in orders received, while also the Automation
and Pulp and Energy business lines were able to increase orders received compared to last year. In Pulp and
Energy, especially the energy market has been active.
Due to the positive development in all business lines, Valmet’s orders received for the last twelve months
now stand at EUR 3.3 billion, which is an all-time high level for the company. Following the high order
activity, the order backlog has increased 18 percent from a year ago. The record-high order backlog of EUR
2.6 billion gives Valmet a strong start to the year.
Key figures1
EUR million Q1/2017 Q1/2016 Change 2016
Orders received 1,005 803 25% 3,139
Order backlog2 2,613 2,207 18% 2,283
Net sales 671 652 3% 2,926
Comparable earnings before interest, taxes and amortization (Comparable EBITA)
35 31 10% 196
% of net sales 5.1% 4.8% 6.7%
Earnings before interest, taxes and amortization (EBITA) 37 30 26% 183
% of net sales 5.6% 4.6% 6.2%
Operating profit (EBIT) 30 19 55% 147
% of net sales 4.4% 2.9% 5.0%
Profit before taxes 26 17 60% 136
Profit / loss 18 12 58% 82
Earnings per share, EUR 0.12 0.08 61% 0.55
Earnings per share, diluted, EUR 0.12 0.08 61% 0.55
Equity per share, EUR 5.60 5.38 4% 5.88
Cash flow provided by operating activities 94 3 >100% 246
Cash flow after investments 80 -8 188
Return on equity (ROE) (annualized) 8% 6% 9%
Return on capital employed (ROCE) before taxes (annualized) 10% 7% 12%
1 The calculation of key figures is presented on page 33. 2 At the end of period.
Equity to assets ratio and gearing
As at March 31, 2017
As at March 31,
2016
As at December 31,
2016
Equity to assets ratio at end of period 37% 35% 37%
Gearing at end of period -3% 24% 6%
Orders received, EUR million Q1/2017 Q1/2016 Change 2016
Services 355 313 14% 1,182
Automation 72 66 9% 299
Pulp and Energy 265 238 11% 939
Paper 314 186 68% 718
Total 1,005 803 25% 3,139
Valmet’s Interim Review, January–March 2017 | 4
Order backlog, EUR million As at March
31, 2017 As at March 31,
2016 Change As at December
31, 2016
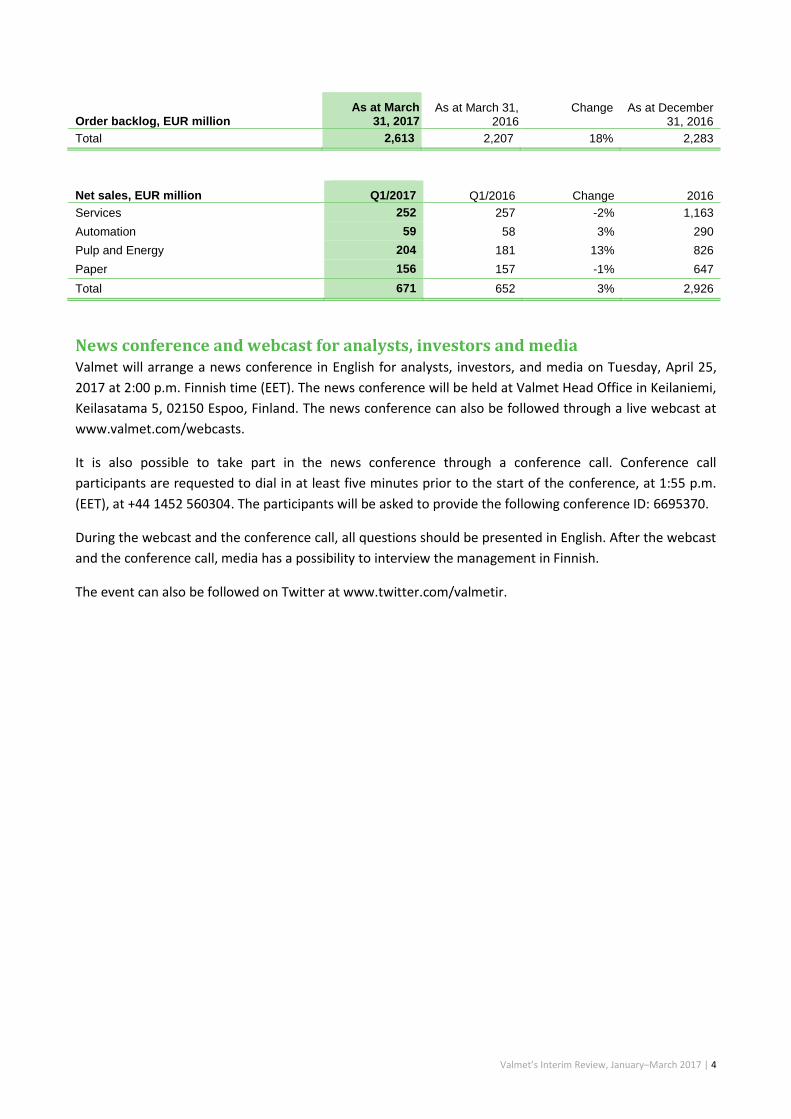
Total 2,613 2,207 18% 2,283
Net sales, EUR million Q1/2017 Q1/2016 Change 2016
Services 252 257 -2% 1,163
Automation 59 58 3% 290
Pulp and Energy 204 181 13% 826
Paper 156 157 -1% 647
Total 671 652 3% 2,926
News conference and webcast for analysts, investors and media Valmet will arrange a news conference in English for analysts, investors, and media on Tuesday, April 25,
2017 at 2:00 p.m. Finnish time (EET). The news conference will be held at Valmet Head Office in Keilaniemi,
Keilasatama 5, 02150 Espoo, Finland. The news conference can also be followed through a live webcast at
www.valmet.com/webcasts.
It is also possible to take part in the news conference through a conference call. Conference call
participants are requested to dial in at least five minutes prior to the start of the conference, at 1:55 p.m.
(EET), at +44 1452 560304. The participants will be asked to provide the following conference ID: 6695370.
During the webcast and the conference call, all questions should be presented in English. After the webcast
and the conference call, media has a possibility to interview the management in Finnish.
The event can also be followed on Twitter at www.twitter.com/valmetir.
Valmet’s Interim Review, January–March 2017 | 5
Valmet’s Interim Review January 1 – March 31, 2017
Orders received increased in all business lines
Orders received, EUR million Q1/2017 Q1/2016 Change 2016
Services 355 313 14% 1,182
Automation 72 66 9% 299
Pulp and Energy 265 238 11% 939
Paper 314 186 68% 718
Total 1,005 803 25% 3,139
Orders received, comparable foreign exchange rates, EUR million1
Q1/2017
Q1/2016
Change
2016
Services 349 313 12% 1,182
Automation 70 66 6% 299
Pulp and Energy 263 238 11% 939
Paper 312 186 67% 718
Total 994 803 24% 3,139
1 Indicative only. January to March 2017 orders received in euro calculated by applying January–March 2016 average exchange
rates to the functional currency orders received values reported by entities.
Orders received, EUR million Q1/2017 Q1/2016 Change 2016
North America 245 107 >100% 588
South America 33 109 -70% 235
EMEA 503 445 13% 1,594
China 92 88 4% 342
Asia-Pacific 133 54 >100% 381
Total 1,005 803 25% 3,139
Orders received by business line, Q1/2017 Orders received by area, Q1/2017
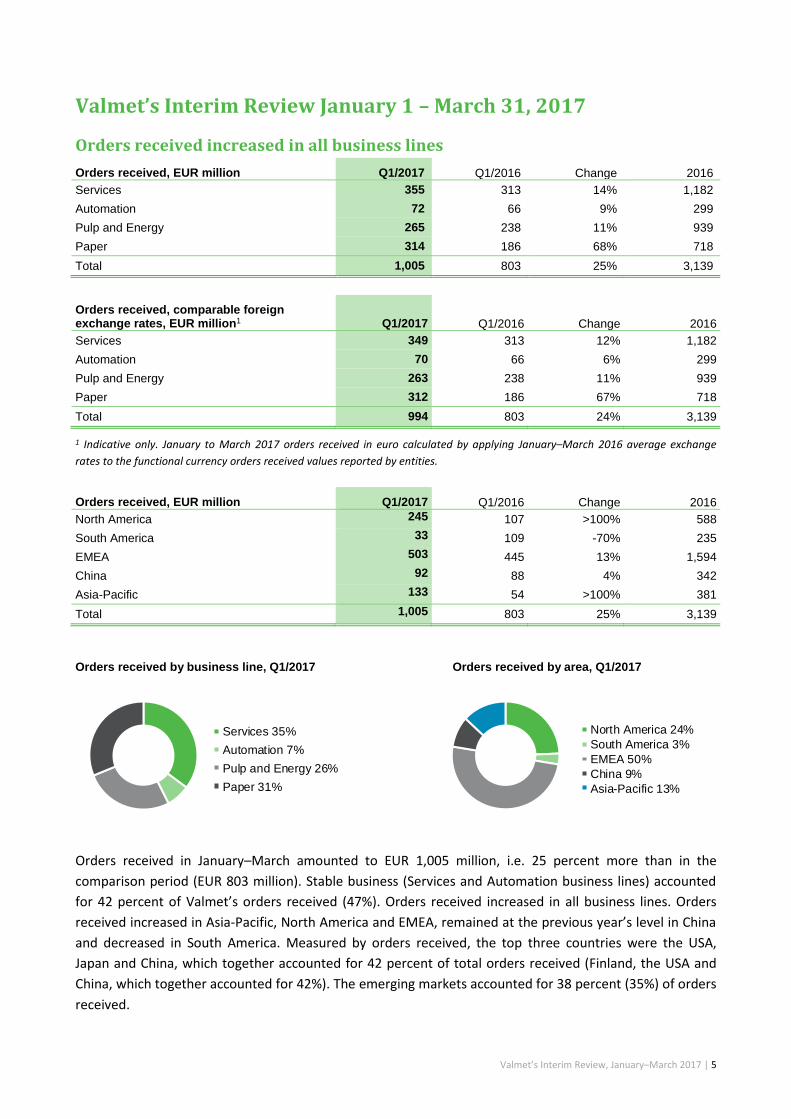
Orders received in January–March amounted to EUR 1,005 million, i.e. 25 percent more than in the
comparison period (EUR 803 million). Stable business (Services and Automation business lines) accounted
for 42 percent of Valmet’s orders received (47%). Orders received increased in all business lines. Orders
received increased in Asia-Pacific, North America and EMEA, remained at the previous year’s level in China
and decreased in South America. Measured by orders received, the top three countries were the USA,
Japan and China, which together accounted for 42 percent of total orders received (Finland, the USA and
China, which together accounted for 42%). The emerging markets accounted for 38 percent (35%) of orders
received.
Services 35%
Automation 7%
Pulp and Energy 26%
Paper 31%
North America 24%
South America 3%
EMEA 50%
China 9%
Asia-Pacific 13%
Valmet’s Interim Review, January–March 2017 | 6
Changes in foreign exchange rates compared with the exchange rates for the corresponding period in 2016
increased orders received by approximately EUR 11 million in January–March.
During January–March, Valmet received among others an order for a paper machine rebuild in the US,
typically valued at EUR 60–70 million, an order for a fine paper line in the United Arab Emirates, typically
valued at around EUR 45–70 million, an order for a multi-fuel boiler and a flue gas cleaning system in Japan,
usually around EUR 50 million, an order for a biomass-fired power boiler and a flue gas cleaning system in
Japan, typically valued at EUR 30-45 million, an order for a paper machine rebuild in the Netherlands, and
an order for automation and quality control systems in China, typically valued from below one million to
three million euros.
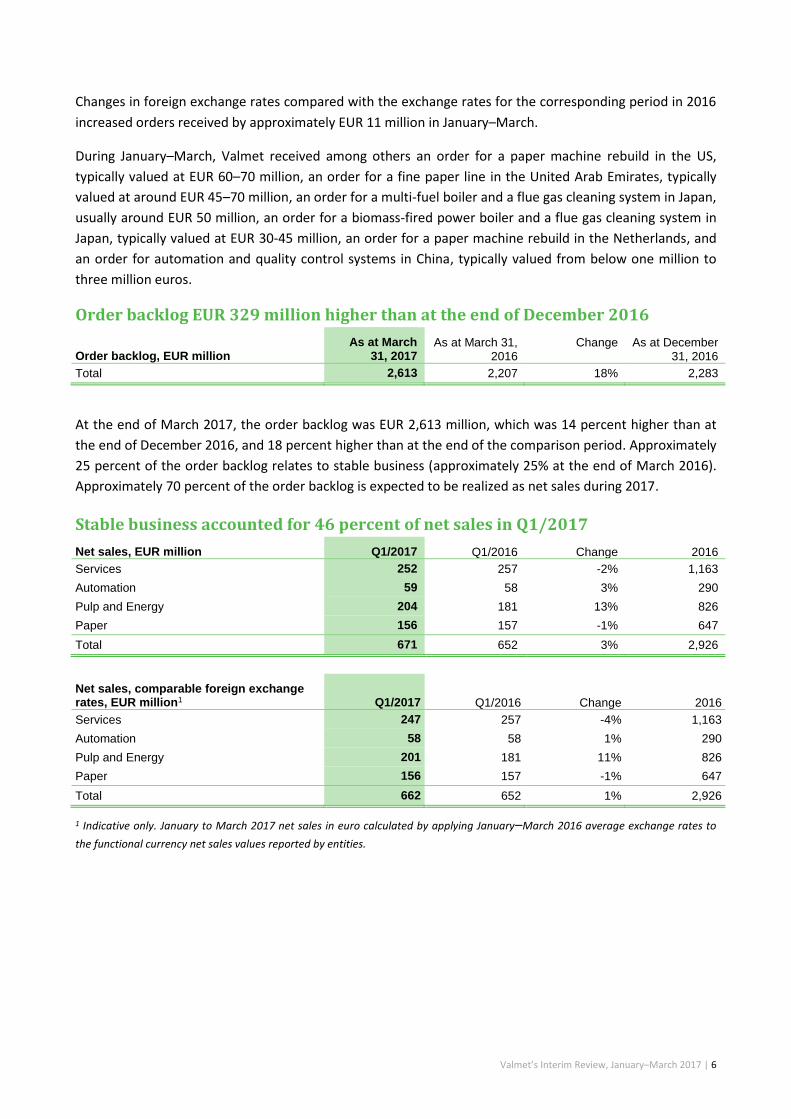
Order backlog EUR 329 million higher than at the end of December 2016
Order backlog, EUR million As at March
31, 2017 As at March 31,
2016 Change As at December
31, 2016
Total 2,613 2,207 18% 2,283
At the end of March 2017, the order backlog was EUR 2,613 million, which was 14 percent higher than at
the end of December 2016, and 18 percent higher than at the end of the comparison period. Approximately
25 percent of the order backlog relates to stable business (approximately 25% at the end of March 2016).
Approximately 70 percent of the order backlog is expected to be realized as net sales during 2017.
Stable business accounted for 46 percent of net sales in Q1/2017
Net sales, EUR million Q1/2017 Q1/2016 Change 2016
Services 252 257 -2% 1,163
Automation 59 58 3% 290
Pulp and Energy 204 181 13% 826
Paper 156 157 -1% 647
Total 671 652 3% 2,926
Net sales, comparable foreign exchange rates, EUR million1 Q1/2017 Q1/2016 Change 2016
Services 247 257 -4% 1,163
Automation 58 58 1% 290
Pulp and Energy 201 181 11% 826
Paper 156 157 -1% 647
Total 662 652 1% 2,926
1 Indicative only. January to March 2017 net sales in euro calculated by applying January–March 2016 average exchange rates to
the functional currency net sales values reported by entities.
Valmet’s Interim Review, January–March 2017 | 7
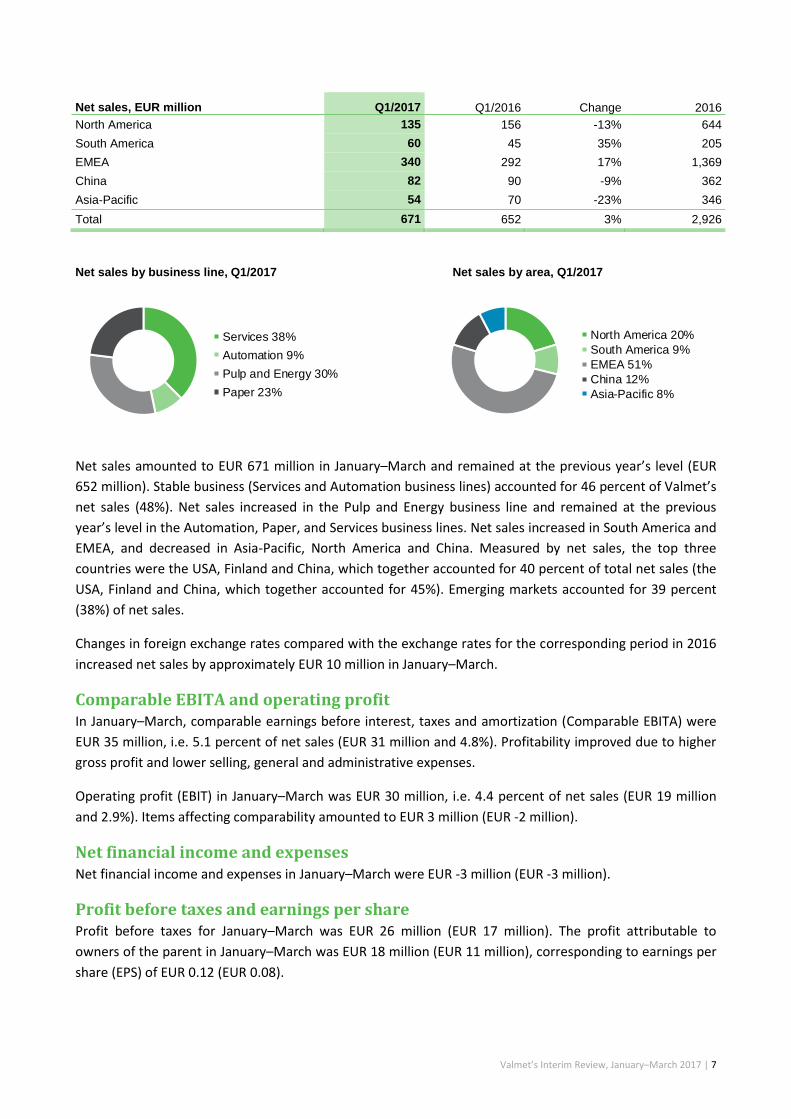
Net sales, EUR million Q1/2017 Q1/2016 Change 2016
North America 135 156 -13% 644
South America 60 45 35% 205
EMEA 340 292 17% 1,369
China 82 90 -9% 362
Asia-Pacific 54 70 -23% 346
Total 671 652 3% 2,926
Net sales by business line, Q1/2017 Net sales by area, Q1/2017
Net sales amounted to EUR 671 million in January–March and remained at the previous year’s level (EUR
652 million). Stable business (Services and Automation business lines) accounted for 46 percent of Valmet’s
net sales (48%). Net sales increased in the Pulp and Energy business line and remained at the previous
year’s level in the Automation, Paper, and Services business lines. Net sales increased in South America and
EMEA, and decreased in Asia-Pacific, North America and China. Measured by net sales, the top three
countries were the USA, Finland and China, which together accounted for 40 percent of total net sales (the
USA, Finland and China, which together accounted for 45%). Emerging markets accounted for 39 percent
(38%) of net sales.
Changes in foreign exchange rates compared with the exchange rates for the corresponding period in 2016
increased net sales by approximately EUR 10 million in January–March.
Comparable EBITA and operating profit In January–March, comparable earnings before interest, taxes and amortization (Comparable EBITA) were
EUR 35 million, i.e. 5.1 percent of net sales (EUR 31 million and 4.8%). Profitability improved due to higher
gross profit and lower selling, general and administrative expenses.
Operating profit (EBIT) in January–March was EUR 30 million, i.e. 4.4 percent of net sales (EUR 19 million
and 2.9%). Items affecting comparability amounted to EUR 3 million (EUR -2 million).
Net financial income and expenses Net financial income and expenses in January–March were EUR -3 million (EUR -3 million).
Profit before taxes and earnings per share Profit before taxes for January–March was EUR 26 million (EUR 17 million). The profit attributable to
owners of the parent in January–March was EUR 18 million (EUR 11 million), corresponding to earnings per
share (EPS) of EUR 0.12 (EUR 0.08).
Services 38%
Automation 9%
Pulp and Energy 30%
Paper 23%
North America 20%
South America 9%
EMEA 51%
China 12%
Asia-Pacific 8%
Valmet’s Interim Review, January–March 2017 | 8
Return on capital employed (ROCE) increased In January–March, the annualized return on capital employed (ROCE) before taxes was 10 percent (7%) and
annualized return on equity (ROE) 8 percent (6%).
Business lines
Services – orders received increased and net sales remained at the previous year’s level
Services business line Q1/2017 Q1/2016 Change 2016
Orders received (EUR million) 355 313 14% 1,182
Net sales (EUR million) 252 257 -2% 1,163
Personnel (end of period) 5,352 5,395 -1% 5,339
In January–March, orders received by the Services business line increased 14 percent to EUR 355 million
(EUR 313 million) and accounted for 35 percent of all orders received (39%). Orders received increased in
China, EMEA, Asia-Pacific and North America and remained at the previous year’s level in South America.
Orders received remained at the previous year’s level in Fabrics and increased in other business units.
In January–March, net sales for the Services business line amounted to EUR 252 million (EUR 257 million),
corresponding to 38 percent of Valmet’s net sales (39%).
Automation – orders received increased and net sales remained at the previous year’s level
Automation business line Q1/2017 Q1/2016 Change 2016
Orders received (EUR million) 72 66 9% 299
Net sales (EUR million) 59 58 3% 290
Personnel (end of period) 1,633 1,619 1% 1,636
In January–March, orders received by the Automation business line increased 9 percent to EUR 72 million
(EUR 66 million) and accounted for 7 percent of all orders received (8%). Orders received increased in South
America and EMEA, remained at the previous year’s level in China and North America and decreased in
Asia-Pacific. Orders received increased in Pulp and Paper and remained at the previous year’s level in
Energy and Process.
In January–March, net sales for the Automation business line amounted to EUR 59 million (EUR 58 million),
corresponding to 9 percent of Valmet’s net sales (9%).
Pulp and Energy – orders received and net sales increased
Pulp and Energy business line Q1/2017 Q1/2016 Change 2016
Orders received (EUR million) 265 238 11% 939
Net sales (EUR million) 204 181 13% 826
Personnel (end of period) 1,697 1,741 -3% 1,689
In January–March, orders received by the Pulp and Energy business line increased 11 percent to
EUR 265 million (EUR 238 million) and accounted for 26 percent of all orders received (30%). Orders
received increased in North America, Asia-Pacific and EMEA and decreased in South America and China.
Orders received increased in Energy and remained at the previous year’s level in Pulp.
Valmet’s Interim Review, January–March 2017 | 9
In January–March, net sales for the Pulp and Energy business line amounted to EUR 204 million
(EUR 181 million), corresponding to 30 percent (28%) of Valmet’s net sales.
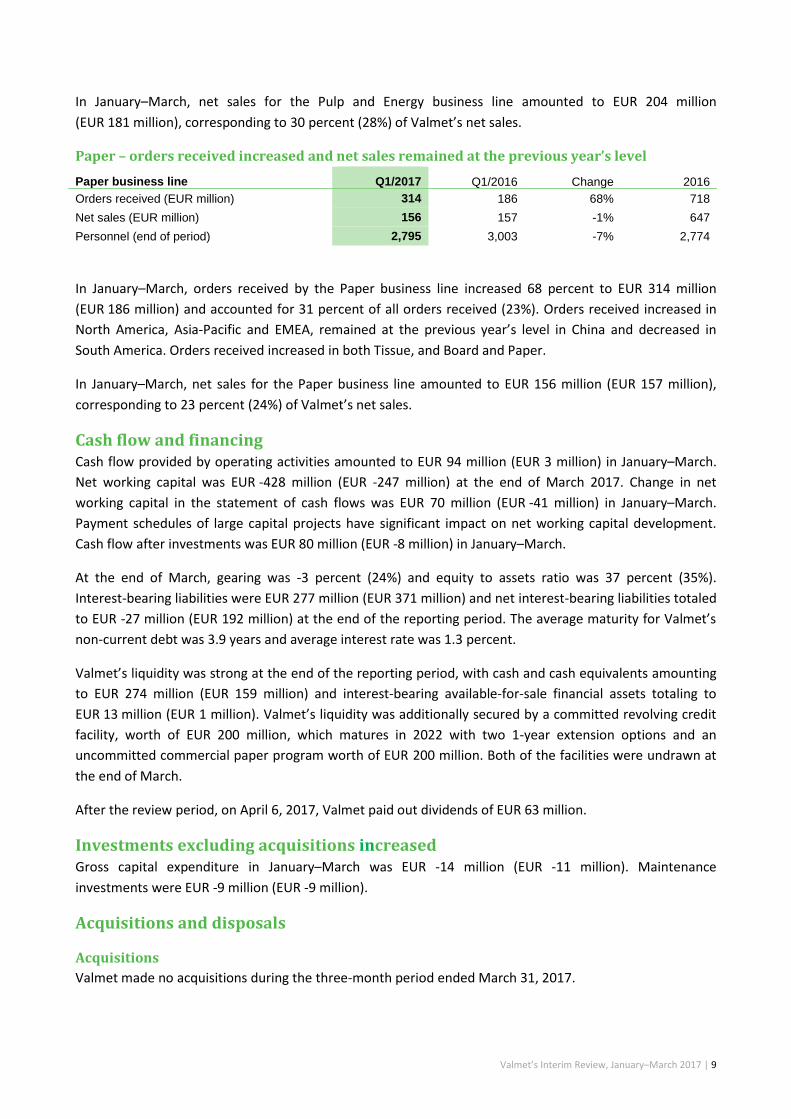
Paper – orders received increased and net sales remained at the previous year’s level
Paper business line Q1/2017 Q1/2016 Change 2016
Orders received (EUR million) 314 186 68% 718
Net sales (EUR million) 156 157 -1% 647
Personnel (end of period) 2,795 3,003 -7% 2,774
In January–March, orders received by the Paper business line increased 68 percent to EUR 314 million
(EUR 186 million) and accounted for 31 percent of all orders received (23%). Orders received increased in
North America, Asia-Pacific and EMEA, remained at the previous year’s level in China and decreased in
South America. Orders received increased in both Tissue, and Board and Paper.
In January–March, net sales for the Paper business line amounted to EUR 156 million (EUR 157 million),
corresponding to 23 percent (24%) of Valmet’s net sales.
Cash flow and financing Cash flow provided by operating activities amounted to EUR 94 million (EUR 3 million) in January–March.
Net working capital was EUR -428 million (EUR -247 million) at the end of March 2017. Change in net
working capital in the statement of cash flows was EUR 70 million (EUR -41 million) in January–March.
Payment schedules of large capital projects have significant impact on net working capital development.
Cash flow after investments was EUR 80 million (EUR -8 million) in January–March.
At the end of March, gearing was -3 percent (24%) and equity to assets ratio was 37 percent (35%).
Interest-bearing liabilities were EUR 277 million (EUR 371 million) and net interest-bearing liabilities totaled
to EUR -27 million (EUR 192 million) at the end of the reporting period. The average maturity for Valmet’s
non-current debt was 3.9 years and average interest rate was 1.3 percent.
Valmet’s liquidity was strong at the end of the reporting period, with cash and cash equivalents amounting
to EUR 274 million (EUR 159 million) and interest-bearing available-for-sale financial assets totaling to
EUR 13 million (EUR 1 million). Valmet’s liquidity was additionally secured by a committed revolving credit
facility, worth of EUR 200 million, which matures in 2022 with two 1-year extension options and an
uncommitted commercial paper program worth of EUR 200 million. Both of the facilities were undrawn at
the end of March.
After the review period, on April 6, 2017, Valmet paid out dividends of EUR 63 million.
Investments excluding acquisitions increased Gross capital expenditure in January–March was EUR -14 million (EUR -11 million). Maintenance
investments were EUR -9 million (EUR -9 million).
Acquisitions and disposals
Acquisitions
Valmet made no acquisitions during the three-month period ended March 31, 2017.
Valmet’s Interim Review, January–March 2017 | 10
Disposals
Valmet made no disposals during the three-month period ended March 31, 2017.
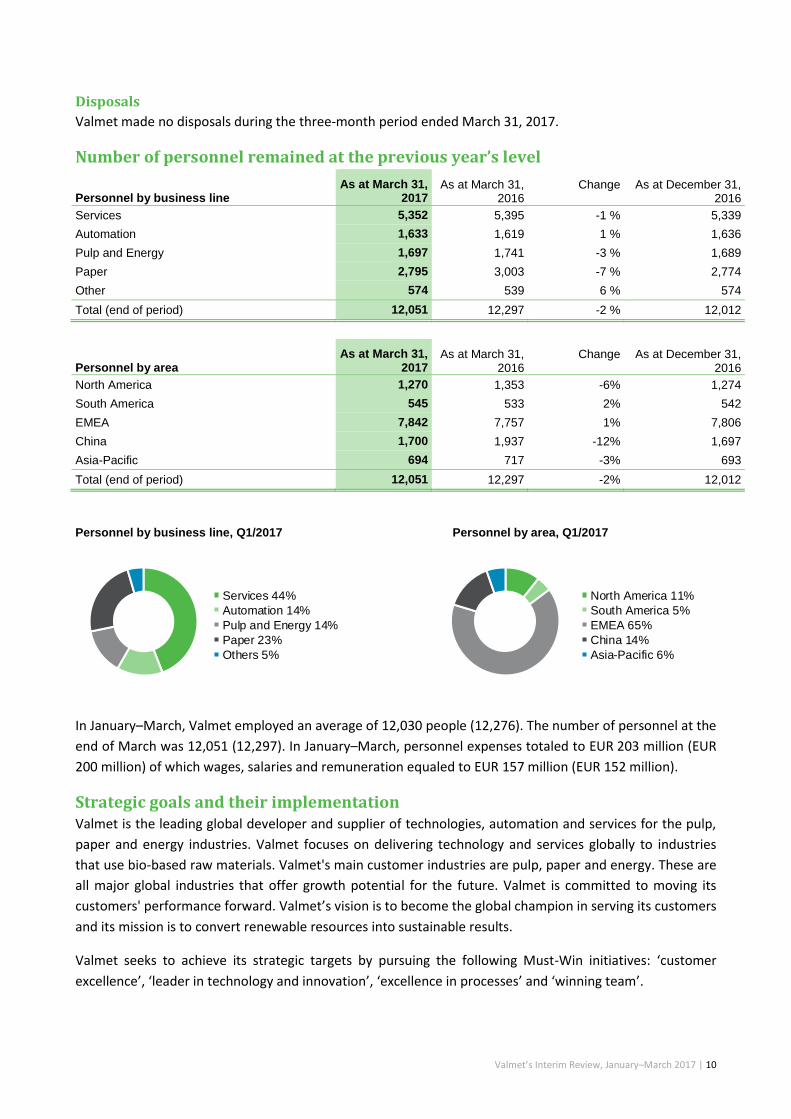
Number of personnel remained at the previous year’s level
Personnel by business line As at March 31,
2017 As at March 31,
2016 Change As at December 31,
2016
Services 5,352 5,395 -1 % 5,339
Automation 1,633 1,619 1 % 1,636
Pulp and Energy 1,697 1,741 -3 % 1,689
Paper 2,795 3,003 -7 % 2,774
Other 574 539 6 % 574
Total (end of period) 12,051 12,297 -2 % 12,012
Personnel by area As at March 31,
2017 As at March 31,
2016 Change As at December 31,
2016
North America 1,270 1,353 -6% 1,274
South America 545 533 2% 542
EMEA 7,842 7,757 1% 7,806
China 1,700 1,937 -12% 1,697
Asia-Pacific 694 717 -3% 693
Total (end of period) 12,051 12,297 -2% 12,012
Personnel by business line, Q1/2017 Personnel by area, Q1/2017
In January–March, Valmet employed an average of 12,030 people (12,276). The number of personnel at the
end of March was 12,051 (12,297). In January–March, personnel expenses totaled to EUR 203 million (EUR
200 million) of which wages, salaries and remuneration equaled to EUR 157 million (EUR 152 million).
Strategic goals and their implementation Valmet is the leading global developer and supplier of technologies, automation and services for the pulp,
paper and energy industries. Valmet focuses on delivering technology and services globally to industries
that use bio-based raw materials. Valmet's main customer industries are pulp, paper and energy. These are
all major global industries that offer growth potential for the future. Valmet is committed to moving its
customers' performance forward. Valmet’s vision is to become the global champion in serving its customers
and its mission is to convert renewable resources into sustainable results.
Valmet seeks to achieve its strategic targets by pursuing the following Must-Win initiatives: ‘customer
excellence’, ‘leader in technology and innovation’, ‘excellence in processes’ and ‘winning team’.
Services 44%
Automation 14%
Pulp and Energy 14%
Paper 23%
Others 5%
North America 11%
South America 5%
EMEA 65%
China 14%
Asia-Pacific 6%
Valmet’s Interim Review, January–March 2017 | 11
Valmet’s product and service portfolio consists of productivity-enhancing services, automation solutions,
plant upgrades and rebuilds, new cost-efficient equipment and solutions for optimizing energy and raw
material usage and technologies increasing the value of our customers' end products.
In order to improve its operational excellence, Valmet is in the process of renewing its ERP system. The aim
is to renew and improve Valmet’s operational capability through process harmonization and
standardization and through renewal and modernization of the ERP platform.
Valmet has an annual strategy process, where, among others, Valmet’s strategy, Must-Wins and financial
targets are reviewed. Valmet’s strategy and higher financial targets were confirmed by the Board of
Directors in June 2016 (Stock exchange release on June 21, 2016). Valmet has the following financial
targets:
Financial targets
Net sales for stable business to grow over two times the market growth
Net sales for capital business to exceed market growth
Comparable EBITA: 8–10%
Comparable return on capital employed (pre-tax), ROCE: 15–20%
Dividend payout at least 50% of net profit
Stable business means Services and Automation business lines. Capital business means Paper, and Pulp and
Energy business lines.
Continued focus on improving profitability Valmet continues to focus on improving profitability through various actions, in e.g. sales process
management, project management and project execution, in procurement and quality, as well as in
technology and R&D.
To improve sales process management, Valmet is focusing on key account management and analyzing the
customers’ share of wallet. Valmet is targeting market share improvement at key customers and adding
focus on sales training. Valmet has also launched ‘Valmet Way to Serve’ – a shift towards more unified and
customer oriented services.
Valmet is continuously improving its project management and project execution by training personnel and
implementing a Valmet-wide project execution model. By focusing on improving project management and
execution, Valmet is targeting to continuously improve gross profit.
Valmet has set a new long-term savings target for procurement. In order to decrease procurement costs,
Valmet is increasingly focusing on design-to-cost and adding supplier involvement through supplier
relationship management. Valmet has also set a new target for quality cost savings and is adding focus on
root cause analysis of quality deviations. Valmet is continuing to adopt the Lean principles and
methodology.
Valmet is constantly focusing on new technologies and R&D in order to improve product cost
competitiveness and performance. Additionally, Valmet is currently modernizing its ERP system, which will,
once implemented, increase efficiency.
Valmet’s Interim Review, January–March 2017 | 12
Progress in sustainability In March, Valmet was included in the Ethibel Sustainability Index Excellence Europe for 2017. The inclusion
in the index further strengthens Valmet’s position as one of the global sustainability leaders. The index
includes the 200 best performing European stock listed companies in the field of corporate social
responsibility (CSR).
In January-March, Valmet progressed with the actions defined in its Sustainability360˚ agenda. Valmet
continued to implement the global processes to ensure that its suppliers operate in a sustainable manner.
In the first quarter, Valmet together with an authorized third party conducted four sustainability audits, all
of which were carried out in China. Valmet has the target to conduct at least 50 supplier sustainability
audits globally every year.
Valmet’s lost time incident frequency (LTIF) for own employees was 2.3 at the end of March (2.8 at the end
of March 2016). Our total recordable incident frequency rate (TRIF) of own employees continued to
decrease and was 5.8 at the end of March (7.7 at the end of March 2016). Valmet continued to implement
a site safety management standard with focus on securing improvements in contractors’ preventive work
regarding safety.
In January 2017, Valmet conducted an employee engagement survey with a global response rate of
87 percent (81%). The survey results show that personnel engagement at Valmet has continued to increase.
The results improved in 93 percent of the questions while the results in 7 percent of the questions
remained stable. Another sign of engagement was the high completion rate, 99 percent, for our Annual
Review discussion process, which covers all white collar employees.
As part of its Annual Report 2016, published on March 1, 2017, Valmet reported on the progress of its
sustainability performance in 2016. Valmet also published a separate GRI Supplement. Valmet’s
sustainability reporting in 2016 follows the Global Reporting Initiative’s (GRI) G4 “in accordance” core
option, with selected indicators assured by an independent third party.
Lawsuits and claims Several lawsuits, claims and disputes based on various grounds are pending against Valmet in various
countries, including product liability lawsuits and claims as well as legal disputes related to Valmet’s
deliveries.
Valmet announced by stock exchange release on September 16, 2016, that Suzano Papel e Celulose S.A. has
filed a request for arbitration against Valmet Celulose, Papel é Energia Ltda, Valmet AB and Valmet
Technologies Oy, subsidiaries of Valmet Oyj, claiming approximately EUR 80 million. The arbitration relates
to separate Equipment Sales Agreements for the Suzano Imperatriz pulp mill project in Brazil. Valmet
disputes the claims brought by Suzano and has also actively pursued claims of its own against Suzano for
breach by Suzano of its obligations under the Agreements.
Valmet announced by stock exchange release on December 22, 2016, that it has received a reassessment
decision from the Finnish tax authority for Valmet Technologies Inc. The reassessment decision is a result of
a tax audit carried out in the company, concerning tax years 2010–2012. During the first quarter 2017
Valmet has paid additional taxes, late payment interests and penalties in total of EUR 19 million related to
the reassessment decision. Valmet considers the Finnish tax authority's decision unfounded and has
appealed of the decision to Board of Adjustment of the Finnish tax authority.
Valmet’s Interim Review, January–March 2017 | 13
Valmet’s management does not expect to the best of its present understanding that the outcome of these
lawsuits, claims and disputes will have a material adverse effect on Valmet in view of the grounds currently
presented for them, provisions made, insurance coverage in force and the extent of Valmet’s total business
activities. Valmet is also a plaintiff in several lawsuits.
Corporate Governance Statement Valmet has prepared a separate Corporate Governance Statement for 2016 which complies with the
recommendations of the Finnish Corporate Governance Code for listed companies. It also covers other
central areas of corporate governance. The statement has been published on Valmet’s website, separately
from the Report by Board of Directors, at www.valmet.com/governance.
Shares and shareholders
Share capital and number of shares
At the end of March 2017, Valmet’s share capital totaled to EUR 100,000,000 and the number of shares was
149,864,619. At the end of March, Valmet held 399 treasury shares and the number of outstanding shares
was 149,864,220.
Treasury shares and Board authorizations
Valmet Oyj’s Annual General Meeting on March 23, 2017 authorized Valmet’s Board of Directors to decide
on the repurchase of company's own shares in one or several tranches. The maximum number of shares to
be repurchased shall be 10,000,000 shares, which corresponds to approximately 6.7 percent of all the
shares in the Company.
Company's own shares may be repurchased otherwise than in proportion to the shareholdings of the
shareholders (directed repurchase). The Company's own shares may be repurchased using the unrestricted
equity of the Company at a price formed on a regulated market on the main list of Nasdaq Helsinki's stock
exchange on the date of the repurchase.
Company's own shares may be repurchased for reasons of developing the Company's capital structure,
financing or carrying out acquisitions, investments or other business transactions, or for the shares to be
used in an incentive scheme. The Board of Directors resolves on all other terms related to the repurchasing
of the Company's own shares.
Valmet Oyj’s Annual General Meeting authorized Valmet’s Board of Directors to decide on the issuance of
shares as well as the issuance of special rights entitling to shares pursuant to Chapter 10(1) of the Finnish
Limited Liability Companies Act in one or several tranches. The issuance of shares may be carried out by
offering new shares or by transferring treasury shares held by Valmet Oyj. Based on this authorisation, the
Board of Directors may decide on a directed share issue in deviation from the shareholders’ pre-emptive
rights and on the granting of special rights subject to the conditions mentioned in the Finnish Limited
Liability Companies Act. The maximum number of new shares which may be issued by the Board of
Directors based on this authorization shall be 15,000,000 shares, which corresponds to approximately 10%
of all the shares in Valmet Oyj. The maximum number of treasury shares which may be issued shall be
10,000,000 shares, which corresponds to approximately 6.7% of all the shares in the Company.
The Board of Directors is furthermore authorised to issue special rights pursuant to Chapter 10(1) of the
Finnish Limited Liability Companies Act entitling their holder to receive new shares or treasury shares for
consideration. The maximum number of shares which may be issued based on the special rights shall be
Valmet’s Interim Review, January–March 2017 | 14
15,000,000 shares, which corresponds to approximately 10% of all the shares in Company. This number of
shares shall be included in the aggregate numbers of shares mentioned in the previous paragraph. The new
shares and treasury shares may be issued for consideration or without consideration.
The Board of Directors of Valmet Oyj was also authorised to resolve on issuing treasury shares to the
Company without consideration. The maximum number of shares which may be issued to Valmet Oyj shall
be 10,000,000 shares when combined with the number of shares repurchased based on an authorisation.
Such number corresponds to approximately 6.7% of all shares in the Company. The treasury shares issued
to the Company shall not be taken into account in the limits pursuant to the preceding paragraphs.
The Board of Directors may resolve on all other terms of the issuance of shares and special rights entitling
to shares pursuant to Chapter 10(1) of the Finnish Limited Liability Companies Act. The Company may use
this authorisation, for example, for reasons of developing the Company’s capital structure, in financing or
carrying out acquisitions, investments or other business transactions, or for the shares to be used in
incentive schemes.
The authorizations shall remain in force until the next Annual General Meeting, and they cancel the Annual
General Meeting’s authorizations of March 23, 2016.
Trading in shares
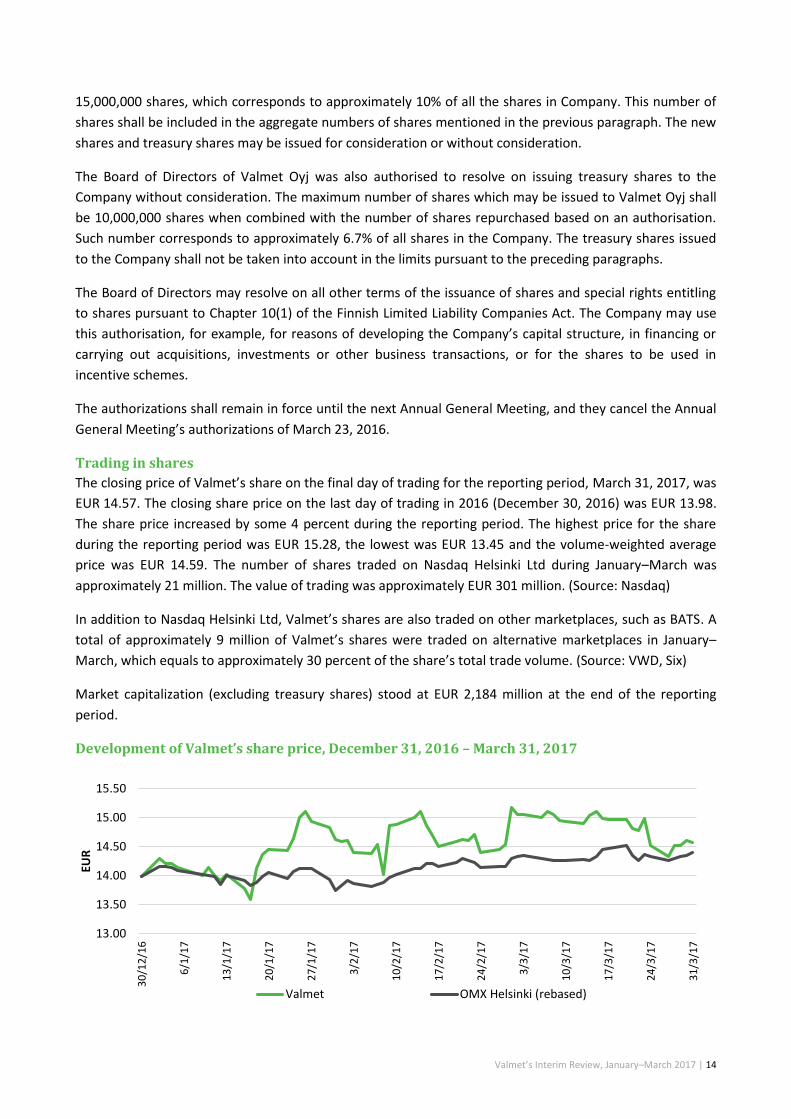
The closing price of Valmet’s share on the final day of trading for the reporting period, March 31, 2017, was
EUR 14.57. The closing share price on the last day of trading in 2016 (December 30, 2016) was EUR 13.98.
The share price increased by some 4 percent during the reporting period. The highest price for the share
during the reporting period was EUR 15.28, the lowest was EUR 13.45 and the volume-weighted average
price was EUR 14.59. The number of shares traded on Nasdaq Helsinki Ltd during January–March was
approximately 21 million. The value of trading was approximately EUR 301 million. (Source: Nasdaq)
In addition to Nasdaq Helsinki Ltd, Valmet’s shares are also traded on other marketplaces, such as BATS. A
total of approximately 9 million of Valmet’s shares were traded on alternative marketplaces in January–
March, which equals to approximately 30 percent of the share’s total trade volume. (Source: VWD, Six)
Market capitalization (excluding treasury shares) stood at EUR 2,184 million at the end of the reporting
period.
Development of Valmet’s share price, December 31, 2016 – March 31, 2017
13.00
13.50
14.00
14.50
15.00
15.50
30
/12
/16
6/1
/17
13
/1/1
7
20
/1/1
7
27
/1/1
7
3/2
/17
10
/2/1
7
17
/2/1
7
24
/2/1
7
3/3
/17
10
/3/1
7
17
/3/1
7
24
/3/1
7
31
/3/1
7
EUR
Valmet OMX Helsinki (rebased)
Valmet’s Interim Review, January–March 2017 | 15
Number of shareholders
The number of registered shareholders at the end of March 2017 was 45,271 (48,254). Shares owned by
nominee-registered and non-Finnish parties equaled to 49.5 percent of the total number of shares at the
end of March 2017 (46.5%).
Flagging notifications
During the review period, Valmet received no flagging notifications.
Share-based incentive plans Valmet’s share-based incentive plans are part of the remuneration and retention program for Valmet’s
management. The aim of the plans is to align the objectives of shareholders and management to increase
the value of the company, commit management to the company, and offer management a competitive
reward plan based on long-term shareholding in Valmet.
Valmet has entered into an agreement with a third-party service provider concerning the administration of
the share-based incentive programs for key personnel. At the end of the reporting period, the number of
shares held within the administration plan was 198,768.
Long-term incentive plan 2012–2014
In December 2011, a share-based incentive plan including three performance periods, which were the
calendar years 2012, 2013 and 2014, was approved. The reward for the 2012 performance period was paid
during 2015 and for the 2013 performance period, the performance criteria were not met and therefore no
rewards were paid for the 2013 performance period. From the performance period 2014 a gross number of
262,980 shares were earned. The reward was paid partly as company shares and partly in cash in March
2017.
Long-term incentive plan 2015–2017
The Board of Directors of Valmet Oyj approved in December 2014 a new share-based incentive plan for
Valmet’s key employees. The Plan includes three discretionary periods, which are the calendar years 2015,
2016 and 2017. The Board of Directors shall decide on the performance criteria and targets in the beginning
of each discretionary period. The Plan is directed to approximately 80 key people.
The reward of the plan from the discretionary period 2015 was based on EBITA % and Services orders
received growth %. The reward was paid partly as company shares and partly in cash in 2016. As part of the
plan, members of Valmet’s Executive Team had the possibility to receive a matching share reward for the
discretionary period 2015 provided that the Executive Team Member owned or acquired Valmet shares up
to a number determined by the Board of Directors by December 31, 2015. The reward paid on the basis of
the discretionary period 2015 corresponded to a total of 540,035 shares, including the matching share
rewards.
The reward of the plan from the discretionary period 2016 was based on Comparable EBITA % and orders
received growth % of the stable business, that is, the Services and Automation business lines. The reward
was paid partly as Valmet shares and partly in cash in March 2017. As part of the share-based incentive
program members of the Valmet Executive Team had the possibility to receive a matching share reward for
the discretionary period 2016 provided that the Executive Team member owned or acquired Valmet shares
up to a number determined by the Board of Directors by December 31, 2016. The reward paid on the basis
Valmet’s Interim Review, January–March 2017 | 16
of the discretionary period 2016 corresponded to a total of 556,049 shares, including the matching share
rewards.
The shares to be transferred as part of the possible reward are obtained in public trading, ensuring that the
incentive plan will not have a diluting effect on Valmet’s share value.
The Board of Directors of Valmet decided in December 2016 to continue the share based incentive program
approved in December 2014 for Valmet's key employees. The potential reward of the program from the
discretionary period 2017 is based on Comparable EBITA % and orders received growth % of the stable
business, that is, the Services and Automation business lines. The potential reward of the plan from the
discretionary period 2017 will be paid partly as Valmet shares and partly in cash in 2018. The rewards to be
paid on the basis of the plan are in total an approximate maximum of 550,000 shares in Valmet.
As part of the share based incentive program, members of the Valmet Executive Team shall have a
possibility to receive a matching share reward for the discretionary period 2017 provided that the Executive
Team member owns or acquires Valmet shares up to a number determined by the Board of Directors by
December 31, 2017.
More information about share-based incentive plans can be found in Valmet’s Corporate Governance
Statement which is available at www.valmet.com/governance.
Resolutions of Valmet’s Annual General Meeting The Annual General Meeting of Valmet Oyj was held in Helsinki on March 23, 2017. The Annual General
Meeting adopted the Financial Statements for 2016 and discharged the members of the Board of Directors
and the President and CEO from liability for the 2016 financial year. The Annual General Meeting approved
the Board of Directors' proposals concerning authorizing the Board to decide on repurchasing company
shares and to resolve on the issuance of shares and the issuance of special rights entitling to shares.
The Annual General Meeting confirmed the number of Board members as seven and appointed Bo Risberg
as Chairman of Valmet Oyj's Board and Jouko Karvinen as Vice Chairman. Eriikka Söderström was appointed
as a new member of the Board. Lone Fønss Schrøder, Rogério Ziviani, Aaro Cantell and Tarja Tyni will
continue as members of the Board. The term of office of the members of the Board of Directors expires at
the end of the next Annual General Meeting.
PricewaterhouseCoopers Oy, authorized public accountants, was appointed as the company's auditor for a
term expiring at the end of the next Annual General Meeting.
Valmet published stock exchange releases on March 23, 2017 concerning the resolutions of the Annual
General Meeting and the composition of the Board of Directors. The stock exchange releases and a
presentation of the Board’s members can be viewed on Valmet’s website at www.valmet.com/agm.
In compliance with the resolution of the Annual General Meeting on March 23, 2017, Valmet paid out
dividends of EUR 63 million for 2016, corresponding to EUR 0.42 per share, on April 6, 2017.
Risks and business uncertainties Valmet’s operations are affected by various strategic, financial, operational and hazard risks. Valmet takes
measures to exploit emerging opportunities and to limit the adverse effects of potential threats. The
assessment of risks related to sustainable development holds an important role in risk management. If such
Valmet’s Interim Review, January–March 2017 | 17
threats materialized, they could have material adverse effects on Valmet’s business, financial situation and
operating result or on the value of shares and other securities.
The objective of Valmet’s risk management is to ensure the implementation of an effective and successful
strategy for achieving both long- and short-term goals. The task of Valmet’s management is to regulate risk
appetite.
In assessing risks, Valmet takes into consideration the probability of the risks and their estimated impact on
net sales and financial results. Valmet’s management estimates that the company’s overall risk level is
currently manageable in proportion to the scope of its operations and the practical measures available for
managing these risks.
Financial uncertainty in the global economy, coupled with fluctuations in exchange rates and tightening
financial market regulations, may have an adverse effect on the availability of financing from banks and
capital markets and could reduce the investment appetite of Valmet’s customers. Valmet estimates that
the high proportion of business derived from stable business (Services and Automation) and the
geographical diversification will reduce the possible negative effects that market uncertainties may have.
If global economic growth weakens, it might have adverse effects on new projects under negotiation or on
projects in the order backlog. Some projects may be postponed, suspended, or canceled. In the case of
long-term delivery projects, initial customer advance payments are typically 10–30 percent of the value of
the project and customers make progress payments as a project is implemented. This significantly
decreases the risks and financing requirements related to Valmet’s projects. Valmet continually assesses its
customers’ creditworthiness and their ability to meet their obligations. As a rule, Valmet does not finance
customer projects. If economic growth slows significantly, the markets for Valmet’s products may shrink,
which may lead to, for example, tougher price competition. Changes and uncertainty in future regulation
and legislation can also critically affect especially the energy business.
Large fluctuations in energy prices can affect the global economy. These fluctuations can also affect Valmet
and its customers, especially in the energy business.
Changes in labor costs and the prices of raw materials and components can affect Valmet’s profitability.
Wage inflation is continuing, but Valmet’s goal is to offset this at least partly through increased productivity
and strict price discipline. It is possible, however, that tough competition in some product categories will
make it difficult to pass on cost increases to product prices. On the other hand, some of Valmet’s customers
are raw material producers and their ability to operate and invest may be enhanced by strengthening
commodity prices and hampered by declining commodity prices.
To ensure a high level of quality in both production and services, it is important to sustain a high level of
competence and talent availability. This includes, for example, maintaining efficient recruitment programs,
utilization of existing talent and sharing knowledge globally.
Through acquisitions Valmet may become exposed to risks associated with new markets and business
environments. The actual acquisition process also includes risks. Other risks associated with acquisitions
include, but are not limited to, integration of the acquired business, increased financial risk exposure,
retention of key personnel and achieving the targets set for the acquired business.
Valmet’s Interim Review, January–March 2017 | 18
Management of project business risks important
An important part of Valmet’s business consists of project business. Pulp business projects in particular are
large, thus project-specific risk management is crucial. Key risks related to projects are project cost
estimation, scheduling, project risk management, quality and performance risks, and materials
management risks. Risk analysis shall, as a minimum, take place for all significant project quotations. The
work concerning threat and opportunity assessment continues during the execution phase of the project.
Risk management is based on careful planning and on continuous, systematic monitoring and evaluation.
Project risks are managed by improving and continuously developing project management processes and
the related systems.
There may be changes in the competitive situation of Valmet’s individual businesses, such as the
emergence of new, cost-effective players in the markets. Valmet can safeguard its market position by
developing its products and services, and through good customer service and a local presence.
Availability of financing crucial
Securing the continuity of Valmet’s operations requires that sufficient funding is available under all
circumstances. Valmet estimates that its liquid cash assets and committed credit limits are sufficient to
secure the company’s immediate liquidity and to ensure the flexibility of financing. The average maturity
for Valmet’s non-current debt is 3.9 years. Loan facilities include customary covenants and Valmet is in
clear compliance with the covenants at the balance sheet date.
Net working capital and capital expenditure levels have a key impact on the adequacy of our financing.
Valmet estimates that the company is well-positioned to keep capital expenditure at the level of total
depreciation.
Of the financial risks that affect Valmet’s profit, currency exchange rate risks are among the most
substantial. Exchange rate changes can affect Valmet’s business, although the wide geographical scope of
the company’s operations reduces the impact of any individual currency. Economic insecurity typically
increases exchange rate fluctuations. Valmet hedges its currency exposures linked to firm delivery and
purchase agreements.
Changes in legislation and the way authorities interpret regulation, for example regarding taxation, can also
have an impact on Valmet’s financials.
At the end of March 2017, Valmet had EUR 623 million (EUR 620 million) of goodwill on its statement of
financial position. Valmet assesses the value of its goodwill for impairment annually or more frequently if
facts and circumstances indicate that a risk of impairment exists. Valmet has not identified any indications
of impairment during the reporting period. The principles used for impairment testing are presented in the
Annual Report.
Events after the reporting period In the context of the claim raised by Suzano Papel e Celulose S.A. (Suzano) against three Valmet legal
entities, on which stock exchange release was announced on September 16, 2016, Helsinki Court of Appeals
gave its decision on April 18, 2017 relating to the injunction on calling the on-demand performance bonds
claimed by Suzano. These bonds had been provided as performance security related to construction of a
green field pulp mill in Imperatriz, Brazil. As a consequence of the decision of Helsinki Court of Appeals, the
Valmet’s Interim Review, January–March 2017 | 19
releasing of the funds is no longer stopped. This event had no impact on Valmet Group’s income statement
or financial position as at March 31, 2017.
Guidance for 2017 On April 12, 2017, Valmet revised upwards its net sales guidance for 2017. According to the revised
guidance, Valmet estimates that net sales in 2017 will increase in comparison with 2016 (EUR 2,926 million)
and Comparable EBITA in 2017 will increase in comparison with 2016 (EUR 196 million).
Short-term outlook
General economic outlook
Global economic activity is picking up with a cyclical recovery in investment, manufacturing, and trade.
World growth is expected to rise from 3.1 percent in 2016 to 3.5 percent in 2017 and 3.6 percent in 2018.
Stronger activity, expectations of more robust global demand, reduced deflationary pressures, and
optimistic financial markets are all upside developments. However, structural impediments to a stronger
recovery and a balance of risks that remains tilted to the downside remain important challenges.
(International Monetary Fund, April 18, 2017)
Short-term market outlook
Valmet estimates that the short-term market outlook has increased to a good level in services (previously
satisfactory level) and decreased to a weak level in pulp (previously satisfactory level).
Valmet reiterates the good short-term market outlook for energy, board and paper, and tissue, and the
satisfactory short-term market outlook for automation.
In Espoo on April 25, 2017
Valmet’s Board of Directors
Unaudited Condensed Consolidated Interim Financial Statements
Valmet’s Interim Review, January–March 2017 | 20
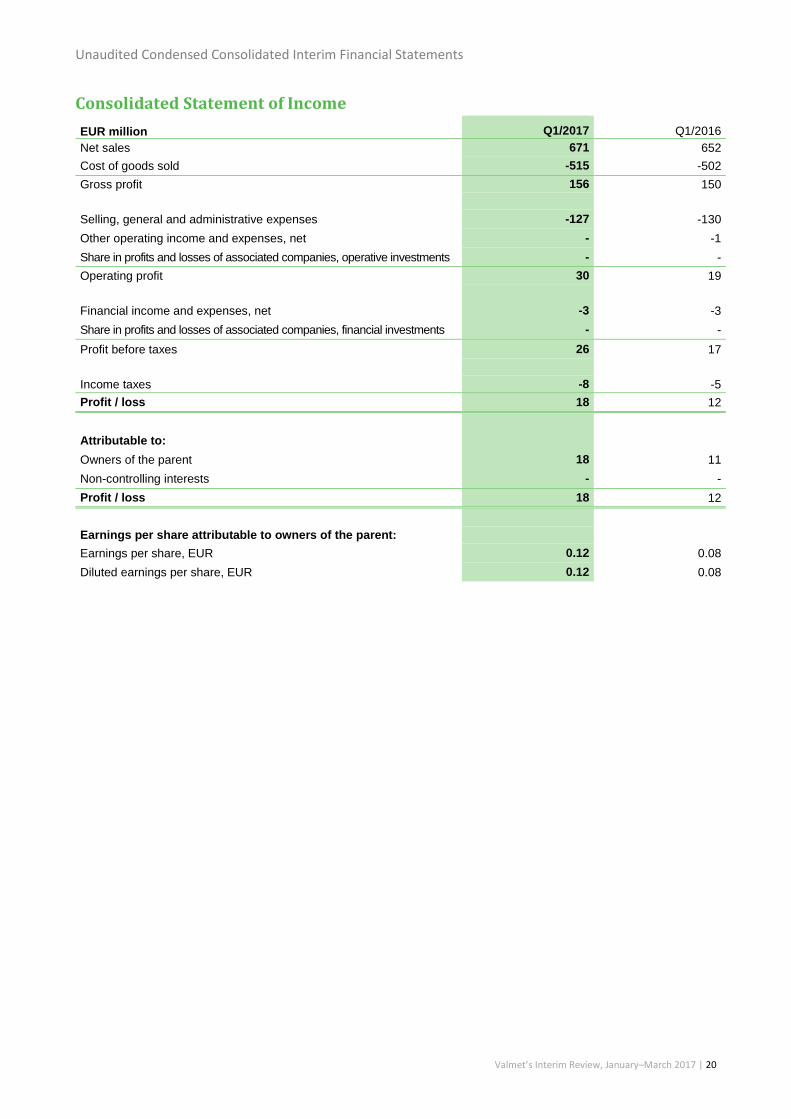
Consolidated Statement of Income
EUR million Q1/2017 Q1/2016
Net sales 671 652
Cost of goods sold -515 -502
Gross profit 156 150
Selling, general and administrative expenses -127 -130
Other operating income and expenses, net - -1
Share in profits and losses of associated companies, operative investments - -
Operating profit 30 19
Financial income and expenses, net -3 -3
Share in profits and losses of associated companies, financial investments - -
Profit before taxes 26 17
Income taxes -8 -5
Profit / loss 18 12
Attributable to:
Owners of the parent 18 11
Non-controlling interests - -
Profit / loss 18 12
Earnings per share attributable to owners of the parent:
Earnings per share, EUR 0.12 0.08
Diluted earnings per share, EUR 0.12 0.08
Unaudited Condensed Consolidated Interim Financial Statements
Valmet’s Interim Review, January–March 2017 | 21
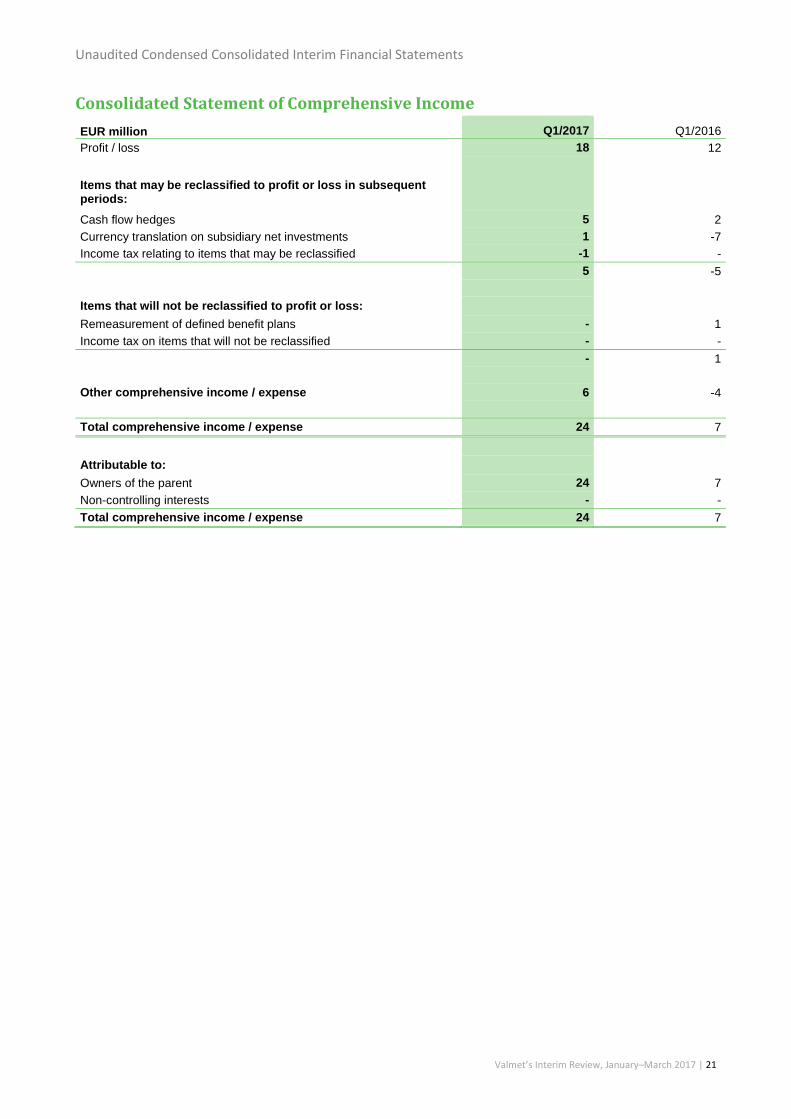
Consolidated Statement of Comprehensive Income
EUR million Q1/2017 Q1/2016
Profit / loss 18 12
Items that may be reclassified to profit or loss in subsequent periods:
Cash flow hedges 5 2
Currency translation on subsidiary net investments 1 -7
Income tax relating to items that may be reclassified -1 -
5 -5
Items that will not be reclassified to profit or loss:
Remeasurement of defined benefit plans - 1
Income tax on items that will not be reclassified - -
- 1
Other comprehensive income / expense 6 -4
Total comprehensive income / expense 24 7
Attributable to:
Owners of the parent 24 7
Non-controlling interests - -
Total comprehensive income / expense 24 7
Unaudited Condensed Consolidated Interim Financial Statements
Valmet’s Interim Review, January–March 2017 | 22
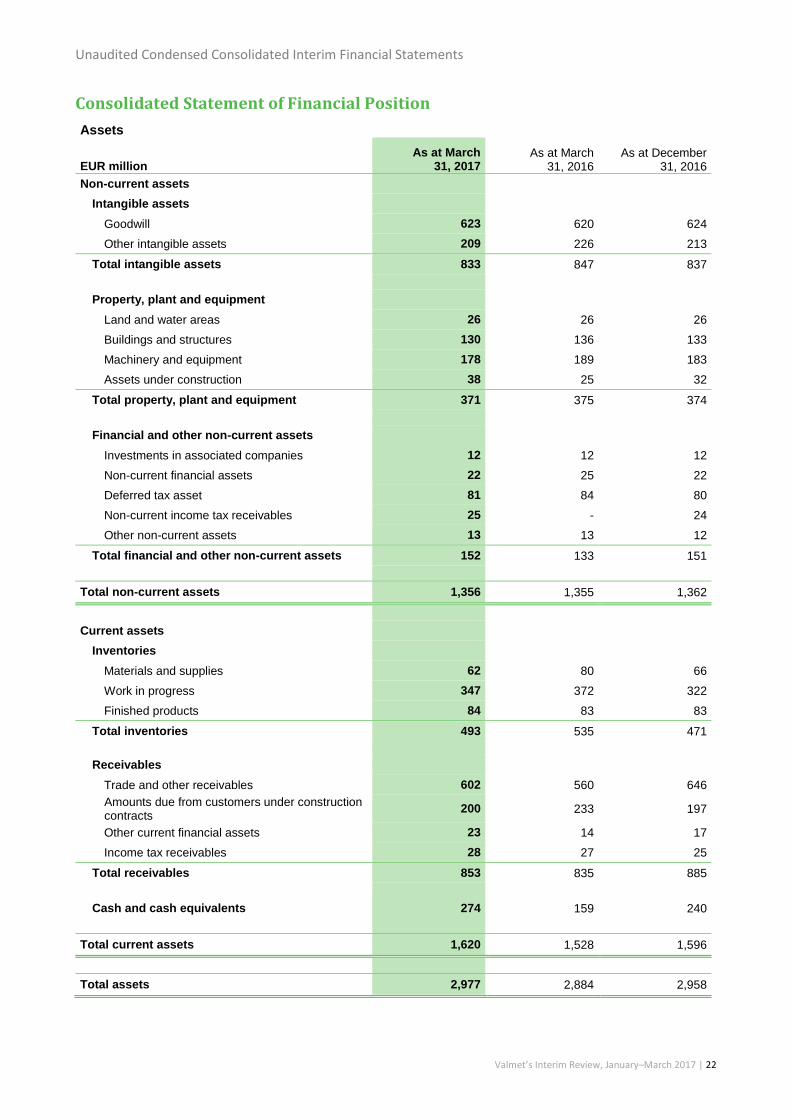
Consolidated Statement of Financial Position
Assets
EUR million As at March
31, 2017 As at March
31, 2016 As at December
31, 2016
Non-current assets
Intangible assets
Goodwill 623 620 624
Other intangible assets 209 226 213
Total intangible assets 833 847 837
Property, plant and equipment
Land and water areas 26 26 26
Buildings and structures 130 136 133
Machinery and equipment 178 189 183
Assets under construction 38 25 32
Total property, plant and equipment 371 375 374
Financial and other non-current assets
Investments in associated companies 12 12 12
Non-current financial assets 22 25 22
Deferred tax asset 81 84 80
Non-current income tax receivables 25 - 24
Other non-current assets 13 13 12
Total financial and other non-current assets 152 133 151
Total non-current assets 1,356 1,355 1,362
Current assets
Inventories
Materials and supplies 62 80 66
Work in progress 347 372 322
Finished products 84 83 83
Total inventories 493 535 471
Receivables
Trade and other receivables 602 560 646
Amounts due from customers under construction contracts
200 233 197
Other current financial assets 23 14 17
Income tax receivables 28 27 25
Total receivables 853 835 885
Cash and cash equivalents 274 159 240
Total current assets 1,620 1,528 1,596
Total assets 2,977 2,884 2,958
Unaudited Condensed Consolidated Interim Financial Statements
Valmet’s Interim Review, January–March 2017 | 23
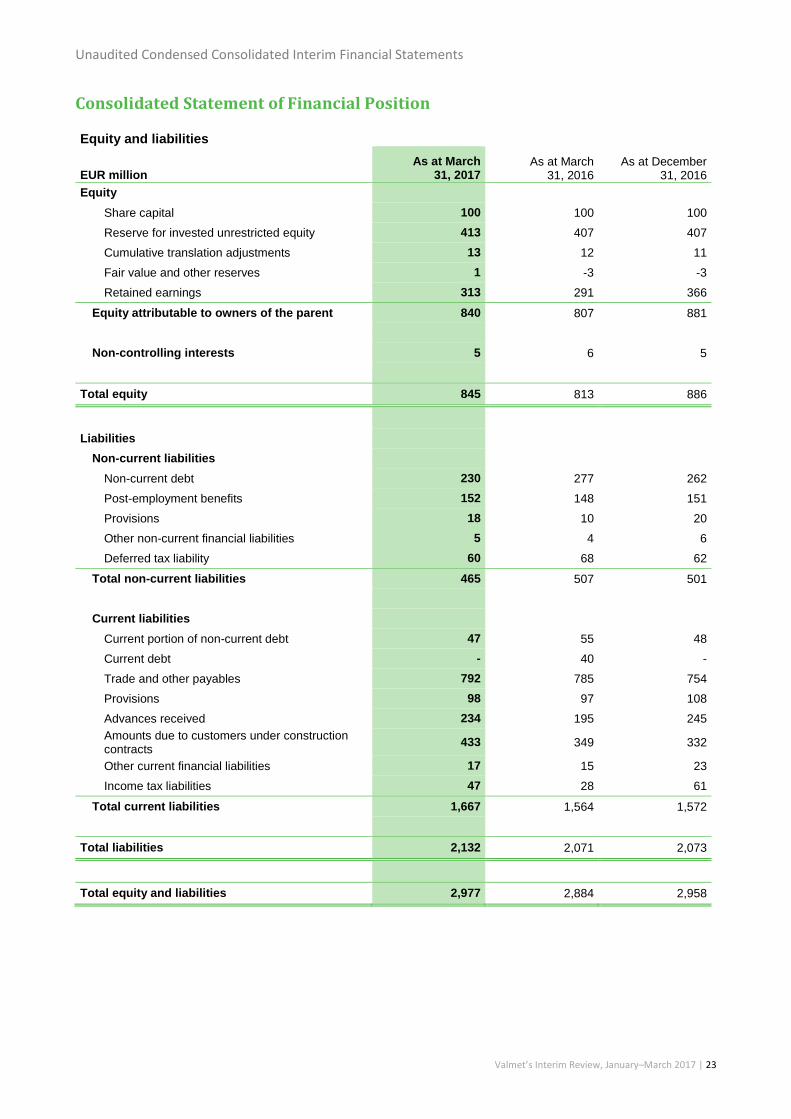
Consolidated Statement of Financial Position Equity and liabilities
EUR million As at March
31, 2017 As at March
31, 2016 As at December
31, 2016
Equity
Share capital 100 100 100
Reserve for invested unrestricted equity 413 407 407
Cumulative translation adjustments 13 12 11
Fair value and other reserves 1 -3 -3
Retained earnings 313 291 366
Equity attributable to owners of the parent 840 807 881
Non-controlling interests 5 6 5
Total equity 845 813 886
Liabilities
Non-current liabilities
Non-current debt 230 277 262
Post-employment benefits 152 148 151
Provisions 18 10 20
Other non-current financial liabilities 5 4 6
Deferred tax liability 60 68 62
Total non-current liabilities 465 507 501
Current liabilities
Current portion of non-current debt 47 55 48
Current debt - 40 -
Trade and other payables 792 785 754
Provisions 98 97 108
Advances received 234 195 245
Amounts due to customers under construction contracts
433 349 332
Other current financial liabilities 17 15 23
Income tax liabilities 47 28 61
Total current liabilities 1,667 1,564 1,572
Total liabilities 2,132 2,071 2,073
Total equity and liabilities 2,977 2,884 2,958
Unaudited Condensed Consolidated Interim Financial Statements
Valmet’s Interim Review, January–March 2017 | 24
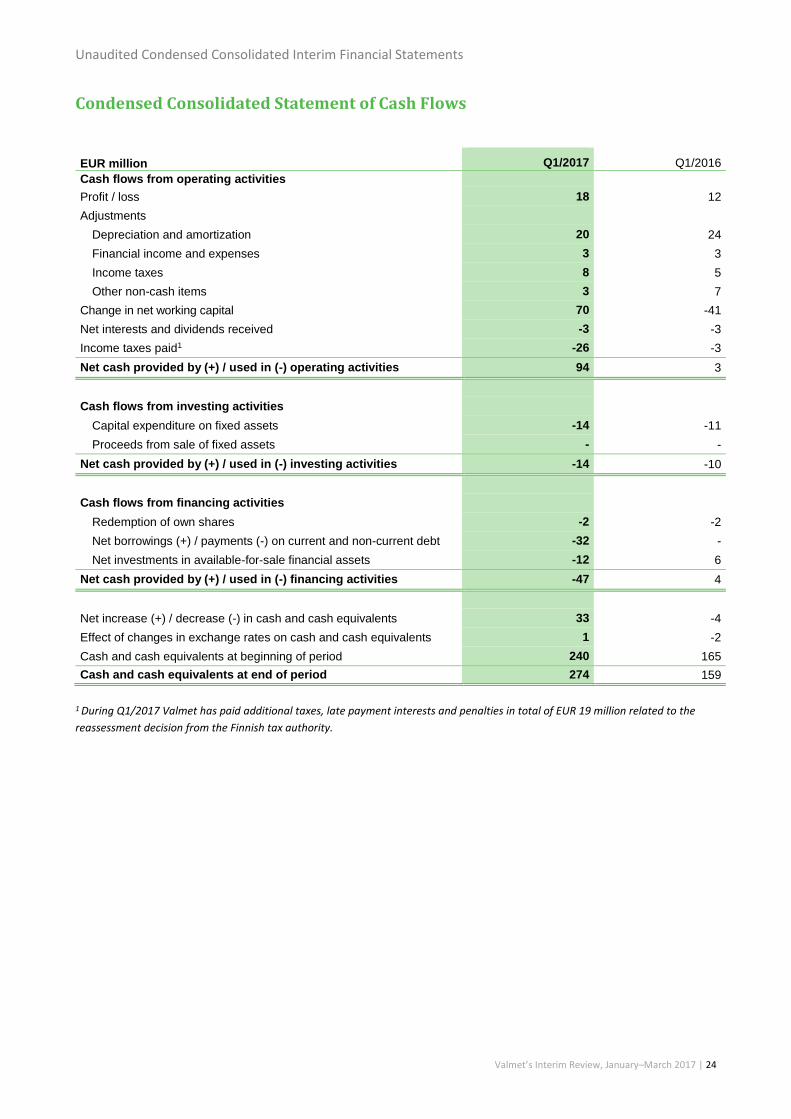
Condensed Consolidated Statement of Cash Flows
EUR million Q1/2017 Q1/2016
Cash flows from operating activities
Profit / loss 18 12
Adjustments
Depreciation and amortization 20 24
Financial income and expenses 3 3
Income taxes 8 5
Other non-cash items 3 7
Change in net working capital 70 -41
Net interests and dividends received -3 -3
Income taxes paid1 -26 -3
Net cash provided by (+) / used in (-) operating activities 94 3
Cash flows from investing activities
Capital expenditure on fixed assets -14 -11
Proceeds from sale of fixed assets - -
Net cash provided by (+) / used in (-) investing activities -14 -10
Cash flows from financing activities
Redemption of own shares -2 -2
Net borrowings (+) / payments (-) on current and non-current debt -32 -
Net investments in available-for-sale financial assets -12 6
Net cash provided by (+) / used in (-) financing activities -47 4
Net increase (+) / decrease (-) in cash and cash equivalents 33 -4
Effect of changes in exchange rates on cash and cash equivalents 1 -2
Cash and cash equivalents at beginning of period 240 165
Cash and cash equivalents at end of period 274 159
1 During Q1/2017 Valmet has paid additional taxes, late payment interests and penalties in total of EUR 19 million related to the
reassessment decision from the Finnish tax authority.
Unaudited Condensed Consolidated Interim Financial Statements
Valmet’s Interim Review, January–March 2017 | 25
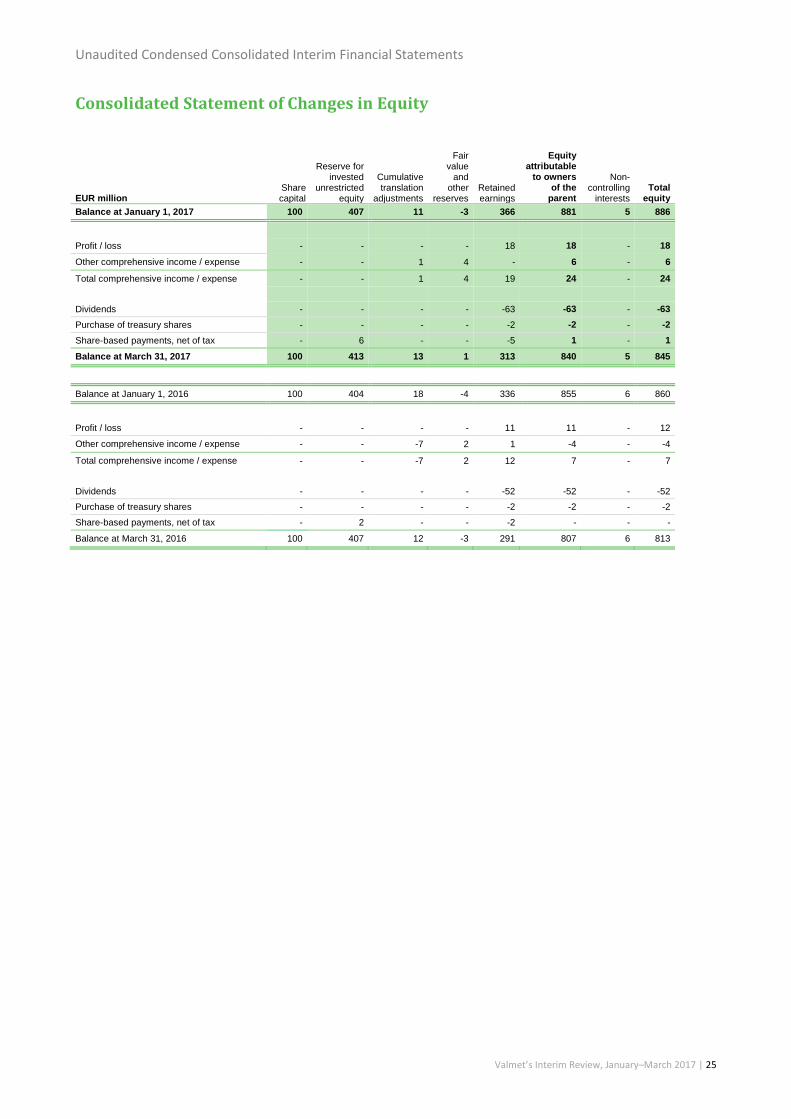
Consolidated Statement of Changes in Equity
EUR million Share capital
Reserve for invested
unrestricted equity
Cumulative translation
adjustments
Fair value
and other
reserves Retained earnings
Equity attributable
to owners of the
parent
Non-controlling
interests Total
equity
Balance at January 1, 2017 100 407 11 -3 366 881 5 886
Profit / loss - - - - 18 18 - 18
Other comprehensive income / expense - - 1 4 - 6 - 6
Total comprehensive income / expense - - 1 4 19 24 - 24
Dividends - - - - -63 -63 - -63
Purchase of treasury shares - - - - -2 -2 - -2
Share-based payments, net of tax - 6 - - -5 1 - 1
Balance at March 31, 2017 100 413 13 1 313 840 5 845
Balance at January 1, 2016 100 404 18 -4 336 855 6 860
Profit / loss - - - - 11 11 - 12
Other comprehensive income / expense - - -7 2 1 -4 - -4
Total comprehensive income / expense - - -7 2 12 7 - 7
Dividends - - - - -52 -52 - -52
Purchase of treasury shares - - - - -2 -2 - -2
Share-based payments, net of tax - 2 - - -2 - - -
Balance at March 31, 2016 100 407 12 -3 291 807 6 813
Unaudited Condensed Consolidated Interim Financial Statements
Valmet’s Interim Review, January–March 2017 | 26
Accounting policies
General information
Valmet Oyj (the “Company” or the “parent company”) and its subsidiaries (together “Valmet”, “Valmet
Group” or the “Group”) form a global developer and supplier of process technologies, automation and
services for the pulp, paper and energy industries.
Valmet Oyj is domiciled in Helsinki, and its registered address is Keilasatama 5, 02150 Espoo, Finland. The
Company’s shares are listed on the Nasdaq Helsinki Ltd.
These Condensed Consolidated Interim Financial Statements were approved for issue on April 25, 2017.
Basis of presentation
These Condensed Consolidated Interim Financial Statements for the three months ended March 31, 2017
have been prepared in accordance with IAS 34, ‘Interim financial reporting’ and in conformity with IFRS as
adopted by the European Union. The financial information presented in these Condensed Consolidated
Interim Financial Statements has not been audited. The Condensed Consolidated Interim Financial
Statements should be read in conjunction with the Group’s Annual Consolidated Financial Statements for
the year ended December 31, 2016, which have been prepared in accordance with IFRS.
Since January 1, 2017 the Group has adopted new standards and interpretations into its accounting and
reporting, including but not limited to, amendments to IAS 12 ‘Income taxes’ and IAS 7 ‘Cash flow
statements’. These amendments did not however, have a material impact on the results or financial
position of Valmet Group or the presentation of the Interim Financial Statements.
Setting aside new pronouncements, the accounting policies applied in the preparation of these Condensed
Consolidated Interim Financial Statements are consistent with those followed in the preparation of the
Group’s Annual Consolidated Financial Statements for the year ended December 31, 2016.
In the Condensed Consolidated Interim Financial Statements the figures are presented in million euros
subject to rounding, which may cause some rounding inaccuracies in aggregate column and row totals.
New accounting standards
Starting January 1, 2018 Valmet will adopt IFRS15, Revenue from contracts with customers. In the
expectation of adopting the new standard governing revenue recognition, Valmet management has
decided to no longer use the milestone method as the preferred method for measuring progress in
contracts where revenue is recognized in proportion to the stage of completion of contract activity. As of
January 1, 2017 the cost-to-cost method is used as Valmet’s primary method for measuring progress of
contract activity. Management estimates that for some contracts this change will defer revenue recognition
in the beginning of the project. This is however, not expected to have a significant impact on the amount of
gross profit recognized in any interim reporting period. Management is in process of preparing a
quantification of the impact of the new standard as at the transition.
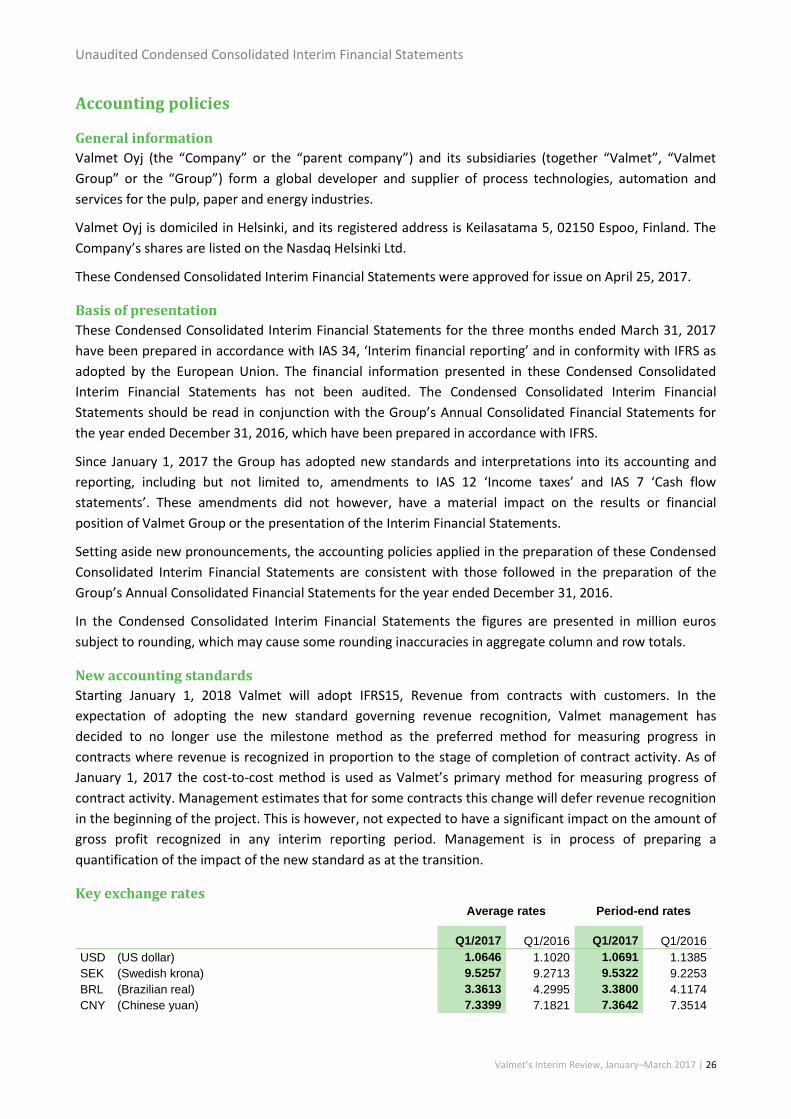
Key exchange rates
Average rates Period-end rates
Q1/2017 Q1/2016 Q1/2017 Q1/2016
USD (US dollar) 1.0646 1.1020 1.0691 1.1385
SEK (Swedish krona) 9.5257 9.2713 9.5322 9.2253
BRL (Brazilian real) 3.3613 4.2995 3.3800 4.1174
CNY (Chinese yuan) 7.3399 7.1821 7.3642 7.3514
Unaudited Condensed Consolidated Interim Financial Statements
Valmet’s Interim Review, January–March 2017 | 27
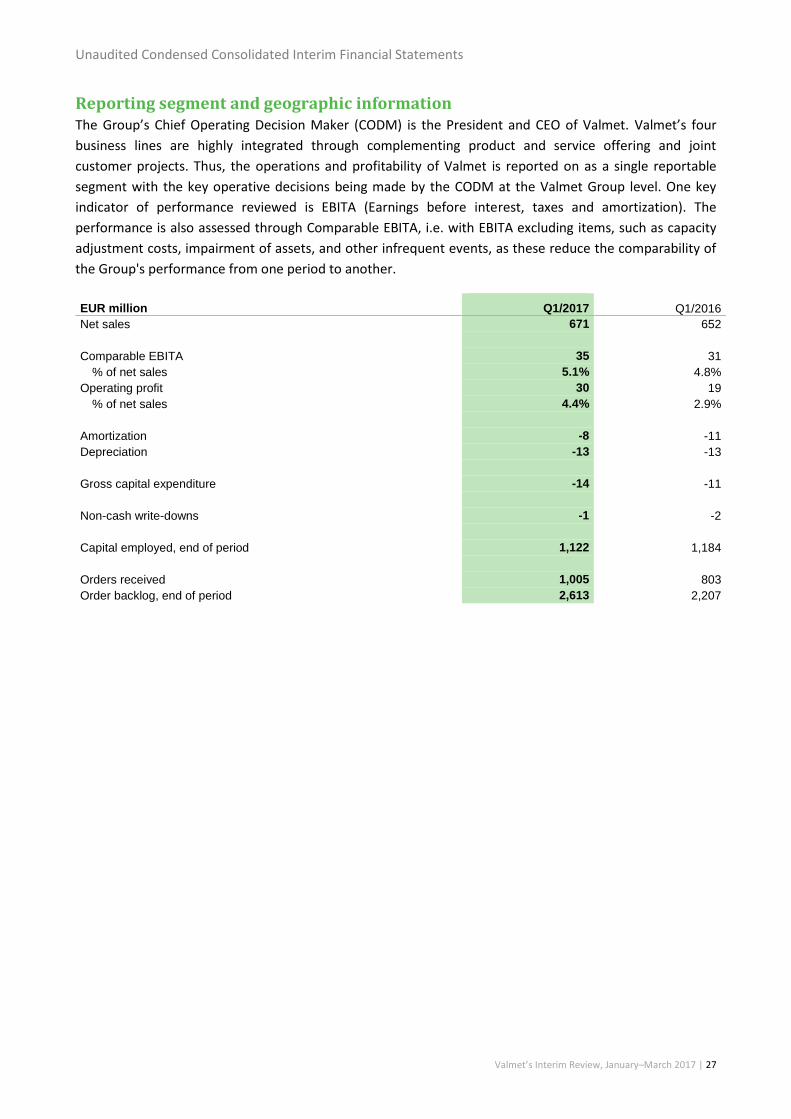
Reporting segment and geographic information The Group’s Chief Operating Decision Maker (CODM) is the President and CEO of Valmet. Valmet’s four
business lines are highly integrated through complementing product and service offering and joint
customer projects. Thus, the operations and profitability of Valmet is reported on as a single reportable
segment with the key operative decisions being made by the CODM at the Valmet Group level. One key
indicator of performance reviewed is EBITA (Earnings before interest, taxes and amortization). The
performance is also assessed through Comparable EBITA, i.e. with EBITA excluding items, such as capacity
adjustment costs, impairment of assets, and other infrequent events, as these reduce the comparability of
the Group's performance from one period to another.
EUR million Q1/2017 Q1/2016
Net sales 671 652
Comparable EBITA 35 31
% of net sales 5.1% 4.8%
Operating profit 30 19
% of net sales 4.4% 2.9%
Amortization -8 -11
Depreciation -13 -13
Gross capital expenditure -14 -11
Non-cash write-downs -1 -2
Capital employed, end of period 1,122 1,184
Orders received 1,005 803
Order backlog, end of period 2,613 2,207
Unaudited Condensed Consolidated Interim Financial Statements
Valmet’s Interim Review, January–March 2017 | 28
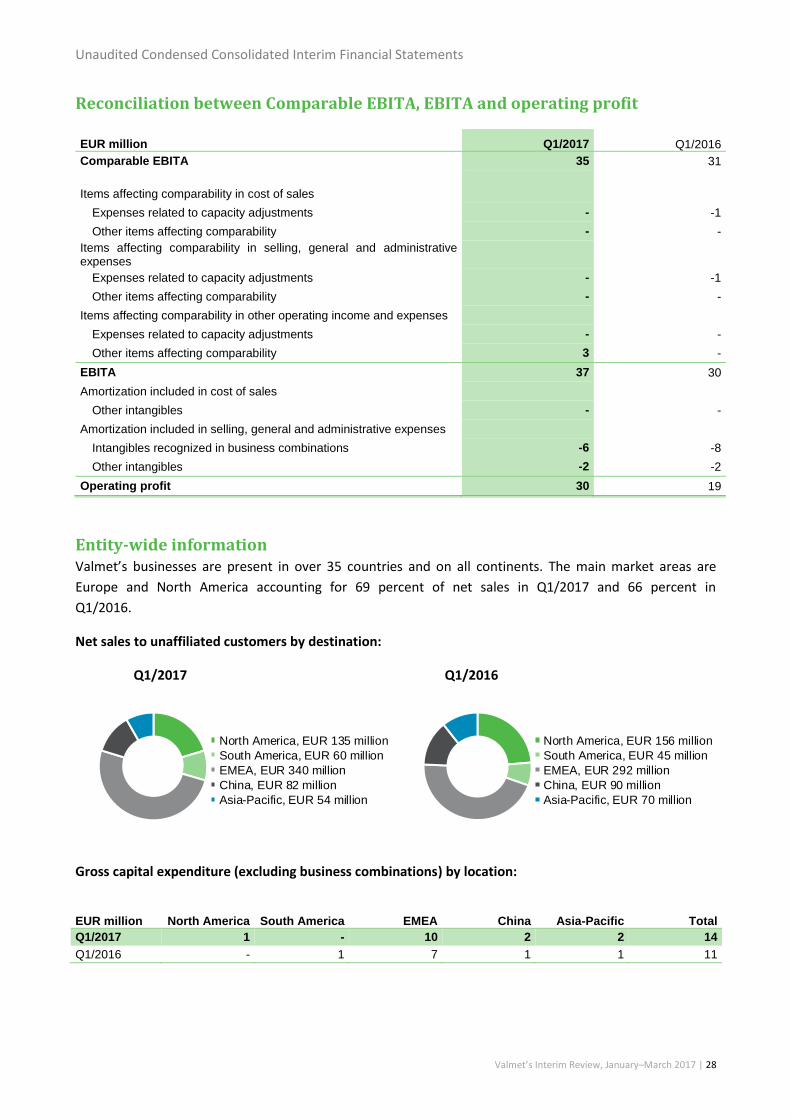
Reconciliation between Comparable EBITA, EBITA and operating profit
EUR million Q1/2017 Q1/2016
Comparable EBITA 35 31
Items affecting comparability in cost of sales
Expenses related to capacity adjustments - -1
Other items affecting comparability - -
Items affecting comparability in selling, general and administrative expenses
Expenses related to capacity adjustments - -1
Other items affecting comparability - -
Items affecting comparability in other operating income and expenses
Expenses related to capacity adjustments - -
Other items affecting comparability 3 -
EBITA 37 30
Amortization included in cost of sales
Other intangibles - -
Amortization included in selling, general and administrative expenses
Intangibles recognized in business combinations -6 -8
Other intangibles -2 -2
Operating profit 30 19
Entity-wide information Valmet’s businesses are present in over 35 countries and on all continents. The main market areas are
Europe and North America accounting for 69 percent of net sales in Q1/2017 and 66 percent in
Q1/2016.
Net sales to unaffiliated customers by destination:
Q1/2017 Q1/2016
Gross capital expenditure (excluding business combinations) by location:
EUR million North America South America EMEA China Asia-Pacific Total
Q1/2017 1 - 10 2 2 14
Q1/2016 - 1 7 1 1 11
North America, EUR 135 million
South America, EUR 60 million
EMEA, EUR 340 million
China, EUR 82 million
Asia-Pacific, EUR 54 million
North America, EUR 156 million
South America, EUR 45 million
EMEA, EUR 292 million
China, EUR 90 million
Asia-Pacific, EUR 70 million
Unaudited Condensed Consolidated Interim Financial Statements
Valmet’s Interim Review, January–March 2017 | 29
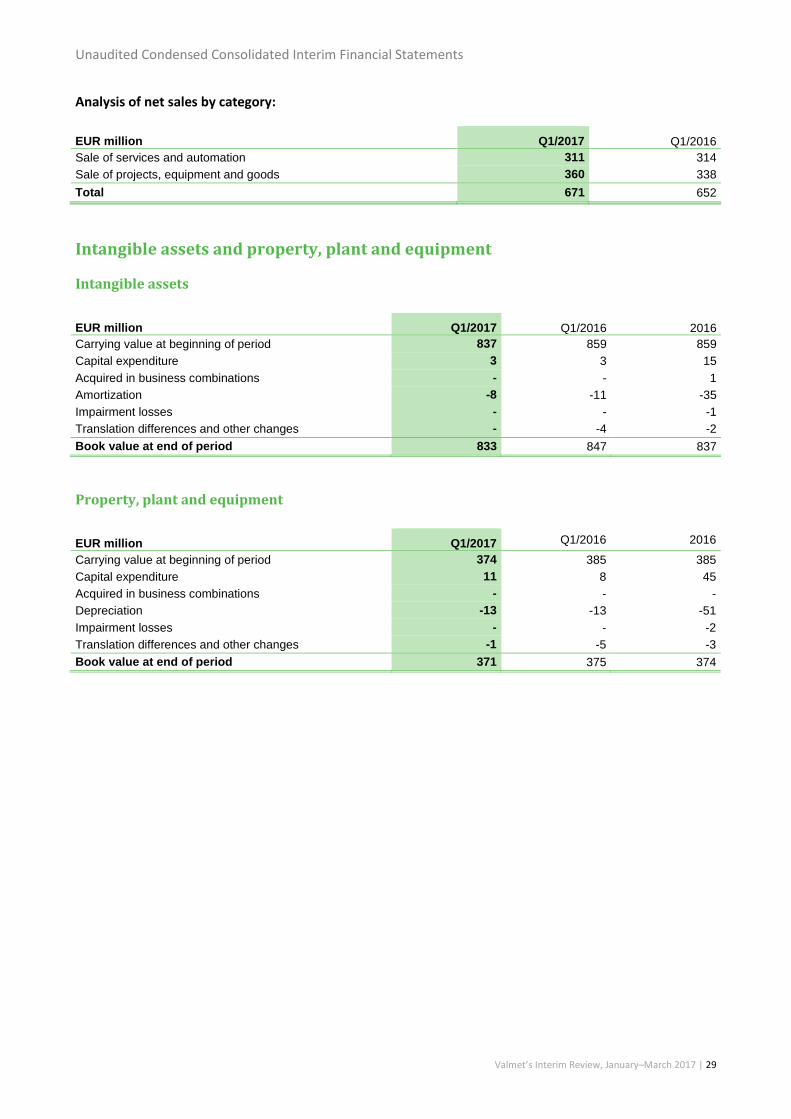
Analysis of net sales by category:
EUR million Q1/2017 Q1/2016
Sale of services and automation 311 314
Sale of projects, equipment and goods 360 338
Total 671 652
Intangible assets and property, plant and equipment
Intangible assets
EUR million Q1/2017 Q1/2016 2016
Carrying value at beginning of period 837 859 859
Capital expenditure 3 3 15
Acquired in business combinations - - 1
Amortization -8 -11 -35
Impairment losses - - -1
Translation differences and other changes - -4 -2
Book value at end of period 833 847 837
Property, plant and equipment
EUR million Q1/2017 Q1/2016 2016
Carrying value at beginning of period 374 385 385
Capital expenditure 11 8 45
Acquired in business combinations - - -
Depreciation -13 -13 -51
Impairment losses - - -2
Translation differences and other changes -1 -5 -3
Book value at end of period 371 375 374
Unaudited Condensed Consolidated Interim Financial Statements
Valmet’s Interim Review, January–March 2017 | 30
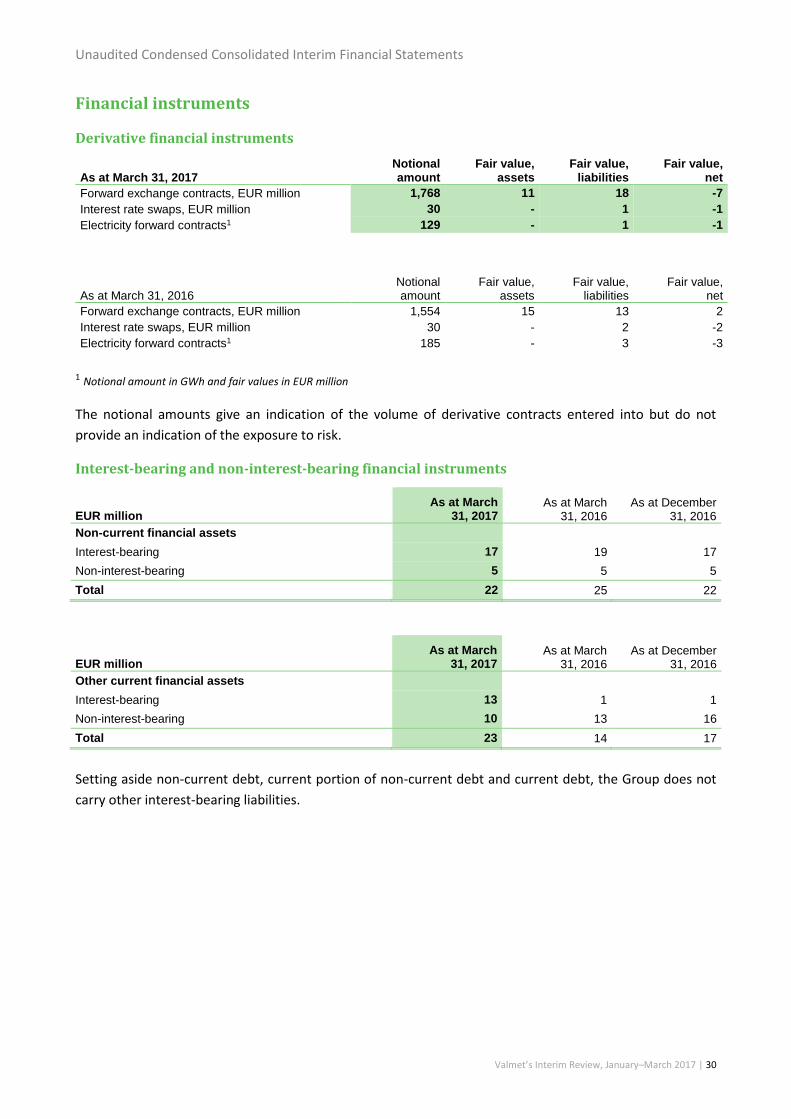
Financial instruments
Derivative financial instruments
As at March 31, 2017
Notional amount
Fair value, assets
Fair value, liabilities
Fair value, net
Forward exchange contracts, EUR million 1,768 11 18 -7
Interest rate swaps, EUR million 30 - 1 -1
Electricity forward contracts1 129 - 1 -1
As at March 31, 2016
Notional amount
Fair value, assets
Fair value, liabilities
Fair value, net
Forward exchange contracts, EUR million 1,554 15 13 2
Interest rate swaps, EUR million 30 - 2 -2
Electricity forward contracts1 185 - 3 -3
1 Notional amount in GWh and fair values in EUR million
The notional amounts give an indication of the volume of derivative contracts entered into but do not
provide an indication of the exposure to risk.
Interest-bearing and non-interest-bearing financial instruments
EUR million As at March
31, 2017 As at March
31, 2016 As at December
31, 2016
Non-current financial assets
Interest-bearing 17 19 17
Non-interest-bearing 5 5 5
Total 22 25 22
EUR million As at March
31, 2017 As at March
31, 2016 As at December
31, 2016
Other current financial assets
Interest-bearing 13 1 1
Non-interest-bearing 10 13 16
Total 23 14 17
Setting aside non-current debt, current portion of non-current debt and current debt, the Group does not
carry other interest-bearing liabilities.
Unaudited Condensed Consolidated Interim Financial Statements
Valmet’s Interim Review, January–March 2017 | 31
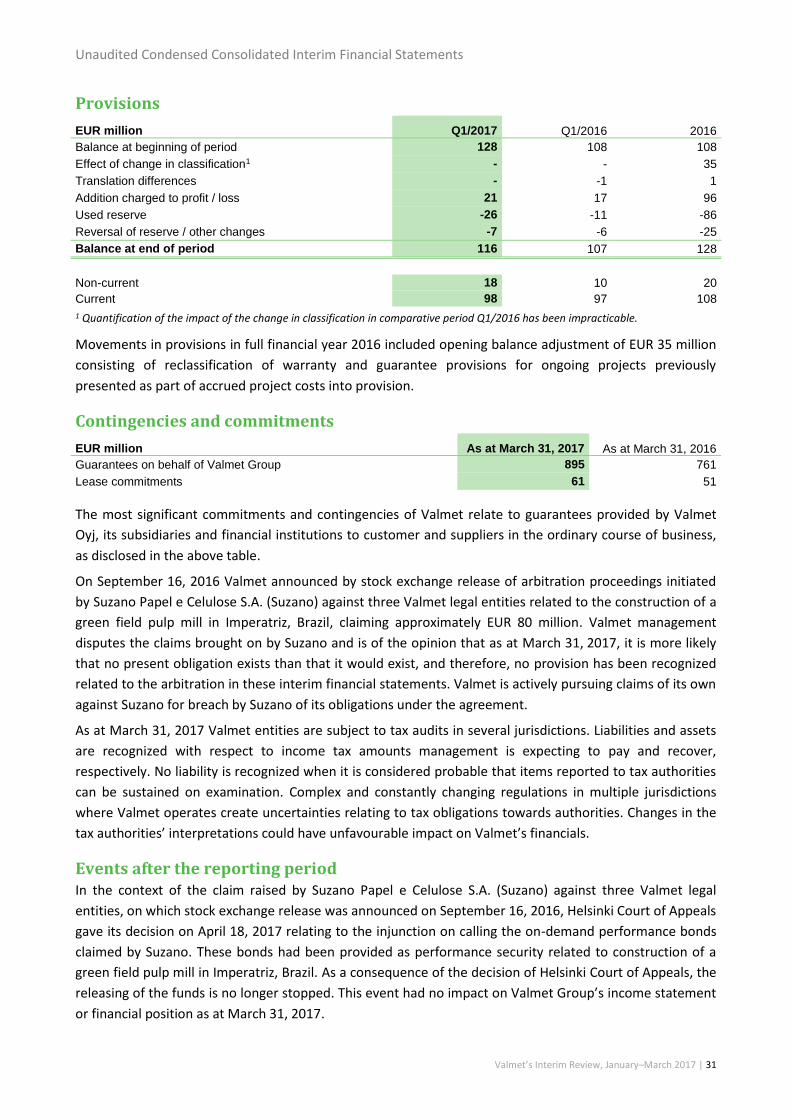
Provisions
EUR million Q1/2017 Q1/2016 2016
Balance at beginning of period 128 108 108
Effect of change in classification1 - - 35
Translation differences - -1 1
Addition charged to profit / loss 21 17 96
Used reserve -26 -11 -86
Reversal of reserve / other changes -7 -6 -25
Balance at end of period 116 107 128
Non-current 18 10 20
Current 98 97 108
1 Quantification of the impact of the change in classification in comparative period Q1/2016 has been impracticable.
Movements in provisions in full financial year 2016 included opening balance adjustment of EUR 35 million
consisting of reclassification of warranty and guarantee provisions for ongoing projects previously
presented as part of accrued project costs into provision.
Contingencies and commitments
EUR million As at March 31, 2017 As at March 31, 2016
Guarantees on behalf of Valmet Group 895 761
Lease commitments 61 51
The most significant commitments and contingencies of Valmet relate to guarantees provided by Valmet
Oyj, its subsidiaries and financial institutions to customer and suppliers in the ordinary course of business,
as disclosed in the above table.
On September 16, 2016 Valmet announced by stock exchange release of arbitration proceedings initiated
by Suzano Papel e Celulose S.A. (Suzano) against three Valmet legal entities related to the construction of a
green field pulp mill in Imperatriz, Brazil, claiming approximately EUR 80 million. Valmet management
disputes the claims brought on by Suzano and is of the opinion that as at March 31, 2017, it is more likely
that no present obligation exists than that it would exist, and therefore, no provision has been recognized
related to the arbitration in these interim financial statements. Valmet is actively pursuing claims of its own
against Suzano for breach by Suzano of its obligations under the agreement.
As at March 31, 2017 Valmet entities are subject to tax audits in several jurisdictions. Liabilities and assets
are recognized with respect to income tax amounts management is expecting to pay and recover,
respectively. No liability is recognized when it is considered probable that items reported to tax authorities
can be sustained on examination. Complex and constantly changing regulations in multiple jurisdictions
where Valmet operates create uncertainties relating to tax obligations towards authorities. Changes in the
tax authorities’ interpretations could have unfavourable impact on Valmet’s financials.
Events after the reporting period In the context of the claim raised by Suzano Papel e Celulose S.A. (Suzano) against three Valmet legal
entities, on which stock exchange release was announced on September 16, 2016, Helsinki Court of Appeals
gave its decision on April 18, 2017 relating to the injunction on calling the on-demand performance bonds
claimed by Suzano. These bonds had been provided as performance security related to construction of a
green field pulp mill in Imperatriz, Brazil. As a consequence of the decision of Helsinki Court of Appeals, the
releasing of the funds is no longer stopped. This event had no impact on Valmet Group’s income statement
or financial position as at March 31, 2017.
Unaudited Condensed Consolidated Interim Financial Statements
Valmet’s Interim Review, January–March 2017 | 32
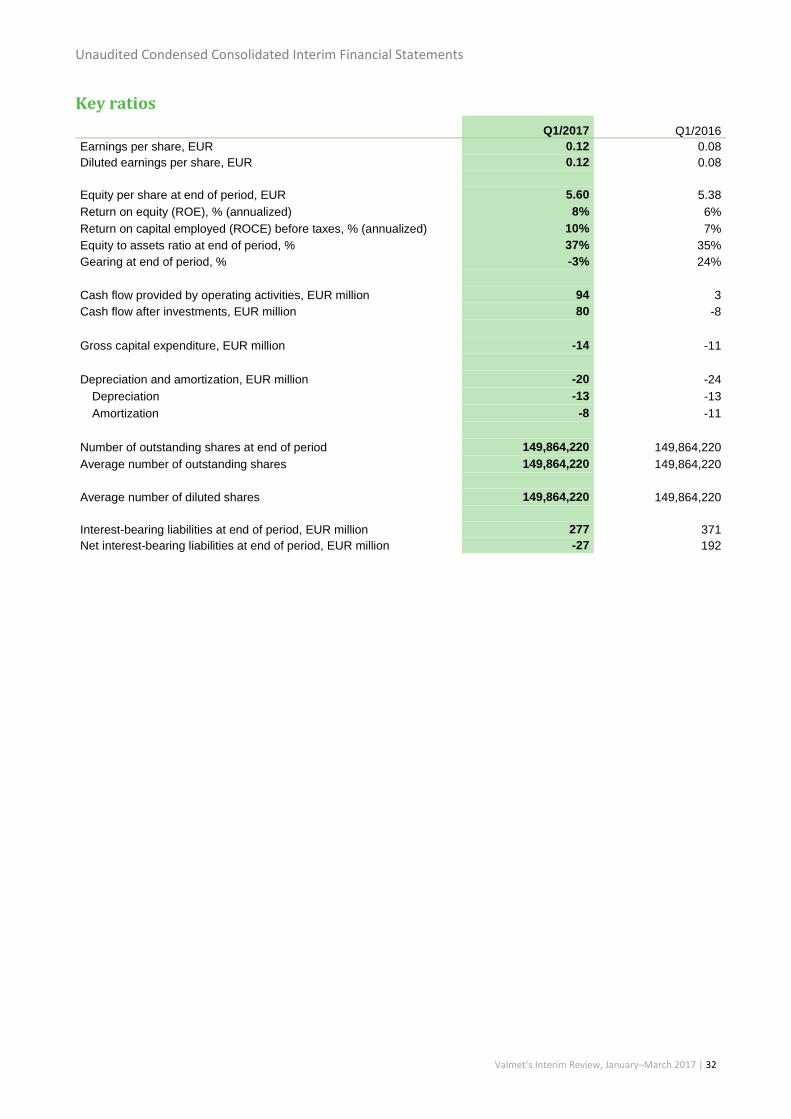
Key ratios
Q1/2017 Q1/2016
Earnings per share, EUR 0.12 0.08
Diluted earnings per share, EUR 0.12 0.08
Equity per share at end of period, EUR 5.60 5.38
Return on equity (ROE), % (annualized) 8% 6%
Return on capital employed (ROCE) before taxes, % (annualized) 10% 7%
Equity to assets ratio at end of period, % 37% 35%
Gearing at end of period, % -3% 24%
Cash flow provided by operating activities, EUR million 94 3
Cash flow after investments, EUR million 80 -8
Gross capital expenditure, EUR million -14 -11
Depreciation and amortization, EUR million -20 -24
Depreciation -13 -13
Amortization -8 -11
Number of outstanding shares at end of period 149,864,220 149,864,220
Average number of outstanding shares 149,864,220 149,864,220
Average number of diluted shares 149,864,220 149,864,220
Interest-bearing liabilities at end of period, EUR million 277 371
Net interest-bearing liabilities at end of period, EUR million -27 192
Unaudited Condensed Consolidated Interim Financial Statements
Valmet’s Interim Review, January–March 2017 | 33
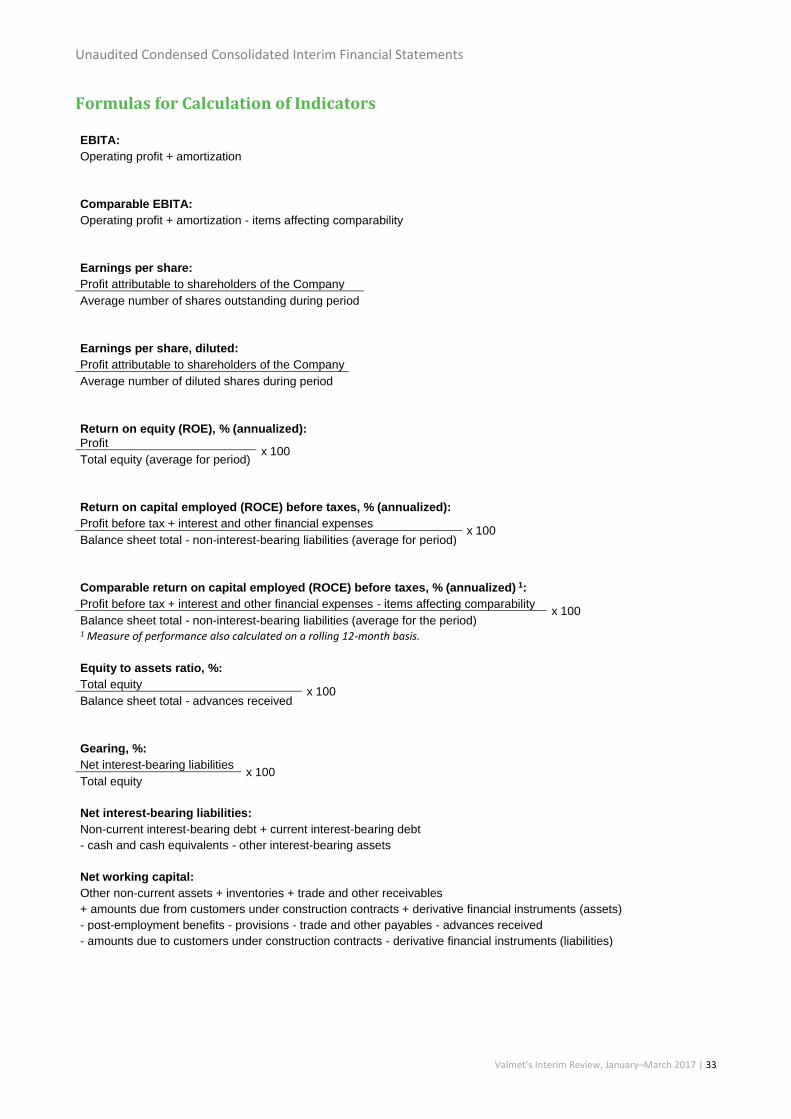
Formulas for Calculation of Indicators
EBITA: Operating profit + amortization
Comparable EBITA: Operating profit + amortization - items affecting comparability
Earnings per share: Profit attributable to shareholders of the Company
Average number of shares outstanding during period
Earnings per share, diluted: Profit attributable to shareholders of the Company
Average number of diluted shares during period
Return on equity (ROE), % (annualized): Profit
x 100 Total equity (average for period)
Return on capital employed (ROCE) before taxes, % (annualized): Profit before tax + interest and other financial expenses
x 100 Balance sheet total - non-interest-bearing liabilities (average for period)
Comparable return on capital employed (ROCE) before taxes, % (annualized) 1:
Profit before tax + interest and other financial expenses - items affecting comparability x 100
Balance sheet total - non-interest-bearing liabilities (average for the period) 1 Measure of performance also calculated on a rolling 12-month basis.
Equity to assets ratio, %: Total equity x 100
Balance sheet total - advances received
Gearing, %: Net interest-bearing liabilities
x 100 Total equity
Net interest-bearing liabilities: Non-current interest-bearing debt + current interest-bearing debt
- cash and cash equivalents - other interest-bearing assets
Net working capital: Other non-current assets + inventories + trade and other receivables
+ amounts due from customers under construction contracts + derivative financial instruments (assets)
- post-employment benefits - provisions - trade and other payables - advances received
- amounts due to customers under construction contracts - derivative financial instruments (liabilities)
Unaudited Condensed Consolidated Interim Financial Statements
Valmet’s Interim Review, January–March 2017 | 34
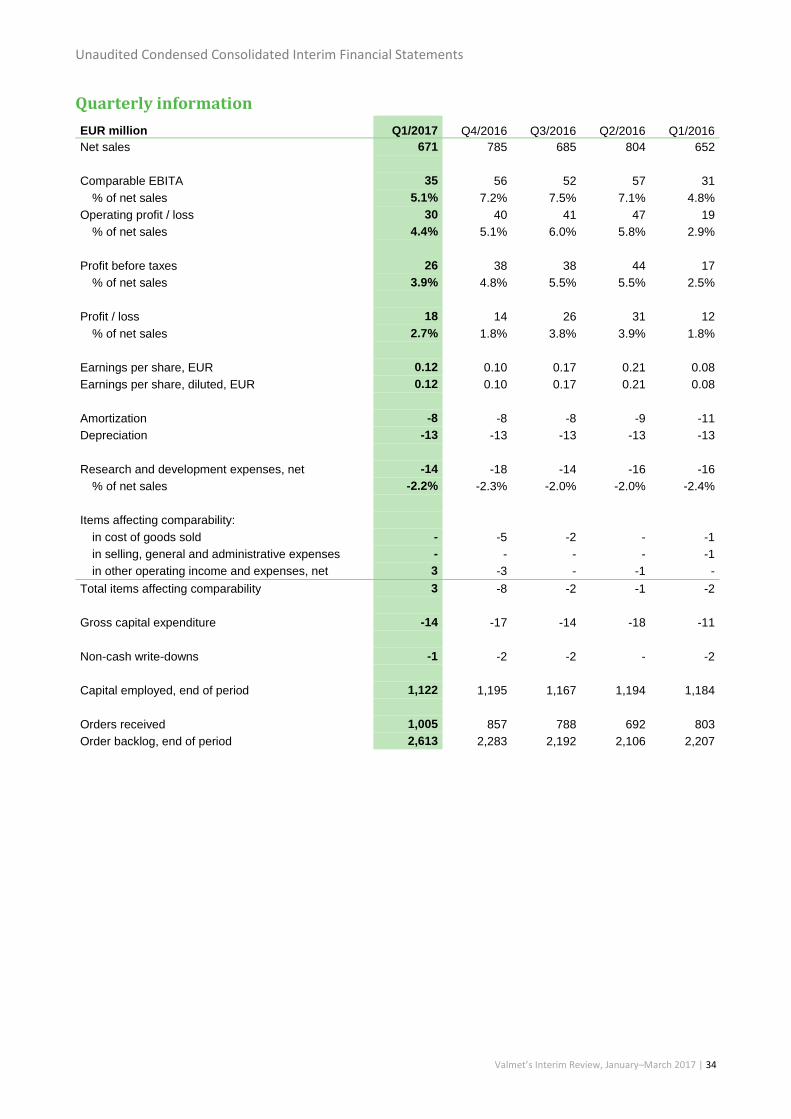
Quarterly information
EUR million Q1/2017 Q4/2016 Q3/2016 Q2/2016 Q1/2016
Net sales 671 785 685 804 652
Comparable EBITA 35 56 52 57 31
% of net sales 5.1% 7.2% 7.5% 7.1% 4.8%
Operating profit / loss 30 40 41 47 19
% of net sales 4.4% 5.1% 6.0% 5.8% 2.9%
Profit before taxes 26 38 38 44 17
% of net sales 3.9% 4.8% 5.5% 5.5% 2.5%
Profit / loss 18 14 26 31 12
% of net sales 2.7% 1.8% 3.8% 3.9% 1.8%
Earnings per share, EUR 0.12 0.10 0.17 0.21 0.08
Earnings per share, diluted, EUR 0.12 0.10 0.17 0.21 0.08
Amortization -8 -8 -8 -9 -11
Depreciation -13 -13 -13 -13 -13
Research and development expenses, net -14 -18 -14 -16 -16
% of net sales -2.2% -2.3% -2.0% -2.0% -2.4%
Items affecting comparability:
in cost of goods sold - -5 -2 - -1
in selling, general and administrative expenses - - - - -1
in other operating income and expenses, net 3 -3 - -1 -
Total items affecting comparability 3 -8 -2 -1 -2
Gross capital expenditure -14 -17 -14 -18 -11
Non-cash write-downs -1 -2 -2 - -2
Capital employed, end of period 1,122 1,195 1,167 1,194 1,184
Orders received 1,005 857 788 692 803
Order backlog, end of period 2,613 2,283 2,192 2,106 2,207
Unaudited Condensed Consolidated Interim Financial Statements
Valmet’s Interim Review, January–March 2017 | 35