fertilizer policies, price, and application in east
TRANSCRIPT

GRIPS Discussion Paper 10GRIPS Discussion Paper 10GRIPS Discussion Paper 10GRIPS Discussion Paper 10----24242424
Fertilizer Policies, Price, and Application Fertilizer Policies, Price, and Application Fertilizer Policies, Price, and Application Fertilizer Policies, Price, and Application
in East Africain East Africain East Africain East Africa
ByByByBy
Takashi Yamano Takashi Yamano Takashi Yamano Takashi Yamano
and and and and
Ayumi AraiAyumi AraiAyumi AraiAyumi Arai
December 2010December 2010December 2010December 2010
National Graduate Institute for Policy Studies
7-22-1 Roppongi, Minato-ku,
Tokyo, Japan 106-8677

GRIPS Policy Research Center Discussion Paper: 10-24
1
Fertilizer Policies, Price, and Application in East Africa
Takashi Yamano1 and Ayumi Arai
2
Abstract
In this chapter, we investigate the determinants of inorganic fertilizer use on major
cereal crops in Kenya, Ethiopia, and Uganda. By using panel data in the three countries,
we estimate the determinants of the fertilizer price and application at the household
level and evaluate the fertilizer policies in each country. The determinants of the DAP
price and application in Kenya can be mostly explained by market forces and
agro-ecological factors, suggesting that market-based policies would be effective. In
Ethiopia, on the other hand, the estimation results indicate that policy related factors
determine the fertilizer price and application. Although the subsidy program in Ethiopia
may contribute to poverty alleviation, technical returns from such programs could be
low. Uganda should learn from the experience from these two neighboring countries.
Keywords: Fertilizer Price, Fertilizer Policy, Kenya, Uganda, Ethiopia
1 Foundation for Advanced Studies on International Development, National Graduate
Institute for Policy Studies, Japan
2 National Graduate Institute for Policy Studies, Japan
Correspondent author, Takashi Yamano, Foundation for Advanced Studies on
International Development, National Graduate Institute for Policy Studies, 7-22-1,
Roppongi, Minato-ku, Tokyo, 106-8677, Japan [email protected]

GRIPS Policy Research Center Discussion Paper: 10-24
2
1. Introduction
While the intensity of the fertilizer use has rapidly increased in other parts of
the world, it has remained at a low level in Sub-Saharan Africa. For instance, while it
has increased from 38 kilograms per ha in 1982 to 101 kilograms per ha in 2002 in
South Asia, it increased only from 7 to 8 kilograms per ha during the same period in
Sub-Saharan Africa. This negligible fertilizer use partly explains lagging agricultural
productivity growth in Sub-Saharan Africa (Morris et al., 2007). Thus, experts and
policy makers agree on the urgent need to increase the use of inorganic fertilizer in the
region. There is less consensus on how to address this issue and currently there are
marked differences in policies and programs pertaining to fertilizer among African
countries.
In the 1970s and early 1980s, many African countries adopted state-led
fertilizer distribution policies where governments were heavily involved in fertilizer
supply schemes via public agencies. During this period, the fertilizer use increased
significantly, along with increased adoption of improved seeds, thereby raising hopes
for some countries to follow the Asian Green Revolution (Eicher, 1995; Byerlee and
Eicher, 1997). However, because of heavy financial burdens to support state-led policies,
such as through subsidies or credit that was written off, many public agencies
accumulated debts over years. As a result, during the following structural adjustment
period in the late 1980s and 1990s, many governments adopted market reform policies,
although the degree of how thoroughly these have been implemented varies from
country to country (Jayne at al., 2003). Therefore the results of the market reform

GRIPS Policy Research Center Discussion Paper: 10-24
3
policies are mixed and controversial, which provides opportunities to draw lessons on
how to increase fertilizer use in the region.
In this chapter, we investigate the determinants of inorganic fertilizer use on
major cereal crops in Kenya, Ethiopia, and Uganda. The fertilizer policies in the three
countries are very different. Kenya is one of a few African countries, if not the only one,
that has thoroughly and successfully implemented fertilizer market reform policy
(Omamo and Mose, 2001; Freeman and Kaguongo, 2003). The Ethiopian government,
on other hand, reversed its market reform policy and has been heavily involved in a
fertilizer credit program in recent years, as will be described in Chapter 4 (and also in
Spielman et al. (2010)). Finally, in Uganda, the fertilizer market has never expanded to
a significant level, and thus its fertilizer policy can only be described as ineffective. By
using the panel data in the three countries, we estimate the determinants of the fertilizer
price and use at the household level and evaluate the fertilizer policies in each country
to draw lessons firstly for these East African countries and secondly for Africa in
general.
This chapter is organized as follows: Section 3.2 describes the current fertilizer
policies and their recent evolution in the three countries. Section 3.3 explains the panel
data used in this chapter. Sections 3.4 and 3.5 present the descriptive analysis and
regression results on the fertilizer application, respectively. Finally, we discuss the
policy implications in Section 3.6.
2. Fertilizer Policies in East Africa

GRIPS Policy Research Center Discussion Paper: 10-24
4
2.1 Kenya
From 1974 to 1984, a state parastatal, the Kenya Farmers Association (later
Kenya Grain Growers Cooperative Union), had significant control over fertilizer
procurement and domestic distribution. As a result, the Kenyan government had
extensive controls over imports, pricing, and marketing of fertilizer using policy
instruments such as price subsidies, price control, licensing of importers and distributors,
and import quotas (Freeman and Kaguongo, 2003). Since the mid 1980s, however, the
government encouraged private firms to enter the market, even though it maintained
tight controls over the market in the beginning (Jayne et al., 2003). Because of
uncertainty about possible government interventions, private firms were reluctant to
enter the fertilizer market. In 1993, the government finally withdrew from the fertilizer
market and abandoned price controls. Freeman and Omiti (2003) conclude that the
market reform has improved farmers’ access to the input through the expansion of
private retail networks. As a result, the number of fertilizer retailers increased roughly
from 5,000 in 1996 to 8,000 in 2000 (Jayne et al., 2003).
There are several reasons for the successful reform of the fertilizer market in
Kenya. First, before the market reform period, the state-led fertilizer policies were
successful in increasing the fertilizer use among smallholders. As a result, many farmers
learned about new technologies that involved high-yielding varieties and inorganic
fertilizer. Second, before and during the market reform period, Kenya had strong cash
crop sectors, which include tea, coffee, and sugarcane, and the sector has maintained a
high and stable level of demand for fertilizer. Thus, fertilizer importers and distributors
in the country were willing to make initial investments in facilities to import and store a

GRIPS Policy Research Center Discussion Paper: 10-24
5
large amount of fertilizer. These investment activities in the facilities have reduced
retail prices of fertilizer for smallholder farmers. Third, farmers who planted cash crops
received fertilizer credit from cooperatives and processing firms to apply fertilizer on
cash crops. By using fertilizer on cash crops, they acquired knowledge on fertilizer and
earned income to buy fertilizer to apply on food crops (Jayne et al., 2004). These factors
have contributed to stable demand for fertilizer even during the transition period from
the state-led fertilizer distribution system to private fertilizer market. Thus, the fertilizer
consumption (in nitrogenous fertilizer) in the country has increased from 45,220 tons in
the 5 year period of 1990-94 to nearly 77,285 tons in the 5 year period of 2003-2007,
which is the latest 5-year period where data are available (FAOSTAT, 2010).1
2.2 Ethiopia
In the early 1990s, Ethiopia reformed its fertilizer policy towards a free
market approach. The Ethiopian government liberalized and demolished the monopoly
on fertilizer importation and distribution held by the parastatal Agricultural Inputs
Supply Corporation (AISCO, then renamed the Agricultural Inputs Supply enterprise,
AISE) (Spielman et al., 2010). The private sector initially responded rapidly, and, as a
result, 67 private wholesalers and 2,300 retailers emerged. However, these private
wholesalers and retailers quickly exited the market and were replaced by “private”
holding companies with strong ties to government through the 1990s. As a result, only
1 We use a 5-year period to examine fertilizer use trends because the fertilizer use
fluctuates significantly year to year in many African countries. This is another sign of
low and unstable demand for fertilizer in these countries.

GRIPS Policy Research Center Discussion Paper: 10-24
6
AISE and two regional holding companies accounted all fertilizer imports and
distribution in 2001 (Jayne et al., 2003). Since 2007, fertilizer imports have been
controlled by AISE and cooperatives. Regional governments in Ethiopia have also
intervened in fertilizer supply, initiating a 100 percent credit guarantee scheme on
farmers’ fertilizer purchase since 1994 (Spielman et al., 2010). Currently, it is said that
about 90 percent of fertilizer is delivered on credit at below-market interest or even at
zero interest, resulting in a steady increase in the total fertilizer consumption in the
country. In fact, the total consumption (of nitrogenous fertilizer) had increased from
49,996 tons in the 5-year period of 1993-1997 to 78,443 tons in the 5-year period of
1998-2002, although it has since declined to 31,861 tons in the next 5-year period of
2003-2007 because of high international fertilizer prices and budget shortages
(FAOSTAT, 2010).
Thus, the state-led policies appear successful until recent years in increasing
fertilizer use in Ethiopia. Some concerns about the state-led policies, however, have
been raised by experts. First, it is not clear how long the government can sustain
expensive fertilizer credit programs. Second, the state-led policies have crowded out the
private firms from the fertilizer market (Jayne et al., 2003), so that it is not clear
whether a market based system could have performed as well or better than the state.
Third, the increased fertilizer use coupled with the use of improved seeds has not
necessarily achieved high technical efficiency and profits in Ethiopia, as found in
Spielman et al. (2010) and Chapter 4 in this book. Spielman et al. (2010) argue that the
low technical efficiency is largely due to the application of standard packages to vastly
diverse environments, thereby resulting in non-optimal use of these packages by many

GRIPS Policy Research Center Discussion Paper: 10-24
7
farmers. Furthermore, state-dominated inputs supply and credit systems failed to deal
with the timeliness and quality of input supply. A study cited in Spilman et al. (2010),
finds that half of sample farmers surveyed reported that fertilizer arrived after planting,
32 percent reported under-weight bags, and 25 percent complained of poor quality.2 In
short, the Ethiopian government has failed to establish an efficient fertilizer distribution
system, in contrast to the Kenyan government.
2.3. Uganda
Uganda has taken a completely different path from the two countries discussed
above. When the other two governments were heavily involved in the fertilizer
distribution in the 1970s and the early 1980s, the Ugandan government was deeply
involved in civil conflicts and unable to implement any meaningful agricultural policies.
By the time the Museveni government took over in 1986, the structural adjustment
programs had started in other African countries, and the Uganda government quickly
adopted such policies. Indeed, the Ugandan government was considered as a leading
example of market reform policies for other countries to follow. However without a
basic market structure to build upon, the scale of fertilizer market has never been large
enough to capture any scale economies. Omamo (2003) found that the fertilizer market
structure was dominated by small-scale trade, high prices, and low net margins in the
early 2000s. This is likely due to the poor transportation infrastructure and the country’s
remoteness from the major ports. There is no sign of expansion of the fertilizer market
2 There is also a speculation that the Ethiopian government uses the fertilizer and credit
subsidies to maintain political power over regional governments.

GRIPS Policy Research Center Discussion Paper: 10-24
8
for decades. The total fertilizer consumption (in nitrogen fertilizer) remains at a low
level: the 5-year average in Uganda is only 3,842 tons, which is about 5 percent of the
Kenyan fertilizer consumption and 12 percent of the Ethiopian fertilizer consumption
(FAOSTAT, 2010). The fertilizer policy debate in Uganda has been centered around the
question of whether Uganda should follow the pathway of Kenya or rather the one of
Ethiopia.
3. Data and Descriptive Analyses
3.1 Data and fertilizer use
The data used in this chapter come from household surveys in Kenya, Ethiopia,
and Uganda collected as part of the Research on Poverty and Environment and
Agricultural Technology (RePEAT) Project (see Chapter 2 for details). All of the
RePEAT surveys employ similar questionnaires designed to be comparable, especially
on agricultural production. The surveys in Kenya were conducted in 2004 and 2007 and
cover 899 and 777 households, respectively. The second wave of the Kenya survey
re-visited all of the first wave sample households, except in Eastern Province. This is
why the total sample size in the second wave is significantly smaller than the first wave.
The surveys in Ethiopia were conducted in 2004 and 2006. The sample size is 417 in
2004, and 411 households out of the 417 households were re-interviewed in 2006. The
surveys in Uganda covered 940 households in 2003 and 936 households in 2005.
GRIPS Policy Research Center Discussion Paper: 10-24
9
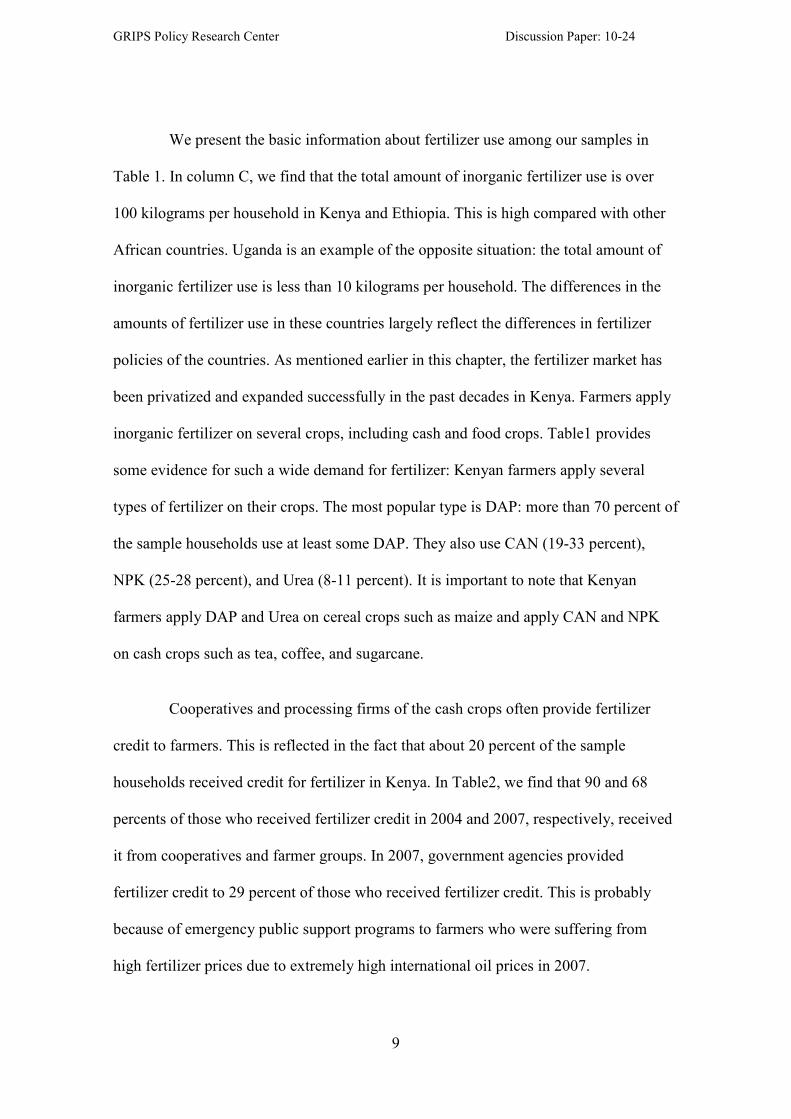
We present the basic information about fertilizer use among our samples in
Table 1. In column C, we find that the total amount of inorganic fertilizer use is over
100 kilograms per household in Kenya and Ethiopia. This is high compared with other
African countries. Uganda is an example of the opposite situation: the total amount of
inorganic fertilizer use is less than 10 kilograms per household. The differences in the
amounts of fertilizer use in these countries largely reflect the differences in fertilizer
policies of the countries. As mentioned earlier in this chapter, the fertilizer market has
been privatized and expanded successfully in the past decades in Kenya. Farmers apply
inorganic fertilizer on several crops, including cash and food crops. Table1 provides
some evidence for such a wide demand for fertilizer: Kenyan farmers apply several
types of fertilizer on their crops. The most popular type is DAP: more than 70 percent of
the sample households use at least some DAP. They also use CAN (19-33 percent),
NPK (25-28 percent), and Urea (8-11 percent). It is important to note that Kenyan
farmers apply DAP and Urea on cereal crops such as maize and apply CAN and NPK
on cash crops such as tea, coffee, and sugarcane.
Cooperatives and processing firms of the cash crops often provide fertilizer
credit to farmers. This is reflected in the fact that about 20 percent of the sample
households received credit for fertilizer in Kenya. In Table2, we find that 90 and 68
percents of those who received fertilizer credit in 2004 and 2007, respectively, received
it from cooperatives and farmer groups. In 2007, government agencies provided
fertilizer credit to 29 percent of those who received fertilizer credit. This is probably
because of emergency public support programs to farmers who were suffering from
high fertilizer prices due to extremely high international oil prices in 2007.

GRIPS Policy Research Center Discussion Paper: 10-24
10
In contrast to the Kenyan situation, in Ethiopia, farmers use only DAP and
Urea, the two types of fertilizers that are heavily subsidized. About 70 percent of the
sample households in Ethiopia use DAP. The corresponding percentage for Urea is 71
and 43 percent in 2004 and 2006, respectively. In column H of Table1, we find that 44
and 64 percent of the sample households in Ethiopia received credit in 2004 and 2006,
respectively. As we can see in Table 2, the credit is supplied mostly from government
agencies and cooperatives. In 2004, about 56 percent of those who received fertilizer
credit received it from government agencies, and 35 percent received it from
cooperatives and farmer groups. In 2006, the proportion is 27 percent from government
agencies and 67 percent from cooperatives and farmer groups. Because the cooperatives
and farmer groups are also supported by government agencies, these numbers indicate
that more than 90 percent of those who obtained fertilizer on credit received it from
government sponsored organizations.
Compared with Kenya and Ethiopia, the little use of inorganic fertilizer in
Uganda is striking. One reason for this is the lack of credit in Uganda. No households in
our Ugandan sample households received credit from any sources to buy inorganic
fertilizer in 2003 and 2007. There is neither a large scale government fertilizer program,
like in Ethiopia, that provides subsidized fertilizer to farmers nor an active private
fertilizer sector, like in Kenya, that supplies fertilizer at competitive prices. Since
Uganda is landlocked and the transportation system connecting it to ports is poorly
developed, access to the fertilizer market is unfavorable in this country.

GRIPS Policy Research Center Discussion Paper: 10-24
11
3.2 Crop and DAP prices
To basic information about the DAP price distribution in each country, we
present box plots of the DAP price in Figure 1. The number of DAP price observations
is so small in Uganda that the Ugandan boxes are undetectable. The horizontal line of
the first (far left) box in Figure 1 represents the average DAP price in Kenya during the
first survey period in 2004. The top and bottom of the box represent the 75th and 25
th
percentiles of the DAP price. By comparing boxes in Figure 1, we note that the Kenya
boxes are smaller than the Ethiopian boxes, indicating smaller price variations in the
DAP price in Kenya than in Ethiopia. As we discussed before, the fertilizer market is
liberalized and functions well such that fertilizer traders and retailers tend to equalize
the DAP prices across regions. In Ethiopia, the fertilizer price is subsidized not by the
federal government but by the regional governments. Thus, the large variations in the
fertilizer price may suggest differences in the subsidies across regions.
What matters to farmers, however, is not the fertilizer price itself. Even if the
fertilizer price is high, farmers can make profit if the output price is also high. What
matters most is the price ratio of input and output prices. Thus, to examine economic
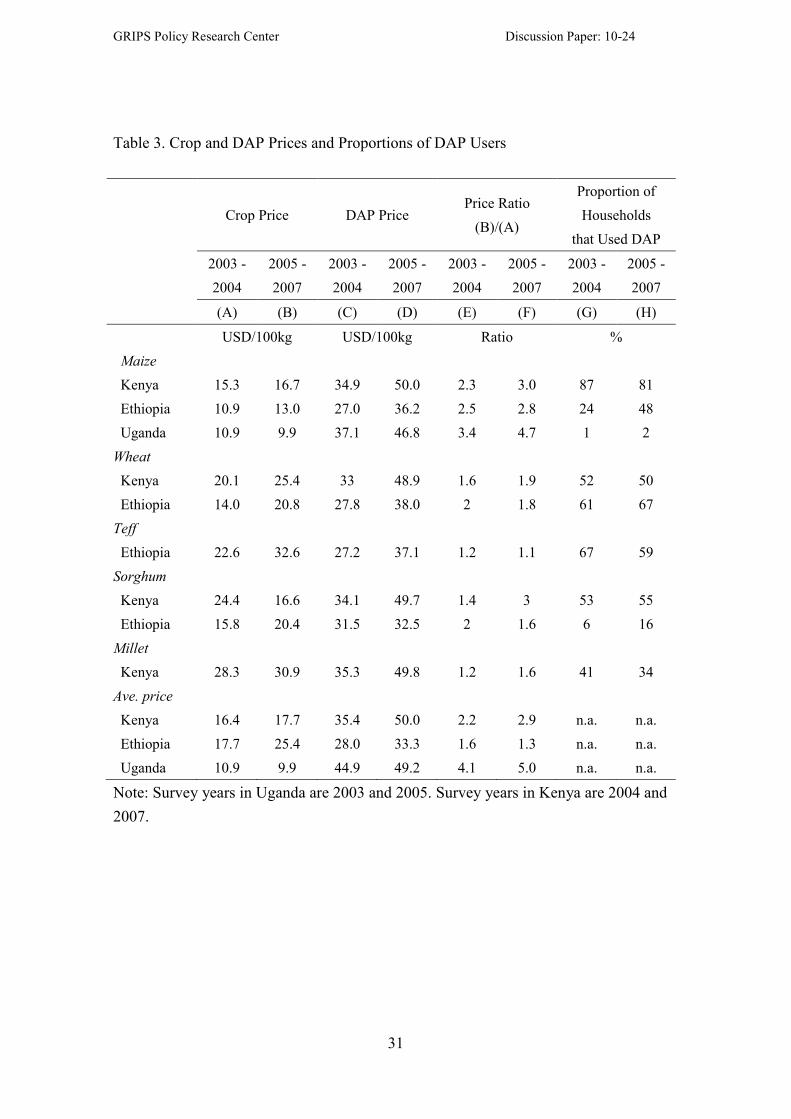
returns from inorganic fertilizer use on cereal crops, we present in Table 3 various
cereal crop prices, the DAP price, the price ratios of the two, and the proportions of
households who applied DAP on crops. First, we compare prices of maize across
countries. In Kenya, the maize price per 100 kilograms is USD 15 in 2004 and USD 17
in 2007. The DAP price increased significantly from USD 35 in 2004 to USD 50 in
2007. As a result, the input-output price ratio increased from 2.3 in 2004 to 3.0 in 2007.

GRIPS Policy Research Center Discussion Paper: 10-24
12
Despite the increase in the real DAP price, the proportion of the farmers who apply
DAP in 2007 remains high at 81 percent, only a 6 point decline from 2004.
The maize price in Ethiopia and Uganda is about two-thirds of that of Kenya.
In Ethiopia, it is USD 11 and UDS 13 per 100 kilograms in 2004 and 2006, respectively.
Due to the subsidy program in Ethiopia, the DAP price is kept at a low level: it is USD
27 and USD 36 per 100 kilograms in 2004 and 2006. Thus, despite the low maize prices,
the input-output price ratios are at a low level and are comparable to those in Kenya.
The proportions of farmers who apply DAP on maize, however, remain low at 24
percent in 2004 and 48 percent in 2006 and are much lower in Ethiopia than in Kenya.
Without a fertilizer subsidy program, the DAP price is higher in Uganda than in the
other two countries. It is USD 37 and USD 47 per 100 kilograms in 2003 and 2005,
respectively. Even these prices underestimate the real DAP price in Uganda because
these prices are calculated from farmers who have applied fertilizer. They mostly live
near the Uganda-Kenya border. In other parts of Uganda, few farmers use fertilizer, and
we do not have fertilizer price information. We suspect that the fertilizer price must be
higher in such non0consuming areas in Uganda. Among the fertilizer users in Uganda,
the input-output ratio is 3.4 in 2003 and 4.7 in 2005, which are much higher than in the
other two countries, and virtually no farmers apply DAP on maize. What is important to
note is that the fertilizer price is similar to Kenya among the Ugandan fertilizer users,
but the maize output price is about two-thirds. The Uganda maize price would increase
to the level close to the Kenya level, if maize markets are integrated across the country
borders. (see Chapter 2).
GRIPS Policy Research Center Discussion Paper: 10-24
13
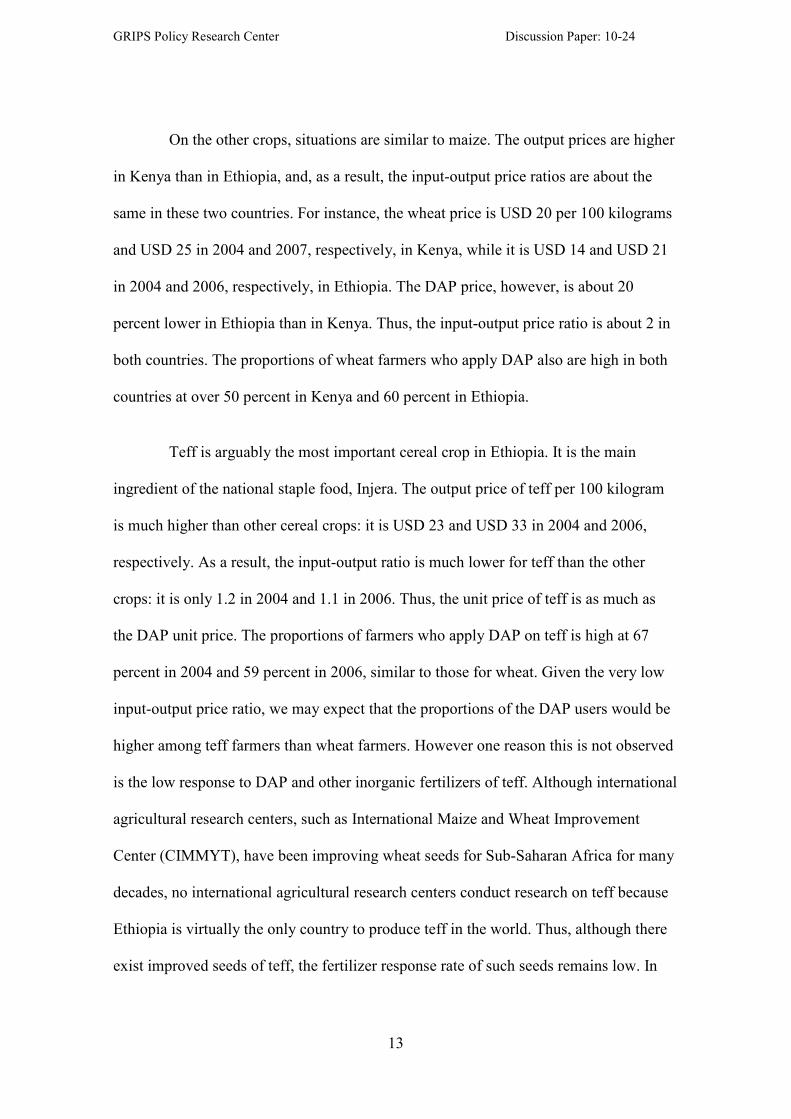
On the other crops, situations are similar to maize. The output prices are higher
in Kenya than in Ethiopia, and, as a result, the input-output price ratios are about the
same in these two countries. For instance, the wheat price is USD 20 per 100 kilograms
and USD 25 in 2004 and 2007, respectively, in Kenya, while it is USD 14 and USD 21
in 2004 and 2006, respectively, in Ethiopia. The DAP price, however, is about 20
percent lower in Ethiopia than in Kenya. Thus, the input-output price ratio is about 2 in
both countries. The proportions of wheat farmers who apply DAP also are high in both
countries at over 50 percent in Kenya and 60 percent in Ethiopia.
Teff is arguably the most important cereal crop in Ethiopia. It is the main
ingredient of the national staple food, Injera. The output price of teff per 100 kilogram
is much higher than other cereal crops: it is USD 23 and USD 33 in 2004 and 2006,
respectively. As a result, the input-output ratio is much lower for teff than the other
crops: it is only 1.2 in 2004 and 1.1 in 2006. Thus, the unit price of teff is as much as
the DAP unit price. The proportions of farmers who apply DAP on teff is high at 67
percent in 2004 and 59 percent in 2006, similar to those for wheat. Given the very low
input-output price ratio, we may expect that the proportions of the DAP users would be
higher among teff farmers than wheat farmers. However one reason this is not observed
is the low response to DAP and other inorganic fertilizers of teff. Although international
agricultural research centers, such as International Maize and Wheat Improvement
Center (CIMMYT), have been improving wheat seeds for Sub-Saharan Africa for many
decades, no international agricultural research centers conduct research on teff because
Ethiopia is virtually the only country to produce teff in the world. Thus, although there
exist improved seeds of teff, the fertilizer response rate of such seeds remains low. In
GRIPS Policy Research Center Discussion Paper: 10-24
14
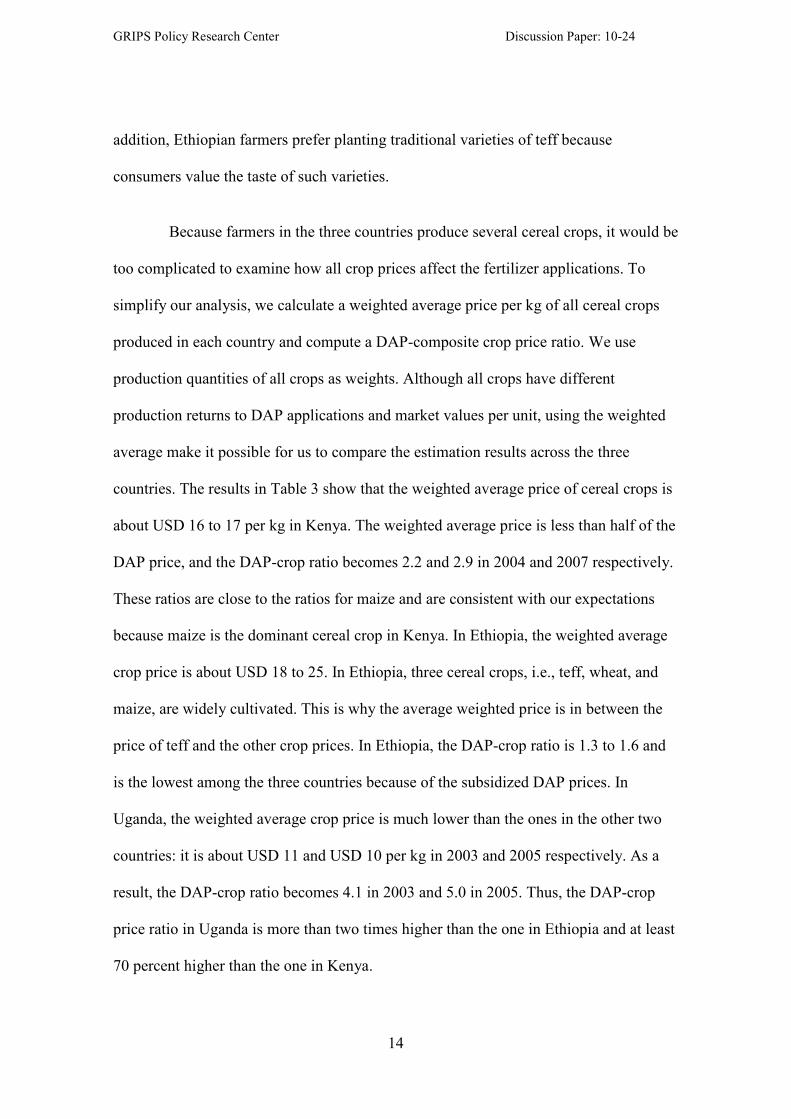
addition, Ethiopian farmers prefer planting traditional varieties of teff because
consumers value the taste of such varieties.
Because farmers in the three countries produce several cereal crops, it would be
too complicated to examine how all crop prices affect the fertilizer applications. To
simplify our analysis, we calculate a weighted average price per kg of all cereal crops
produced in each country and compute a DAP-composite crop price ratio. We use
production quantities of all crops as weights. Although all crops have different
production returns to DAP applications and market values per unit, using the weighted
average make it possible for us to compare the estimation results across the three
countries. The results in Table 3 show that the weighted average price of cereal crops is
about USD 16 to 17 per kg in Kenya. The weighted average price is less than half of the
DAP price, and the DAP-crop ratio becomes 2.2 and 2.9 in 2004 and 2007 respectively.
These ratios are close to the ratios for maize and are consistent with our expectations
because maize is the dominant cereal crop in Kenya. In Ethiopia, the weighted average
crop price is about USD 18 to 25. In Ethiopia, three cereal crops, i.e., teff, wheat, and
maize, are widely cultivated. This is why the average weighted price is in between the
price of teff and the other crop prices. In Ethiopia, the DAP-crop ratio is 1.3 to 1.6 and
is the lowest among the three countries because of the subsidized DAP prices. In
Uganda, the weighted average crop price is much lower than the ones in the other two
countries: it is about USD 11 and USD 10 per kg in 2003 and 2005 respectively. As a
result, the DAP-crop ratio becomes 4.1 in 2003 and 5.0 in 2005. Thus, the DAP-crop
price ratio in Uganda is more than two times higher than the one in Ethiopia and at least
70 percent higher than the one in Kenya.

GRIPS Policy Research Center Discussion Paper: 10-24
15
4. Estimation Models and Variables
4.1 Estimation models
First, we estimate the determinants of the DAP price paid by farmers in the
three countries. The dependent variable is measured for each purchase of DAP by
sample households. The estimation model is
DAP Price = f (Market Access, Agro-ecological Conditions, Household
Characteristics, Country and Second Round dummies). (1)
We estimate this model for pooled data of the three countries and for each country
separately. We expect that the DAP price would be higher in areas with poor market
access because of high transportation costs. As proxies for market access, we include
two variables. One is the driving hours to the nearest city, and the other is the driving
hours to the capital. The driving hours to the capital controls for over-all market
conditions. Crop and DAP prices at any urban center are affected by the driving time to
the capital. If farmers are located farther away from the urban center, however, the
prices that they receive for crops could be much lower than the market prices. Thus, the
driving hours to the nearest urban center measures the local market access.

GRIPS Policy Research Center Discussion Paper: 10-24
16
Agro-ecological conditions also affect demand for DAP. For instance, in
high-potential areas, the demand for DAP would be high. However, in such areas, the
supply of DAP would also be high, likely involving more traders. As a result, the per
unit cost of DAP transportation may be low. It is not clear, therefore, if the DAP price
would be relatively high or low in high potential areas.
If the DAP price is determined purely by market forces, household
characteristics should not influence the price. We expect, however, that some household
characteristics affect the DAP price even under well-functioning markets because of our
procedure to compute per unit price. Some farmers purchase DAP and other inorganic
fertilizer in large packages, such as 50 or 100 kg bags, while others purchase it in small
packages. Because small packages require a similar transaction cost as large packages,
the price per kilogram would be higher for small packages. Since well-off households
tend to purchase agricultural inputs in large packages, we expect to find negative effect
on price of some household variables, such as land size or asset values. Other household
characteristics that are not correlated with the size of fertilizer purchases should not be
correlated with the DAP price.
Next, we estimate the determinants of the DAP application per ha. The
estimation model is

GRIPS Policy Research Center Discussion Paper: 10-24
17
DAP use per ha = f (DAP-Crop Price Ratio, Market Access, Agro-ecological
Conditions, Household Characteristics, Country and Second Round dummies)
(2)
Again, we estimate this model for the pooled data and for each country. In this model,
we add one variable, which is the DAP-crop price ratio, to equation (1). Because
farmers apply DAP on various crops, we calculate the weighted average of crop prices
by using quantities of crop productions as weights, as we have shown in Table 3. Then,
we calculate the DAP-crop price ratio aggregated up to the district level. This is done
because we do not have DAP price data from farmers who do not purchase it. Without
the DAP price, we cannot estimate the equation (2) for those who do not use DAP. Thus,
we aggregate the DAP price up to the district level and assume that all farmers face the
same price within district at a given agricultural season, and divide the DAP price by
the weighted average of the crop prices.
Although we expect that the DAP price has a negative impact on DAP fertilizer
use, there are some factors that work against this effect. For instance, the DAP price is
subsidized in Ethiopia, as discussed earlier. Thus, the DAP price is artificially low in
Ethiopia, although the amount of the fertilizer use is about the same or lower than in
Kenya, as we can see in Table 1. The low fertilizer price in Ethiopia, therefore, makes it
difficult to identify the relationship between the DAP price and DAP use in the pooled
data. Even within Ethiopia, the DAP price is determined by regional governments. They
may set the DAP price low in areas where farmers do not use much DAP to encourage
them to use it. In this case, we would find a reverse causality between the DAP price
and use. Therefore we must be careful about interpreting the results of our analyses.
GRIPS Policy Research Center Discussion Paper: 10-24
18
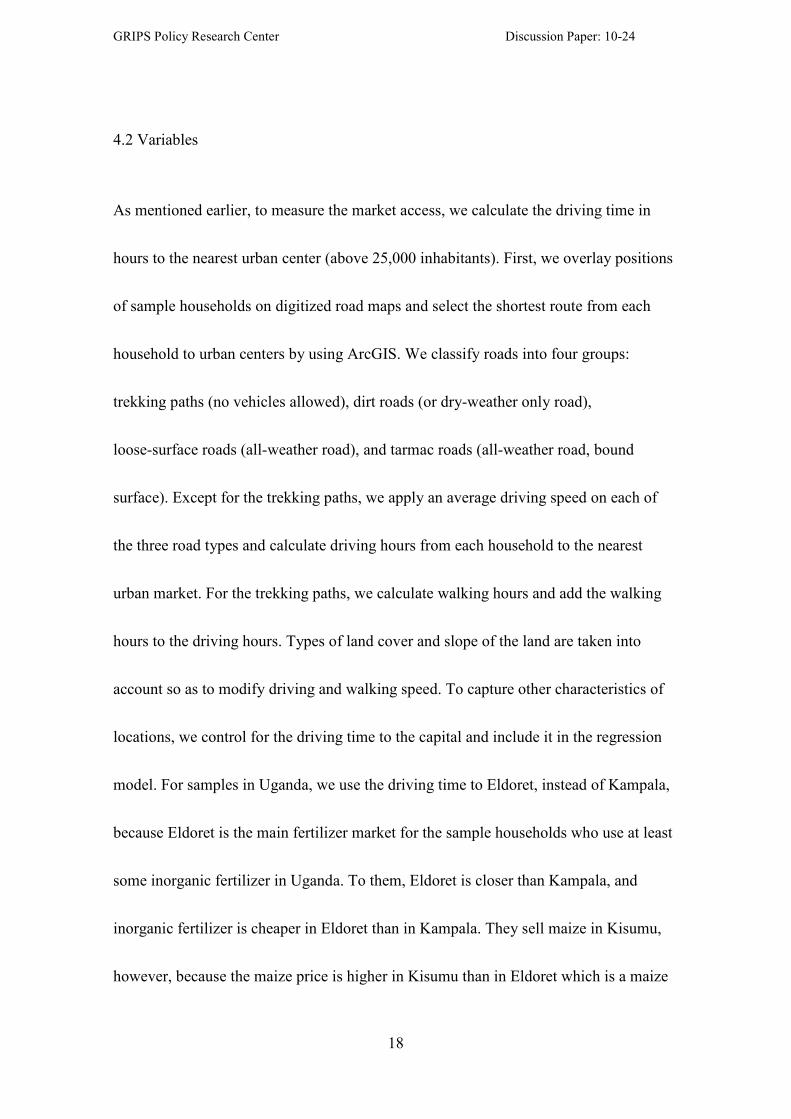
4.2 Variables
As mentioned earlier, to measure the market access, we calculate the driving time in
hours to the nearest urban center (above 25,000 inhabitants). First, we overlay positions
of sample households on digitized road maps and select the shortest route from each
household to urban centers by using ArcGIS. We classify roads into four groups:
trekking paths (no vehicles allowed), dirt roads (or dry-weather only road),
loose-surface roads (all-weather road), and tarmac roads (all-weather road, bound
surface). Except for the trekking paths, we apply an average driving speed on each of
the three road types and calculate driving hours from each household to the nearest
urban market. For the trekking paths, we calculate walking hours and add the walking
hours to the driving hours. Types of land cover and slope of the land are taken into
account so as to modify driving and walking speed. To capture other characteristics of
locations, we control for the driving time to the capital and include it in the regression
model. For samples in Uganda, we use the driving time to Eldoret, instead of Kampala,
because Eldoret is the main fertilizer market for the sample households who use at least
some inorganic fertilizer in Uganda. To them, Eldoret is closer than Kampala, and
inorganic fertilizer is cheaper in Eldoret than in Kampala. They sell maize in Kisumu,
however, because the maize price is higher in Kisumu than in Eldoret which is a maize

GRIPS Policy Research Center Discussion Paper: 10-24
19
surplus city. On agro-ecological conditions, we include the altitude and the PPE
(Precipitation over Potential Evapotranspiration ratio). When we conducted community
surveys in 2003 and 2005, we obtained GIS readings at the center of each community.
Thus, the altitude is measured at the community level. The PPE is used as an index to
measure the agro-ecological conditions where a higher PPE means a greater potential
for agriculture. The PPE is obtained from the data base contained in the Almanac
Characterization Tool (Corbett, 1999). In addition to these variables, we include an
index of soil fertility variable in the model, which is represented by the soil organic
matter (SOM) content. We could estimate this model with the sub-samples for which
we have the SOM data. This method, however, may create selection biases because the
sub-samples with the soil fertility data are not selected randomly. Instead, we replace all
the soil related variables with zero and include an additional dummy variable for those
households without soil data. To assure that our approach provides robust estimates, we
estimate the same model for all the households and sub-samples.
The household characteristics include human capital and asset variables. The
human capital variables include age, education levels, and gender of household heads.
For household assets, we include own land size in hectares and the value of household
farm equipments, furniture, transportation means, communication devices, and other

GRIPS Policy Research Center Discussion Paper: 10-24
20
household assets. Because the land size and the soil fertility of the land are separately
included in the model, we do not include the value of land in the total asset value.
There are two major limitations of the estimation models (please see Chapter 2
for more detailed discussions about these limitations). The first limitation is that we
have at most one soil sample per household. Because of this limitation, we assume that
the soil fertility is fixed over time and the same across plots that belong to each sample
household in order to use all the observations in our panel data. The second major
limitation of our estimation models is that, in addition to the soil fertility variables, the
travel time to urban centers and the capital is also observed only once in our panel data.
Moreover, these soil fertility and traveling time variables could be correlated with some
omitted variables, such as farmers’ ability (which could related to soil fertility). If we
had multiple observations of these variables over time, with large variations, we could
use a fixed effects model to control for unobserved household fixed effects and at the
same time identify causal impacts as well. Without such multiple observations of the
variables, we are unable to eliminate potential biases created by omitted variables to
identify causal impacts. Thus, in this study, we interpret the results as observed
associations between these independent variables and the outcome variables, instead of
causal relationships between them.

GRIPS Policy Research Center Discussion Paper: 10-24
21
5. Results
We first discuss the results of the market access variable. The first column of
pooled regression in Table 4 indicates that the DAP price does not depend on market
access or agro-ecological conditions. However, a quick look at the results in the
columns of individual country analyses shows that this is because individual countries
have opposite results regarding the effect of market access. In Kenya, the DAP price
does not depend on market access. This suggests that the DAP retail price remains at the
same level across regions because of the well developed network of fertilizer retailers.
In Ethiopia, driving time to the capital does not have any effect on the DAP price, but
driving time to the nearest urban center has a positive effect on the DAP price. This
suggests that the government supported fertilizer agencies set the base fertilizer price
constant across regions, but add transportation charges to the costs to the farmers at the
local level. In Uganda, we use the driving time to Eldoret, as a proxy of the market
access, because farmers who use DAP in Uganda are living near the Kenya border and
obtain fertilizer from Kenya. Eldoret is the nearest big city in Kenya for those Ugandan
households who use fertilizer among our samples. The results indicate that the DAP
price increases as the Ugandan households are located farther away from Eldoret.
Regarding the agro-ecological conditions, we find that they have an effect on
DAP price in Kenya and Uganda but not in Ethiopia. In Kenya, the DAP price is higher
in areas with a high PPE and also higher in lowland areas. Since lowland areas with a
high PPE are generally high potential agricultural areas, the results suggest that the

GRIPS Policy Research Center Discussion Paper: 10-24
22
DAP price is high in high potential areas. In contrast, the agro-ecological conditions do
not have any impacts on the DAP price in Ethiopia. This is because the DAP price is
determined by the government supported agencies who would not consider the
agro-ecological conditions when they set the DAP price. In Uganda, the results are
similar to the ones in Kenya, except one: the DAP price is low in highland areas. As
mentioned earlier, in highland areas near Kapchorwa, which is a small town near Mt.
Elgon located on the Kenya-Uganda border, farmers purchase fertilizer from Kenya.
Because of easy access to Kenya, the DAP price in this area is lower than in other parts
of Uganda. This is probably why we find a negative coefficient on the altitude in
Uganda.
Among the household characteristics, land size and asset value have generally
negative coefficients on the DAP price. The reason for the negative coefficients on the
asset value and the land size is that wealthy large landholders tend to buy fertilizer in a
large volume and have a low per unit cost. Thus, the unit price of DAP tends to be
smaller for wealthy large landholders than poor small landholders. None of the other
household characteristics have significant coefficients in Kenya. In Uganda and
Ethiopia, however, we find that some household characteristics, in addition to land size
and the total asset value, have significant impacts on the DAP price. This suggests that
the fertilizer market is not well-functioning in Uganda and Ethiopia so that some
households find ways to buy inorganic fertilizer at different prices than others.
We expected the DAP-crop price ratio to have a negative coefficient on the
fertilizer application. On the contrary, however, the pooled results in Table 5 indicate
that the fertilizer price has a positive coefficient on the level of fertilizer application

GRIPS Policy Research Center Discussion Paper: 10-24
23
(column A). One of the reasons for this finding is that the fertilizer price is subsidized
and artificially set low in Ethiopia. When we separate the samples and estimate the
same model for each country, we find a negative coefficient on the DAP-crop price ratio
in Kenya but a positive coefficient in Ethiopia. It appears that farmers in Kenya are
responsive to the fertilizer price in determining the DAP use. In contrast, in Ethiopia,
the government supported agencies may set the DAP price high in areas where farmers
are able to pay for high prices, while they set it low in areas where farmers are unable to
pay for high prices. This is why we find a positive coefficient on the price ratio in
Ethiopia.
From the above results on the DAP price, we suspect that fertilizer use in
Kenya tends to be market-driven, while in Ethiopia it tends to be policy-driven. With
this hypothesis in mind, we examine the estimation results on other variables. For
instance, in Ethiopia, the results on the driving hours to the capital and the driving hours
to the nearest urban center suggest that the DAP application declines in areas farther
away from Addis Ababa, but the DAP application increases in remote areas once the
driving hours to Addis Ababa is controlled. This result could be a result of regional
governments’ policies to encourage DAP use in remote areas in their regions. In Kenya,
the DAP application increases in areas farther away from Nairobi. This is probably
because the DAP application is high in Rift Valley, which is about four to six hours
away from Nairobi. Once we control for the driving hours to Nairobi, we find that the
DAP application declines as the driving hours to the nearest urban center increases. This
is what we expect in a normal market because the price ratio variable does not cover all

GRIPS Policy Research Center Discussion Paper: 10-24
24
the costs, such as transportation costs, associated with the distance to the nearest urban
center; that effect is captured by the driving time to the nearest urban center.
Regarding agro-ecological conditions, we find that the DAP application is
higher in areas with a lower PPE, hence low-potential, areas in Ethiopia. Again, this
could be a result of a policy that encourages farmers to use DAP in areas where farmers
have a low incentive to apply DAP. In contrast, we find that both the PPE and soil
fertility have positive coefficients on the DAP use in Kenya. These results suggest that
farmers in high-potential areas use more DAP than those who live in low-potential areas.
In Uganda, both the PPE and soil fertility do not matter for DAP use, but the altitude
has a positive impact on DAP use. This is probably because farmers in Kapchorwa are
the primary use of DAP.
On household characteristics, we find that the total value of assets has a strong
positive impact on the DAP use in both Kenya and Ethiopia. This suggests that farmers
in Kenya and Ethiopia are facing credit constraints, despite the fertilizer credit programs
available in both countries. Although we do not find a significant coefficient on the total
value of assets in Uganda, this does not suggest that farmers in Uganda are not facing
credit constraints. In Uganda, only farmers in the eastern regions, close to the
Kenya-Uganda border, use DAP. Thus, even relatively well-off farmers in the central
and western regions use little DAP. This is why we do not find a positive coefficient on
the total value of assets. Indeed, when we estimate the model with only the households
in the eastern regions, we find a positive and significant coefficient on the total value of
assets in Uganda.
GRIPS Policy Research Center Discussion Paper: 10-24
25
Finally, we find that the education level of the household head has a positive
impact on the DAP use both in Ethiopia and Uganda but not in Kenya. In Kenya, about
80 percent of the sample households use at least some inorganic fertilizer, as we show
in Table 1. Thus, farmers with various education levels are familiar with inorganic
fertilizer, including DAP. Inorganic fertilizer in Ethiopia and Uganda is not as
wide-spread as in Kenya. Although the government of Ethiopia is promoting the use of
inorganic fertilizer with credit programs, farmers’ knowledge about fertilizer use is still
inadequate. Thus, educated farmers who have better knowledge about inorganic
fertilizer tend to use more DAP than less educated ones. The results, therefore, suggest
the need for extension services on how to use inorganic fertilizer in these two countries.
6. Conclusions
To identify constraints on inorganic fertilizer use, we have compared inorganic
fertilizer application in three East African countries that have different fertilizer policies.
Kenya is one of a few African countries which have successfully liberalized fertilizer
markers and achieved a substantial increase in the fertilizer use over decades. Ethiopia,
on the other hand, has returned to state-led fertilizer marketing, after a brief
liberalization of the fertilizer market, while Uganda’s fertilizer market has remained
minuscule. The estimation results in this study reflect the different fertilizer policies in
the three countries. The determinants of the DAP price and application in Kenya can be
mostly explained by market forces and agro-ecological factors, suggesting that the
fertilizer market works well. One of the most important factors that affect fertilizer use

GRIPS Policy Research Center Discussion Paper: 10-24
26
in Kenya is the fertilizer price. The estimated results suggest that a relatively small
reduction in the fertilizer price would lead to a large increase in the fertilizer use in this
country.
In Ethiopia, on the other hand, the estimation results indicate that policy related
factors determine the fertilizer price and application. This is because Ethiopia has a
large fertilizer subsidy program. As a result, the fertilizer use is high in low potential
areas, which tend to be in remote areas. Although such subsidy programs may
contribute to poverty alleviation, technical returns from such programs could be low. As
Chapter 4 in this book and Spielman et al. (2010) suggest, Ethiopia’s state-led fertilizer
policies may lead to non-optimal use of fertilizer, which, in turn, would result in low
returns to public investment. The Ethiopian government needs to start designing
strategy to support the development of a private fertilizer marketing sector. As
evidenced in other countries, there are different approaches for governments to take to
encourage fertilizer use while still promoting the private sector. It may well be that the
government should allocate more resources for the provision of pure public goods such
as agricultural research and extension services which may increase the effectiveness of
fertilizer use and the demand for fertilizer. Finally, Uganda needs to learn from
experiences in the two neighboring countries. Because it shares a border with Kenya, it
is relatively easy to let the Kenyan fertilizer market expand into Uganda. As a result, the
fertilizer prices would be close to the ones in Kenya. If the output prices remain low in
Uganda, however, the fertilizer use would not increase. For instance, as Chapter 2 in
this book describes, the maize market price in Kampala, the capital city in Uganda, is
about 30 percent lower than in Kisumu, which is located near the Ugandan border and is

GRIPS Policy Research Center Discussion Paper: 10-24
27
the third largest city in Kenya. The two countries need to eliminate explicit and implicit
trade barriers on maize and other important staple crops to let Kenyan consumers buy
cheap Ugandan crops and let Ugandan farmers buy cheap Kenya fertilizer.

GRIPS Policy Research Center Discussion Paper: 10-24
28
References
Byerlee, D. & Eicher, C. K. (1997). Africa’s Emerging Maize Revolution. Colorado:
Lynne Rienner Publishers.
Corbett, J. C. (1999). The Almanac Characterization Tool, Version 2.01.
Characterization, Assessment and Applications Group, Blackland Research
Center, TAES, Texas A&M University System, a CDROM publication
Eicher, C. K. (1995). Zimbabwe’s Maize-Based Green Revolution: Predictions for
Replication. World Development, 23, 805-818.
FAOSTAT. (2010, May). Food and Agriculture Organization of the United Nations.
http://faostat.fao.org.
Freeman, H. A. & Omitti, J. M. (2003). Fertilizer Use in Semi-arid Areas of Kenya:
Analysis of Smallholder Farmers' Adoption Behavior under Liberalized Markets.
�utrient Cycling in Agroecosystems, 66, 23-32.
Freeman, H. A. & Kaguongo, W. (2003). Fertilizer Market Liberalization and Private
Retail Trade in Kenya. Food Policy, 28, 505-518.
Jayne, T. S., Govereh, J., Wanzala, M. & Demeke, M. (2003), Fertilizer Market
Development: a Comparative Analysis of Ethiopia, Kenya, and Zambia. Food
Policy, 28, 293-316.
Jayne, T. S., Nyoro, J. & Yamano, T. (2004). Interlinked Credit and Farm
Intensification: Evidence from Kenya. Agricultural Economics, 31(2), 209-218.
Morris, M., Kelley, V.A., Kopicki, R.J. & Byerlee, D. (2007). Fertilizer Use in African
Agriculture: Lessons Learned and Good Practices. Washington D.C.: World
Bank.
Omamo S. W. (2003). Fertilizer Trade and Pricing in Uganda. Journal of Agricultural
Economics, 42, 310-324.
Omamo, S. W. & Mose, L. O. (2001). Fertilizer Trade under Market Liberalization:
Preliminary Evidence from Kenya. Food Policy, 26, 1-10.
Spielman, D. J., Byerleer, D., Alemu, D., & Kelemework, D. (2010). Policies to
Promote Cereal Intensification in Ethiopia: The Search for Appropriate Public
and Private Roles. Food Policy, 35, 185-194.

GRIPS Policy Research Center Discussion Paper: 10-24
29
Table 1. Sample Households in Kenya, Ethiopia, and Uganda
Country/
Survey Year
Number of
Households
Proportion
of
Inorganic
Fertilizer
Users
Average
Quantity
Used
Proportion of Users by
Fertilizer Type Proportion of
Households
that Received
Credit DAP CAN NPK UREA
(A) (B) (C) (D) (E) (F) (G) (H)
Number % kg % % % % %
Kenya 2004 899 81 134 78 33 28 11 21
2007 777 78 121 70 19 25 8 18
Ethiopia 2004 417 74 104 71 - - 71 44
2006 411 73 113 69 - - 43 64
Uganda 2003 940 7 4 1 1 2 3 -
2005 936 8 7 3 1 4 3 -

GRIPS Policy Research Center Discussion Paper: 10-24
30
Table 2. Sources of the Fertilizer Credit
Kenya Ethiopia Uganda
2004 2007 2004 2006 2003 2005
% % % % % %
Cooperatives and Farmer Groups 90 68 35 67 - -
Government Agencies 0 29 56 27 - -
Traders 8 2 8 5 - -
Others 2 1 1 1 - -
Total (%) 100 100 100 100
[Number of Households] [213] [267] [187] [147] - -
GRIPS Policy Research Center Discussion Paper: 10-24
31
Table 3. Crop and DAP Prices and Proportions of DAP Users
Crop Price DAP Price Price Ratio
(B)/(A)
Proportion of
Households
that Used DAP
2003 -
2004
2005 -
2007
2003 -
2004
2005 -
2007
2003 -
2004
2005 -
2007
2003 -
2004
2005 -
2007
(A) (B) (C) (D) (E) (F) (G) (H)
USD/100kg USD/100kg Ratio %
Maize
Kenya 15.3 16.7 34.9 50.0 2.3 3.0 87 81
Ethiopia 10.9 13.0 27.0 36.2 2.5 2.8 24 48
Uganda 10.9 9.9 37.1 46.8 3.4 4.7 1 2
Wheat
Kenya 20.1 25.4 33 48.9 1.6 1.9 52 50
Ethiopia 14.0 20.8 27.8 38.0 2 1.8 61 67
Teff
Ethiopia 22.6 32.6 27.2 37.1 1.2 1.1 67 59
Sorghum
Kenya 24.4 16.6 34.1 49.7 1.4 3 53 55
Ethiopia 15.8 20.4 31.5 32.5 2 1.6 6 16
Millet
Kenya 28.3 30.9 35.3 49.8 1.2 1.6 41 34
Ave. price
Kenya 16.4 17.7 35.4 50.0 2.2 2.9 n.a. n.a.
Ethiopia 17.7 25.4 28.0 33.3 1.6 1.3 n.a. n.a.
Uganda 10.9 9.9 44.9 49.2 4.1 5.0 n.a. n.a.
Note: Survey years in Uganda are 2003 and 2005. Survey years in Kenya are 2004 and
2007.

GRIPS Policy Research Center Discussion Paper: 10-24
32
Table 4. Determinants of DAP Price in Log
The dependent variable is the natural logarithm of fertilizer price (USD) per ton.
Pooled Kenya Ethiopia Uganda
(A) (B) (C) (D)
Market Access
Hours to the Capital a 0.00231 -0.00462 -0.00284 0.831
***
(0.50) (-0.61) (-0.30) (2.91)
Squared Hours to the Capital a -0.000178 0.0000261 -0.0000624 -0.0656
***
(-0.71) (0.04) (-0.14) (-2.78)
Hours to the Nearest City 0.00762 -0.00241 0.0653***
(1.35) (-0.53) (4.17)
Squared Hours to the City -0.000752 0.000684* -0.00706***
(-1.39) (1.70) (-4.36)
Agro-ecological Variables
PPE 0.0318 0.118***
-0.0216 -0.230**
(1.48) (3.59) (-0.54) (-2.12)
Altitude -0.0000015 -0.000012***
0.0000052 -0.00022***
(-0.37) (-3.27) (0.20) (-4.29)
Soil Fertility (Carbon) 0.00434 0.00167 0.000210 0.0727**
(1.01) (0.40) (0.02) (2.25)
Household Characteristics
Household Head Age 0.000264 0.000267 0.000338 -0.00214**
(0.77) (0.84) (0.54) (-2.04)
Household Head Education 0.00389***
0.000744 0.00974***
0.0116***
(2.95) (0.73) (3.33) (2.90)
Female-headed Households 0.0178 0.0145 0.0192 -0.101
(1.30) (1.49) (0.56) (-1.55)
Land Size -0.00390** -0.00670
*** -0.00169 0.0683
***
(-2.10) (-3.18) (-0.52) (3.19)
ln (Asset Value) -0.0187***
-0.00398 -0.0302***
-0.0798***
(-4.30) (-1.13) (-3.22) (-3.16)
Country Dummies
Second-round Dummy 0.332***
0.330***
0.302***
0.349***
(25.46) (40.89) (17.88) (6.83)
Constant 5.924***
5.888***
5.629***
6.495***
(150.24) (139.63) (62.06) (50.10)
GRIPS Policy Research Center Discussion Paper: 10-24
33
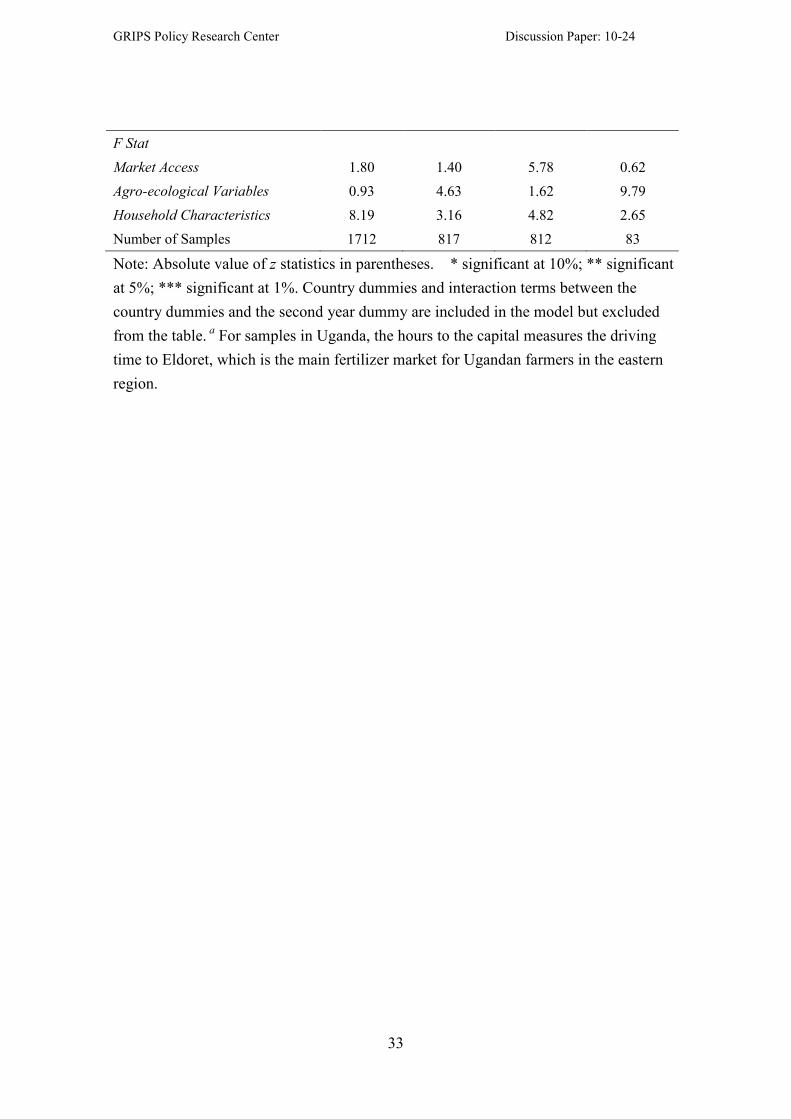
F Stat
Market Access 1.80 1.40 5.78 0.62
Agro-ecological Variables 0.93 4.63 1.62 9.79
Household Characteristics 8.19 3.16 4.82 2.65
Number of Samples 1712 817 812 83
Note: Absolute value of z statistics in parentheses. * significant at 10%; ** significant
at 5%; *** significant at 1%. Country dummies and interaction terms between the
country dummies and the second year dummy are included in the model but excluded
from the table. a For samples in Uganda, the hours to the capital measures the driving
time to Eldoret, which is the main fertilizer market for Ugandan farmers in the eastern
region.

GRIPS Policy Research Center Discussion Paper: 10-24
34
Table 5. Determinants of Fertilizer Use
Tobit Model: The dependent variable is the quantity of fertilizer use (kgs) per ha.
Pooled Kenya Ethiopia Uganda
(A) (B) (C) (D)
Price Ratio
Fertilizer/Crop Price Ratio 27.73***
-103.6***
102.5***
18.226
(4.44) (-7.36) (9.66) (0.79)
Market Access
Hours to the Capital a 0.0744 14.93
*** -3.163
* 140.6
(0.07) (4.90) (-1.89) (1.49)
Squared Hours to the Capital a -0.136
*** -1.445
*** 0.00527 -8.997
(-2.64) (-5.67) (0.08) (-1.45)
Hours to the Nearest City -0.440 -3.206* 7.271
** n.a.
(-0.29) (-1.65) (2.51)
Squared Hours to the Nearest City 0.163 0.363** -0.433 n.a.
(1.07) (2.12) (-1.48)
Agro-ecological Variables
PPE 3.237 58.52***
-20.23***
-88.93
(0.63) (5.19) (-3.13) (-0.64)
Altitude -0.00267** -0.00191 -0.00466 0.181
**
(-2.46) (-1.61) (-1.14) (2.50)
Soil Fertility (Carbon) 1.460 3.324** -1.785 21.43
(1.29) (2.18) (-0.83) (1.07)
Household Characteristics
Household Head Age -0.180** -0.168 -0.0304 0.0903
(-2.14) (-1.27) (-0.26) (0.08)
Household Head Education 0.586* -0.220 1.849
*** 5.757
(1.74) (-0.53) (3.16) (1.50)
Female-headed Households -0.114 -0.745 -5.904 2.820
(-0.03) (-0.17) (-1.02) (0.06)
Land Size 0.233 -0.458 0.204 1.372
(1.40) (-1.42) (0.89) (0.77)
ln (Asset Value) 4.905***
3.822** 5.200
*** 9.257
(4.40) (2.54) (3.02) (0.69)
Country Dummies
Second-round Dummy -9.749** 71.59
*** 3.761 59.64
(-1.95) (7.12) (0.97) (1.59)

GRIPS Policy Research Center Discussion Paper: 10-24
35
Constant -85.94***
128.7***
-167.9***
-1256.2**
(-5.77) (4.00) (-7.91) (-2.54)
F Stat
Market Access 8.77 10.53 5.95 1.68
Agro-ecological Variables 12.75 2.03 10.24 2.14
Household Characteristics 11.02 10.95 3.77 0.98
Number of Samples 7151 1729 2777 2645
Note: Absolute value of z statistics in parentheses. * significant at 10%; ** significant
at 5%; *** significant at 1%. Country dummies and interaction terms between the
country dummies and the second year dummy are included in the model but excluded
from the table. a For samples in Uganda, the hours to the capital measures the driving
time to Eldoret, which is the main fertilizer market for Ugandan farmers in the eastern
region.

GRIPS Policy Research Center Discussion Paper: 10-24
36
Figure 1. Box Plots of DAP price in Kenya, Ethiopia, and Uganda
Note: The top and bottom of each box represent 75th and 25
th percentile, respectively.
The horizontal line in each box represents the mean value.
2004
2007
2004
2006
2003
2005
10
20
30
40
50
60
DAP price: USD per 100kg (nominal)
Kenya Ethiopia Uganda