dairy price policies in north america - results and ... · dairy price policies in north america -...
TRANSCRIPT
Jordbrugs!3konomi kIn, titut
Dairy Price Policies in North America
Rapport or. 10
- Results and Experiences
J OJ'( I bru ~s(1k ( lIlOI1l isk I nsl i II I r
Ra Pilon Ill , I ()
Dairy Price Policies
in North America
- Results and Experiences
(l1lvd cLlI1!\k sammendrag)
/111/\ l1t1l1S1' 11
I korlllll is, illil !ins LI I H I IILI Sh() ldI1I1 1gS"cl~bhc lS F()]-i;lg I \~)ill'nlla\ I I I q:-{:!
JORDBRUGS¢KONOMISK INSTITUT
Valby Langgade 19
2500 Valby
TLF. (01) 304522
ISSN 0107 - 5357
FO RORD
De fo r tSat store o mkostn ~ nger i Eorbi ndels e me d overskudde t
aE rne j erip r odukter i EF er n l ed ni n ge n t il de t t e studie af
m ange'r~gE reg u leringer og ~nd g re b i me j e r i pr oduktsektoren i
USA og Canada. Kendskab til e r fa ringe rne i ra Nord a merika er
u tviv l somt ny~t i gt i _orb i ndelse me d ~n d ringe r l EF ' s politlk
for me)eriprodukter .
Publlkatio n en er u d arbej d et i fo r b in d e l s e me d f o r fatter e ns
stud~eophold l USA , hvo r f o r den publice r es pi e n g e lsk. Der
er dog aT omiactende uansk samm en d rag .
Jordbrugs~konom~s~ In~tit u t . j ul i 1~ 8 2
Ar n e Larsen
ACKNOWLEDGMENTS
I would like to thank the Department of Agricultural Econo
mics at Michigan State University for giving me the opportu
nity to study at the department from September 1980 to Dec
ember 1981. Particular thanks to Professor Vernon L. Soren
son, MSU, for his assiitance in the planning of my study and
for his suggestions in prepering this report.
I would also like to thank The Danish Agricultural and Vete
rinary Research Council as well as NATO Science Fellowship
Programme for providing the necessary financial support.
Thanks also to Dr. Arne Larsen, Director, Institute of Agri
cultural Economics, for encouragements and assistance during
the preparation of my study in the U.S.
Institute of Agricultural Economics, July 1982
Jens Hansen
CONTENT S
1. Introduclion 7
PII.RT I. DAIRY FARMING AND DAIRY PR ODUCT CONSU MPTION IN THE
3.
UN ITED STATES AND CANADA .•.•..• . ....... 0........ 11
Patt~rns and Trends in Dairy Farmin g ... .........•. 0 •• 12
2. 1. Structure or dairy f arming ........ ........... 0.. 12
LocatLon of dairy far ming
Trends Ln mLlk product i on
20
23
2.4. PaCt.erns of product io n and r",sou r ce use .......• 23
2.5 . Technology and Product i v i ty ... .................. 31
2.G. Trends in prLces of milk and in prices of
r.,sourc .. s 34
Pat terns and Trends in Da i r y Produc t Consumption 37
PART II. DAIRY PRICE POLICIES I N THE U ITED STATES AND
IL
4.
5.
B .
6 .
CANADA ....•...•. .......•........... ..........
UNITED STATES
PricE Support of Manufacturing Mi lk
4 . 1 . Obj""c iVE<s . pri c ing , and oper ti o n
43
43
44
44
4 . 2 . Impacts .•. . .......•..........•.... • ....•...•.• 0. 49
~larketing urders for F luid Mil k •..•••.•••••••••• ....
5. , .
5.2.
Object i ves , p r Lc~ng , and ope rati o n ••... ........
Lmpac ts .. . ... . ..•...... . ..•..•.••.•.• • •• • 0 •••
CANADA
Manuta.Cl.ur~n'l Mi lk Market •.•••••• . • • ••. .•• • • .. •• ..• >.
6. 1. Market vr~c~ support nd direct su b sidy payments.
6.2 . Subs~dy El~gLb~lity Quotas ... • . •• .. .....• .. •••.•
54
54
57
63
64
64
70
6.3. Market Sharing Quotas ..............•...........• 71
6.4. Policy impacts ... • .••..................•........ 77
PART III. IMPLICATIONS OF DIFFERENT DAIRY POLICY INSTRUMENTS
7.
8 .
IN RELATION TO THE EUROPEAN COMMUNITy........... 83
The Problem of Surplus Agricultural Products ......••..
Dairy Policy Instruments •.........••............•.•..
8.1. Direct subsidy payments ..•••...............•••..
8 .2.
8.3.
8 .4.
Price discrimination
Levies on milk production
Individual producer quotas
83
86
86
87
88
89
SAMMENDRAG..................................... . ............ 93
Malkekv~gsektoren og forbruget af mejeriprodukter i
USA og Canada ..........................••.......... 94
Markedsordninger for mejeriprodukter i USA og Canada 97
Effekten af forskellige markedspolitiske instrumenter
i relation til overskuddet af mejeriprodukter i F~lles-
markedet 10 3
BIBLIOGRAPHY .....••••..........••••• •.... ..........•. •.•.. 1 U9
7 -
1. Intr o duction
The European Communi~y is facing a prob lem of substantial
surplus of da1ry products. The price suppo rt policy f or dairy
products, whi ch is i n ~ e nd ed to support farm pr ices of milk
and farm incomes, encourages farmer s to expand milk production
in excess of LnternaL dema nd. Si nce t he ou t lets f or surplus
dairy produc t s are limited , the price po l i c y involves large
expendi t ures. The p resen t pric e policy , the r efore, seems
insufficient as a means to insur e dai r y farme r s an acceptable
lncome without crea t ing a substa ntial s u r plus of dairy
products, the disposal of whi c h req ui res l arg e expenditures.
In view of th is situatio n, i t might be app r opriate to
supplement the present dairy pol i cy by measur es to reduce milk
production or to increase interna l co nsumpti on of dairy
products so as to reduce o r e l iminate the surplu s of dairy
products.
An examina~ion of rlalry price po l i cies i n the United States
and Canada may i ndica t e possl ble sol ut ions to the problem o f
surpl us da i ry products i n ~he Eu r opean Communi ty. The dairy
price policies in boch these coun t r i es comp r is e separate
prog r ams for manufac t ur i ng mi lk and f lui d milk.
The pric e suppor t programs for manufa e Lur i ng mi lk in Ca na da
and particularly that in the Uni t ed St ates ha v e much in c ommon
w~th the pri ~ e SUPPO&t pro g ram for milk in the European Com
munity . hl! t hese progra ms , for i nstance, main tain farm pr ice s
of milk above a mi n ~mum level by offers t o pur chase manufactu-
red da~ry products at pre-de t er mi ned prices .
port program for manufacture d mi lk di ffe r s ,
The Cana di an s up
however, from EC's
program 1n two respects : First ly, by applyi ng a mar ke ting quo
ta p l an . Secondly, by comprising a d i r e ct subsidy payments to
f rmers to supplemen t Lhe mdrket re tu rns . The quota plan con
trols mi l k product1on a n d , in s o doing, llmit s the fundS
required to suppo r t the d s po s al o f su r plus p r o du c tion. The
direct subsidy makes it possible t o low e r c on sumer prices of
man uf actured ddiry produc ts a nd, thereby , t o inc rea se domestic
- 8 -
consumption. The United States program for manufacturing milk
does not apply any quota plan nor any direct subsidy.
The United States and the Canadian programs for fluid milk
attempt to enhance producer returns by establishing prices for
fluid milk substantially above the prices of milk used for
manufacturing purposes. This form of price discrimination
takes advantage of the fact that the demand for fluid milk
products is more inelastic than is the demand for manufactured
dairy products. Thus, although the dairy policies in the
United States and in Canada have much in common with that in
the European Community,
apply some instruments,
the dairy policies in these countries
not yet applied in the European
Community. It is of interest to examine whether these
instruments could be used in the EC to help solve the problem
of surplus dairy products.
The supply as well as the demand of dairy products are affected
by several factors. One of the major factors affecting the
supply is the possibilities for shifting resources, material
as well as human, from dairy farming to other lines of farm
production or to other sectors of the economy. These
possibilities for removing resources from dairy farming
depend to a large extent of the structure and the organization
of dairy farming. Larger farms, for instance, are usually
better able to adjust production and resource use in response
to new technologies and to shifts in relative factor prices
than are smaller farms.
The structure and the organization of dairy farming in North
America differ in some respects from that in the European
Community. Dairy farms in Canada and particularly in the
United States are larger and more highly specialized than they
are in the European Community. The relative large dairy farms
in the United States might, therefore, explain why the United
States has succeeded better in limiting surplus milk
production than has the European Community.
Major factors affecting the demand of dairy products are
changes in population and in per capita income as well as
- 9 -
changes in consumer t~ste s a n d p r e f e ren ce s . Especially changes
in co n sumer Las t es a n d p ref er e n c e s hav e h a d an adverse impact
on the demand of rlalty pr o d u c t s both in No r t h America and In
t h e Europea n Commu n tty . The s e ~ h a n g e s , of c o ut ee, have
i ncreased t he d i ff i culti e s o f ba l a n cing the demand and the
su pply o f dairy products .
This report omptlces t. ilr ee pa rt s. Pa r t I d l s cribes patterns
a n d trends in da i ry farm i n g a nd in da i r y p r o duct consumption
I n the U n~ t ed S t ates and i n Can ada with pa r t icular emphaSIS
on those ttends that tend to cause i mb a la n ce be t ween supply
and demand . Part lL d_scrlbes t h e d a i r y sup p o rt programs in
the Uni t ed S tates a nd Canada and examines t he impacts of those
p rogra ms . Part III Ind i cate s Imp l i ca t i ons o f differen t dairy
policy Instrum ~ n ts I n re l a t i o n t o t h e s i t u a t i on in the
Eu ropea n Co mmu n i ty .

1 1
PART I
DAIRY FARMING AND DAIRY PRUDUC T CO S UMP TIU N
IN THE UI ITED STATES AND CANADA
The capac i ty ~o produc~ agr i c ul~u rcl l pr o du ct s in the Unit ed
Scaces and in Canada has exceed~d c ommerci a l dema nd in most
years during the last three decades. This e xC e sS capac ity is
indleated by a rat e of rdt u rn for certa i n resou~c es employed
in farming that has been si~nificantl y b e low t h e r et urn for
compa r able resourc·s . r' other sectors of the eco nomy. Other
iodications of the excess capacity are governme nt interventi ons
aLmed at curtailLnq agricult u r~l prod u cti on a s we ll as stocks
of surplus produ c ts . Tile excess capacit y r~prese nt s two major
prob ems : a resour~e allac tio n problem an d an income problem.
The resource allccatLon prob l em r e f lec ts the fa c t that total
production in the ~con~my wou l d be incrEdsed if resources were
shifled from farming tv othe L Sectors . The inc o me problem is
due to the [~ct that fdrm income , in the abs ence of government
Lntervention , wou ld be lower than wha t i s polit ically accepta
ble.
Th e excess ~apaci y in (arming in th e Unite d States and Canada,
as ~n oLher developed market ec o nomies , is root ed in conditions
surroundLny p~oduction dnd consumpt~ o n of ayri cultural products.
Hathaway (l b ) cla ims tlat ~ he excess capac i t y hdS arisen and
persist ed because of d simultaneous ex isten ce of the f o llowing
conditions: 11 rd pLd rdt~ s of technolo yic al imp r ov ements in far-
ming, 2 ) ilL9" d yl ",e o f asset f i xlty , J) a compet itiv e market
struc ure , 4) a low price el asticity o f de mand for farm
products , and 5 ) a low income e l astici t y of the demand .
Brlefly sated thOSl1 "o ndltions i nte!d c t as fo llows: The rapld
rates of tech no l ogi ca l lmp r ovements ledd t o a substantial
increase i n proauLtivlty , which 1.n t urn lesul Ls in a rapid
i.ncrease 1n aggrt:gat ", sup ply (a sh l. tt to the rlyht In the
supply c.: U1.'J ~) .
12 -
The aggregate demand of agricultural products also increases
but more slowly. This more slow increase in the aggregate de
mand is due to a modest increase in population and the low
income elasticity of demand for agricultural products.
Together, the rap~d increase in supply and the modest increase
in demand result in falling product prices and farm incomes
unless governments intervene in the market.
Furthermore this decline in product prices is seriously aggra
vated by the low price elasticity of demand for agricultural
products as well as by a low price elasticity of the supply.
This low price elasticity of the supply is caused by two con
ditions: the high degree of asset fixity and the competitive
market structure. The high degree of asset fixity inhibits a
removal of resources from farming. The competitive market
structure provides no motivation for the individual farmer to
limit production by leaving resources unused when product
prices tend to decline since his action will not prevent them
from doing so. Thus the disequilibrium problem in agriculture
is caused by the simultaneous existence of several conditions.
Part I of this analysis attempts, in the light of the above
mentioned theory, to analyze patterns and trends in dairy
farming and in dairy product consumption in North America.
2. Patterns and Trends in Dairy Farming
2.1. Structure of dairy farming
Dairy farming is a significant segment of farming in the United
States and in Canada, but its relative importance has been
declining slightly during the last two decades. of total cash
receipts from marketing of u.s. farm products, sales of milk
and cream accounted for 11.3 percent in 1978-79 compared to
14.0 percent in 1960-61. Similarly in Canada, sales of milk
and cream, inclusive of government subsidies, accounted for
14.5 percent in 1978-79 compared to 17.5 percent in 1960-61.
13 -
The structure o f farm ~ n g i n th e u .s . a nd in Can ada has change d
substantially during the l as t decades . ~h ese cha nges have led
to fewer but ldrger faems , t o in~r~ased con c e ntrat i on, and t o
increased speci llzation. The maj o r ca u ses o f th e se chang es in
the structure of Earm~ng are u n doubt ed ly the eme rgence of new
farm technolog~~s and cha nges i n r elat ive p r ic e ~ of lnput s .
Both ( f chese factors have e n c ourag e d farme r s to subst itut e
capital for lab o r , and Lhi s subst i tut i o n has re q uired a ne w
farm sttucture. FUcthecmor e , t he adoption o f n ew farm
t echnolo gies has i ncr~ase d t h e mi nimum siz e of farms and o f
e n terprises n ec~ssa ry to altain full e eonomles o f sc al e . This
also has a f fe~ted thd farm str u c ture .
Also the S ; lu c ture of dairy farmlnq has change d s ub stan tiaily.
Th~ small da~ry farms are d i sappearin g , Mn d s o a re the
s1de li ne dairy ente r pr 4 ses, whereas th e r e ma i ning dai ry farm s
are expanai n g the~r da~ry e nt e r p r i s6s ( 3 3 ). I n total t hese
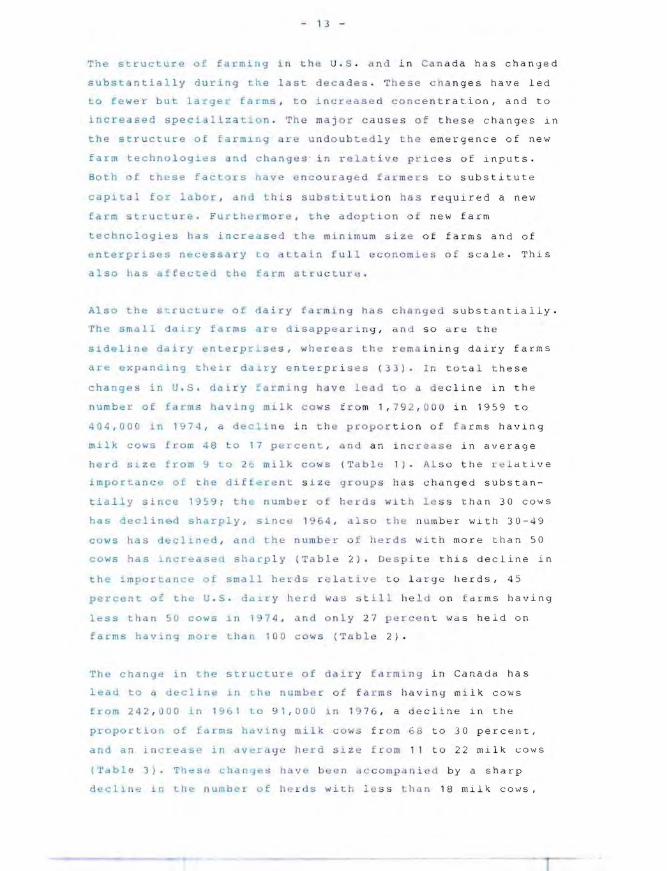
changes in U. S . dalry f~rmi ng have lead to a d e c lin e in th e
number of (arms hav ng milk cow s f ro m 1, 792 , 0 0 0 in 1959 t o
404,ODU i n 1974, a de Clin e in th e pr opo r tion of (a rms having
milk c ows from 48 t o 17 percent , and an in c r eas e in a ver age
herd s~ze from 9 to 26 mil k cows ( Tabl e 1 ) • Al so the e la tive
importd n C<l of the di f t .. re nt s ize group s has ,-,hanged subs tan-
tiaily since H59; thE numb e r of hel-ds W1 th le ss than 30 COI .... s
ha s decl i ned sharply, S1 n Cl:! 1964 , also the n um ber with 30-49
cows h as declin d , and the number of herds with more t h an 50
cows has 1nc eased sharp l y (Ta b le 2 ). De s pi t e this decline in
the ~mportan c e of small h erd s r l ativ e to l arg~ herds, 45
percent of the u . s. ' ale y h.,rd W iHi st i l l hel d on f a r ms having
less than SO cows 1n 1~74 , and only 27 p"r~l:I n~ was held on
farms having mo];/; Lhan 100 cows (Tilb le 2 ).
The change ~ n tne s~ructur~ of dair y f arm i ng i n Canadd has
lead to Ll",cline .~n t il " nurnbe r o f f a r ms hav i ng m~i k COl-iS
from 242 , OUO in 196 1 to Y 1 ,OO O in 1 9 76 , a dec li n e in the
proportion of farms havi ng milk cows f r o m 68 to 30 per c en t,
and an in c rease in av e rd ge herd siz e from 11 to 22 milk cows
(Tab l " 3). Th",s.~ ..:hd ll q"',. ha v e b "e n a~ c omp a n i ed by a shar p
dec110a 10 Lhe number of he rd s w~th les s th a n 1 8 milk co ws,
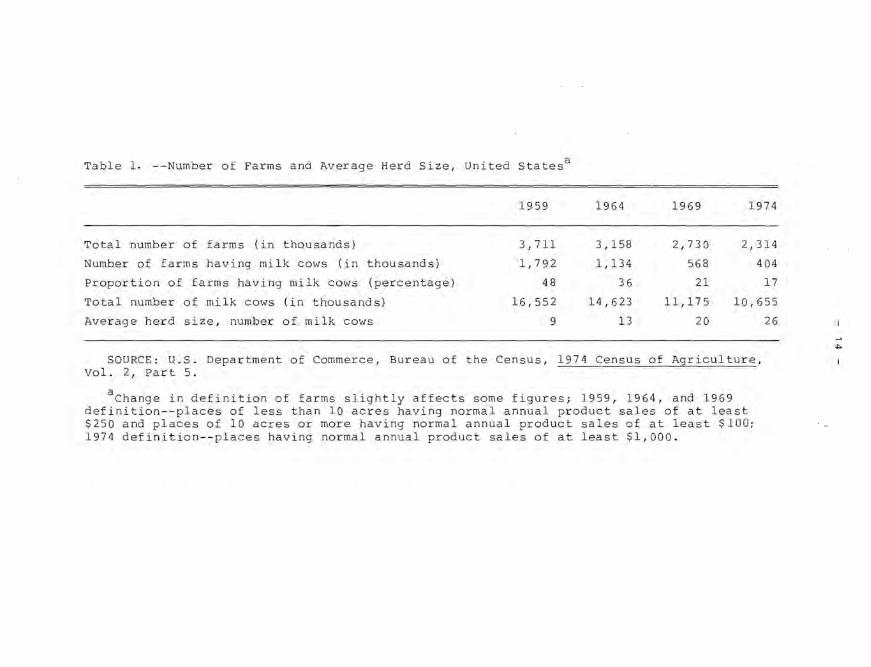
Table 1. --Number of Farms and Average Herd Size, United Statesa
1959 1964 1969 1974
Total number of farms (in thousands) 3 ,711 3,158 2,730 2,314
Number of farms having milk cows (in thousands) 1,792 1,134 568 404
Proportion of farms having milk cows (percentage) 48 3 6 21 17
Total number of milk cows (in thousands) 16,552 14,623 11,175 10,655
Av erage herd size, number of milk cows 9 13 20
SOURCE: U.S. Department of Commerce, Bureau of the Census, 1974 Census of Agriculture, Vol. 2, Part 5.
aChange in definition of farms slightly affects some figures; 1959, 1964, and 1969 definition--places of less than 10 acres having normal annual product sales of at least $250 and places of 10 acres or more hav ing normal annual product sales of at least $100; 197 4 definition--places having normal annual product sales of at least $1,000.
26
~
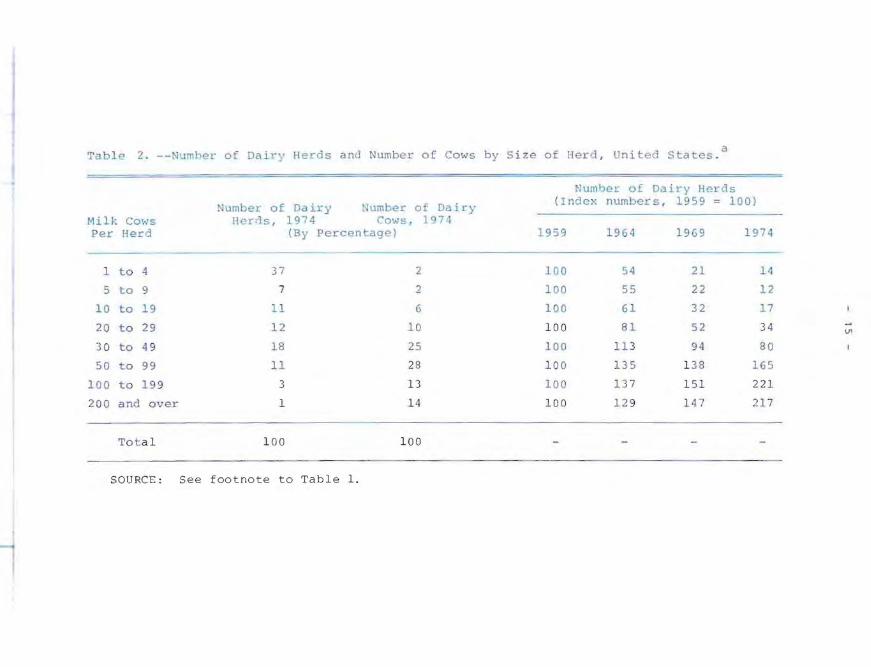
Table 2 . --Numher of Dairy Herds and Number of Cows by S i ze of Herd, United Statcs.a
Num"er of Dairy Herds
Number of Da iry Number of Dajry ( Index numbers , 1959 100)
Milk CO\olS H'?r<is, 1974 Cows, 1974 Per Herd (By Percentage) 1959 1964 1969 1 974
- - - - -I to 4 37 2 1 00 54 21 14
5 to 9 7 2 100 5') 22 12
10 to 19 11 6 1 00 61 32 17
20 to 29 12 10 1 00 8 1 52 3 4 V1
3 0 to 4 9 18 25 100 11 3 94 80
50 to 99 11 2B 1 00 135 13 8 16 5
100 to 199 3 13 100 13 7 1 51 22 1
200 and over 1 1 4 10 0 12 9 1 47 217
Tota l 1 00 10 0
SOlJRCE : Se e f ootnote t o Tab l e 1.
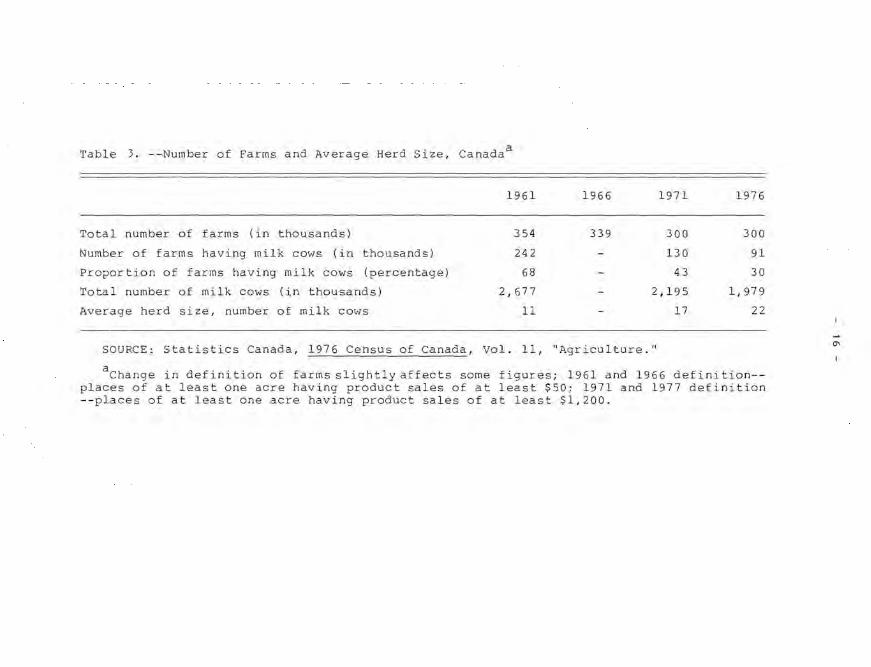
Table 3. --Number of Farms and Average Herd Size, Canada a
1961 1966 1971 1976
Total number of farms (in thousands) 354 339 300 300
Number of farms having milk cows (in thousands) 242 130 91
Pro;?or tion of farms having milk cows (percentage) 68 43 30
Total number of milk cows (in thousands) 2 ,677 2 ,195 1,979
Averag e herd size, number of milk cows 11 17 22
SOURCE: Statistics Canada, 1976 Ce nsus of Canada, Vo l. 11, "Agriculture."
aChange in definition of farms slightly affects some figures; 1961 and 196 6 definition-places of at least one acre having product sales of at least $50; 1971 and 1977 definition --places of at l east one acre having product sales of at least $1,200.
0'
T.Jb1c :. . --Nu mbc l- of Dairy !lerds an,1 Number of nait-y Cows by Siz.e of !lerd , Canada"
Number of f)a i ry Herds
~~ilk :':0\-;5
Per ile r d
1 to 2
3 to 7
8 t o 1 7
1 8 to 3 2
33 t o 62
6 3 t o 9 2
9 3 and over
To ta l
Number 01 Dairy Number of "~iry ll"'nls , 1976 COy]S, 197(,
2 4
13
1 ')
23
21
3
1
1 00
(By Percentage)
2
3
8
27
.<12
11
7
100
( I nr-lt":: :'; umber s , 1 () t 1 100)
1%1 1% 6 1971 1976
1 00 73 4 0 3 3
1 00 58 23 1 2
10 0 6 5 31 13
100 1 02 82 56
10 0 16 1 21 5 24 4
1 00 1 8 5 213 50 1
1 00 172 295 54 0
. , 1 9 7G Cen -SOU RCE : S l a tist i c s Ca nada , 1 9 7 1 Cen sus o f Ca nad a , Vo l. 4, Pa rt 1; sn s o f ~a nClcla, 1101. 11. - ---
OSe e foo l note (a) t o Tab le 3.
--.J
18 -
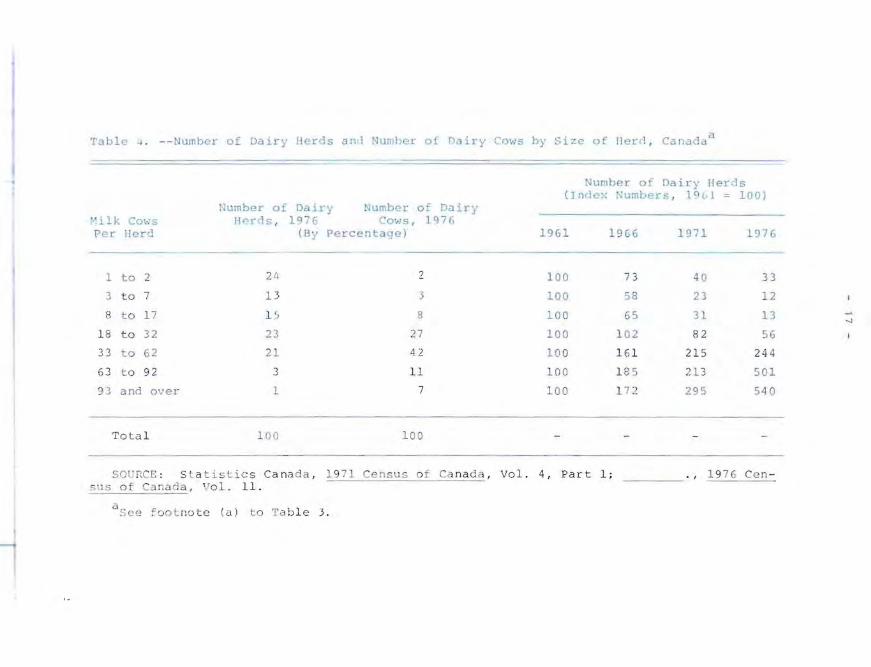
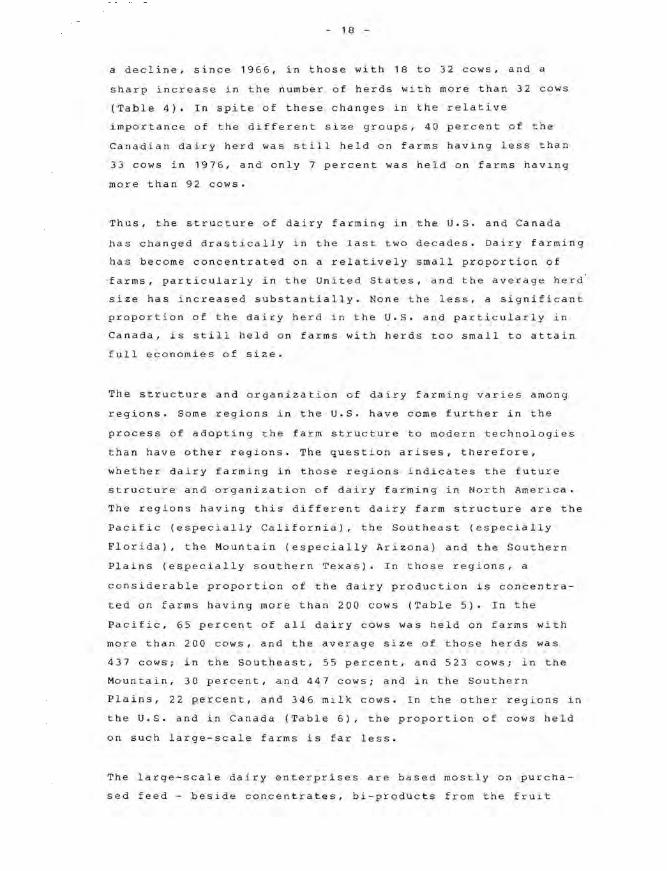
a decline, since 1966, in those with 18 to 32 cows, and a
sharp increase in the number of herds with more than 32 cows
(Table 4). In spite of these changes in the relative
importance of the different size groups, 40 percent of the
Canadian dairy herd was still held on farms having less than
33 cows in 1976, and only 7 percent was held on farms having
more than 92 cows.
Thus, the structure of dairy farming in the u.s. and Canada
has changed drastically in the last two decades. Dairy farming
has become concentrated on a relatively sma ll proportion of
'farms, particularly in the United States, and the average herd
size has increased substantially. None the less, a significant
proportion of the dairy herd in the U.S. and particularly in
Canada, is still held on farms with herds too small to attain
full economies of size.
The structure and organization of dairy farming varies among
regions. Some regions in the U.S. have come further in the
process of adopting the farm structure to modern technologies
than have other regions. The question arises, therefore,
whether dairy farming in those regions indicates the future
structure and organization of dairy farming in North America.
The regions having this different dairy farm structure are the
Pacific (especially California), the Southeast (especially
Florida), the Mountain (especially Arizona) and the Southern
Plains (especially southern Texas). In those regions, a
considerable proportion of the dairy production is concentra
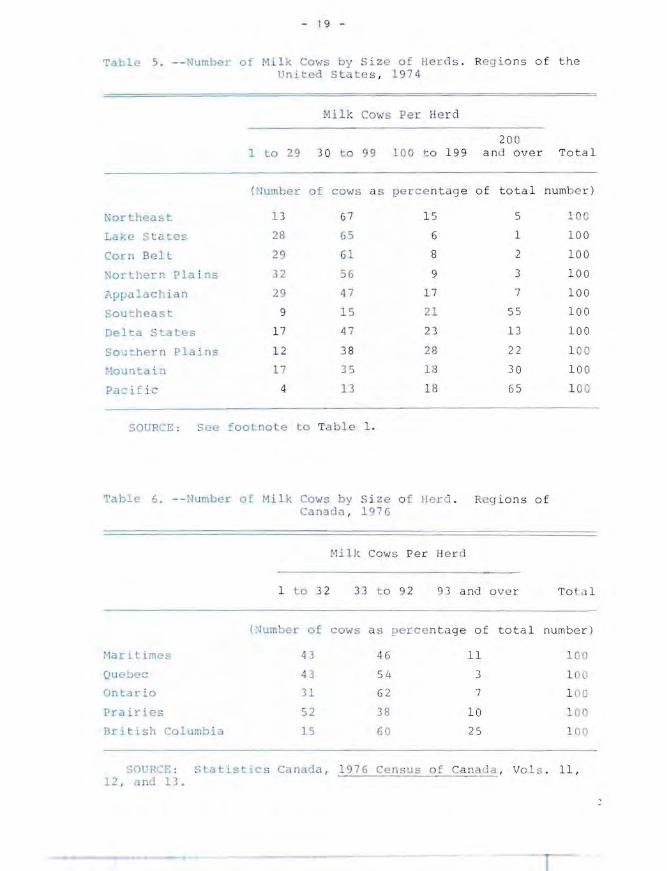
ted on farms having more than 200 cows (Table 5). In the
Pacific, 65 percent of all dairy cows was held on farms with
more than 200 cows, and the average size of those herds was
437 cows; in the Southeast, 55 percent, and 523 cows ; in the
Mountain, 30 percent, and 447 cows; and in the Southern
Plains, 22 percent, and 346 milk cows. In the other regions in
the U.S. and in Canada (Table 6) , the proportion of cows held
on such large-scale farms is far le ss.
The large-scale dairy enterprises are based mostly on purcha
sed feed - beside concentrates, bi-products from the fruit
- 1 9 -
TIle 5 . - - Number of Milk Cows by S ize of H r ds . Reg i o ns of the Uni -ed S ta t e s , 1 974
Milk Cows Pe r He rd
20 0 1 to 29 3 0 to 99 10 0 t o 1 99 an J over Tota l
(Number of cows a s percentag e of total numb e r)
Nor Lheast 13 67 1 5 5 ~O C
Lake S t ates 2B 65 6 1 1 00
Corn Belt 29 61 8 2 100
:-.lorthern P la i 05 32 56 9 3 1 00
',.PP< lachian 29 47 17 7 10 0
Sou~heast 9 1 5 21 55 1 00
Delta StatGS 17 4 7 23 13 100
Sou~hern Pla ins 12 38 28 22 1 00
:·!ounta i n 17 35 1£3 30 10 0
Pa i fi _ 4 13 IB 65 1 0 0
SOU R-:E : See footnote to Tabl e 1.
Table 6. --Number of Mi lk Cow by Si z e o f Herd . R g ' ons of Canaail , 197 6
Milk CO vl S Per fl e r d
1 to 3 2 33 t o 'J2 93 a nd over T ol 1
(~umber o f cows a s per e n t age of tota l numbe r )
Mar Lt imes 4 3 46 11 100
Quebec 43 54 3 1 00
Ontar io 31 62 7 I no Prairies 52 3 8 10 1 00
Bl- i t i S J1 Columbia 1 5 60 25 I OO
SOl R!'E: Statistics Canad a , 1976 Census o f Cana ' a , Vo l s . 11, 11 , and 13.
20 -
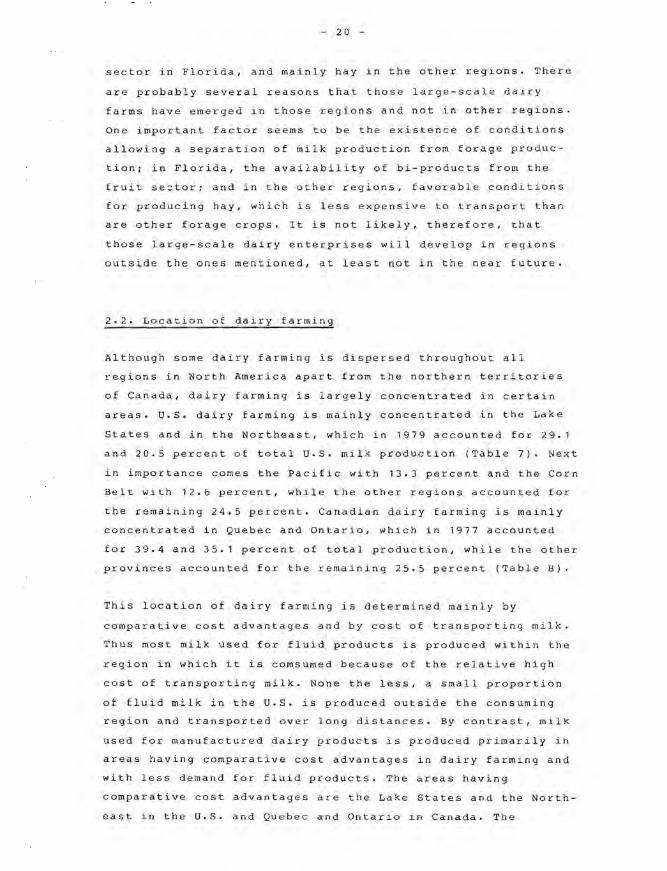
sector in Florida, and mainly hay in the other regions. There
are probably several reasons that those large-scale dairy
farms have emerged in those regions and not in other regions.
One important factor seems to be the existence of conditions
allowing a separation of milk production from forage produc
tion; in Florida, the availability of bi-products from the
fruit se=tor; and in the other regions, favorable conditions
for producing hay, which is less expensive to transport than
are other forage crops. It is not likely, therefore, that
those large-scale dairy enterprises will develop in regions
outside the ones mentioned, at least not in the near future.
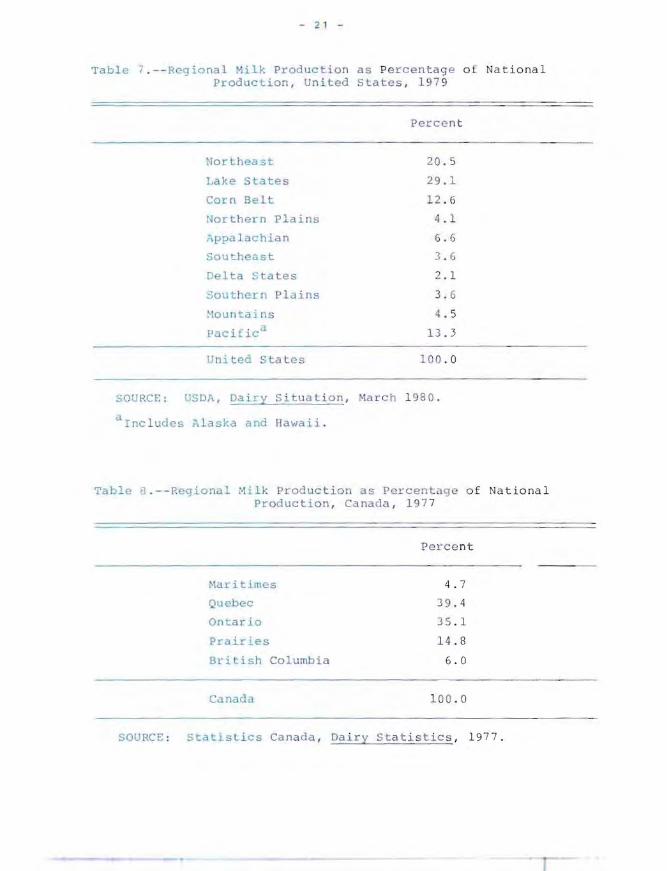
2.2. Location of dairy farming
Although some dairy farming is dispersed throughout all
regions in North America apart from the northern territories
of Canada, dairy farming is largely concentrated in certain
areas. u.s. dairy farming is mainly concentrated in the Lake
States and in the Northeast, which in 1979 accounted for 29.1
and 20.5 percent of total U.S. milk production (Table 7). Next
in importance comes the Pacific with 13.3 percent and the Corn
Belt with 12.6 percent, while the other regions accounted for
the remaining 24.5 percent. Canadian dairy farming is mainly
concentrated in Quebec and Ontario, which in 1977 accounted
for 39.4 and 35.1 percent of total production, while the other
provinces accounted for the remaining 25.5 percent (Table 8).
This location of dairy farming is determined mainly by
comparative cost advantages and by cost of transporting milk.
Thus most milk used for fluid products is produced within the
region in which it is comsumed because of the relative high
cost of transporting milk. None the less, a small proportion
of fluid milk in the U.S. is produced outside the consuming
region and transported over long distances. By contrast, milk
used for manufactured dairy products is produced primarily in
areas having comparative cost advantages in dairy farming and
with less demand for fluid products. The areas having
comparative cost advantages are the Lake States and the North
east in the U.S. and Quebec and Ontario in Canada. The
- 2 1 -
Table 7.--Regional Milk Production as Pe rcen t a g e of Nationa l Production, Un i ted States , 19 7 9
Northeast
Lake States
Corn Belt
Northern Plains
.:\ppa1achian
Southeast
Del ta S ta tes
Souther Plains
10untains
pacifica
United Sta Les
Perce n t
20 .5
29 . 1
1 2 . 6
4 .1
6. G
3 . 6
2. 1
3. 6
.; . 5
13. 3
100 .0
SOURCE: USDA, Dajry S ituaLi on , March 1980 .
alnc lud es Alaska and Hawaii.
Table O. --Pegional Milk Production as Percentage o f Na tional Production , C3nada , 1 97 7
~lal: i times
Quebec
Ontario
Prairies
British Columbia
Canada
Pe r cent
4. 7
39 . 4
35 . 1
1 4. 8
6 . 0
100 . 0
SOURCE : Statistics Canada , Dairy Sta t is t i c s , 1977.
- 22 -
Table 9.--Milk Production, United States and Canada, 1960 to 1980 (In Billions of Pounds)
United States Canada
1960 123.1 17.7
1961 12S.7 18.3
1962 126.3 18.4
1963 12S.2 18.4
1964 127.0 18.S
1965 124.2 18.4
1966 119.9 18.3
1967 118.7 18.0
1968 117.2 18.2
1969 116.1 18.S
1970 117.0 18.0
1971 118.6 17.S
1972 120.0 17.7
1973 l1S. S 16.9
1974 l1S.6 16.8
197 S l1S.3 17.7
1976 120.3 16.9
1977 122.7 17.1
1978 121.6 16.4a
1979 123.6 16.4a
1980 128.4 17.1a
SOURCE: USDA, Dairy Situation, various issues; Statistics Canada, Handbook of Agricultural Statistics, Part VII, "Dairy Statistics, 1920-73"; ., Dairy Statistics, various issues; ________ ., The Dairy Review, various issues.
aQuantities used as farm-home consumption and as feed for livestock estimated by the author.
No r c h e a st i n t h e U . S., a lt houg h having com p ar at i v e cost
ad v an t Ages 1n da Lr y fat mi ng , prod u c e s pri marily fluid milk
b~cause of it s loca tio n c l o se to l ar g e p op ul a t i on centers of
t h e Eas t Co a s t .
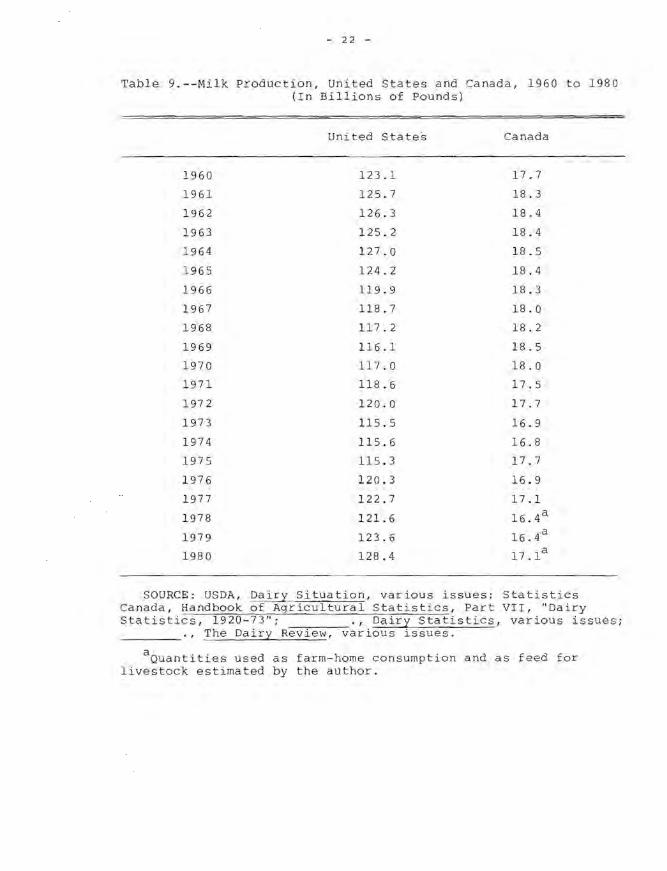
2 . 3. TL e n ds in mi l k prod u c t ion
Mi l k pr od uc ti on in the U. S. a n d Can ad a s ho wed a long-term
upward tr en d up un t il th e 1 9 6 0 '~, b ut t h i s t r e nd appears to
have c o me to a s t op si nc e then . Some s hift s h a v e occurred.
ho wever , Ln t he sho rt-t e r m tr e nd s ince 1960 . In the early
s i xties , mil k productlo n c ont i n ued an up war d t r e nd in both
count r Le s and rea c he u r e co r d h i g h s in 19 6 4 - in the U.S. of
127. 0 bil lion p o und s a nd i n Canada of 18 . 5 b l llion pounds
( Ta b l e 9 ) . Th e n ~xt t an - y e a r per i o d s h o we d a downward trend
r: e a ch ing , r:ou n 197 3 t o 19 74 , a leve l abo u t 9 percent below
the 19 6 4 r ecord s i n b o th c o untries . In the la st half of the
seve nt ie s, U. S . mi lk pr o d u c t i o n moved u pward a gain reaching an
a 1 1- 10 ime t. i 9 h i n 19 80 - per c ent a bov e th e 1 9 6 4 record level.
By c ontrast , the Ca l a d L .. n p r otl u IC t i on l: emain ed at the same
l eve l ~h r o u g h u t t h e la st h a lf of t h e s e v ent ies although
f lu c tu a ting some whd L f ro m y ea r to year .
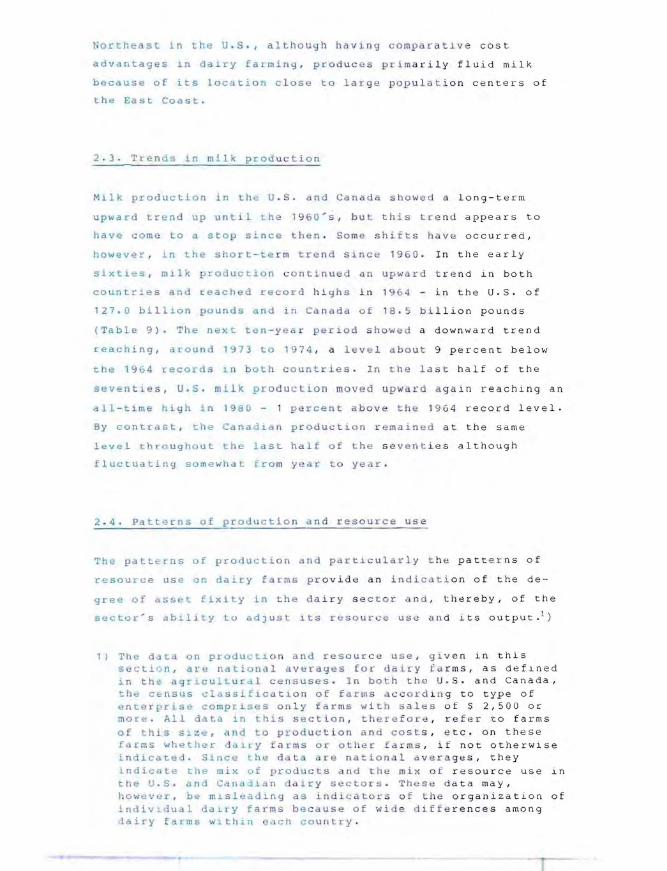
2.4. Pat t~ rn s of p roull ct ion il n d r es o urce us e
The pat Lerns of prod uc t i on a Dd par t i c ula r l y t h e patter ns of
re s o u rce us ~ on da Le y f Lms p r o v id e an in dica t i on of the de-
gre8 (Jf ets s e fi xi t y i n th e da i r y s e c tor a n d , thereb y . of the
s~ctor 's 3 b i l i t y t o ad Jus t i t s l:eso u r c e use an d its output. l)
1) Th e d d~a o n prod u~ t ion a nd r e sou r: c e use , gL v en in this s e ct l ~ n , are n a tio nal averages for d a i r y [ a rms. as defln e d i n th e a gr i cult u ra l c ensuse s. I n bot h th e U. S. and Canada, :h e ce n s u s cla s s L f ica t l on of farms a c c o r d i n g to type of e n te l' prise c omp ris,",s on l y f arnls wi t h "a l e" o f S 2,500 or more . Al l dat.a In t h is s e c t i on , tl e re f ar e , re fe r t o farms D C th i s Slze , and t o p r o d uc tion a n d co s t s, etc. on these [ a r ms wh ether d1l Y f a r ms or o tl e r f a rm s . it not otherWlse l n d l C(ite S~I I C" t he da t a are n ation a l a v e ra ges, they l nd ic a l e the mix o t p rodu c ts - n d t h e mi x o E r e source use in t h e U. S . and Cillla.lJ.a n d a iry secto r s . 'J'he s e d ata may, ho wever , be mJ. s L~ad Lng as indicator s o f Lh e organization of n d i v1~ ual da Lr y f arms b e c ause o f wide d i f f e rences among
lair y f a r ms w l. t h~n ea ch c ounLry .
- 24
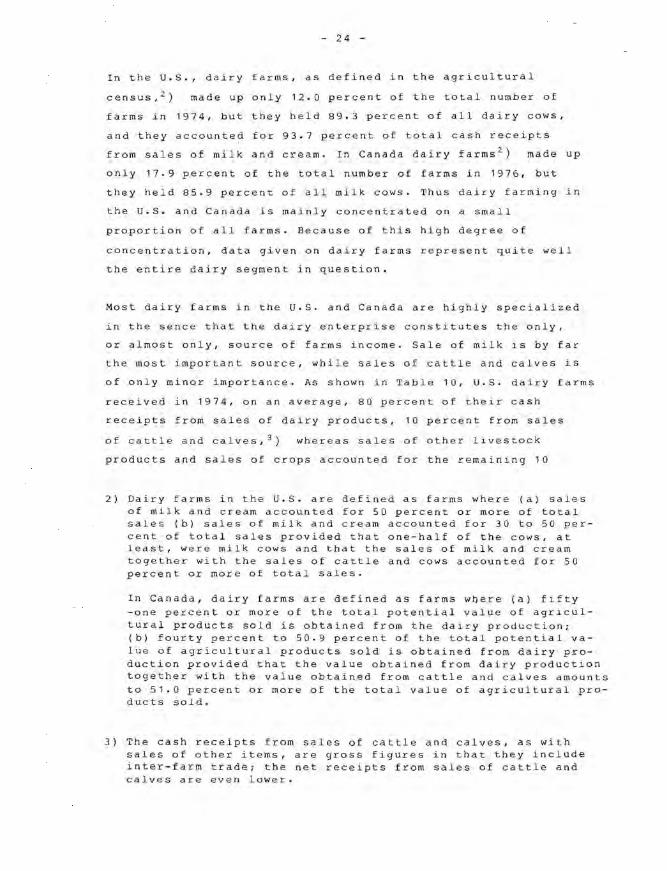
In the U.S., dairy farms, as defined in the agricultural
made up only 12.0 percent of the total number of
farms in 1974, but they held 89.3 percent of all dairy cows,
and they accounted for 93.7 percent of total cash receipts
from sales of milk and cream. In Canada dairy farms 2 ) made up
only 17.9 percent of the total number of farms in 1976, but
they held 85.9 percent of all milk cows. Thus dairy farming in
the U.S. and Canada is mainly concentrated on a small
proportion of all farms. Because of this high degree of
concentration, data given on dairy farms represent quite well
the entire dairy segment in question.
Most dairy farms in the U.S. and Canada are highly speciali z ed
in the sence that the dairy enterprise constitutes the only,
or almost only, source of farms income. Sale of milk is by far
the most important source, while sales of cattle and calves is
of only minor importance. As shown in Table 10, U.S. dairy farms
received in 1974, on an average, 80 percent of their cash
receipts from sales of dairy produ c ts, 10 percent from sales
of cattle and calves, 3) whereas sales of other livestock
products and sales of crops accounted for the remaining 10
2) Dairy farms in the U.S. are defined as farms where (a) sales of milk and cream accounted for 50 percent or more of total sales (b) sales of milk and cream accounted for 30 to 50 percent of total sales provided that one-half of the cows, at least, were milk cows and that the sales of milk and cream together with the sales of cattle and cows accounted for 50 percent or more of total sales.
In Canada, dairy farms are defined as farms wqere (a) fifty -one percent or more of the total potential value of agri c ultural products sold is obtained from the dairy production; (b) fourty percent to 50.9 percent of the total potential value of agricultural products sold is obtained from dairy production provided that the value obtained from dairy produ c tion together with the value obtained from cattle and calves amounts to 51.0 percent or more of the total value of agricultural products sold.
3) The cash receipts from sales of cattle and calves, as with sales of other items, are gross figures in that they include inter-farm trade; the net receipts from sales of cattle and calves are even lower.
- 25 -
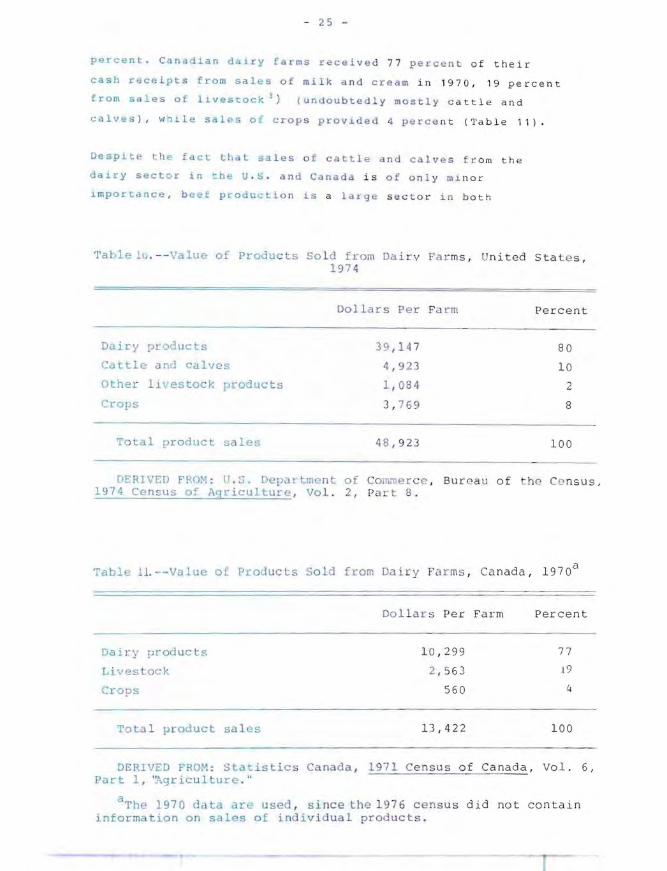
percent . C nadian dalcy farm s received 77 percent of their
casb receipts from s al es of milk and cream in 1970, 19 percent
from sa .. es of ll.vestock 3 ) (undou btedly mos t ly c at tl e and
calves ), w~il e sales Q< crop s provl.ded 4 perc e nt (Table 11)
Despite the Eact that $ales o f ca ctle and calves fr om the
dairy sector ~n t:h~ U. S . and Canada is of only mi nor
l.rnporcance, bc~f produ~tion is a 1 rge s ec t o r in b oth
TaGlelu. - - Value of Products So l d from Dai rv Farms, United State s, 19 7 4
Dollars Per Farm Percent
Dairy ,n:o ducts 39,14 7 80
Ca ttle and calves 4,92 3 10
Other Ii" estock products 1,084 2
Crops 3 , 769 8
TOlal product sales 48 ,92 3 100
D£RIVED FI' OM : U . S. Department of Com:ne rcc , Bur e au o f !1 C nsus, 1974 Census of Aqriculture , Vol. 2, Part 8.
Table l L--Valuc of Produc t s So ld from Dai ry Fa r ms , Ca nada, 197 0u
Dai]") [Jroducts
Livestock
Crops
Tota l product sales
Dol l ars Per Farm Percent
1 0 ,2 99
2 ,5 63
560
13 ,4 22
77
[9
4
100
DERIVED FROM : Sta istics Canada , 1 971 Census of Canada, Vo l. 6, Pact l , ':;gricu1turc."
a The 1970 data ace used , since the 1976 censu s did no t contain information o n sales of individual products.
- 26 -
countries. But beef production and dairy farming constitute
two almost entirely separate sectors. Dairy farming and beef
production in the U.S. and in Canada differ in this respect
significantly from these sectors in most European countries.
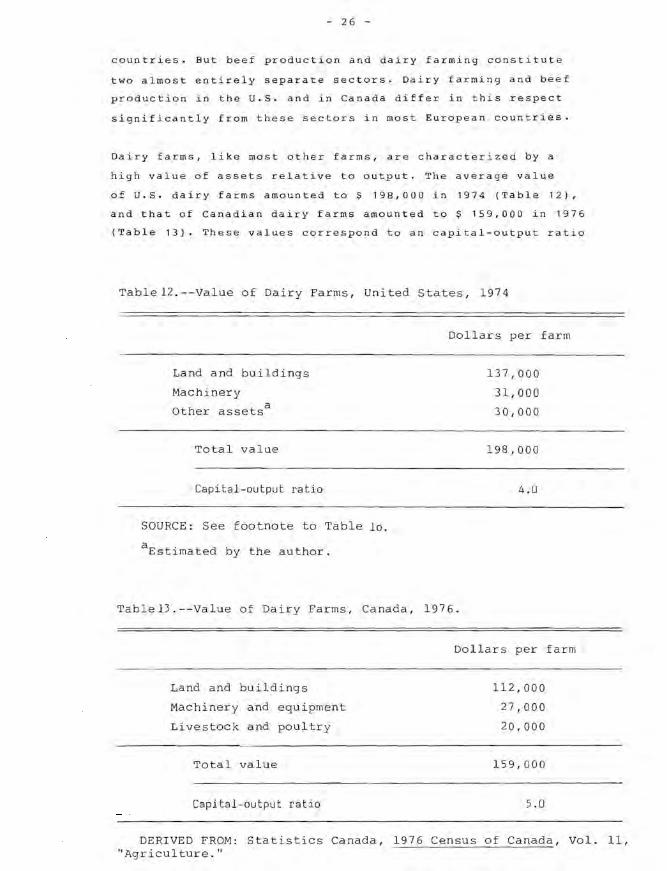
Dairy farms, like most other farms, are characterized by a
high value of assets relative to output. The average value
of U.S. dairy farms amounted to S 198,000 in 1974 (Table 12),
and that of Canadian dairy farms amounted to S 159,000 in 1976
(Table 13). These values correspond to an capital-output ratio
Table12.--Value of Dairy Farms, United States, 1974
Land and buildings
Machinery
Other assets a
Total value
Capital-output ratio
SOURCE: See footnote to Table 10.
aEstimated by the author.
Dollars per farm
137,000
31,000
30,000
198,000
4.0
Table13.--Value of Dairy Farms, Canada, 1976.
Dollars per farm
Land and buildings 112,000
Machinery and equipment 27,000
Livestock and poultry 20,000
Total value 159,000
Capital-output ratio 5 .0
DERIVED FROM: Statistics Canada, 1976 Census of Canada, Vol. 11, "Agriculture."
- 27
of 4 ~nd 5, respectively, which are hi g h c ompar ed with most
non - farm indus tr ies.
t hat dairy farming,
These high cap~ta l - o u tput r a t ios
lik~ most o t he r t yp e s of Iar ming,
indi cate
involves
a reldrively arge amount o f du r a bl e ass ets ; a characteristic
that contributes to a hi gh degree of ass e t fi xi ty in farming.
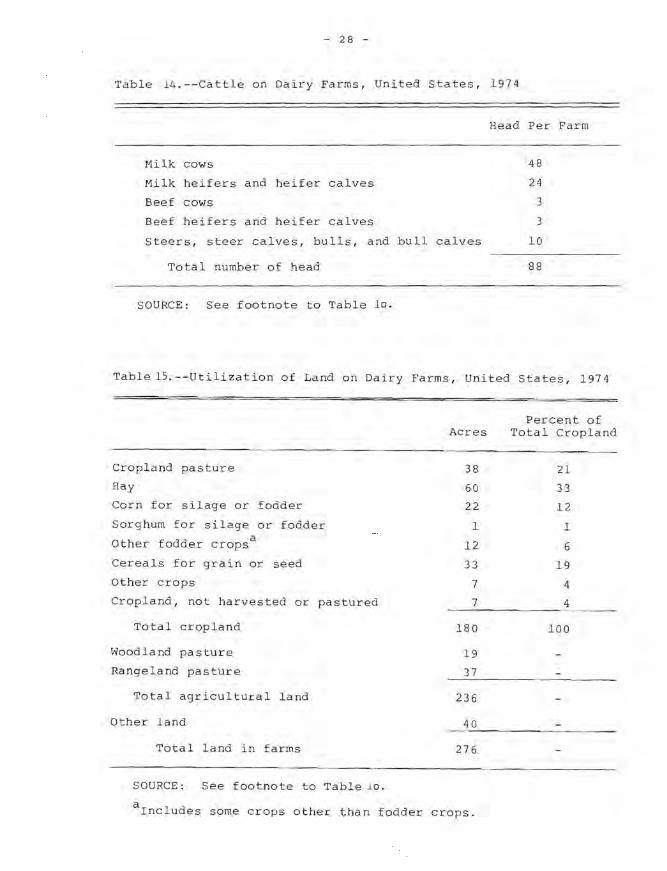
Although da iry fa lm s 10 t h e u. s . and i n Ca nada are consider
ably larger chan in most Wes t Eu r o pea n c o untries , t he major
ity are family en t e rprise s i n tbe se n ce that t h e f a mily pr o
vides a l l o r most of t he l a bor i nputs . On U.S . dairy f arms the
herd size averag~d 48 milk cows , and t he c r o p l and ave r aged 1 8 0
acres ~ n 1974 (T ble 14 and Tab l e 1 5) . The c orr e spondl.ng
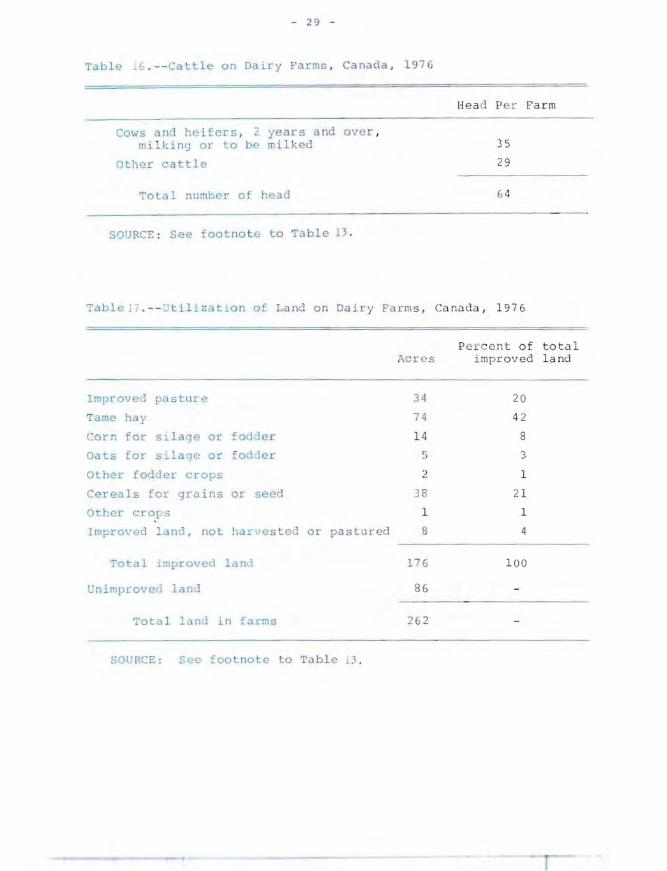
figures fo r Canadian dai ry far ms we re 35 milk cows an d 176
acres of i mprov ed land (Ta bl e 1 6 and Tabl e 17). Although the
daIry en t er p rise consLitutes t h e only o r almos t t h e only
source o f income on uairy fa~ms, th e dairy ent e rp rise is not
the on ly lmportan~ enterp r is e on th~se farms . Mos t da i ry farms
selll produce all or most of the i r fee d requi rement . The
extent to which dalry f a rm i ny relie s on hom e - g rown feed and,
thereby , on farm land is i ndic a ted by the l and use, shown l.n
Tables 1 5 and 17. 01 Lot al cropla n d on U.S . da ir y fa rms
averag1ng 180 a.;r.,s, 2 1 percent wa s used for past ure, 33
percent f r hay, 13 p~rcent for corn and sor g hum f or silage or
fodder , 19 petcant for cerea ls , an d th e remainin g 14 percent
waS used for o th er c rops or was left i d l e . DE total improve d
land on Canadian dal.~y farm~ averag i n y 176 ac res , 20 percent
'""as us ed for pasture , 42 perce n t for hay , ' 1 per cent for corn
and oats for si lage or odder, 21 per c ent for c e redls, whereas
the rema i ning 6 percent was used for othe r cro p s or was l ef t
idle . This reldtively la l-ge land base and tIll S larye
proportion of land used f or fee d crops show that dairy farming
in the U.S . and in Cana da is heav i l y dep~nde n t on home -gr own
feed and on :a nd. Nond the les s , the long-run trend in som e
reg:ons or the U.S. h s been to ward l e ss d e p e nd e nce on la nd.
Par~icularly large s~dle [arms in Fl o rida , sou ~ he rn Texas,
Arizon dnd California often pur c hdse all o r most o f the feed
requirement , c ncenLr tes as we ll as fu r age ( '18 ).
- 28 -
Table 14.--Cattle on Dairy Farms, United States, 1974
Head Per Farm
Milk cows 48
Milk heifers and heifer calves 24
Beef cows 3
Beef heifers and heifer calves 3
Steers, steer calves, bulls, and bull calves 10
Total number of head 88
SOURCE: See footnote to Table 10.
Table 15.--Utilization of Land on Dairy Farms, United States, 1974
Cropland pasture
Hay
Corn for silage or fodder
Sorghum for silage or fodder
Other fodder cropsa
Cereals for grain or seed
Other crops
Cropland, not harvested or pastured
Total cropland
Woodland pasture
Rangeland pasture
Total agricultural land
Other land
Total land in farms
SOURCE: See footnote to Table 10.
Acres
38
60
22
1
12
33
7
7
180
19
37
236
40
276
arncludes some crops other than fodder crops.
Percent of Total Cropland
21
33
12
1
6
19
4
4
100
- 2 9 -
Table~ . - -Cattle on Dairy Fa r ms , Can~da , 1 97 6
Cows and he i fers , : yea rs a nd over , mi 1kins or 0 be mi l ked
other cattle
To l al number of head
SIJURCE : See footno t e to Table n .
Head Per Farm
35
29
(; 4
Tablej 7 . -- ~ til ization of Land on Dair y Fa rm s, Canada , 197 6
Improved pasture
Tame hay
Corn for s~la:je
Oats for s':'lage
or :oc.l·ler
or [odJer
}\cr s
34
7 4
14 ,. .)
Olher fodJer crops 2
Cereals for grains or seen 38
Other cro~s 1
Impro ed Ian , not harllesteG or pa stured 8
To al improve(l lanl 176
Unimproveu land 86
Tota l _and in farms
SOURCE: ee foolno e to 'I'abl e 13 .
Pe rc e nt of tota l improved l and
20
42
8
3
1
21
1
4
1 00
- 30 -
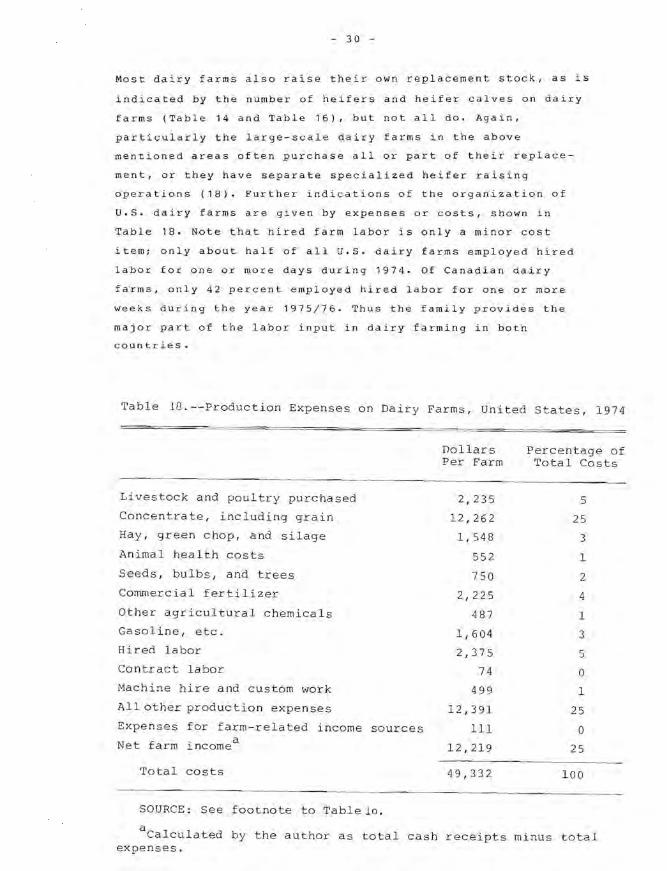
Most dairy farms also raise their own replacement stoc k, as is
indicated by the number of heifers and heifer calves on dairy
farms (Table 14 and Table 16), but not all do. Again,
particularly the large-scale dairy farms in the above
mentioned areas often purchase all or part of their replace
ment, or they have separate specialized heifer raising
operations (18). Further indications of the organization of
U.S. dairy farms are given by expenses or costs, shown in
Table 18. Note that hired farm labor is only a minor cost
item; only about half of all U.S. dairy farms employed hired
labor for one or more days during 1974. Of Canadian dairy
farms, only 42 percent employed hired labor for one or more
weeks during the year 1975/76. Thus the family provides the
major part of the labor input in dairy farming in both
countries.
Table IG.--Production Expenses on Dairy Farms, United States, 1974
Livestock and poultry purchased
Concentrate, including grain
Hay, green chop, and silage
Animal health costs
Seeds, bulbs, and trees
Commercial fertilizer
Other agricultural chemicals
Gasoline, etc.
Hired labor
Contract labor
Machine hire and custom work
All other production expenses
Expenses for farm-related income sources
Net farm . a lncome
Total costs
SOURCE: See footnote to Table 10.
Dollars Per Farm
2,235
12,262
1,548
552
750
2,225
487
1,604
2,375
74
499
12,391
III
12,219
49,332
Percentage of Total Costs
5
25
3
1
2
4
1
3
5
o 1
25
o 25
100
aCalculated by the author as total cash receipts minus total expenses.
3 1
In conclusion , most U.S. a nd Canadia n dai r y f arm s still are
characte l ized by a h~gh degr~e of a ss et f ix it y . Thi s is due t o
the fact that th~ maJority are family e n te rpr i ses and that
they are heavily dependent on land . Also , uti l i zation o f
special1zed equipment and bu i ld i ngs contributes to a high
degree of clsset fixity.
The extent to WhLCh th~ va~ ' ous resour c e s be c ome f ixed in agri
culture is affected not o n l y by fac tors wi t hin a g r iculture but
also by faclo~s o u ts1de agricult u re . Thus t he out migration of
labor from U.S . and Canadia n agricul t u re has been facilitated
up to the early 1970 -s by a prolonged period ot ra p id economi c
gtowth and l ow leve l s of unemployment. Farm la n d , in contr ast
to l abor, has had limited alternative us e ou t side agriculture,
and land , therefore, has tended to be the mo s t s La b le factor in
agr1cultur~. Only when ~conom i c condi t ion s have d e te riorated
sufficienLly to reduce the marginal v alue of land t o zero, has
land been removed from prOd uc tion . Th is ha~ happen e d in the
Northeast , one of the major dair y rdgio ns in t h e U.S. In this
region land us d for cro9s d e clined fro m a pe a k ot 21 milli on
"cres in 19~4 to a low of 12 mi l l i o n acr eS in 1969 (3 3) .
2.5. T~chnoloyy and productivity
Technological improvements in f~rming may be de f i ned as those
Changes In the produ~tion functi on for i ndividua l farms that
r~sult 1n a better Lerm of trans f ormation. Tec h no Lo gic a l
impl"OVem nts, so deflned, hav e thr",,,, important iml' a cts on
production and resource use . F i rst , t hey re sult 1 n an
increase i n total produl:tivlty, as meas u red by th e ratio
of tota l output Lo total lnput. By incre as i ng t ot a l productivity,
technological lmprovemenls lo wer unit costs of p r od uctio n.
Second, technolo<jicc intpl"OV ement.-; may change (or lea ve
unchanged) the tdtes of subst i tut ion amon y input s an d, 1n so
doln they atf~ct the op~im~l combin at i on o f i np u t s . Th ird.
=echnological 1mprovements may di rec t ( o r leave u na f fected)
the economies ot sc 1 ". BeCdU>it! of til .. t vlO last me ntioned
lmpacts , different technO l ogical improvemenc s in facm i ng often
32
have quite different implications on the organization and the
structure of farming. This seems to have been the case in
dairy farming.
Two important categories of technological improvements adopted
in dairy farming in past decades are new types of deadstock,
such as buildings and equipment, and genetic improvements of
dairy cattle. The adoption of new buildings and equipment has
without doubt tended to increase the rate at which capital
substitutes for labor and, in so doing, has stimulated a
substitution of capital for labor. Furthermore, new buildings
and equipment have tended to increase the economies of scale
by reducing unit costs more on larger farms than on smaller
ones. These technological improvements, therefore, have
stimulated individual farmers to expand production. The
improvements of dairy cattle breeds, by contrast, have left
the substitution rates unchanged, by and large, and likewise,
have not affected the economies of scale.
An indication of the impacts of technological improvements is
provided by the increase in the various productivities or out
put-input ratios (Table 19). The increase in such producti
vities in U.S. dairy farming from 1960 to 1979 was as follows
(Table 19): Total product~vity (not in the dairy sector alone
but in the entire farm sector), 28 percent; milk yield per
cow, 63 percent (from 7,029 to 11,471 pounds); milk production
per unit of feed, 18 percent; milk production per hour of
labor input, 353 percent; and forage production per unit of
labor input, 170 percent.
the same level in 1979 as
Since U.S. milk production was at
in 1960, these changes directly
reflect declines in the amount of resources use in dairy
farming. These declines in resource use were as follows:
number of milk cows, 38 percent (from 17.5 million in 1960 to
10.8 million in 1979); amount of feed, 15 percent, hours of
labor used in the dairy sector, 78 percent.
In Canada milk yield per cow increased from 5.986 pounds in
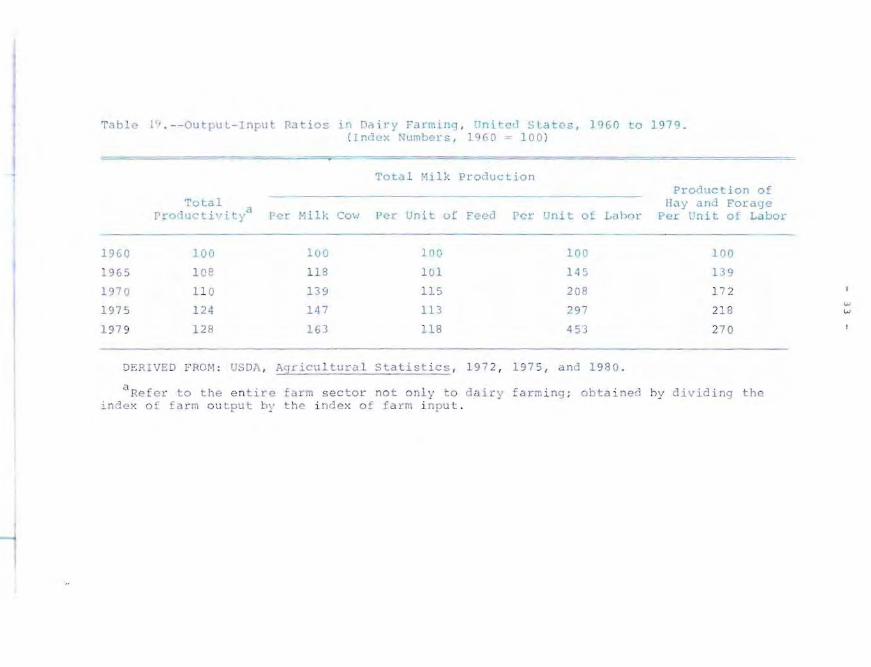
Table l ~ . --Outpul-Input Ratios in ~Hiry Farming, Unitc~ SLates, 1960 to 1979. (Index Numbers, l0G O = 100 )
Total Milk Production Production of
Total l1ilY and Forage Pro,luc tivi tya [er [-lill;. Co ... .' per Un i 1: uf F,aed Per UniL ot Lahor Per .1ni t of Labor
- - -1960 100 1uO lOCo 1riO 100
1965 lC8 118 l UI 145 139
1970 11 0 139 115 208 172
1975 1 24 147 113 297 218
197 9 128 163 118 453 270
D~RIVED FROM : USDA , Agricultural statistic s , 197 2 , 1975, and 1980 .
8Re f e r 1..0 t ile e n tire farm sector not onl y to dai r y f arm i ng ; obtaine':] hy l1i vid ing the index of fa rm oU Lput by the i ndex o f [ a rm i nput .
w w
34 -
1960 to 8.650 pounds in 1979 or by 45 percent~) while the
number of cows declined from 2.96 million to 1.97 million.
(Other data on productivity in the Canadian dairy sector are
not readily available).
Thus the productivity in u.s. dairy farming has increased
substantially during the last two decades. Total resource use
has declined, and the resource mix has changed. These changes
shows that U.S. dairy farming to a large extent has been able
to adjust production and resource use to new technologies as
well as to changes in relative prices.
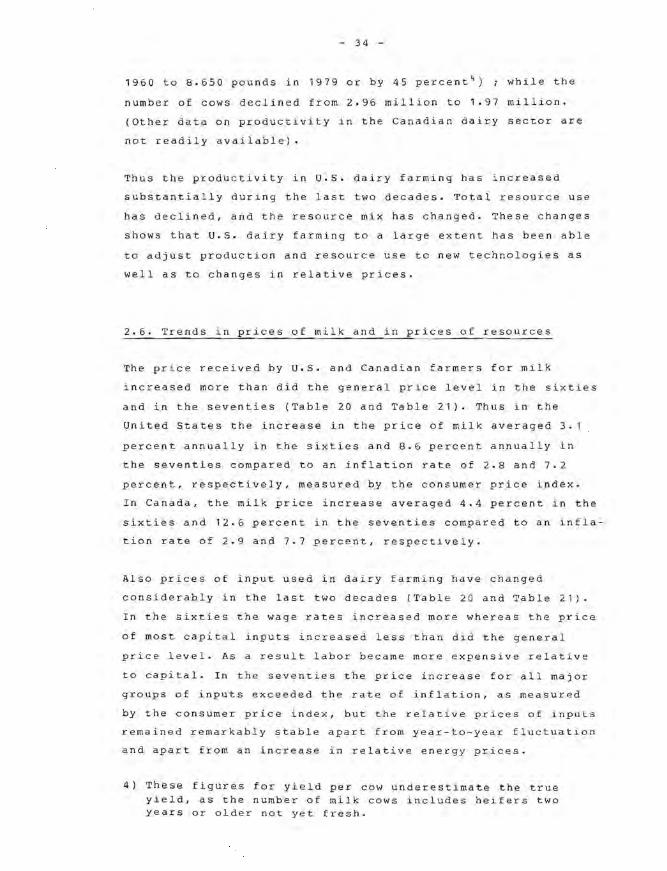
2.6. Trends in prices of milk and in prices of resources
The price received by U.S. and Canadian farmers for milk
increased more than did the general price level in the sixties
and in the seventies (Table 20 and Table 21). Thus in the
United States the increase in the price of milk averaged 3.1
percent annually in the sixties and 8.6 percent annually in
the seventies compared to an inflation rate of 2.8 and 7.2
percent, respectively, measured by the consumer price index.
In Canada, the milk price increase averaged 4.4 percent in the
sixties and 12.6 percent in the seventies compared to an infla
tion rate of 2.9 and 7.7 percent, respectively.
Also prices of input used in dairy farming have changed
considerably in the last two decades (Table 20 and Table 21).
In the sixties the wage rates increased more whereas the price
of most capital inputs increased less than did the general
price level. As a result labor became more expensive relative
to capital. In the seventies the price increase for all major
groups of inputs exceeded the rate of inflation, as measured
by the consumer price index, but the relative prices of inputs
remained remarkably stable apart from year-to-year fluctuation
and apart from an increase in relative energy prices.
4) These figures for yield per cow underestimate the true yield, as the number of milk cows includes heifers two years or older not yet fresh.
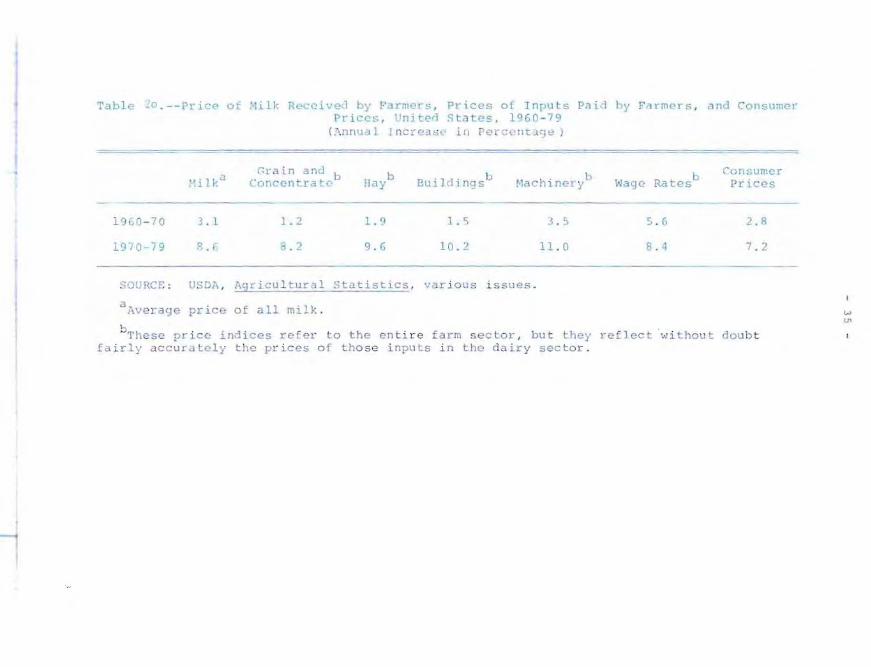
Table LO .--Prlc(> oi :-li11, Re..:clved by f'arnl'~ls , Pl' ices at Inpu t s Pilid by Farmel-s . <'I nd Consumer PricQs, Unjt0~ Sta t es . l Q60-7g
( 7I.nlllla 1 J nce(!::!;;, .. ill Perc(1llt.),)e )
rHlki:l
1 % 0-70 3 . 1
1970-79 RJ
SOt'RCE : USDA ,
(~l·ain 3 ncl b C:oncen tra t.-
1.2
B. 2
b lIiJY
1.9
Cl . G
Ag r i cu l tu r al Stat i stics ,
aAvera ge pr i c e o f a l l milk .
·1 1· b Bu~ (.:1 ngs b
~1 il c lnnery
1.'i 5 . S
1 0 . 2 1 1. 0
var i ou s i s sue s ,
b \"l ag("~ Rates
5 . 6
3 . 4
r- n ll~umc)"
Prices
2.8
7 . 2
bThese pr ic D i ndices refer to t he en ti r e f a rm s e c tor . b u t they refle ct wi thou t d o u b t fa i r l y acc u r~tely t he p r i c e s o f Lha se inp u t s i n the da i r y sector,
W IJ'
Table 21.--Price of Milk Received by Farmers, Prices of Inputs Paid by Farmers, and Consumer Prices, Canada, 1969 to 1980
Hilka Feedc
1961-70 4.4 0.9
1970-80 12.6 10.5
(Annual Increase in Percentage)
'ld' b,c BUl lngs
4.4
9.2
h ' b,c Mac lnery
2.8
8.5
Wage RatesC
6.1
9.5
Consumer Prices
2.9
7.7
w SOURCE: Price of Milk: Statistics Canada, Handbook of Agricultural Statistics, Part 7, ~
"Dairy Statistics, 1920-73;" ., Dairy Statistics, 1975, 1975, and 1977;_ Farm Net Income, 1979; ., Farm Cash Receipts, Vol. 41, No. 12. Other prices: Statistics Canada, Farm Input Price Indices, various issues; The Consumer Price Index, various issues.
aAverage market price of all milk plus supplementary payments less levies collected under provincial authority. For the most recent years calculated by the author by dividing cash receipts including supplementary payment by the shipment of milk.
bIncludes replacement but not operation expenses.
cThese price indices refer to the entire farm sector, but they reflect without doubt fairly accurately the prices of those inputs in the dairy sector.
- 37 -
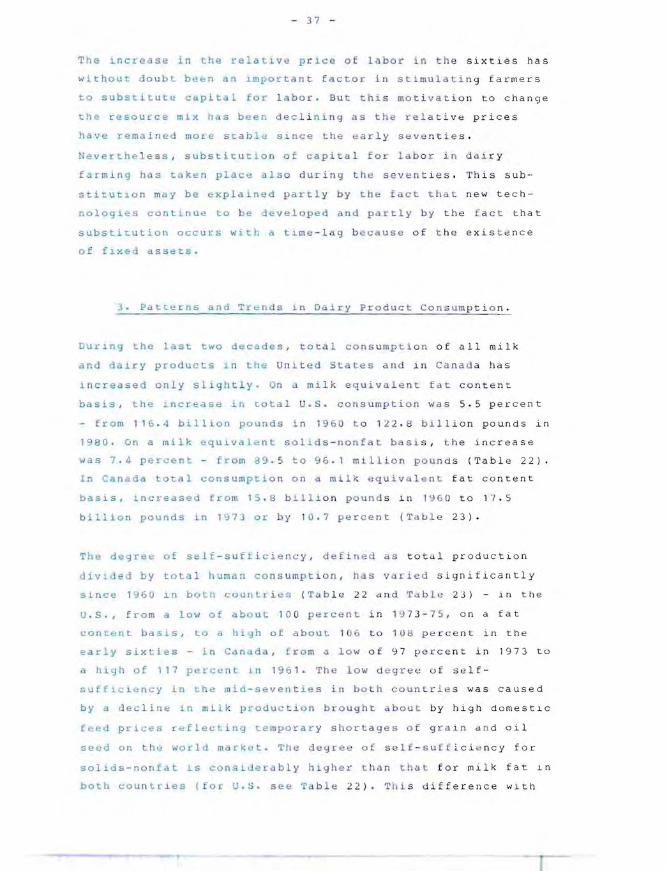
The increase in the relat~ve p r ~ce of l abo e in th e sixties has
wi th o ut do ub t been an Lmpor t a n t facto r i n sti mulati n g farmers
to s u bst i tute cap Ltal for l abor . Bu t thi s mo t i v a t i o n t o chang e
t he reso u cce mix h a s b een dec l i ning dS th e rel a t i v e pri c es
have rema in ed more s ta b lcl s i nce th e e ar ly seve nt i e s .
Neverthe l e s s , su b st it u t on o f c a pita l for lcb o r in d a i r y
far mi n9 has t ake n place al so d ur i~g t h e s even t i e s . Th is sub
stit u tion may b e exp l ained p art l y by the fa c t t h a t new t e c h
nolo9i~s COn t i n Ue to be de v el op e d and p a r tl y b y t h e f a ct that
substit u ti o n occ ur s w i th a tlme- l ag b e cause of t h e exi s te n c e
of fi x ed a S S<l t s .
3 . Pd tte r ns and Tre nd s i n Dairy P r oduct Co n s u mp ti o n.
During the last tw o de c ade s , total co ns u mp t i o n of a ll milk
an d dair y p ro d uc t s i n the Un i t ed State s and 1 n Ca na d a h a s
1 n c r eased o nl y sl ig h t l y . On a milk eqUivale n t fat c o nt ent
basis , the Lncreas~ ~ ~ tota l U. S . c o n s umpt i on wa s 5.5 pe r ce n t
fro m 11 6 . 4 b il li o n poun ds i.n 19 6 0 t o 1 2 2 . 8 b i l li o n p o unds in
1980 . On a mi lk e qu1val~nt s ol ids-nonfat basi s , th e incr e as e
wa s 7 . 4 pel:cent - fro m 89 . 5 t o 9 6 . 1 mill i on poun d s (Tabl e 22)
In Canada to t a l cons u mpti o n o n a mi l k eqUi v a len t fat c o ntent
bas i s . I nc re a sed f r om 15 . 8 b i l l i on pound s i n 196 0 t o 1 . 5
b il l ion pou nd s in 1 973 or b y 1 0.7 per ce n t ( Tabl e 2 3 ).
The degree of self - suft i cie ncy , def i ned as t ot d l pr o du c ti o n
div:ded by t OLa l hu man co n s u mp tion , h 5 v a rie d S i gn ifi c antl y
S.l.nce 196U in b oth COUll r i cs ( Tab l e 2 2 an d Tab l e 2 3 ) - in the
U.S., f ro m a lo w ':>( <lbo u t 10 0 p e rcent in 19 7 3 - 75 , o n a fat
conc"n t basis , lQ high of a bo u t 10 6 to l UB pe r c e n t in the
early s i x t i es i n Canada, f r o m a l ow of ~7 perce n t in 1 9 7 3 to
a h i gh of , 17 p~rc",n in 19 6 1. The low d e g r e e o f se lf-
suffiC i ency i n the mid-se v en t ie s i n b OLh coun Lr i e s was c a u s e d
by ~ .l e clin e in mt lk p ro duct ion brou g h t abo u t by h i g h d o mest1c
feed p r i ces r ",f Lec t in'1 t-e mpo r ar y short a ges o f g ra i n d n d o il
seed on t il': wor l d mdrk"t . Th e d gre." o f s el f -s uf .i c i ", n c y f o r
so 1 1os - no n id t 1S consiJera bly high e r tha n t hat f o r milk fat ~n
bot h (; oun Lr l..es (for U . S . s ee 'r d b le 2 2 ) . T h i s d i f fer e n c e wl.th
- 38 -
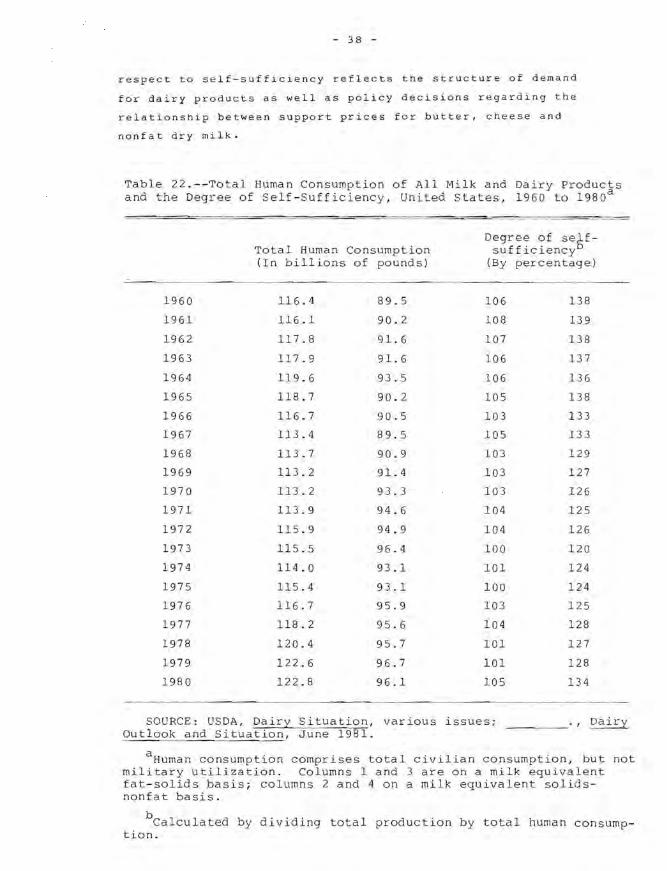
respect to self-sufficiency ref~ects the structure of demand
for dairy products as well as policy decisions regarding the
relationship between support prices for butter, cheese and
nonfat dry milk.
Table 22.--Total Human Consumption of All Milk and Dairy Products and the Degree of Self-Sufficiency, United States, 1960 to 1980 a
1960
1961
1962
1963
1964
1965
1966
1967
1968
1969
1970
1971
1972
1973
1974
1 975
1976
1977
1978
1979
1980
Total Human Consumption (In billions of pounds)
116.4
116.1
117.8
117.9
119.6
118.7
116.7
113.4
113.7
113.2
113.2
113.9
115.9
115.5
114.0
115.4
116.7
118.2
120.4
122.6
122.8
89.5
90.2
91.6
91.6
93.5
90.2
90 .5
89 . 5
90.9
91. 4
93.3
94.6
94 . 9
96 .4
93.1
93.1
95.9
95.6
95.7
96.7
96.1
Degree of seSfsufficiency
(By percentage)
106
108
107
106
106
105
103
105
10 3
103
103
104
104
100
101
100
103
104
101
101
105
138
139
138
137
136
138
133
133
129
127
126
125
126
120
124
124
125
128
127
128
134
SOURCE : USDA, Dairy Situation , various issues; Out look and Situation , June 1981.
_____ ., Dairy
aHuman consumption comprises total civilian consumption , but not military utilization. Columns 1 and 3 are on a milk equivalent fat-solids basis; columns 2 and 4 on a milk equivalent solidsnonfat basis.
bcalculated by dividing total production by total human consumption.
- 3 9 -
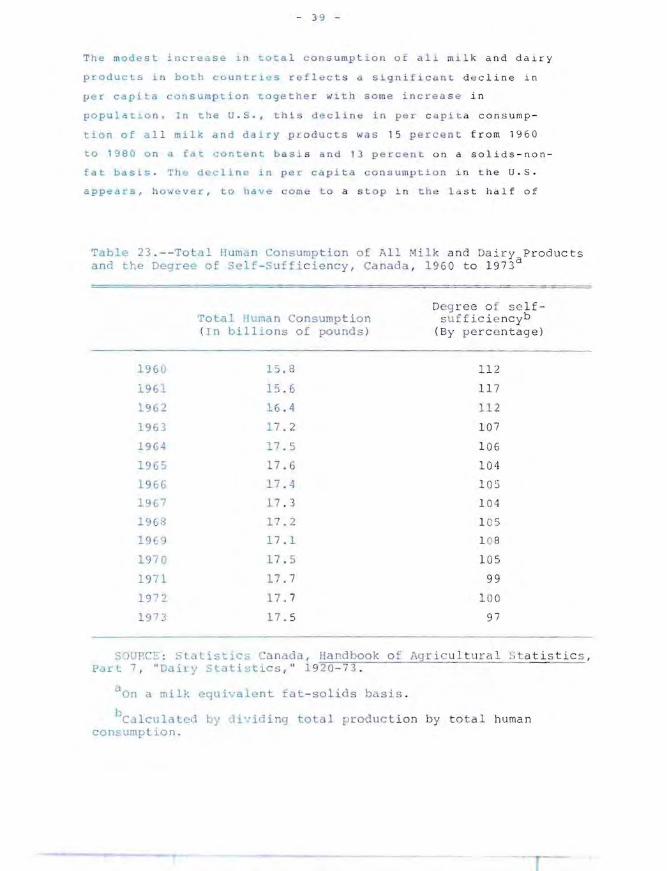
The mode s t i n crea s e 1 n tota l consu mp t i on of all mil k and dairy
prod u c t s ~n both cD u ntries r e fl e c t s a si gni f ic ant d e cline in
per ca pit a c onsu mp t i on toget he r with some i n cr e ase in
populatio n . 1n the U. S .• t h i d e cline i n per c api t a consump-
t~c n of a l l mil k a n d d a ~r y pr o ducts was 1 5 percen t from 1960
to 1 9 8 8 on a fat conte n t ba s i s a n d 13 p e rc e nt un a solids-non
fa t basi s . The dec l i n e in pe r cap i ta co nsu mpt i on in th e U.S.
apPdars . h o we v er , t o have c o me to a s top in the l a st half of
Table 23 . --To t a 1 Human Con sump tion o [ .1\11 1ilk and Dai r y Products a nd the Degree of ~e1[-Suffic i e ncy , Canada , 19 60 to 1 973 a
Deg ree o f sc1f-Total Huma n Co nsumptio n s u ff icie ncyb ( Tn b il L10 n s of pou nds ) (By p erc e ntage)
1960 lS . R 112
1961 15 . 6 117
1962 1 6 . 4 11 2
1963 1 7 .2 107
1%4 17 . 5 1 06
1965 17 .6 104
1 9 66 17 . 4 105
19 ( 7 17 . 3 1 0 4
1%8 17 . 2 1 0 5
19 ·9 1 7. 1 1 0 8
1970 1 7 . 5 105
1 <) 71 1 7. 7 99
1 ')"1 2 17. 7 l llO
1973 17 . 5 97
Sl)[JPCF: staListic .,; Ca nada , Handb ook o f Al;j r i c u l t Part 7 , " Daily SLatistlcS ,· 19 20-7 3 .
a OD a milk eqUivalen t fat-so lids ba s i s .
I-J Cu iculaLc:rl by Ji ' l di ng t o t a l produc t ion by t o t al human
consump L~o n.
- 40 -
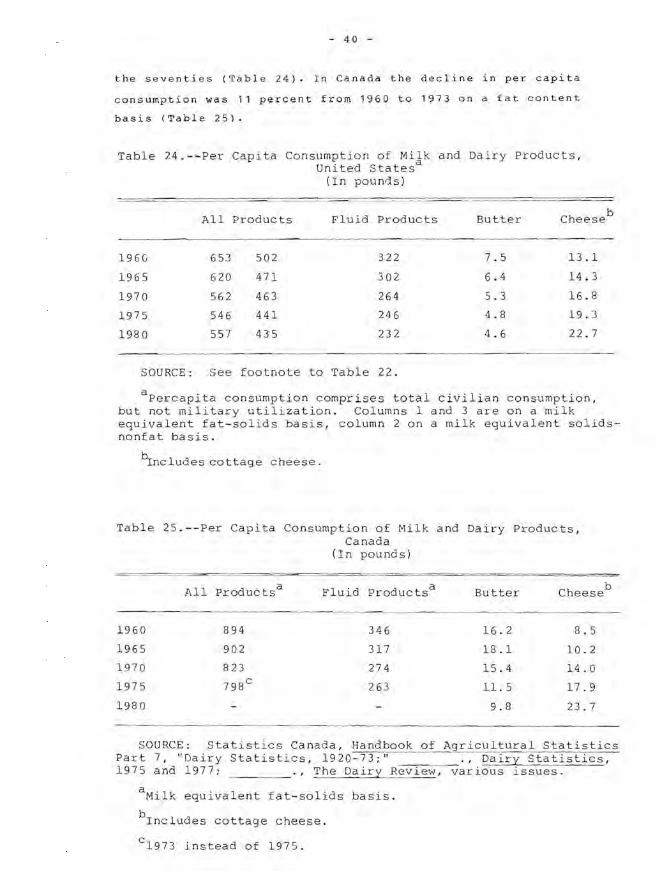
the seventies (Table 24). In Canada the decline in per capita
consumption was 11 percent from 1960 to 1973 on a fat content
basis (Table 25).
Table 24.--Per Capita Consumption of Milk and Dairy Products, United Statesa
(In pounds)
All Products Fluid Products Butter Cheese b
1960 653 502 322 7.5 13 .1
1965 620 471 302 6.4 14.3
1970 562 463 264 5.3 16.8
1975 546 441 246 4.8 19.3
1980 557 435 232 4.6 22.7
SOURCE: See footnote to Table 22.
apercapita consumption comprises total civilian consumption, but not military utilization. Columns 1 and 3 are on a milk equivalent fat-solids basis, column 2 on a milk equivalent solidsnonfat basis.
b Includes cottage cheese.
Table 25.--Per Capita Consumption of Milk and Dairy Products, Canada
(In pounds)
All Productsa Fluid Productsa Butter Cheese
1960 894 346 16.2 8.5
1965 902 317 18.1 10.2
1970 823 274 15.4 14.0
1975 798 c 263 ll. 5 17.9
1980 9.8 23.7
b
SOURCE: Statistics Canada, Handbook of Agricultural Statistics Part 7, "Dairy Statistics, 1920-73;" ., Dairy Statistics, 1975 and 1977; ., The Dairy Review, various issues.
a Milk equivalent fat-solids basis.
b Includes cottage cheese.
c 1973 instead of 1975.
- 4 1 -
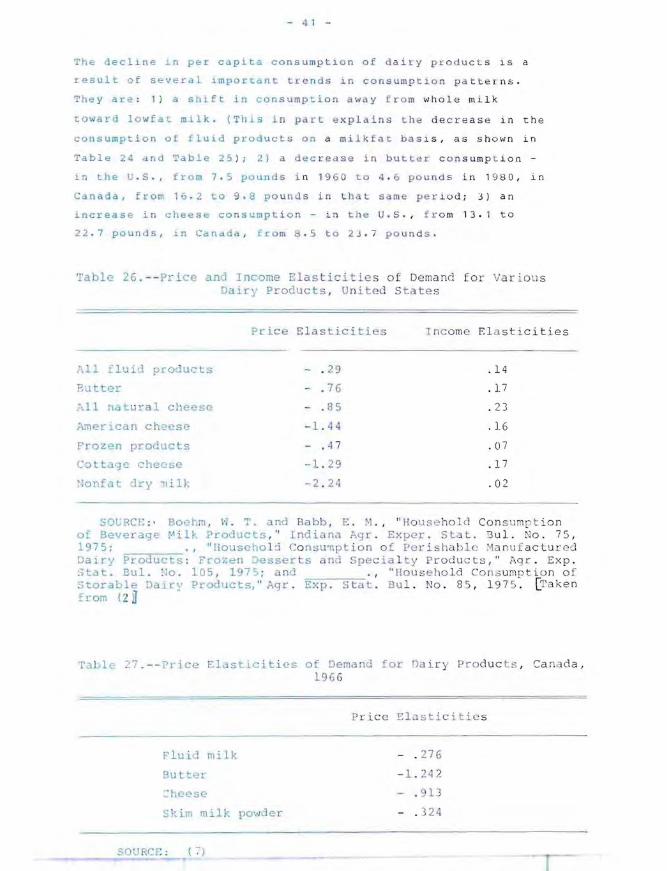
Th& dec l ~ne ~n per c apita consumpt~ o n of d a i ~y pr o du c L s is a
result of sev~ral LmpOr~ant Lr en d s ~ n con sump t i o n p a t t e r ns .
They ar,, ; 1 ) a shift in consumpt iol) a\< a y f r o m \-Ih o l e milk
t:Qward lowE 1.: milk . (This i n part e xp l a in s t h e dec r e a se ~n t he
consumption of flu i d product s on a milk far ba s ls , as s h o wn in
Table 24 nd Table 25 ) ; 2} a dec re a s e in b u t t e r c on s u mp t io n -
i n the u . S . , from 7 . 5 pOLlnds i n 19 6 0 t.o 4 . 6 p ound s in 1 98 0 , in
Canada, from 11; . 2 to 9 . 8 po u n tl s i n t hat: sa me pe r i o d; 3) an
increase in cheese co n sumpt. i o n - i n t.he U.S . , fr o m 1 3 . 1 t o
22 . 7 pounds, in C.,nd'a , from 8 . 5 t o 23 .7 po u n d s .
Tahlc 2fi .--Price an' Income Elas t i c i t ie s of Demand for '/ ar- i o ll S Dairy ProJucts , Un iteJ s t a t e s
Price El a s ticit i e s I nCome El a stic iti es
All fluiu proaucts
Butter
,:',11 n .... tural cheese
Arner 1 _an ch~ese
Frozen l.roducts
Coltage cheese
:Ionfa t '1ry lId):
- . 2 9
- . 76
- . 85
- 1. 44
- , 4 7
- 1 . 29
- 2 . 2'1
.1 4
. 17
. 23
. 16
,07
.1 7
. 02
SOl;RCr: : , Boe"m , 1-1, T, and Ba bb, E . ~ . , " Hous e ho ld Con s u mp t i o n of Beveraq_ ~ ill ?roducts ," India n Cl .l>'lr . Exper , S Lat. DuL 0 , 7 5 , 1975; ., "Househo l d COnsu'llption o f Per i sha hl' .'4anu f ac t u !:0Cl Dairy ProJuc s ; Frozen )esser t s and Specia l t y prod uc t s, " Agr . Ex p. Stilt. Bul . 110 . 105 , 1975 ; and . , "Ho use ho ld Cot1 s u mp t i o n of' S .. orable DcHJ:'y Ploollcts," Agr . Exp . Stat . BU _ . !\lo . 8 5 , 1 97 5 . [Ta k en from ! 2 il
TaJ 1e ~7 . --I'l-ic Elasticiti es of Demand for Da i r y Pr o duc t5 , Ca n d a, 196 6
P ric e E lastic it i e s
flui mi.1 k - , 2 76
- 1. 2 4 2
'!10ese - . 9 13
Skim milk powder - . 324
_____ --_30U ReF. : ( -:-)
- 42 -
These rather substantial changes in per capita consumption are
caused mainly by changes in consumer tastes and preferences.
Nevertheless, prices of dairy products and of dairy product
substitutes as well as per capita income affect consumption of
dairy products. Furthermore, the effects of dairy product
prices on consumption are of special interest in relation to
government support programs, as product prices are important
decision variables in those programs.
The response in consumption to change in price and income
varies among dairy products, as shown in Table 26 and Table
27. In the u.s. the price elasticity of demand is about -.3
for all fluid products, -.8 for butter, and -1.4 for American
cheese. In Canada the price elasticity is about -.3 for fluid
milk, -1.2 for butter and -.9 for cheese. Thus, in both
countries consumption of fluid milk or fluid products responds
less to price changes than does consumption of butter or
cheese. The response in consumption to change in income is
quite low for all dairy products (Table 26).

A . UNITED ST AT ES
- 43 -
P A R1' I I
DAI RY PRIC E P O LI ~I E S I N THE
UNITE D STATE S AND C ANA DA
The r e ate two main sector s ~n t h e U. S . dairy i ndus try - the
fl u i d ml lk sector and the m a nu f actu r ~ng milk s e c t o r alt hough
s o m ~ ~rossover o ccurs betwee n t hese t wo sector s . The market
for fluid mil k 1S supplied on l y by produc e rs of fl uid grade
milk . The market fOl mi l k u se d for ma nuf act ur e d pr od u c t s .
ma~nly b u tter . cheese an d no nf at dry mi l k , ho we ve r . is s up
p l ied partly by manufactu ring mi lk p r oducer s nd partl y by
exce s s production from fluid mi l k pr o d uc e rs .
The l wa sectors O L ra t ber gr ade s o f mi l k a r e r g Ul a t e d or
supported by separate pr og ra ms . They ar e: 1 1 Th e price support
prog ram . w'1ch p laces a f loo r u nder the pric e of manufacturlng
m1 1 k thro u gh otfer~ of p urch a sin g ma nu f ac t ure d d a i r y products
at pre-det~r mined pricQs. 2 ) The mi l k mark e t i ng order program,
which establ i shes mi nim um price s for f lui d gr ade milk
de p e n d i ng on whecher the mi l k i s us e d for f l u i d p r oduc t s o r is
dive r ted i nto manufactur Ln g use . Bot h thes e supp o r t p ro grams
origillated oU L of the c1e pr es s ed ;,co nomy in t h e 1930s , and the y
have cont i nued in mod~fie d forms up t o t he p r e s e nt .
Othe r pr o gra ms closely re l at e d to d a iry p ric e po l l c i es are
imporL restrictions , exp o rt p r og ra ms, and d o me s tic food
programs . I mpor t restrIct i o n s an d e x por t p r o gr dms are required
s i nce the prlce support p l o gr a m ma i n t a in s d o me st ic prices of
manufact u red dairy proiuct s a b o v e wo r l d mar k ~ t prlces.
Domestlc fao e! programs serve a s outlet s f or purchds e s made
under the prlce sur port program a n d , to so me ~ xte n t. also f o r
cu r re n t productJ.on. Th i s .n~ po l: t, h o we ver , f OCU5 (' S primarily o n
the price support progra m ~ nd t he mil k ma rke t iny o rct uL
progra m.
- 44 -
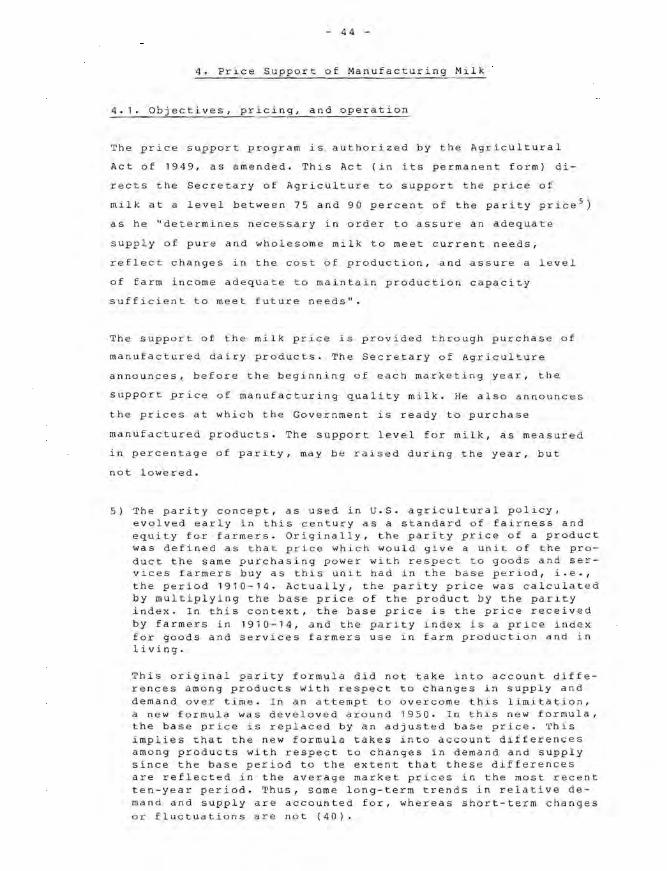
4. Price Support of Manufacturing Milk
4.1. Objectives, pricing, and operation
The price support program is authorized by the Agricultural
Act of 1949, as amended. This Act (in its permanent form) di
rects the Secretary of Agriculture to support the price of
milk at a level between 75 and 90 percent of the parity priceS)
as he "determines necessary in order to assure an adequate
supply of pure and wholesome milk to meet current needs,
reflect changes in the cost of production, and assure a level
of farm income adequate to maintain production capacity
sufficient to meet future needs".
The support of the milk price is provided through purchase of
manufactured dairy products. The Secretary of Agriculture
announces, before the beginning of each marketing year, the
support price of manufacturing quality milk. He also announces
the prices at which the Government is ready to purchase
manufactured products. The support level for milk, as measured
in percentage of parity, may be raised during the year, but
not lowered.
5) The parity concept, as used in U.S. agricultural policy, evolved early in this century as a standard of fairness and equity for farmers. Originally, the parity price of a product was defined as that price which would give a unit of the product the same purchasing power with respect to goods and services farmers buy as this unit had in the base period, i.e., the period 1910-14. Actually, the parity price was calculated by multiplying the base price o f the product by the parity index. In this context, the base price is the price received by farmers in 1910-14, and the parity index is a price index for goods and services farmers use in farm production and in living.
This original parity formula did not take into account differences among products with respect to changes in supply and demand over time. In an attempt to overcome this limitation, a new formula was develoved around 1950. In this new formula, the base price is replaced by an adjusted base price. This implies that the new formula takes into account differences among products with respect to changes in demand and supply since the base period to the extent that these differences are reflected in the average market prices in the most recent ten-year period. Thus, some long-term trends in relative demand and supply are accounted for, whereas short-term changes or fluctuations are not (40).
- 45 -
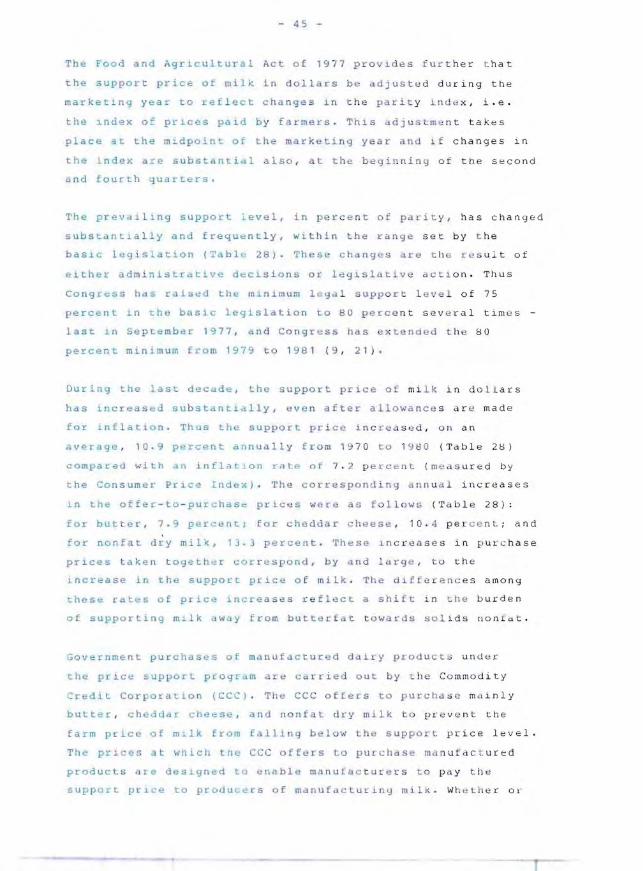
Tb~ Food and Agricultural Act of 19 7 7 p ro vL d es f ur ther t hat
th~ suppor t price of milk in d o llar s b e ad ju s te d du ri ng the
marke t 1ng year to reflect chan g e s Ln t he par i LY in~ x, i.e.
the 1ndex a! pr1ces pa1d b y farmers . This adj u s tm e nt take s
place at the midpoin of the marketi n g y e ar and if cha n ges in
the 1ndex are substanLicll also . a l t h y b e gi nni ng of th e se cond
and fourLh quarters.
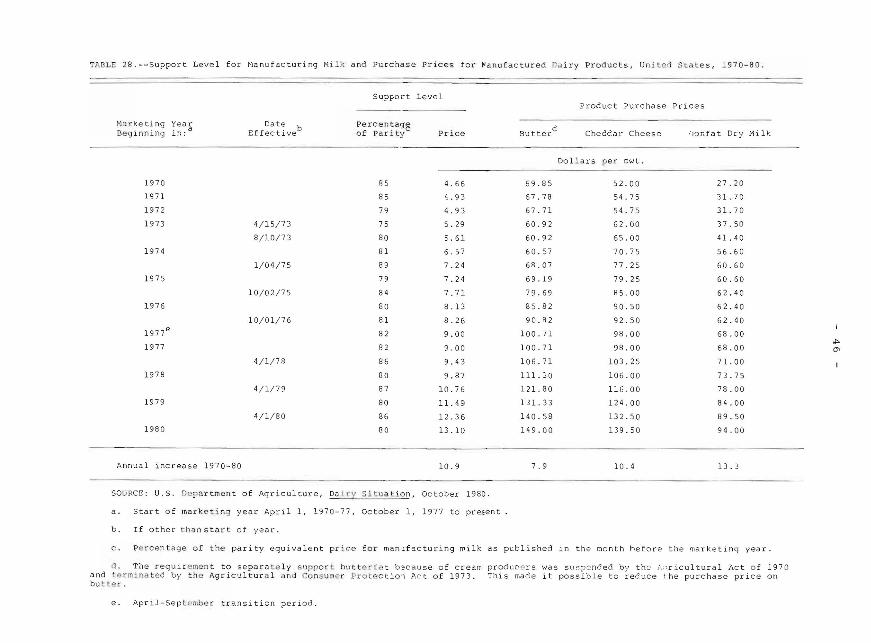
The prevd~Ling support level , i n per c e n t o f par i t y . has changed
substantially and frequent ly . wit h i n t h e ra n ge set by t he
basJ.c leg i s ation (Tabl '" 2S). These changes alee Lh e r ' s u lt of
e1ther administrdtiv e dtC1s i ons or legis lative ae l i on . Thu s
congr~ss has rais~ Lhe minim u m l~gd l s up p o r t l e ve l of 75
percenL i n The baslc legislation to 80 p erc e nt sev e ra l tim e s
last 1n September 1977 , ",no Cortgress hds extt'nded t h e 80
percent minimum from 1979 to 1 9S 1 ( g , 21 ) .
Dur ' oy the ast decade. the suppor t pr i ce of mi lk in dol Lars
has increased su b stanLLdlly. eVe n af t er allowanc t' s are made
for in f l ation . Thus tile support pr i ce i n c re asc:d , all an
average , 1 0.9 percent annua l ly f rom 19 70 to 1~ I:l O (Tab le 2l:l)
compared with dn i nfla 1 0n rate of 7 . 2 p e rcent ( me asu red by
t he Consumer Pr~ce I n de:<) . 'rh e correspo n d i ng a l n u a l i nc reas es
In the ofEer-to - pur c hds~ p r ic e s were as f 11 0 ws (Tab l e 28)
fOl' but t er , 7.9 p er ... ent; Ear cheddar chee s e , 10 . 4 perce n t ; an d
for nonfat ~ry milk. 1J.3 percent . These 1 n cre a ses in pU le c hase
pr1ces taken togeth~r cor r espo n d . b y and large . t o the
lnCL'ease in the SUppO!:T plicO;! of mi l k . The d if te Le nc es am ong
Lhese c teS o[ pricd increases r e flect a sh i ft 1n the burden
of support1ng m11k way from b utto:!t:fdt t o wa L' d s >:io l ids Ilo n f ctt.
u overnment purchases of mdnufac tu red da i ry pr o d u ct s un der
the pr l ce supporl ptOyrdm a l e Carrie d out b y r ho Co mmo di ty
Credil Corporation (CCC) . The ce e offers to purchds e m ~ inl y
buLter , ch~dddr chees~. and nonf t dry mi l k to prev e n t the
f~rm price of m11k from f l11n9 below the support p~ i ce level.
Th e prices at \,hiclt tne ec c oLters to pur-chase ma n ufac !: ured
products are aes1gnud to enable m n u fac t u r e ~ s to P d y tho:!
supporL prLce to ploJu ~o:! rs of manufacL uL i y ffi 1 1 k , Wl e t he r o~
~AnLE 2B. -- Support Level for Manufacturing Mi lk and Purchase Prices f or ~anufactured Da i ry Pr oducts , Un ited States, 19 70-BO.
Suppor t Level Procuct Purchase Prices
"'jar:~et~n g ~ea~ Date b Percentage: d Be g l nn lng 1n: Effective o f Parity Price Butter Checdar Cheese 'J"":)nfa t Dry Mi l k
Dollar s pe< cwt .
19 70 85 4.66 69.8 5 52.00 27.20
1971 85 4. 93 67.78 54 .75 31 .70
1972 79 4.93 67.7 1 54 . 75 3 1. 70
1973 4/1 5/73 75 5 . 29 60.92 62 . 00 37.50
8/10/7 3 80 5. 61 60.9 2 65.00 41. 40
1974 8 1 6.57 60.57 70.75 56 . 60
1/04/75 89 7 . 24 6R . 07 77.25 60.6 0
1975 79 7.24 69 .19 79.25 60.60
1 0/02/75 84 7.71 79 . 69 85.00 62.4 0
1976 80 8.13 85.82 90.50 62.40
10/0 1/76 81 8.26 90 .R2 92 .50 62.40
1 97 7e 82 9.00 100.71 98.00 68.00
1977 82 9.00 10 0.7 1 98. 00 68.00
4/1/78 8 6 9 . 43 106.71 103.2 5 7 1. 00
197 8 80 9 .87 111.30 106.00 73.75
4/1/ 79 87 1 0 .7 6 121. 80 116. 00 78.00
19 79 80 11. 49 131. 33 124 . 00 84 .0 0
4/1 /80 86 12.36 14 0.5 8 13 2 . 50 89.50
1980 80 13 .10 149 .00 139.50 94.00
Annua l increase 1970-80 10.9 7.9 10. 4 13.3
SOURCE: U. S. De :''':l artment of Aqr i cu l ture, Da i ry S i tua tion, October 1980 .
a . Start of mark e ting year April 1, 1970-77, October I, 1977 to present
b . If other th~ ns tar t o f year.
c. P0 rcen t age of the parity equivalent pr ice f or man~facturing milk as publ ished in the ao nth hefore the mark eting year.
Th e requ irement to separa te ly s uppo c t b!ltterfa t b~cause of cream producers was s u~ p c nded by the ~ !; ricultural Act of 19 70 and t ermina t e d by th e Agricultur a l ~nd Cons um e r Protect i o1 Ac t of 1973. This mad e it possible to reduce t he purchase price on bu l~e ", .
e. J'..pr iI- September transi ti c n per iod.
'" 0'
- 4 7 -
noc farmers actually r ecei v e t h e sup port p r ice d e p e nds on
co mpet 'tio n in thE mark~ts ( 2 1).
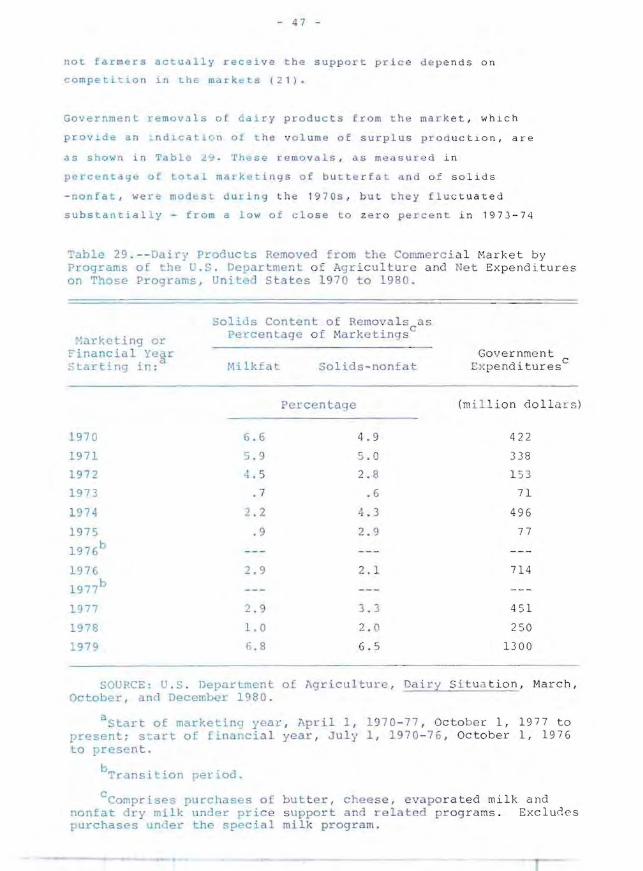
Government removdls of riairy p r o du ct s f rom t h e ma r k e t, WhlCh
provlde an _ n dlc~tlnn of t h e v ol ume o f surpl us pr o d uctlon, are
as shown i n Table 29 . These ~e mo v als , as meas u r e d in
perc~ntaq~ of to a1 mark~ti n g s of bu t t e r fat an d o f s o li d s
- nonfat , we re modbst during the 19 7 0s , b u t t h ey f l u c tuated
su b stantially - fro m a low o f c l os e to z e r o pe r c e nt in 1973-74
Table 29 . - - Dair}' Products Removed from t he Commerc i a l Harket b y Programs of he U. S . Depart ment o f Agricu l t u r e u nd Ne t Expenditures on Those Programs , United S t ate s 1 97 0 to 19 BO .
I--:arkeling or Financia l Year , . a Startl.ng l.r :
1970
1971
1972
1973
1974
1975
1976h
19 7 6
1977b
l!J77
1978
1979
Solids Content of Removal s as Pe-centage o f Mar ke ting s C
Milkfat
G. 6
5 . 9
<1 . 5
. 7
2.2
. 9
2.9
2 . 9
1. 0
r.8
o l ids - nonfat
Perc en t a e
4 .9
5 . 0
2. 8
. 6
4 . 3
2. 9
2 .1
3 . 3
2 . C'
6 .5
Governme nt Ex pendituresc
(mil l ion dolla r s )
422
3 38
15 3
71
496
77
714
4 5 1
250
1300
SOURCE: U. S . Department of Aq r i cul t ure , Dai ry S i t u a tion, March, October, and December 1980 .
astart of marketing year , Apr i l I , 197 0- 7 7 , Oc tober 1, 1977 to present ; s cart o f financia l ye a r , J uly 1 , 1 970 -7 6 , October I, 197 6 to present .
b , 1: ' , , Transl lon rerloCi.
CCornpt'lses purchases of bu t t e r, cheese , e vapo rated milk and nonfat dry milk u nder price s uppor t and re lated prog r ams. Excludes purchases under the special mi l k p rogram .
- 48 -
to around 6 percent in 1970-71 and in 1979-80 (Table 29). As a
result of this variation in government purchases, government
expenditures varied widely - from $ 71 million in 1973-74 to $
1,300 million in 1979-80 (Table 29).
Dairy products in CCC inventorie s may be sold in domestic
commercial markets if commercial market pri ces exceed support
levels by specified levels. Such sales of significant
quantities back to the trade were made in 1972 and 1975 (21).
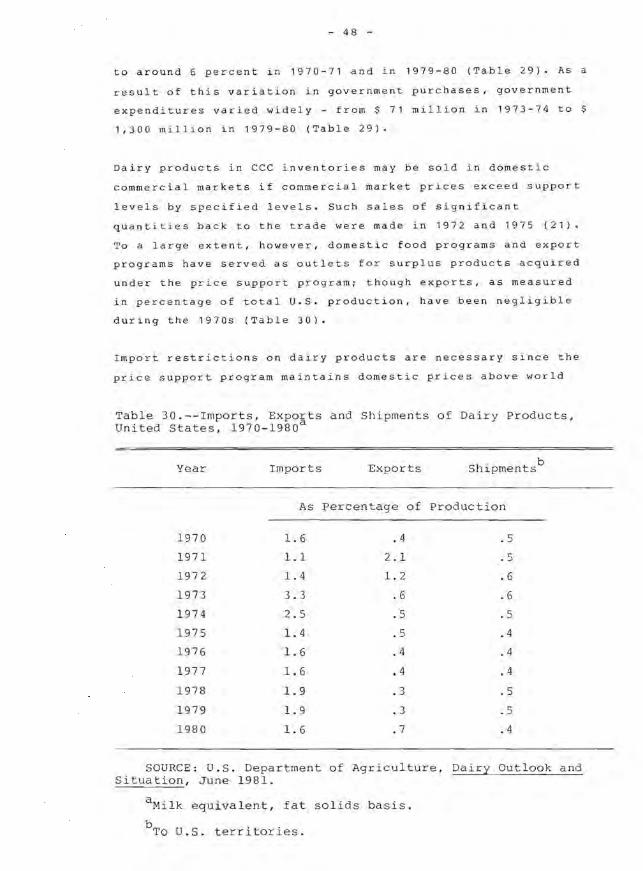
To a large extent, however, domestic food programs and export
programs have served as outlets for surplus products acquired
under the price support program; though exports , as measured
in percentage of total U.S. production, have been negligible
during the 1970s (Table 30)
Import restrictions on dairy products are necessary since the
price support program maintains domestic prices above world
Table 30.--Imports, Exports and Shipments of Dairy Products, United States, 1970-1980a
Year Imports Exports h. b S l.pments
As Percentage of Production
1970 1.6 .4 . 5
1971 1.1 2.1 .5
1972 1.4 1.2 .6
197 3 3.3 .6 .6
1974 2 .5 .5 .5
1975 1.4 .5 .4
1976 1.6 .4 .4
1977 1.6 .4 .4
1978 1.9 .3 .5
1979 1.9 .3 .5
1980 1.6 .7 .4
SOURCE: U.S. Department of Agriculture, Dairy Outlook and Situa tion, June 1981.
a Milk equivalent, fat solids basis.
b To U.S. territories.
- 49 -
m rket l e v e ls. The €x~sti n g i mpo r t r e gulat io ns on d a i ry
products can b e devided into maj or categor ~ es - qu o tas and
coun erva~ lin g dut~t!6. Impo rt quotas are , u tho r i z t! d un de r
Sacr.ion 2 2 of the )\ytl.r...ultura l Adjustme n t Act of 1 <) 33 , as
mended. This Act .llo~s res r ic tlons On i mports of ag r icu l
tural produces when necessary to prevent impo Lt s f r om
int:eri~ring with damestLc agricultural pr Lcc s u ppo rt program s.
Co untervai l ~n g dutles dre au horized by Se c t i on 3U 3 of th e
Tarlff Act of 1930. This Act direct s the Secr et ary o f th e
Treasury to impose counlervailing d u tLes ayalns t an imp o rt
i &em Lf t he production or th e e xportatio n of th e it e m ha s been
subSidiz"d (21) .
Total ~mpo r tS oE dalry products have been mod ~ Ht , a r o un d 1.5
to 2.0 in Pblcentage of to td l U. S . pr o d u ction , on a fat so li d
baSis, i n masL y ~drs (Table 30 ) . The impolLs c ons ist mai nly o f
c heese.
4 . 2 . ImpacLs
T h e prIce support p~ogram e [ f ~~ts pLi~ c ~ o f mi lk ~ n d dairy
products at al~ l~vels . I n so d OL fi g , th e program inf lu ence s
prOducLion dnd c onsumpLion dS we l l a s farm i nco me a n d consumer
real l.ncome. This secti un de a l s wi th some (')f tI ,ns ." i mp a c t s.
In man3ging the pr~C2 SUp~Olt program c o nc~r ns se e m t o focu s
nn accomplishing th- [ollowiny two objectiv~ s: 1 ) sta bi Llz ati on
of production, pr~ces and produce r return; and 2 ) enh a n c ement
of producer r~turn. A t h " rd objec t ive or r~st r i c &~ on o f
concern consLsts of cunscrdint s on government expen d ltu r e s .
The extt<nt to whl h Lh" .. e Obje c t i ves have be " n a CH ie v e d in the
past hdve been dfrecte J by preva i ling eco nom ic c n d ~ t i ons ,
<::hardcteristic of t. h e pl"ogram , and politi c a l pr ess ures .
The program undoubLedly has h~lped ke~p prl c es , p r o ductLon
dnd farm ln~om~ more stable. Prices h ave bee n p r eve n t e d f ro m
fal l1ny below the SUPPOIC level b y CCc p u rchases of surp lus
product.s d n d prlc's 11aVt< been prev t! nted fro m i nc r ea sing mo r e
50 -
than they did by sales of CCC stocks of dairy products back
in the trade (21).
The price support program did not succeed, however, to provide
stability in milk production in the early seventies. As feed
prices escalated in these years, the parity price of milk
reflected only partly the resulting increases in the costs of
milk production. This underevaluation of cost increases was
due to the fact that the parity index (the mover of the parity
price) reflects price changes not on inputs used in dairy
farming but on purchases made by all farmers of items used in
production as well as in living. These "baskets" of goods and
services differ s ubstantially: feed (including pasture and
roughage) has a weight of about 50 percent of dairy farm costs
but amounts to le ss than 20 percent of all purchases made by
all farmer s (21). The parity price of milk reflects,
therefore, only partly cost increases if they are caused
mainly by increases in feed prices, as was the case in the
early seventies. This limitation of the parity formula is
widely recognized, and other standards, such as costs of
production and prices of inputs used in dairy farming, are
being discussed to replace it (37).
The support program would undoubtedly be better able to
stabilize milk production as well as farm incomes if the
parity concept were replaced by a more appropriate standard.
But price support would not in all situations be able to
insure a stable production as well as stable farm incomes even
if a better standard was used. It is necessary that the
support price reflects fluctuations in feed prices in order to
insure a stable milk production. Such changes in the support
price would, however, result in changing farm incomes since
most dairy farmers produces most of the feed themselves~ Thus
price s upport alone is not in all situations able to insure a
stable production as well as stable farm incomes.
The price support program does not only provide some
stability in the dairy sector; it also raises domestic prices
of dairy products above world market prices. In so doing, the
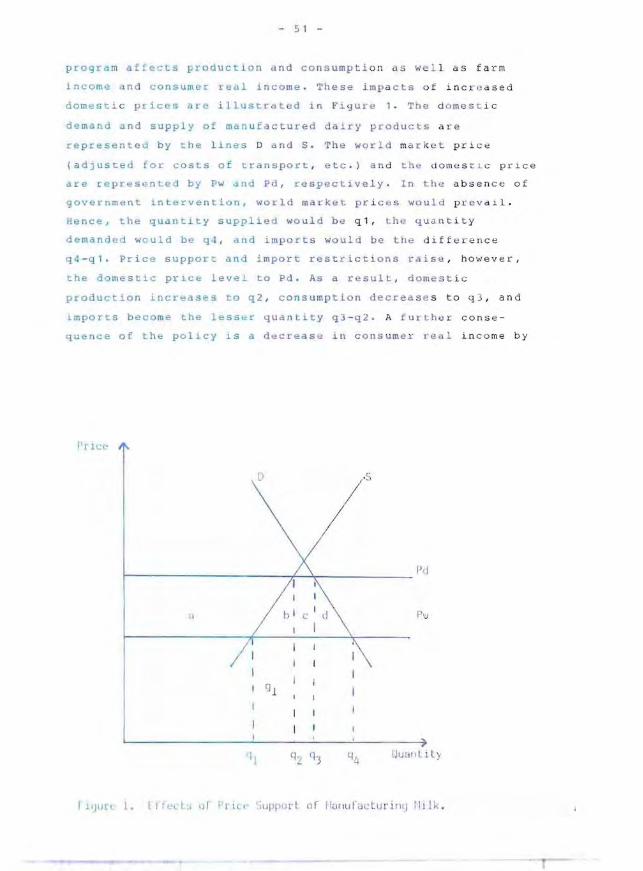
- 5 1
program affects praduc~Lan a nd consump t i on as wel l && farm
income and consumer real income . These im p a cts o f in cr ~ as ed
domes1:. i c prices ale! illustrat e d in Fi g ure 1 . 1'hIO d Ome s t: ic
demand and supply of man u fac t ured dairy ~roductti a r e
represented by the lines D and S . Th e world ma r ket p r i ce
ladjusted for ~osts of t:ransport , e t c .) a n d the ctomes c i c pr i ce
by Pw and Pd, respect i ve l y . In the absen ce of
government intervention, world market pr i c e s wou ld pr ev dll .
Hence, the quantL1:.Y supplied wo u ld be q1, the q u a n t i ty
demanded would be q4 , and impor t s wo uld be the d i f fer ence
q4-q1. Price support and impo rt res t r ictions rai s e , ho wever ,
the domestlc prlce leveL to Pd . As a result . domes tic
production incr~ases to q2 . co n s umption decr e a s e s t o q 3 , and
imports become the less~r q u a n t i t y q 3 - q2 . A u rth e r co nse-
guence of the policy is a d~creas~ in cons umer real inc o me by
rril.:~
r-------------f.-~'r_------ I'd
11 pI.!J
[JLJ~lIf i Ly
52
an amount equal to the decline in consumer surplus 6 ) which
is represented by the area a+b+c+d. This reduction in consumer
real income reflects 1) a transfer of net income to producers
equal to the addition to producer surplus, represented by the
area a; 2) a loss due to misallocation in production
represented by the area b; 3) a transfer of income equal to c
from consumers to government, domestic importers, or foreign
exporters depending on the form of import regulation, and 4) a
loss due to misallocation in consumption equal to d.
The transfer of net income to producers, which, as mentioned,
equals a, is a result of an increase in total market revenue
equal to a+b+g1 and an increase in total cost of production
equal to b+g1. Similarly, the loss due to misallocation in
production, which is equal to b, arises because the cost of
producing the additional quantity q2-q1 equals b+g1, whereas
the cost of importing this quantity would have been only gl.
The magnitude of income transfer from consumers to producers
depends primarily on the domestic price level compared to the
world market level. The higher the domestic price level is
raised above the world market level, the larger the income
transfer. In general, however, price support alone cannot
insure at the same time, a desired level of farm income and a
desired level of production. This is often a serious
limitation of this type of programs.
The losses due to misallocation in production and in
consumption depend not only on the increase in the domestic
price level but also on the responsiveness of supply and
6) Consumer surplus may be defined as the difference between the price that the consumer would be willing to pay and the purchase price he has to pay. It follows, then, that the consumer surplus can be measured by the triangel-like area below the demand curve and above the price line. Similarly, the producer surplus may be defined as the difference between the price received by the producer and the lowest price at which he would be willing to sell. The producer surplus can be measured by the triangle-like area above the supply curve and below the price line (12).
- 53 -
de ma n d to price chan.es . Th e mo r e t he s up p l y re s pond s to price
ch an ges ( i . e . , t he f l atter the supply c ur ve ) , th e l a r g e r the
Loss due to misallocation i n p r oduction ( t h e area b, wnich
l e p resent s th~s 105 S, iDc r ~a se s a s the supp ly c u rv e bec o mes
l atter ) 5 im ~ l arl y, the mor e t he dem a nd r e sponds to pr i c e
c hanges , t he larger t h e lo s s aue to mi s alloc ation i n
con s umpt i or. .
rne price support does not un l y r e d i s tr i bu t ~ i nc om ~ , i t also
red i str ibuL es wealth . ~ n gene r a l , in c Lea s e s i n far m i n c omes
b ecome cap~tallzed into t h e v al ue of farm a sset s . The
i n troducti n of co mmodlty p r og ra ms , therefo r e, t ends to benefit
o nly tile o riginal gener a tion of f arme rs whe r eas t h e ne x t
generation s are left n o be t te r of f. Fo r these l a l e r ge ne ra
tlons of f armers , tne i n cr~a s e i n ma r ke t r e t u rn wil l be
offs~t , by ~nd ~arge , by t h e hi gh e r pri c es th e y wi ll h a v e to
Fa y fo r t heir assets .
1~ is out s ide the scope of t his r e port to quant i ty t h e impacts
of the price su pport progr a m. Thi s wo u ld ha v e r e q u i r e d reliable
data on t h e supply a n d d e ma n d f unctio n s as w~ll a s o n wor ld
ma r ket prices . Esp~c i al y wor ld market p r i c e s ar e di ffL c ult to
~SSess because they ~le in f lu e ~c~d by su r p l us pro d uction 1n
maJor dai r y p o du cing co untri e s and by expo r t sub s i d i e s paid
by these cou n trles .
In short , 111 p~lce suppor t progr am s ta b i lizes pr o d uct Lo n,
product prl~es dnd far m ~ncome , b u~ ~he prog r m' s a b il ity to
stabl1ize could b e improve d b y us ~ o f a mo re a ppro p r i a t e
SLandard than the p rlty c on ce p t . Th e program c a n n o t , howe v er,
stabil i ze production dS wel l a s f ar m incom e S i n si t u a tion s
when fe d prices eh nye SU b sta n t i all y . Th~ prog r am t ran sf er s
l n comB fr o m consumdrs t U p r od Uce r s , but it i s n o t al way s able
to achieve a d~slred level of pr o d u ction a n d o f in c ome at th e
same tlme . I n aJdltlon, the tran f er of i nc o me t o p rodu c ers is
associaCed wi t h neC socla L losses .
54
5. Marketing Orders for Fluid Milk
Most milk produced in the United States is eligible for fluid
use. In 1980, fluid grade milk accounted for 85 percent of
all milk marketed and manufacturing milk, for only 15 percent.
A large proportion of fluid grade milk, however, is not used
for fluid consumption but diverted into manufacturing use. Of
all fluid milk marketed in 1980, 52 percent, on a product
weight basis, was used for fluid products, and 48 percent was
diverted into manufacturing use (39). This surplus of fluid
grade milk is due to the fact that fluid grade milk is priced
higher than is manufacturing grade milk and that, in most
areas, no barriers exist for farmers to enter fluid milk
markets, except requirements as to the quality of milk.
Almost all fluid grade milk is priced either under federal
milk marketing orders or under state control laws. In 1980,
federal market orders covered 80 percent of all fluid milk
marketed, whereas state control laws covered most of the
remaining 20 percent (39). This publication deals only with
federal orders, not with state control laws.
5.1. Objectives, pricing, and operation
Prices of milk eligible for fluid use, whether used for fluid
products or diverted into manufacturing use, are regulated by
federal milk marketing orders. The federal order program
comprised 47 orders in 1980 each covering a specific
geographic area. (39)
The initiative to institute a new milk marketing order is
usually taken by affected farmers through their cooperative
associations, and an order must be approved by at least two
-thirds (in some cases three-fourths) of the voting producers
to become effective (34). The marketing order is issued by the
Secretary of Agriculture under the authority of the Agricul
tural Marketing Agreement Act of 1937, as amended. The key
provision of this Act in regard to milk prices directs the
55 -
Sec~eta r y , unless t he pdri Ly p ~ice i s re as o n able in t h e
ma r ket i ng area in ql.1est ..l on , to " f i x suc h prices dS he fi n ds
wl11 l n s u re a suffLcient q l.1a n ti t y o f p u r e a n d whol e s ome
mi l k to me e t current ne~ ds a n d assu r e a l e v e l of f a rm
income a uequate t~ maintai n pr o duc ti v e c a pa c i ty ~ uffi ci e nt t o
me eta n ti c i pa l e ,1 f u t II r e n ee d s " .
The milk marketing orde. prov i de s for, wh a t i s know n as ,
c l assif i ed pri~in i . e . a price s yst e m 1n wh i c h p o ~ e s sor s
mu st pay prices for raw mi lk t ha t vary a c c o r ~ ing to the
prodUct,; i n wl lJ.ch 1.1: 1S us ed . Mi lk used fo r flul.d p r oduc ts
(C l ass 1 prod Ucts ) JS p ice d h ig h e r t han mi l k used f or
manufac t ured plod u cts (~la s s II a n d, in s o me marke t s a lso ,
Class III products).
Each mark~ting order sets mi n imum p r ic~s f o r Cl a s s I as wel l
as Cl ss II milk . Both ~he s e mi n i mu m price s ar~ base d o n the
Minnesota -Wi sco n s Ln (M - W) p r i c e for manuf a ct u r ing yL ~ de milk.
The Class I min l mu m p r Lce is s et o n th e basis of the M- W pr ice
plus a differen ial . wh a ch v a r i e s s ubstant i a l among f ~d e ra l
order mar k el s. Th~ dlff~re ntial i s de termined aft e r pu b l ic
hearings where evi d ence i s pres ente d o n c osts o [ o b ta i n i ng
ml 1 k suppli~s fro m altern tl ve sour CBS and on loc a l s up p l y
-demand co nditlons . I n gene l a l, t he difiere nt l al incr e ases
wlth the (jistance from -ehe Up p er ~l i dwe s t - t h e mo s t I mllo rtan t
sllrplus area . The on l y slgni[ i cant r e ylo n a l ex c ept i o n f ro m
th i S rule i s the Far West . .In 19 7 0 , th e l o we st Cl as s I d if f e
rent_ - l WdS $ 1.1 1 per <:wt: . i n t h e up pe Mi dwest: o rd e r a n d the
h:"gllesl was S ] .1 5 pet '~ wt . i n t h e Southern Flori d a order (J4)
B~caus~ of LhlS varYlng d i ffe r en tlal , t h e Cl ass 1 p Li c e
differs substantially butween mar k eLs r ef le ~ t ing th e f a c t that
the cost of tr nsportin~ ml1k i s re lat i vely h i gh .
In contrast to C i dSS prl.ce s, Cl a ss I I prices d o no t v a ry
from market. tr; market . [n most ord~ r s , Lll e Cla s s II pr lce
equalS, 01 is s l ightly above , t h e M- W manuf a ~ L u l i n y mil k p r i c e.
n ~ cau,;e Lhe minimum Cl ,., 5 pri c es oL e l ink ed to L h~ M- I-I p ri c e
for manufacturing mLl k , the y re -l !!ct c h a ng e S o v er t i me i n t h e
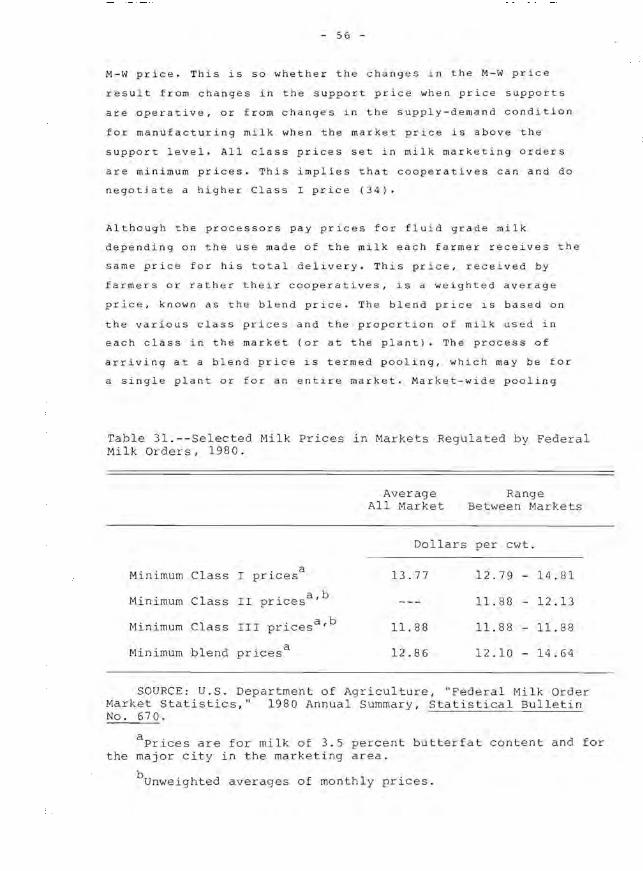
- 56 -
M-W price. This is so whether the changes in the M-W price
result from changes in the support price when price supports
are operative, or from changes in the supply-demand condition
for manufacturing milk when the market price is above the
support level. All class prices set in milk marketing orders
are minimum prices. This implies that cooperatives can and do
negotj.ate a higher Class I price (34).
Although the processors pay prices for fluid grade milk
depending on the use made of the milk each farmer receives the
same price for his total delivery. This price, received by
farmers or rather their cooperatives, is a weighted average
price, known as the blend price. The blend price is based on
the various class prices and the proportion of milk used in
each class in the market (or at the plant). The process of
arriving at a blend price is termed pooling, which may be for
a single plant or for an entire market. Market-wide pooling
Table 31.--Selected Milk Prices in Markets Regulated by Federal Milk Orders, 1980.
Minimum Class I prices a
Minimum Class II . a,b prlces
~1inimum Class III pricesa,b
Minimum blend prices a
Average All Market
Range Between Markets
Dollars per cwt.
13.77 12.79 14.81
11. 88 12.13
11. 88 11.88 - 11.88
12.86 12.10 14.64
SOURCE: U.S. Department of Agriculture, "Federal Milk Order Market Statistics," 1980 Annual Summary, Statistical Bulletin No. 670.
aprices are for milk of 3.5 percent butterfat content and for the major city in the marketing area.
bunweighted averages of monthly prices.
- 57
w~s used in all but four of che f i ft y feder~l o rde r s In ef fect
1n 76 (34).
The blend ~rice varies fairly substant1di ly among mdrk e ts.
In 80, the m~nimum Q~der bl ~n pr i ces r dn g ed from a low
':Jf S 12 . 1U per cwt. in the Upper Midwest to a h igh of $ 14. 64
per ewt In southern Florida (Table 31 ) . The se diff e r e nce s
3mong marKets w~~h respect t o the blend pr ic e re fl ec t var l
ations witJ resp~ct co Class I prices as wel l as d if f e re n ces
wLth respect to the proportion of flui d grade mi lk us e d for
Class I products.
5.2. Impac:::s
·r system dl.rect ly affe c ts f a rm pr:iC'es Tlte milk m,Hk.,tinq or
of fluld grade milk nd consumer prices of f l uid milk products.
system also indire - t ly aEtect s fdrm prices
of manUfacturing grade milk and consumer prices of man u fa ctured
dairy ploducts. lIy aff ec tin<J these p r lc es , til e mar ket ing order
system lnfluences ptodLcLlon of fluid yrdde and man u f acturing
gtdde milk as well dS consum ption of f l ui d mI lk p r ud u ~ t s and
of manuf3ctur:ed Ja~ry produc ts. Furthennore , the md rk et ing
order systt.'m influ .. nces tl t! income d i stl-ibut ion, and l.t gl ues
r~se \".Cil net. soc ' al losses. This section e xamin .. s the se impacts
of the milk mark~ting order syst~m.
The ml1k markt!ting order syst.em r ef lects ob j ect iv es which are
sought achieved ~y the system as well dS economic char~cter i
stlCS or ccnrtit10ns prevailing in the past clnJ , to ~ omu
~xtenL . still revdl1ing in tl u ld milk markets.
~he major objectives DE the milk markt!tiny order s s y ste m see m
;:'0 b," 1 ) st bilLzatlon of producer pI- i ces and lnc omes , includ
ing assurdn~~ 0E dCcess Eor produce rs to t h e f l uiJ mil k market s
~n a yea~ - roun bdSis; l ) e nhd nce ment oE produc e~ rices and
l.ncom-s .
(Jne import.arlt cl ril Ld't:"rist ic of fluid milk marke t.s h a s been
~rr9 tabl l it'l' Historl.cally, fluid n\lllt marke ts we re lo c a l
58 -
markets more or less separated from the manufacturing milk
market. These local markets were inherently instable for
reasons associated with the nature of milk, such as its
bulkiness, its perishability and the seasonal patterns in milk
production. In general, fluid milk produced in proximity to
cities could command a higher price than could milk used for
manufactured products, mainly, because of the high cost of
transporting supplies from areas further away from the market.
But, fluid milk produced within the milk sheds in excess of
fluid needs, because of seasonal variation in production,
could only command the lower price of manufacturing milk. In
the absence of a diversion arrangement, therefore, prices of
all fluid grade milk tended to fall to manufacturing milk
prices in periods of excess supply. In addition, some
producers might be forced off the market in the flush season
( 1 5) •
To deal with this instability problem, classified pricing was
introduced by organized dairy farmers in several markets near
the close of the First World War, and it came into widespread
use especially in large Eastern markets during the next
decade. Classified pricing appeared, however, to be difficult
to enforce without government involvment, especially in the
distressed economy of the 1930s. At this time, therefore,
state and federal milk marketing orders were introduced in
order to implement classified pricing for fluid grade milk
(15). Also today, fluid milk markets would undoubtedly be
instable without any regulations, and the milk marketing order
program, therefore, still serves to stabilize these markets.
Beside stabilizing production and producer returns, the milk
marketing order system also enhances producer returns. The
differential between the price of fluid milk and that of
manufacturing milk exceed the. additional costs of producing
and transporting fluid milk. This differential, therefore,
comprises an element of price discrimination.
In general, price discrimination is able to increase average
market return, at least in the short run, provided that the
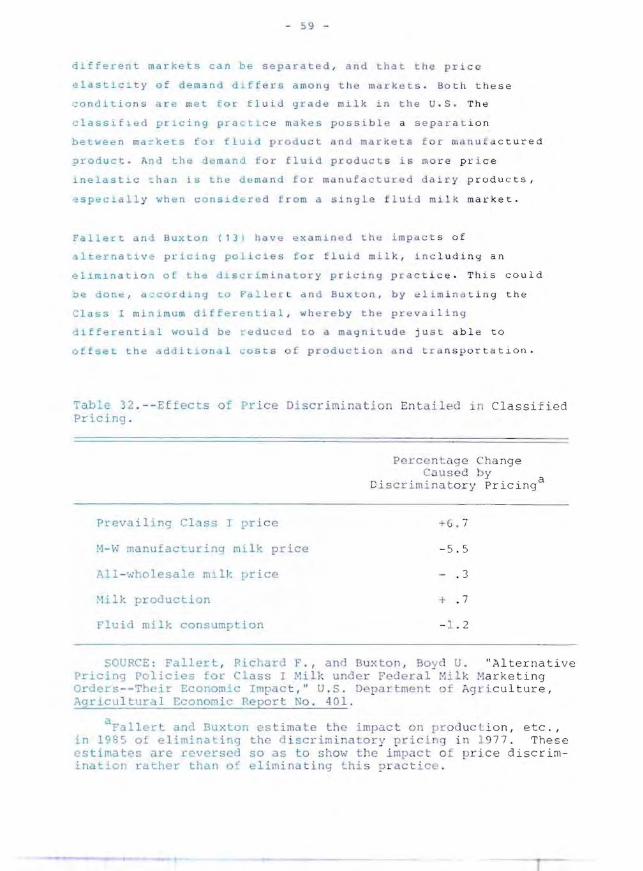
- 59 -
different ma r kets can be separated , and that the pri ce
'1!lastlc1.ty of de m.a n d oLff e rs a mo ny t he market s . Bo t h t h e s e
~onditions a r e met for fl ui g r a d e milk in t h e U.S . Th e
classiELed pr~cing pract~ ce ma kes p os sib l e a s e par a e i o n
betwe~n ma~kets for fluLd pEoduct a n d ma rke Ls f or ma nu f ct ctured
?roduct. And the deman~ f o r fl ui d product s is mo re p r i ce
lnelastLc ~han is the dema n d fo r ma nufa c t ured d a i r y p roducts,
especLall y when cons1dare d fro m d si n gle f luid milk market.
Fallert noj Buxton (131 have ex amined t h .~ i mpac t s of
alternat1ve pricing policies for f lui d milk, i n c lu d i n g a n
el1m1nat10n of tb= J1scrLminatory p ri c i n g p ra c t i c e . Thi s cou l d
~e done , a~cor 109 to Faller t and S u xLon , by ~l im i na t i n g t he
Class I min im um different i a l, wh ere by t h e pre v ai l ing
~Efere n ei 1 would b. ~.duced t o a ma gni t ud e j u s t a b l e t o
of f set the adJit10nai cos ts o f product i on a nd Lr a n s p or t a ti o n.
Table 32 .- - Eftects of Price Discr i mina t i on En t a iled i n Cl ass i f ied Pricing .
Prevailing Class I pr ice
M-W manufacturina milk price
P..ll - v.'lolesale miH: [,r ice
~1ilk producti on
Fluid milk cons mption
Perce n t a g e Ch a nge Cau s ed by
Di s cr i minato ry pr i cing a
+ G.7
-5.5
. 3
+ .7
- 1. 2
SOURCE: Fallert, P.lct.ard 1" ., and Bu xton, Boyd U . " Alter nat i ve Pricing Policies for Class I ilk u nder Fe eral Mil k Mark e ti ng Or.Jers --Th .. d r Economic Impact, " lJ . S . D p artment o f AeJricu l t ure , Agricu l tur I Economic Report o . 401.
aFallert and Buxton estimate t he i mpac t on pro ducLi o n, etc .• in la85 of eliminating th d i scrimi natory p r ici 0 i n 1 9 77 . These (' stimate!" are reversed so as to 5hO\-I the impa ct 0 pr i c e disc rimination rather than of elimi na ti ng thi s p r ac t ice .
- 60
Fallert and Buxton's estimates, reversed so as to show the
impact of the discriminatory pricing practice rather than of
eliminating this practice, are as shown in Table 32. These
estimates indicate that the use of price discrimination
raises the prevailing Class I price 6.7 percent, on a natio
nal average, lowers the manufacturing milk price 5.5 percent,
and leaves the all-wholesale milk price almost unchanged
(Table 32). In addition, the discriminatory pricing practice
results in a minor rise in total milk production and,
consequently, also in total consumption of milk and dairy
products, as consumption is assumed equal to production. Also
the consumption pattern is affected. Thus consumption of fluid
products is lowered 1.2 percent, whereas consumption of
manufactured dairy products is increased about 3 percent.
The above mentioned impacts of the discriminatory pricing
practice may be explained in the following way: The minimum
Class I differential raises the price of milk used for fluid
products, which in turn increases the blend price received by
farmers. The blend price increase stimulates production of
fluid grade milk and, as a result, more fluid milk is diverted
into manufacturing use. This leads to lower manufacturing milk
prices, which in turn results in a decline in manufacturing
milk production. Thus, the increase in prices and production
of fluid grade milk are offset, by and large by a decrease
in prices and production of manufacturing milk. Similarly, the
decline in consumption of fluid products caused by higher
fluid product prices is offset, by and large, by the increase
in consumption of manufactured products caused by lower prices
of these products. This failure of the discriminatory pricing
practice to increase average market prices is due to the blend
price feature and the absence of production control.
Fallert and Buxton's estimates are based on the assumption
that manufacturing milk prices are above the support level.
The impacts of the discriminatory pricing system would be
quite different under the assumption that manufacturing milk
prices are at a given support level and government is
purchasing substantial quantities. In this situation,
- 6 1
_ncreds~d flu1d m11k prices would result in an i n ~ e a Se in
surplus production 1ns~ead of a reducti o n in manufa c tur ing
grade milk production . But to dssu me that the sup p ort le v el
is g~ven dnd, thus ind~pendent of the sze of the Class I
d1fferentlals is probably unrealistic. It se e ms more l i kely
that the support level wo ul be incteased, if t h ~ d isc rim in a
~ory pC 1 cing pract1ce WaS el imina te d , in order to a [ se t the
impacts of thL5 change. If this bappens , then ~allert d nd
3uxton~s estimates are v.li also when the support p o gram is
,jperative.
The d1scrim1natory pri' ; ln~ practice also affe~ts the J:st r ibu
tLon of 1n~ome. Total r.J1:m i n come as wel l as t ot al c onsumer
real income is only slightly aEfected sinc e tot a l pro du c tion,
to~al consumptLon dnd The overal pr~~ e lev e l ar e ab o ut
u n changdd . BUT, n~caUSd the the discr imi natory p ri c i n g
pract'cs increases prices of fl uid milk p rodu ct s a n d r e d u ces
prices of manufa~tur~d milk products, it substant ia lly affe c t s
the distribut10n of in~ome among dair y fa r me r s. It a l s o
[Eects tne d~:;tribut:_un ot i ncolne among housh o lds to the
extent thaL they d1ffer with respecL t o consumpti o n of f uid
produCLS telativB to mdnu c ur ec1 prod uct s .
r1nally, tho.: dlscr.l.mlll-itory pricing pro _ti ce <jive ,; ri se to
diffar*nt ~at social l~sses - some lesulting tr om mis a l l o
cation 0 resources in milk production , oLher s res ulti ng from
mlsal l ocacLon of milk between i ts alternativ~ use s (1 ) . The
net social loss QUE to misal l ocation in product io n a r i s es
because tIe farm price of fluid grade milk is k epT abov e t he
un~e9ulat d l~vel and b~cause the farm price of ma nufa c turing
grade m~lk is k~pL b~lQW that l evel . The ~ n cre a s ~ ~ fd r m pr~ ce
of fluid milk r~5ul S ~n an overprOduction in t h e se n se that
flul-d gra~e milk prodl:oCLion expands beyond t. i1e ev e l wh e re the
matginal cost equals Lil", unreg u lated market p rice . T il e se cos ts
1n excess of the unregulat~d market pr1ce re present a net
social loss due tv ov~cprod u cl i on of fluid gr de mi l k .
Similarly, the declin~ in the price of ma nu facturin g milk
results in a neL social loss d u e to underprodu c t ion ot
m anufact u L ~ng m~lK.
- 62 -
The net social loss due to misallocation in consumption arises
since the prices of fluid milk products are kept above, and
prices of manufactured dairy products are kept below the
unregulated price level. As a result of these deviations from
the unregulated price level, consumers are prevented from
increasing consumption of fluid products although they are
willing to pay more than the unregulated price. Similarly,
consumer are induced to increase consumption of manufactured
dairy products although they are not willing to pay the cost
of production for this additional consumption.
In conclusion: The milk marketing order system stabilizes
the inherently instable fluid milk markets. The discriminatory
pricing practice implemented by the orders has not succeeded
in increasing overall farm prices and incomes, because of the
blend price feature. The discriminatory pricing practice
affects the distribution of income among dairy farmers and may
also affect the distribution of real income among consumers.
Furthermore, this pricing practice gives rise to net social
losses.
- 63 -
B . CA.NADA
The~e FX1st ~wO mmrkeLs for milk
lindu5 Lrial) milk mdrket and th e
in Can~dd - Lh~ mctn u fa cturing
Elu1d mi l k market. Up until
the 19705, the market for manufactur i ng mi l k and c r e am 0la5
maLnly supriLed by Earm~rs produ c ing sole l y for that mar k e t,
~her~as ~h mdlk l for fluid milk was sup p li e d by d d Lff e r e nt
group of farmers. Some over l appi n g has always e xis te d bet wee n
th~ two markets, as fluLd milk produced in excess of f l uid
requi t-emen
the 1970s,
5 has be~n dLverted into manuEactu~ing us e. During
howev~r ,
jisappeareo in some
this di visio n among da i r y farme r s largely
provinces . In Ontar i o , f or in slca n c e , "hlCh
is second only to Quebec ln milk production , ove r 9 0 pe rcent
of all dairy farmers have quo t as to the fl uid mdrket as well
5 to the mdnufdcturing milk rna ket (:) 1 ).
Cesp~te the fact that the two groups of da i r y tdrme rs h a ve
I::ecome less distinct in some ptovlnces , there stc i~ l l eX I s t two
sets o f market policl~s , one pertaining to the manufa c t uring
milk market and the other to t he fluid mil k market. Th e se t"o
sets of marKet policies reflect the divi s io n of Juris dic tion
tet wce n federal an provin ci a l government s . Unde r the Canadian
~onstitution , th~ Federal Government has jurisdi ct ~ on o ve r
interprovinc i a and internationa l tlad e in ag r icult u r ~ l
~roducts , ~nereas prov~ncial g over nm nts ha v e Ju ri sd i c Li on
eve!: m<lrketiny ()f dgri ... ulLural products wi th in Llldi r t.., rr i
Lories . Manufacturing mllk ma r keting, t her e fore , f ul l~ prlma
r~ly under the ~uSDice:'i of the Federal Go vernment s ince
manuE~ctured dairy products a t e traded interpro vin ci a lly and
interna ionally. F~dera. anJ procinci 1 gover~m~n t s d u ,
~owever , c~operdt_ in m naging , what is known as , th e Marke t
_hdriny QU~t.d (M . S . Q.) plan, whi c h contro l s pr o du c t i on of
man u f act u r l n g m ~ 1 It and 5 u 1- P 1 u s flu i d mi l k ( l Q , 2 7 ) " Flu i d mi l k
mark~tin9 ~s , In 'ontrast to manufacLu~iny mil k mar k et in g,
under provLncial jurisdlct~O n Since fl ui o milk mar k et s are
l~mited to provincial areas ( 27 ).
Thp Fed~~al dairy policy LS adm i nis t e r e d dnd , to s o me extent,
3150 develuped by th C~nddia n Dai ry Comm iss ~un ( C _D . C . ) - a
- 64
Crown Corporation established by the Dairy Commission Act of
1966. The C.D.C. consists of three members appointed by the
Governor in Council. They are directly responsible to the
Minister of Agriculture. The basic objectives of the Commis
sion, as stated in the Act, are (1) "to provide efficient
producers of milk and cream with the opportunity of obtaining
a fair return for their labour and investment", and (2) "to
provide consumers of dairy products with a continuous and
adequate supply of products of high quality" (31).
Federal and provincial governments' cooperation is instituted
by an agreement signed by the C.D.C. and by provencial milk
marketing agencies. This agreement provides for the Market Shar
ing Quota plan. The agreement also provides for a Milk Supply
Management Committee with three representatives for each pro
vince - one representing the provincial government boards or
commissions, two representing provincial producer boards, and
three representatives of the C.D.C. The Committee is responsi
ble for managing the M.S.Q. plan, whereas the administration
of the plan is carried out by C.D.C. at the federal level and
by provincial marketing agencies at the provincial level (27).
Provincial milk acts provide for fluid milk quotas, which are
administered by provincial milk marketing agencies. The market
policies for fluid milk in Canada are not dealt with in this
report.
6. Manufacturing Milk Market
The basic instruments used during the 1970s in implementing
government market policies for manufacturing milk are: 1)
market price support and direct subsidy payments to producers,
2) subsidy quotas, and 3) marketing quotas.
6.1. Market price support and direct subsidy payments
Since the mid-sixties, prices received by farmers for manufdc
turing milk have been supported in two ways: through C.D.C.'s
- bS -
off~r to purchase surplus da iry products a~ pre - determ l ne d
prices and th1Dugh a direct subsidy paymen t t o produce~s .
In setting th," S\1pp<>l· t l evel a key role is play e d b y t h e
target pl"i ,~e . ?h" lCirge t l?(l'-'B 1.S a des i rHd , but. !lOt n ecc:s s a
r~ly attoined , price 1~vel1 it is mad e up of th~ d i re ct
subsLdy payment ~o pCOdUCb~S and an estimated nati onal mar k et
return fo r manuE(lcturlny milk . This nat i onal mar k et ret urn
corresponds to the prices <II: which the C .D . C . purchase s
surplus dairy plodu~ts and to an assumed nat i ona l p r ocess ing
margln fQr dairy products (36).
The pricMs r ce1ved by f.rmers dev i ate u s ua lly from th e t a rget
pr ic ",. 'rhE main rt!asnas for t.his deviation ,n e: 1 ) dl. f l'er e nces
b Lwa~n the aCLUal p~ocessLng ma r gin, wh~ch i s d ete rm i n ed by
pruvincl.al aULho~itL~s, and th~ assumed n ational proc ~ s s i ng
mur<p.n; an 2) Ito ldbacks m de from tt e subsl.dy paymen!: s dS
well as levias Jmpos~d on the mar ket returns. Thy far m pr i ce s
may Iso devl.at~ feom Lh~ &arget. pric~ be c au s e the tar m p ri c es
depend on market pr1~es ~f man u factured dair y p r odu~L s dod
Liley ar", rrt:<! t.o mev" ab"vy the supporl_ l ev el .
Ttearyat prlC. has bean indexed since Apr il 1 . 1 975 to
reflec~ chang~s 1n prjc.s of 1n put used in dairy f~ , m i ny .
TilLS 1ndexation is bas~d upon an ctdjustmynt. f o rm u a , whi ch
compr1ses :
a. an ind~x 01 cash 1 npuL prl.ces wiL h a c ompo "i t e
w~iyht of 4~ p&rcent r
b . the Consume!:" Prl.ce Ind ex , d.S d n\eas u e o t til .. v a lue o f
labor l.J\put supplied Ly Lhe operato r anJ b y u n pd id
family membMrs, with a weig h t of 35 p~r c e n ~ .
Judgm~nt~l factors w1th a weight of ~u p~ r ce n t
c" "" rt<s!J,,nding LO cap i tdl inputs. These jIJd ymt! n Ldl
Ea~tols aL~ Ie dLed t o Lhe Feder a l Govucnme o t 's
assessment, i n ..: ludi. 9 factor s s uch dS s i gnifl ca nt
- 66 -
changes in the level of stocks of dairy products,
changes in the return to dairy producers in other
countries, and major changes in the competitive
processing costs (31, 36).
The adjustment of the target price takes place at the beginning
of each dairy year and, in addition, during the year if the
change in the index exceeds certain limits. The judgmental
factors are only taken into consideration at the time of the
Federal Government's annual review of the C.D.C.'s programs
(.3 6) •
The setting of support prices involves, in addition to determi
ning the target price of milk, a selection of a direct subsidy
level and a market support price level that will achieve the
target price. Furthermore, to achieve the market support
price for milk, purchase price levels for butter and nonfat
dry milk have to be set.
No fixed rules exist as to the choice of the above-mentioned
levels of direct subsidy payment and purchase prices. The
level of direct subsidy is decided by the Federal Government
each year and announced prior to the beginning of the dairy
year. After the target price has been determined, the choice
of direct subsidy level is primarily a question of distributing
the burden of the dairy support between taxpayers and consumers.
But this choice also affects dairy farmers since market prices
of manufactured dairy products influence consumption and, thus,
the required milk production. The lower the direct subsidy
payment and the higher the market prices, the lower the
consumption and the required production (36).
A similar compromise is involved in distributing the burden of
a given support price for milk between butter and nonfat dry
milk. Since attempts are made to balance production and
requirements on a butterfat basis, a desire to maintain the
size of the dairy industry calls for moderating butter price
increases. On the other hand, a desire to limit funds
requirements for exporting surplus nonfat dry milk calls for
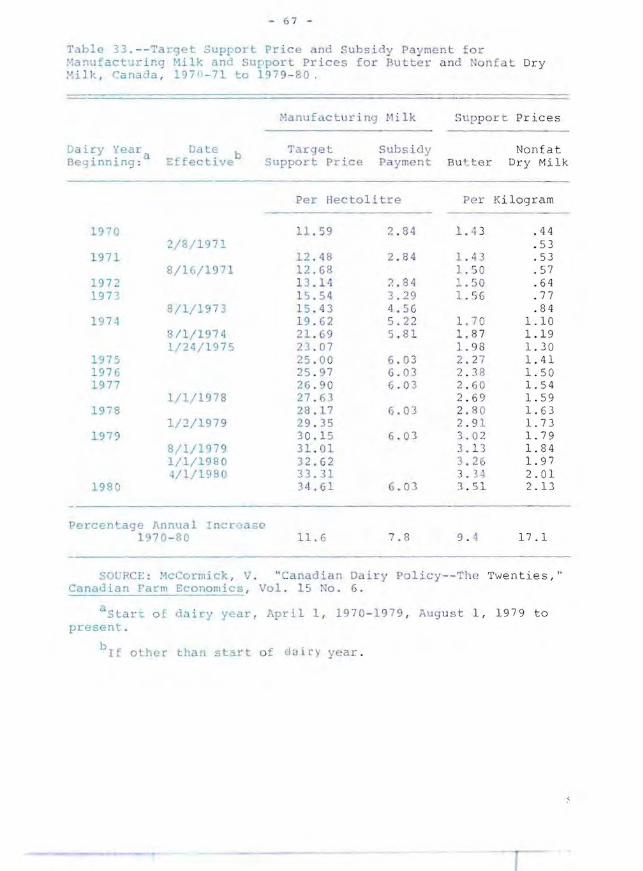
- 6 7 -
Tabla 33 . --Target Sup ort Pr ic e a n d Sub sidy Payme nt f o r Mar~tacturi ng 'ilk and suppor t Pr ices for Bu t t e r a nd No n E t Dry :·'1 JJ-. , rana(la , 19711 - 7 1 to 197 9- 80 .
Dairy Year Dale b Be~i nning: a Effect i ve
1970 2/8/1971
1 971 8/H/1 9 71
1972 1973
8/1/1973 1974
8/ 1/19 7 4 1 /24/H 7 5
197:> 19 7 6 1977
1/1/1 978 1978
1/:2/19 79 197 9
8/ 1/19 79 1/1/198 0 1/1/1980
1980
Percentage hnnua l I nCl:'Caiie 1 970 - 80
SOURCE : t·lcCol·mj ck , V .
Manu f actur ing Milk SLppor t Prices
Subsid y Tar g et Support Pr i ce Pay ment flu t ter
Nonfat Dry Milk
Pe r Hecto l i t r e P e r Kilogram
1 1. 59 2 . 84 1. 4 3 . 44 . 53
1 2 . 48 2 . 84 1. 43 . 53 12 . 6 8 1.5 0 . 57 13 .1 4 :> . 84 _ . 5 0 .64 1 5 . 54 3 . 29 1. 56 .77 1 5 . 4 3 4. 56 . 84 1 9 . 62 5 . 2 2 1. 70 1.10 21. 6 9 5 . 81 1. 8 7 1.19 2 3 . 07 1. 98 1. 30 25 . 0 0 6 . 0 3 2. 27 1. 41 2 5 . 97 6 . 03 2 . 3 8 1. 5 0 26 . 9 0 6 .0 3 2 . 60 1. 54 27 . 6 3 2 . 6 ') 1. 59 28 . 17 6 . 0 3 2 .R O 1. 63 29 . 35 2 . 9 1 1.73 3 0.15 6 . 0 3 3. 0 2 1. 79 3 1. 01 J. 1 '3 1. 84 32 . 6 2 3 .26 1. 97 33.31 3 . 34 2 . 01 34.61 6 . 03 3 . 5 1 2.13
11. 6 7. 8 9 . 4 17 .1
" Canad ia n Da i r y Po licy- - Th c Tv"enties, " Canad i an FarJ1l Econom i cs , Vo l . 15 No . 6 .
aStar~ o f aairy year , Apr i l I , 1970-1 979 , Aug us t I, 1979 to pl-esent .
b rf 0 her t han start o f d~ lr y year .
- 68 -
moderating price increases on nonfat dry milk (36).
The target price of milk, the purchase prices of manufactured
dairy products, and the subsidy payment resulting from the
above-mentioned procedures and considerations are, as shown in
Table 33. The target price has increased substantially during
the seventies, not only in nominal terms but also in real
terms. Thus the target price increased from $ 11.59 per
hectolitre in 1970-71 to $ 34.61 per hectolitre in 1980-81.
This amounts to an average annual increase of 11.6 percent
compared with an inflation rate of 7.7 percent in that same
period. Most of this increase in the target price took place
during the first half of the seventies, before the target
price had become indexed. In this period, the support level
was raised primarily in an attempt to increase milk production,
which had been falling because of drastic increases in feed
prices. The rates of increase in the subsidy payments and in
the various purchase prices from 1970-71 to 1980-81 differ
substantially; the subsidy payment increased from $ 2.84 to $
6.03 per hectolitre milk, which amounts to 7.8 percent yearly;
the purchase price for butter increased from $ 1.43 to ~ 3.51
per kilogram, or by 9.4 percent yearly; and the purchase price
for nonfat dry milk increased from $ 0.44 to $ 2.13 per
kilogram or by 17.1 percent yearly. These different rates of
increase indicate a shift away from dependence on direct
subsidy payment towards increasing dependence on market
returns, especially on that from solids-nonfat.
Under the purchase program, the C.O.C. has purchased butter
and nonfat dry milk on a regular basis. Cheddar cheese, by con
trast, has been purchased only occasionally, since the market
price for cheddar cheese usually has remained above the
purchase price level. The C.O.C. has, however, provided
financial assistance when required to subsidize cheese
exports. (22).
The amounts of butter and nonfat dry milk removed from the
commercial market through government programs are, as shown in
Table 34. The surplus products purchased by the C.O.C. are
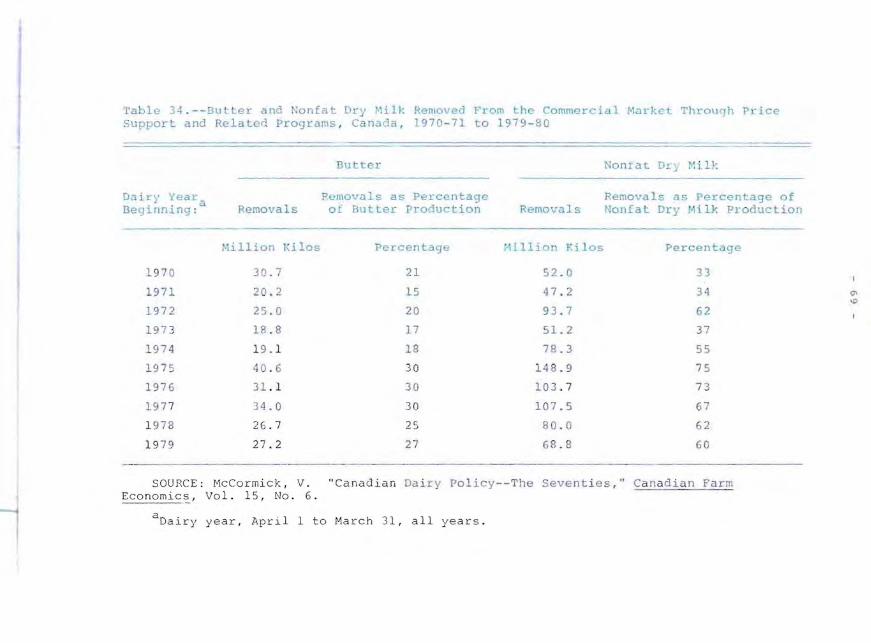
Table 34 . - -!3u Lter a nd Non fat Dry ~1i 1k Removed From the Commercial i'1arkct Throl1<Jh P t" ice Support a nd Rel a t e d Pr ograms , Canada , 1970 -7 1 t o 1979-80
Dil i ry Year . . a Begl.finlng : Hemo va1 s
Hi1lion J( j l os
197 0 30 . 7
1971 20 . 2
1972 25 . 0
197 3 18 . 8
1974 19. 1
197 5 40 . 6
1976 31. 1
1 9 7 7 34. 0
1 97 8 26 . 7
19 7 9 27.2
Butter
RumOVil l s as Percentaqe of Butter Productio~
Percen t age
21
l5
20
17
18
30
30
30
2 5
27
Remova l s
H ill ion Kj 105
5 2 . 0
47 . 2
9 3 . 7
51. 2
78 .3
1 48 . 9
1 0 3 . 7
107 .5
80 . 0
6 8 . 8
No ntat Dt:y r,u u ;
Removals as Percentage of NOllfat Dry Milk Production
Percentage
33
3 4
6 2
37
55
75
7 3
67
62
60
SOURCE: McCormick, V. "Canad ian Da i ry Po l i cy --The Sev enti es , " Ca na dian Farm Economics, Vol. 15, No . 6.
aDairy year , April 1 to March 31, all years .
IS> oD
- 70
either sold back in the trade in a later period at a price
equal to or above the purchase price, or they are disposed of
through other channels, primarily export, at a price often
substantially below the domestic price level. In the seven
ties, butter was usually resold in the trade, whereas nonfat
dry milk usually was disposed of in export markets (22). The
amount of butter removed from the commercial market, there
fore, does not indicate the magnitude of surplus production.
6.2. Subsidy Eligibility Quotas
The purchase program and the direct subsidy payment dealt
with in the preceding section establish a general level of
producer return for manufacturing milk. This general level
of return has been modified, by quota plans - first by the
Subsidy Eligibility Quota (S.E.Q.) plan and later by the
Market Sharing Quota (M.S.Q.) plan.
The S.E.Q. plan was introduced by the Federal Government
through the C.D.C. in the dairy year 19 67 -68. The introduction
of this quota plan was an effort to keep milk production in
line with commercial requirements on a butterfat basis and to
increase producer returns. The quotas were initially allocated
by giving each producer a quota for 1967- 68 equal to the amount
of his delivery in the previous year. Some restrictions were
placed, however, on the maximum as well as on the minimum size
of individual quotas. The S.E.Q. plan was the first federal
government measure that placed a constraint on the amount of
milk eligible for support (25).
The S.E.Q. plan, which was suspended in 1974, did not affect
the market return, but was a means to regulate the subsidy
payment to manufacturing milk producers. Under the plan,
producers received only part of the subsidy payment; two
kinds of holdbacks (deductions) were made - a modest within
-quota holdback and a higher above-quota holdback. The latter
was not introduced until 1969-70 - two years after the plan
came into being. The direct impact of the S.E.Q. plan was to
- 7 1 -
es~ablish tWO l>vels of reLurn s o r p r1ces fac i ng e ach pr od u c e r
- a relat1 v el y high rdtu r n for d e liv e r ies wi hin h i s qu o ta and
a lo wer retu rn for del i veries Ln excess o f h i s q uota . Th e
within - quotd r~t u rn comprised the mark e t pr i ce and the s u b s idy
payment mL n us ~he wi tnLn - qu o t a ho l dback / the above - quo ta
ret u rn com p r is ed the market p r ic e mi n us th e abov e - qu o~a
hol d back . For lnslance, ~n 1969 - 7 0 , t he firs t Yd a r in whic h
above - quota holdba cks werd i n f orc e , thes e t wO pric e s a mo un ted
t o $ 12 . 46 and $ ~ . 99 per he c to li~ re (25 ) . The hOld b a c ks we re
in tended to s erve t wo p urpose s - La limi t su r plus p rod uct i o n
a n d to generat~ f u nds re q uired fo r the di sposal o f s urplus
productio n.
The S . E . Q . p ldn cove r ed only 80 pe rcent of a ll mi l k and cre a m
used for ma n ufactur in g purpos e s . The remai n in g 20 pe r c e n t ,
consiseing of exces s f lui d milk di verted i nto ma n u fa c t ur i ng
u se , was no t i ncl uded. Th u s t he Federal Govern me nt h a d no
co,trol ov e r the p roductLo n o f exceSH f lu id mi l k , bu c was
s u pporc1 ng the markec pr1ce o f th i s mi l k through the
offer-lo -purchase pr o g ram . This becam e a maj o r p ro b l e m, as
fluid mil k pro ducer s expdnde d t hei r p r oducc i o n in e x ces s of
tne l. r f l u id qUOt.aS (25) . 1 n c o n s equ e n"e , t h e f4ar k e t Sha r ing
uata p l a n was develo p ed 1n 19 7 0 , but t he 5 . E . Q. p l a n
contin u ed t o exiSt u n til 19 74 . T h US , t wo quot H plans we re in
force from 1970 01974.
oS . 3 • uote s
The MarMe t Sh~r i ng u u ota ( M. S . g . ) p l an i s p rovid e d for by an
agreement b,~ t wt!"n the .D . C. a nd eh e p r-o vin cial In i lk. ma r keting
agencies i n provinces parL l c ipa t 1n y in th~ plan . Onta r io and
Q u ebe ~ , whLeh were the fi r s t tw o pr o vin c e s t o sig n t h e
a g reemen t , e n t.t<ted t he <luo t a pla n in D~cembe r 19 7 0 , and all
prov1 n ces eKcep New f ound lan d , wher- e mi l k prod ucl i on 1 ~
neg l Lgibl<!, had J ,jl.ned t h e p la n by Jlp r i l 19 74 (3 1 ).
Th" o b ject i v«,; of tile ag r eeme nt are 1) t. o pJ;o v id e a b a lance
between t l e do mestic supply a nd h e d o me s t ic r eqUir e me nts for
- 72 -
butterfat in manufactured dairy products plus exports; 2) to
establish, at least annually, the total national Market
Sharing Quota; and 3) to make adjustment in the distribution
of the total quota among provinces (31). The last two objecti
ves, obviously, are intended to serve as a means to achieve
the first objective.
The M.S.Q. plan covers all milk and cream used for manufactur
ing purposes, whether manufacturing milk proper or excess
fluid milk. Under the plan, each producer initially received a
quota equal to his delivery in the year preceding that in
which the province entered the plan, or equal to his subsidy
eligiblity quota if that was greater than his delivery.
Under the plan, provincial agencies deduct levies from each
producers market return - a modest levy on deliveries within
his market quota and a higher levy on deliveries in excess of
his quota (Table 35). These levies imposed on market returns
replaced the earlier mentioned holdbacks made from the subsidy
payments. Thus, manufacturing milk producers were paid the
full subsidy payment from the time when the province joined
the plan.
In its initial form the M.S.Q. plan, in itself, established
two price levels facing each producer of manufacturing milk -
a relatively high price for within-quota deliveries and a
lower price for deliveries in excess of the quota. However,
manufacturing milk producers in provinces participating in the
M.S.Q. plan were not only allocated a M.S.Q. but also a S.E.Q.
A producer's M.S.Q. and his S.E.Q. could be for the same
amount of milk, but generally the M.S.Q. was greater than the
S.E.Q. These two quota systems together established three
levels of producer prices. These prices included: 1) for delive
ries within the S.E.Q. and consequently also within the
M.S.Q., the market price plus direct subsidy payment minus the
within M.S.Q. levy; 2) for deliveries within the M.S.Q. but in
excess of the S.E.Q., the market price minus the within M.S.Q.
levy; and 3) for deliveries in excess of the M.S.Q., the
market price minus the above M.S.Q. levy. These three levels
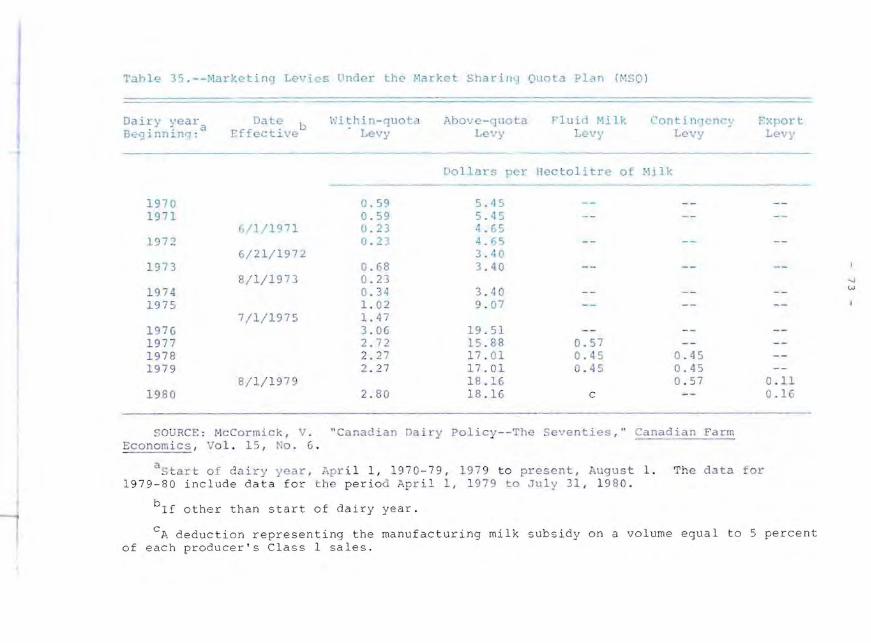
Tanle 35 .--Narkcting Le\:ics Under lhe Harket Shari"'::1 Quota Plan (MSO)
Dairy vear Date b
1\11 th i n - ouo ta Aj)ove-guo ta F'luid Milk Contin'l cni-:Y r:xport B . '. a - Levy ""91.nn1.0'1: tffective Le','y Levy Levy
Dollars per Hectolitre of Milk
197 0 0.59 5.-15 1971 0 . 59 5 .4 5
6 11/1971 0 . 23 4. (5 1972 0 . 23 4J,)
6/21/1972 3.40 197 3 0 . 68 3.40
8/ 1/1973 U. 23 1974 0 .34 3 . 40 1975 1. 02 9 . 07
7/1/1975 1. 47 1976 3.06 19 . 51 1977 2.72 15.88 0.57 1 978 2. 27 17. 01 0 .4 5 0 . 45 1979 2 .27 17 .01 0.45 0 . 45
8/1/1979 18.16 0 . 57 1980 2.80 18.16 c
SOURCE: HcCormick, V . "Car.adian Dairy Policy- - The Seventies," Canadian Farm Economi cs , Vol . 15, No .6 .
aStart o f dairy year, Apr il 1, 1970 - 79, 197 9 to present, Aug us t 1. Th e d ata for 1979-80 include data for the period April I, 1979 to July 31, 1 9 8 0 .
b If other than start of dairy year.
Levy
0 . 11 0.16
c A deduction representing the manufacturing milk subsidy on a volume equal to 5 percent of each producer's Class 1 sales.
-.J
'"'
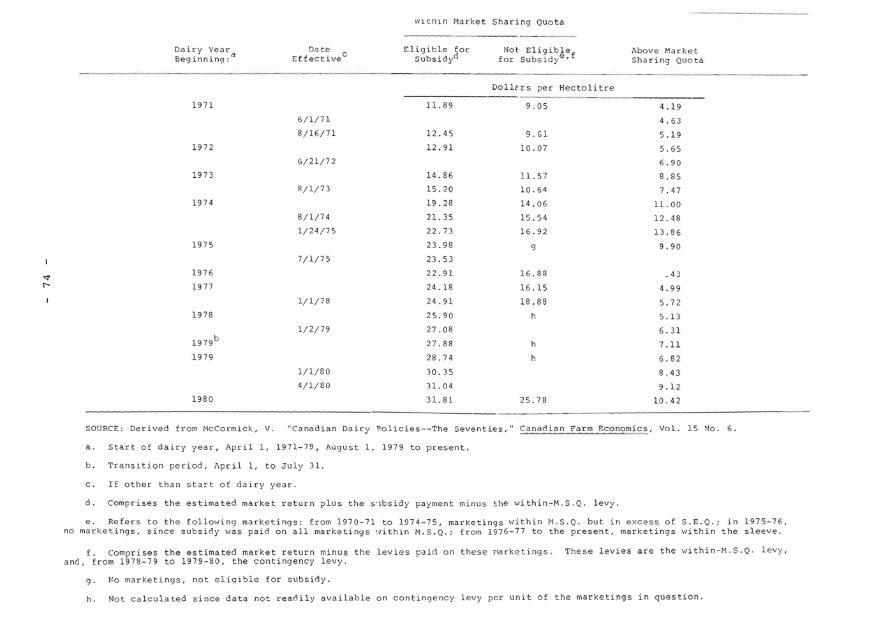
" "
Dairy Year Beginning: a
1971
1972
1973
1974
1975
1976
1977
1978
1979b
1979
1980
Date Effectivec
6/1/71
8/16/71
6/21/72
R/l/73
8/1/74
1/24/75
7/1/75
1/1/78
1/2/ 79
1/ 1/80
4/1/80
wlcnln Market Sharing Quota
Eligible for subsidyd
Not. Eligiblef for Subsidye,
Dol12rs per Hectolitre
11.89 9 . 05
12.45 9.61
12.91 10.07
14.86 11. 57
15.20 10.64
19.28 14.06
21. 35 15.54
22.73 16.92
23 . 98 g
23.53
22.91 16.88
24.18 16.15
24.91 18 . 88
25 . 90 h
27.08
27.88 h
28.74 h
30 . 35
31. 04
31. 81 25.78
Above ~arket Sharing Quota
4.19
4.63
5.19
5.65
6.90
8.85
7.47
11.00
12.48
13.86
9.90
. 43
4.99
5 . 72
5.13
6.31
7.11
6.82
8 .4 3
9.12
10.42
SOURCE: Derived from McCormick, V. "Canadian Dairy ~olicies--The Seventies," Canadian Farm Economics, Vol. 15 No.6 .
a. Start of dairy year, April 1, 1971-79, August 1, 1979 to present.
b. Transition period, i\pril 1, to July 31.
c. If other than start of dairy year.
d. Comprises the estimated market return plus the s'lbsidy payment minus the within-M.S.Q. levy.
e. Refers to the following marketings: from 1970-71 to 1974-75, marketings within M.S.Q . but in excess of S.E . Q.; in 1975 - 76, no marketings, since SUbsidy was paid on all marketings ~lithin M.S.Q.; from 1976-77 to the present, marketings within the sleeve .
f. Comprises the estimated market return minus the levies paid on these narketings. These levies are the within-M.S . Q. levy, and, from 1978-79 to 1979-80, the contingency levy.
g. No marketings, not eligible for SUbsidy.
h. Not calculated since data not readily available on contingency levy per unit of the marketings in question .
- 75 -
wf p~ices a~e shown in Table 36.
The various levies imposed on t h e ma r k e t retu r ns ale i n t e nd e d
not only to prevent productio n f rom exce ed in g commercial
requirements on a butterfdt b asis . bu t a l s o t o g e n e rate f un ds
to s~pporL dlsposdl of s u rplu s es . Th e lev i es . ther~f re o
r ellect the prevailing differences b e t we en do me s t i c p ~i ces
and world market p r ic~s. Tnus . t h e wi thin - quo t a levy is base d
on the costs of exporting s u rpl us p rudu c ts. mo stly n onfat dry
milk , aris 1 n g fro m with i n-q u ota production. Simila r ly, s in ce
all production in excess of the M.S . Q. i s s u rp l us t o
commercia l reQuire ments , the a b o v e -quot a l e vy re f l e c ts t h e
coSLS of d 1sposing of the ent i re p rod u c t Lo n (22 ) The l ev~ l of
Lhe varlOUS l evies are. as sho wn i n Ta bl e 3 5 .
In 1974, t he L . D.C . suspendtlci the S. E . sy s t e m, a nd the
subsidy paymen t became avail ab le o n al l mi l k delivere d wi Lh i n
~he M.S.Q , whtlcher man u factu ri n g mi l k prope r o r exc e s s fl uid
mil k. Furt.h«rmore . in 1 97t) , a ne w fe a tur e . kn o wn a s a
" sleeve ", was introduced lnto lh e M. H. Q. pl an . Thi s sle e v e is
d tolerance , initlally oE 5 pe r ce nt . wh ic h is a dde d t o ea ch
prOducers M. S . g . Only a w1ch l n - quo t a l e vy is impus e d on
dellv~ries wiLhin the sleeve , bu t no d ir e ct s u bsidy is p a id.
The sleeve serv~s . among other t hin gs , t o l esse n the rl sk of
Incurr~n9 above-quota lev~e ti ( 36 ) .
In 1978 -7 9 , a specLal =ont i nge n cy le vy wa i n t ro d u c e d to cov e r
dlSpOS 1 costs of any Ln-sleev e p r od u ct io n . Th e col le c ti on of
this lev y was maie by imposing a re l aL ive ly s ma l l I _vy o n all
d~llverles . But the coll~cted c on t i nge n c y l ev i es we re r e unded
to th" inolviolual p r oducer at t lHI e nd o f t he d a.l. r y year if he
had not producel In th~ sleev e o r LO a l l produce ~s in a
rovince if th~ provinc~ ha d not pro d uce d wi t hin t h e s l e e ve.
Furth~rmure, th~ cont~ngenc y l ev y was r e fun d e d i f t h e
In - sle~ve p · oduct~an was necessa r y t o cov e r comme r c i ~ l
r"quu:Ement.5 (22) .
The Mdrk~t Shaclny ~ u otd plan d i d not oper dtB a s a c o n s tr aint
on mlit: production dur I"J l!l e year 1970 - 7 1 to 1 'J75- 7b b e c ause,
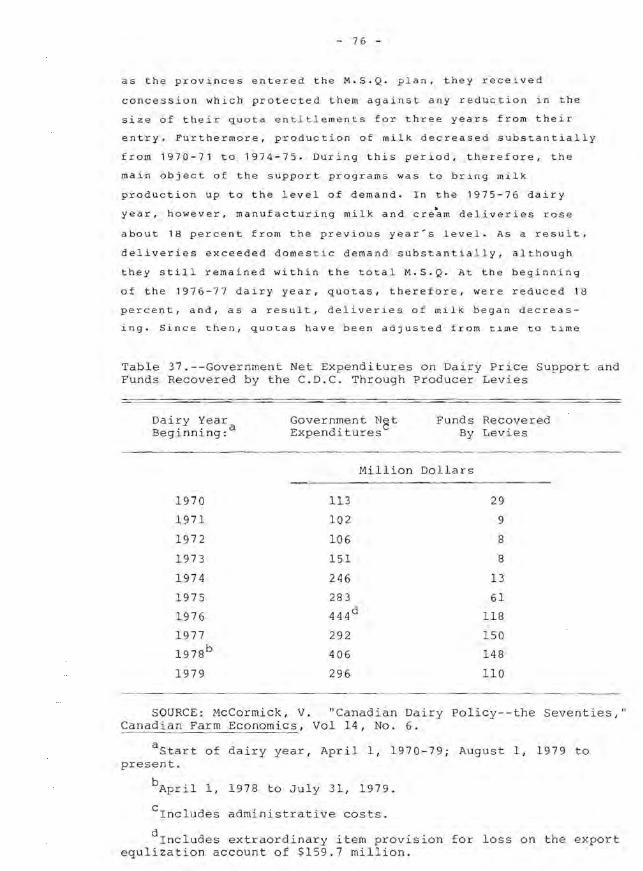
- 76 -
as the provinces entered the M.S.Q. plan, they received
concession which protected them against any reduction in the
s ize of their quota entitlements for three years from their
entry. Furthermore, production of milk decreased substantially
from 1970-71 to. 1974-75. During this period, therefore, the
main object of the support programs was to bring milk
production up to the level of demand. In the 1975-76 dairy
year, however, manufacturing milk and cream deliveries rose
about 18 percent from the previous year's level. As a result,
deliveries exceeded domestic demand substantially, although
they still remained within the total M.S.Q. At the beginning
of the 197 6 -77 dairy year, quotas, therefore, were reduced 18
percent, and, as a result, deliveries of milk began decreas
ing. Since then, quotas have been adjusted from time to time
Table 37.--Government Net Expenditures on Dairy Price Support and Funds Recovered by the C.D.C. Through Producer Levies
Dairy Year Beginning: a Government N~t
Expenditures Funds Recovered
By Levies
Million Dollars
1970
1971
1972
1973
1974
1975
1976
1977
1978b
1979
113
102
106
151
246
283
444 d
292
406
296
29
9
8
8
13
61
118
150
148
110
SOURCE: McCormick, V. "Canadian Dairy Policy--the Seventies," Canadian Farm Economics, Vol 14, No.6.
aStart of dairy year, April 1, 1970-79; August 1, 1979 to present.
b · 1 1 Aprl , 1978 to July 31 , 1979.
crncludes administrative costs.
drncludes extraordinary item provision for loss on the export equlization account of $159.7 million.
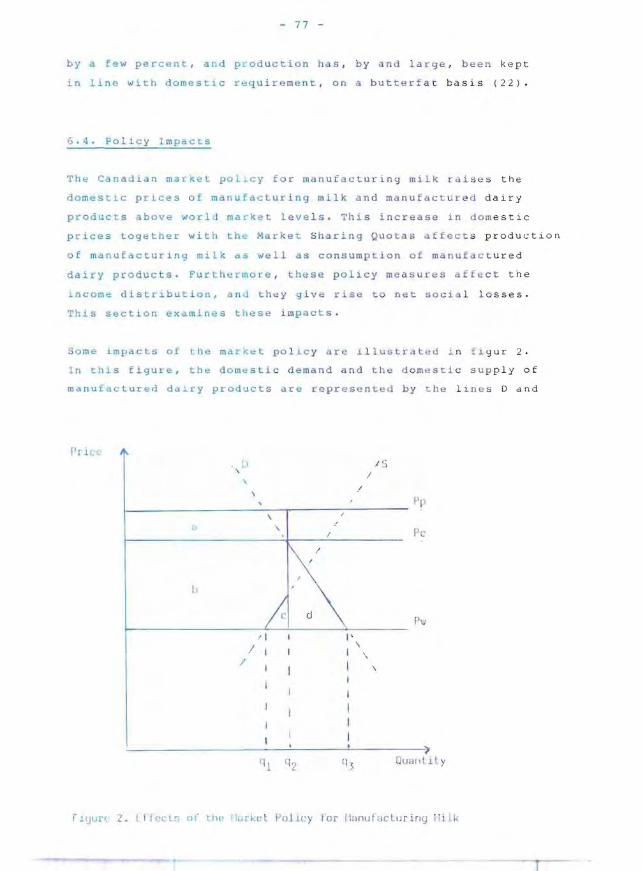
- 77 -
by a few pe~ cent , and prod uct~on has , by and large , been kept
~n line wi th domestic requ irem e n t , on a b u t terf a t b a sis ( 22 ) .
6.4. Po ' ic y Impacts
Th~ Canadlan rna r~dt polLcy fo r m an uf act u~ing mi l k ~ ai s e s the
domestl~ pricds o f manu f acluring milk a nd manufactur ~d dairy
products bove wor 10 ma.ke L levels. This increase i n domest ic
p r i ces together wit h the Market S haring Quo t as affect s produ c tio n
of manuEacturing milk as well as consump tion of manufa c t ur e d
da~ry products. Furth~rmore , these policy me a sures aff~ c t the
.ncom~ distribution, an t hey give rise t o net so ci a l lo sses.
This sect i o n examin e s tllese impacts.
Some Lmpacts of the mark~ l PO l lC Y ar e l i lustra t ed ~ n fL yur 2.
1n thIs figure, the dom~sli c demand and the dom~st i c su p ply of
manu~actured dd Lr y products a r e represented by toe l in e s 0 dnd
I'r I L L I' I I I S
~ /
\ I
Pp
!l \ Pc /
I ,
) Pv " J I '
I \ I ,
/ I \
~------------------~------~---------) OWJnlil y
i"l '-jun L. L l i<'<.l'l ol ' lho 'LJrke L Pu Lwy ror Ilunufocturir lyi 'i Lk
- 78 -
S, respectively. The world market price is represented by Pw,
the domestic consumer price by Pc, and the producer return for
within-quota deliveries by Pp. The difference between the
producer return Pp and the consumer price Pc is made up of the
direct subsidy payment to producers minus the within-quota
levy (the marketing margin is neglected).
In the absence of government intervention, world market prices
(adjusted for costs of transportation etc.) would prevail.
Hence, the quantity supplied would be ql, the quantity
demanded would be q3, and imports would be equal to the
difference q3 - q1. The market policy raises, however, the
producer return and the consumer price to Pp and Pc, respecti
vely. In response to this increase in producer return, produc
tion expands, but only from ql to q2 since the quota plan pre
vents production from expanding beyond domestic requirement on
a milk fat basis. Similarly, in response to the consumer price
increase, consumption declines from q3 to q2. Thus, the market
policy increases production and reduces consumption. As a
result, also net imports decline.
The market policy also involves transfer of income from govern
ment and from consumers to producers as well as net social
losses. Also these impacts are illustrated by figure 2. The
decline in consumer real income, as measured by the decrease
in consumer surplus, is represented by the area b+c+d. This
decline in consumer real income reflects 1) a transfer of net
income to producers equal to the area b, 2) a net social loss
due to misallocation in production equal to c, and 3) a net
social loss due to misallocation in consumption equal to d.
The increase in producer net income, as measured by the
increase in producer surplus, is represented by the area a+b.
Of this addition to producer ~et income, the area a represents
the direct subsidy payments minus the within-quota levy,
whereas the area b, as mentioned, represents net transfers
from consumers. Total net social losses arising from the
policy are equal to c+d, of which c, as mentioned, is due to
misallocation in production, and d is due to misallocation in
consumption.
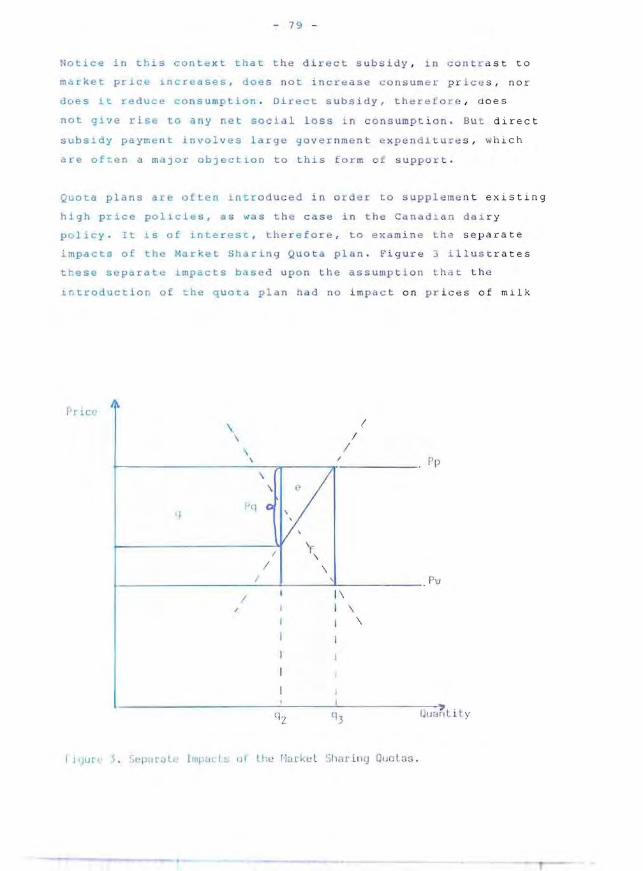
- 79 -
.otice in this context tha t t h e direct subsidy , ~ n c Ont r st t o
market prlc~ ~n~r~ ses, does not increase c onsum e ~ p r ice s , n or
does ~t reduce cons umption . Direct subsidy, there f o r e , (l Oe S
not g~ve r i se to any net socia l loss in c onsumpt i on. Bu t dire c t
su b s~dy payment involves large government e xpenditure s , wh ich
are often a maJor ObJ€ct10n to this form of support.
Quota plans are olten intro uced i n order to suppleme n t e x isting
high price policies. a s was the case in the Canad~ a n da1 ry
pclicy. It is of inte r est, therefore , to exam ine ~he se p a rate
impacts of th~ Milrkel Sharin g Quota plan. Fi gur e 3 illus t rate s
t~ese separ a te 1rnpacts based upon the assump t i on that t h e
l~troductior of the quotd plan ha d n o impact on pr i c es of mil k
Pr ice /
\ / I
\ , • f1 p
\ V " I'q 0
/ 'r \
I \ I \ PII
I I 1\
/ I 1 I 1 \
I I
I I
I . I J I I .,.
QllunL i h '
- 80
and dairy products. In the absence of the quota plan,
production would equal q3 because of the high price policy.
The introduction of the quota plan limits production to q2. As
a result, total market revenue declines by an amount equal to
e+f, whereas total cost declines by an amount equal to f.
Consequently, producer net income declines bye. The quota
plan also reduces net social loss due to misallocation in
production. This reduction is represented by the area f.
Furthermore, the quota plan reduces government expenditures by
an amount equal to the sum of the decrease in producer net
income and the reduction in net social loss. The quota plan
does not affect consumer prices, consumption, or net social
loss due to misallocation in consumption.
The value of farm assets is also affected by the introduction
of quotas. The quotas, themselves, acquire a market value
provided that they are negotiable. In theory, the value of a
single quota equals the capitalized value of the future stream
of net income resulting from having this asset. Obviously,
this net income equals the difference between the producer
price and the marginal cost of production (represented by the
distance Pq in figur 3). Consequently, the total value of all
quotas equals the capitalized value of an income corresponding
to the area g.
Dispite the fact that the quotas acquire a value, the total
value of all farm assets (including the quotas) declines. In
theory, this decline in the total asset value equals the
capitalized value of the decrease in producer net income. (re
presented by the area e). Finally, the value of the conven
tional assets also declines. Since the value of the conventio
nal assets constitutes the difference between the total asset
value and the quota value, this decline in the value of the
conventional assets equals the sum of the quota value and the
decline in total asset value.
It is sometimes argued, that because new intrants have to buy
quotas to get access to the market, quota plans result In in
creased costs of production. But this argument does not hold,
- 81
Un ess the introduction of the quotas leads to h i gher p r od uct
pr1c~. I f the p~oduc c p.ices are l eft un c ha ng~d; the n t he value
wnich t h e quo tas acq u ire is more tha n oEfsel by the decl ine In
che v~lue of th~ conv~ n :~o n el assets. The intro d ucti on of
quat s, thecefocd , do~s not r esult i n h i gher c osts of
production
Tn practice, howev~r , the in t roduction ot quotas t o su p plement
existing high price policies has often led to a fur t h er incre a
se in produ~ t p1iees. Tris i s probably because the qu o ta s elimi
nate some of tne negat1ve impacts o E price in reases . T h e im
pacts of i ntroduc1ng qu.ta plans are. of course . qu it e diffe
rent. if this 15 aCLompd n ied by p r i ce increases .
In sum , the pr 1ce support prog ra ms for mdnufa c turi~g milk
together with the MarKet Sharing Uuota plan incred se
production of manufdcLuring mi l k and r ed u c e s c onsumpt ion of
manufactured dairy produces . Thes~ policies a lso trdnsf e r
net Ln come from co n s ume rs and from g o v er nme n t 0 d ~ iry
farm~rs , dnd they give rise t o net soc ia l l o sse s J ue to
miaal:ocacion 1n pruduction and i n co nsumption . The q uota plan
li mits, however, the ex~ansLo n
pr i ce poiicy, and Ln so doing .
1n
i t
pr o dUctio n due t c t h e
r educ e s the net s ocLal
ir prodUctiOn as well as go v ernmen t expenditures.
h igh
loss

- 8 3 -
PI\R T I II
lKPL lCATIO~S OF DIFF E EN T DA I RY POLICY l NSTRUME NT S
I N RELATiON TO T HE EUROP EAN COMMUN IT Y.
The su r pl u s o f agricult u r al pr o duc ts i n the Euro pe a n Co mmunity
is one o f the most s rlOUS probl e m racing t h e Common Ay ricul
LUra l Pol i cy ( CAP) . The p rese nt h i gh price po l icy [ 0 £ a g ricul
t u ral produc t s nas stlmulate d f a r me r s t o e xpand pr o d uction,
and thlS ex p anslon of prod u c t io n h a s r esul te d ~n substd ntial
s u rpluses of c,;,r t ain agr I c u lt ural pr o duct s , incl ud i n g d airy
products . As the ou Llets f o r s u r p l us da i ry plodu c ts h a ve been
llmltcd , the disposal of t h e s e surp l us dairy produ c ts h as re
quired la r ge su b sidles fr om t he Co mmunity . Fu t h", r mo r e , the
hlgh price polley has not s ucc eeded in in s u r i ng Ldrm e rs an 1n
com", '=ompaJ: a b l~ wi Lh that. in o t h r sectors ot th .. , e cono my.
~his sec ti o n presents f i r st th e probl e m o f su r pl us ag r ccultural
pr oduc t s i n the EC . Next , it ind i cates some implicat i ons of
suppl~me n t.lng ~h", existin g d ~r y p o licy i n th e EC wi~ h measures
used ~ n th e U. S . and Cana da.
~he excess capac1ty 1 n agr i c ultu r e 1 n th e EC is u ndoub te dly
roo~ed in the sam~ co n dil lo n , a s i s the e~cess ~d Pa~i t y in
U. S. d n Cunadidn ayricultul u . Th e s e c o n l t 10 ns d re, as
menl.LOned ~n Part 1 : 1) rap id r at es o f t e cl'l n o logi ccll
~mprove m e n -::s in farml n g , 2 ) a h igh d e gre .. o f asset f ix.1 t y, j)
d compet it ive matket st.ruct ur e , 4 ) a l ow p ri c e e l a s t icity of
de mand f or agr.Lcu l tura: p r odu cLs, a nd 5 ) a low incom u
e l astici ty of demand.
Slnee the edL" _y six"ll!s when Ha t ha way ( 1 1, ) expi a l n"d tH e
d l s~quil.Lbri um i n U. S . far ml mg by th e s imu l ta n eous e Xl s t ence
of the a bo ve mentioned c und .l ti o n s , ma j o r ,~ hang e 5 a tt l' cLing the
s up ply - de m" n d b",lanc' e hav e occ urr e d. 'r h i s i. s true in Nurt h
.'4nerica as '"ell as 1 11 t.he E UlC o p e an Commu n 1 t.y . On e s uc h maJor
- 84 -
change is the restructuring of agriculture; another is the
expansion of foreign demand for farm products.
The restructuring of farm production has, as mentioned in
Part I, comprised 1) adoptions of new technologies, 2) chan
ges in the volume and the composition of resources employed in
farmimg, especially a reduction in the labor force, and 3) a
concentration of farm producti6n on substantial fewer f~rms.
This restructuring of the farm sector, particularly the decline
in the labor force, has, of course, helped reduce the excess
capacity in farming. The restructuring seems, on the other
hand, not to have significantly affected the degree of asset
fitity in farming. Farming, therefore, still has limited
ability to adjust production and resource use in response to
productivity increases or, if that should occur, decline in
foreign demand.
Also the expansion of foreign demand for farm products has
helped reduce excess capacity in farming, but more so in the
u.s. and Canada than in the EC. The importance for U.S.
farming of the expansion of foreign demand is clearly shown by
the drastic increase in U.S. exports of farm products. Of to
tal U.S. cash receipts from marketing of farm products, ex
ports accounted for less than one-tenth in 1950, but it had
increased to almost one-third by 1980.
The expansion of foreign demand has not had the same positive
effects on farmimg in the EC. One reason for this difference
is that exports of farm products from the EC cannot take place
without being subsidized because of the high internal prices.
Thus the supply of farm products still tends to exceed commer
cial demand in North America as well as in the EC. A further
expansion of foreign demand - if it occurs - may help solve
the surplus problem, but to a lesser extent in the EC than in
the U.S. and Canada due to the high internal prices in the EC.
Obviously, the long-run solution to the excess capacity pro
blem in EC agriculture is a removal of resources, particularly
- 85
h Uman r e sou rces , fr om f arming to other s e ctors of t he economy.
Su e s uch a r ~ m o v al o f re sources from f armi ng rapi d l y e l o ugh to
s ol v e th e d i s equ ~l~ br ~um prob l em i s i n hibited b y sev r a l fa c
to r s, in cl ud~ n g the pr~ s en t farm s tructu r e . Mar ket po i cy mea
s u res may t h erefDr~ be an 1mporLant f a cto r in d ~a l i ng wit h the
d i sequilib r ium p r o bl em , e sp e c i a l ly i n t he s h o r t run .
The mar~ et pol icy f or gr i cultur al produ c t s in t he EC a~ ms at
a c hieving t he fo l i o ~ ~ng t wo maJor obJ e c t 1ves : 1 ) a n i n c o me for
f a r me rs comp a ra b l e
be twee n suppl y a n d
with t hat o f othe r se c tor s an d 2) a balance
e man d o f agricultural pro d ucts . The pre-
Sent ma r ke t p ol i c y , how~ v e r , h a s not suc c eeded i n a c h l e ving
t hese obje ~ ti ve s. On e explanatIon of t his lac k o f s uc ce ss may
be that too fe w pol~ cy i n st r u me nts have be e n us e d . As a gene
ral rule , th e numb er of i n struments used to a c h i e v e some ob
j ecti v e s h a s to be at least as larg e as the number o f objec
tL ve s. But CAP h a s rel~e d al mos t exc l us i ve l y on on e i n s trument,
nam ely prLce s u ppo rt , In its a tt e mpt s to ac h i eve the t wo major
ob Ject ives : a c o mpara b le incom e for farmer s and a ba l an ce be
t we e n sup p ly and d~ mand .
rhe de v el o p me n t Ln d arry f a r mi ny during r c ent y ea r s cl c drly
shows the j~ffLcul~ies ~ n ac h i evi n g a comp a rable fa r m income
a nd a balanc e bet ween s u p p l y a nd uem a nd by uSe o f pr 1 Ce sup
p o rt e x c lusi v el y . At tempt s have b e en made to r e d uc e mi lk pro
duetlo n du r i ng c ~rt a 1 n pe r io d s by mod e r at i ng suppo r t p r ice in
crease s Ln that Lhe increase in th e suppor t price have b ee n
set ce ~ ow h~ in~reases i n un it c ost o f pr od uct i o n . As a
result o f Lhis cos~ - p
pr od u c ti on has a l mo sL
lce sque eze , t he expansion o f mi lk
~ orn e t o a stop . Su r p l u s mi k pr o Juc -
t ~ on 1S sc il s UbStdn t lal , how e v e r , a nd sin ce Lhe mod~ r Qt e
prlce in e r 'ases ha~e l~d t o a de c 11ne ~n da i r y far m i n c omes,
lt has bee n difficul t to c ont i nu e t h i s p o l icy tO l a p e r iod
long e n ou y h to slgni f 1 an tly re du ce s ur~l u s mi l k pr od uc t i o n.
Thes~ e xp e r iences s how he need f or suppl e menl l n y t he e xistin g
pri ce po li c y w til '-oILlI et insLrum e nts .
- 86
8. Dairy Policy Instruments.
Some of the basic instruments used in the market policies for
dairy products in the United States and Cananda are: 1) direct
subsidy payment to producers, 2) price discrimination, 3)
levies on milk production, and 4) individual producer quotas.
This section indicates the possibilities of solving the
problem of surplus dairy products in the EC by these
instruments.
8.1. Direct subsidy payments.
Direct subsidy payments, as applied in the Canadian dairy
policy, may be used as a means to increase consumption and,
thus, to improve the supply-demand balance. Dizect subsidy
payments to producers, if used as an alternative to market
price increases, result in lower consumer prices. Lower con
sumer prices, in turn, expand consumption depending on the
price elasticity of demand for the products in question. The
higher the price elasticity, the larger the increase in con
sumption.
Although the price elasticity of demand differs substantially
between dairy products, the price elasticity of all important
dairy products is probably less than -1 when measured at farm
level. This implies that an increase in internal consumption,
brought about by a reduction in consumer prices, results in a
decrease in the internal market revenue. In other words, the
marginal market revenue is negative. Since most other forms
for disposal of surplus dairy products result in a positive
revenue, surplus disposal through subsidization of consumption
is costly. This form of surplus disposal, therefore, although
used to some extent in the EC, cannot be considered a solution
to the surplus problem.
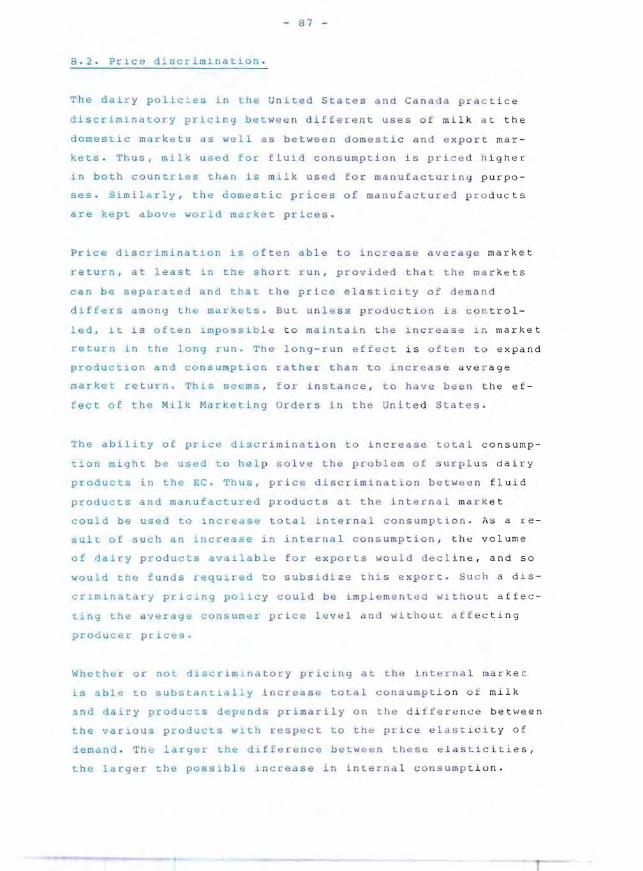
- 87 -
8.2. Pr~ce discr ~m1 nac ion .
The dairy policies in the Un1ted states and Canada prac t i c e
discriminatory pClcing between different uses of mi lk at the
domeSt1C markets as well as between domesti c and exp o r t mar
~ets. Thus, mil~ used for fluid consumption is pr ic~d h i g h er
Ln both countries than is mllk used for manufactur i n g p urp o
ses. Similarly, the domestic prices of manufactured pro du c t s
are kept above world market pric~s.
Price discriminat20n ~s cf t en able to increase average marke t
return, at least in the short run, provided that the ma rke t s
can be separated and that the price el as ticlty of demand
differs among the mark~~s. But unless pr oduc t ion is con tro l
led, It is often 1mpossib le to maintain the in c rease in market
return in the long r u n. The long-ru n e ffect i s often to e xpand
product~on and co nsumplion rather than to increas e a ve r age
market return. This seems, for instance . to have been t he e f
f ect of the Milk Marketing Orders in the Onit e d States.
The ability of prlce di~criminat l on to increa se total co nsu mp
tion might be used to he l p so l ve the problem of s urpl u s dairy
products in tht! EC. Thus, price disc ri mi na t ion b tw o e n fluid
products and manufactured products at t h e internal ma rk et
could be used to Lncr~dse total internal consumpt io n . As a re
sult of such an increase in interna l c onsumption , t h e vo lume
of dairy p r odUct s dVdllable for exports would decl in e , a n d s o
would the ill ncis requu:ed to subsidize this expor t. Such a d i s
cr~minatarf pri -::in g pO l.i cy co uld be l..IDplemenled 'wi t hout affe c
ting tht; averag _ consumer price l e v",l and without aff e c ting
oroducer p r ic es.
Whether or not dlscrim l natory pricing at the int erna l ma rke t
is able to s ubsta ntially in c~ease tot 1 consumpti on of milk
5nd dairy products depends primari ly on t he d i ff e r e n c e b e t ween
the vaClOUS produc~s w2th respe ct to the pri c e el ast icit y o f
:1 em and . The 1 a r g'" r t h '" diE f e ~ e nee bet wee n tie s '" e 1 a s t. i c i t. i e 5 •
the la rger the possLble increase i n intern 1 c onsumpt i o n .
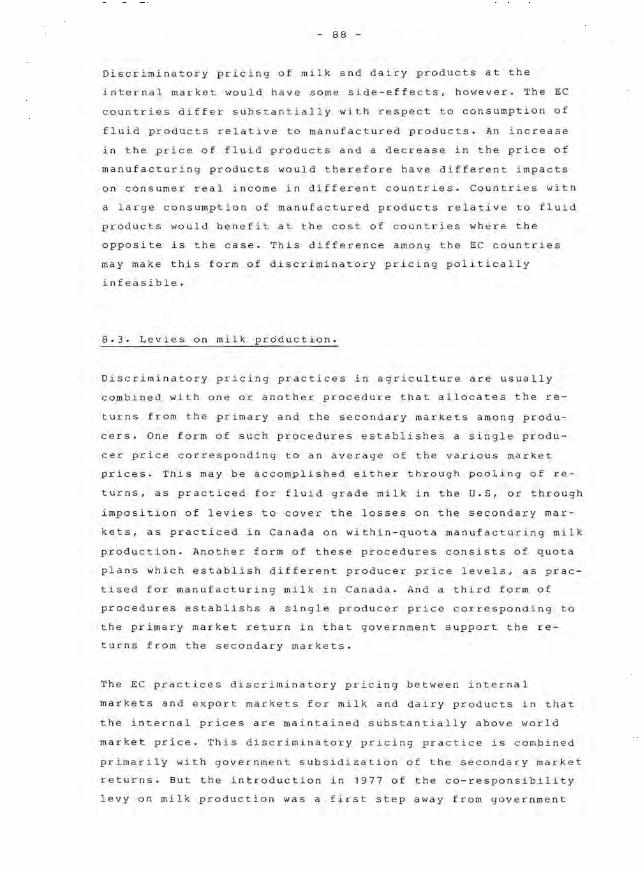
- 88 -
Discriminatory pricing of milk and dairy products at the
internal market would have som e side-effects, however. The EC
countries differ substantially with respect to consumption of
fluid products relative to manufactured products. An increa se
in the price of fluid products and a decrease in the price of
manufacturing products would therefore have different impacts
on con sumer real income in different countries. Countries with
a large consumption of manufactured products relative to fluid
products would benefit at the cost of countries where the
opposite is the case. This difference among the EC co untries
may make this form of discriminatory pricing politically
infeasible.
8.3. Levies on milk production.
Discriminatory pricing practices in agriculture are usually
combined with one or another procedure that allocates the re
turns from the primary and the secondary markets among produ
cers. One form of such procedures establishes a single produ
cer price correspon ding to an average of the various market
prices. This may be accomplished either throu gh pooling of re
turns, as practiced for fluid gr ade milk in the U.S, or through
imposition of levies to cover the losses on the secondary mar
kets, as practiced in Canada on within-quota manufacturing milk
production. Another form of these procedures consist s of quota
plans which estab lish different producer price levels, as prac
tised for manufa c turing milk in Canada. And a third form of
procedures establishs a single producer price corresponding to
the primary market return in that government support the re
turns from the secondary markets.
The EC practices discriminatory pricing between internal
markets and export markets for milk and dairy products in that
the internal prices are maintained substantially above world
market price. This discriminatory pricing practice is combined
primarily with government subsidization of the secondary market
returns. But the introduction in 1977 of the co-responsibility
levy on milk production was a first step away from government
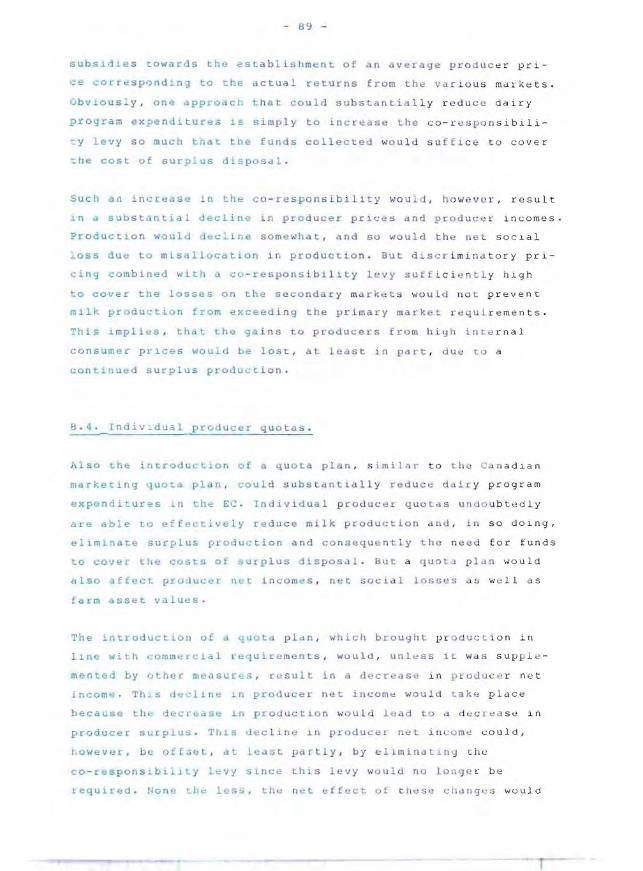
- 1:1':1 -
subs~dies towarJs the eSlablishment of an dveraye ~r o duc er pri
ce cOLr~sPQnd_nJ to t~H actual returns from th e var ious md1k e ts.
Obv~ously . on~ approach t h at co uld substanti l ly r e du ce dairy
program expe n ditures ~s S imply to incr~dbe t he co - r espo nsibi li
~y levy so mucb t~at the funds collected wou ld s u ffi c e t o cover
~he cost DE surp l us dispoRdl.
Such aft incceasu ~n the co - responsib i lity wo uld. ho weve r . r es ult
n a substantia L decline in producer pri~es and prod u~e r inc omes
Product1 0n would decL 1 ne somewh t, and so would t h e feL soc ial
~oss dUd to misallocdtion in production. But d1scr im i n d tor y pri-
cing com bi ned with co-respons ib i l ity levy surf ic i e n tl y high
to cover tne losses on Ll e se<.;ondary market s wo uld no t p reve nt
m1lk produc ian from ~xc~Hd~ng the primary mark et r e4u i rements.
This 1mplitts , th"t he ga in s to producers from hi gh int-e rnal
consumer pr~ces woulJ be lost, at least i n pa r t . du e to a
cont1nued surplus produution.
a. '1. Tndiv_dUQl produc*!r quotas.
Also LhH int-roductlon of a q uoLa plan , s jmilar to t he Ca na dlan
macke~ing 4uO~& plan, could substantia l ly reduce da i r y pro gr a m
expendi ures n the EC. Individual proJu<.; e L quotdS und o u b ted ly
are able to effectively red uce milk production and. so d o ing.
e11mlnd~e surplus pro ' uction and consequ ntly the n ee d for fu nd s
to cO 'J!U the C(Ji;ts of :,urp lus 1sposdl . But a quota p lan ',/Q uld
also affect pruduc~L neL incomes . n~t so c ial l osses a s we l l as
farm asset values.
,'he introductio!l of u ta p lan . which brouyilt pr odu c t ion in
line with commelcial reqUirements . would . unless it. wa s sup pl ~
mented by Dth~r me~s~r~s . result in a decrease in p l o0u c e r net
Lncom~. Th . s ,1<.: 0.: 11n", Ln pro duce !: nOlt incom", wou ld takt: p ld ee
because tile dec,' .. ast< Ln prorJ ucl ion woul d lead to d d ec r"a se 1n
producel: surplus. Tliis uecLine in producer: neL illc ome! could.
row",v'Olr, bl: "iE.;cc. at least. partly. by el~min iltin 9 t il"
co - r~spons~biLity levy ~lnce this le vy would no lonq~ ~ b ~
1. equ ired . I<on tile less . til" n c: t "f feet 0 f t iles > c han g "' :5 woul d
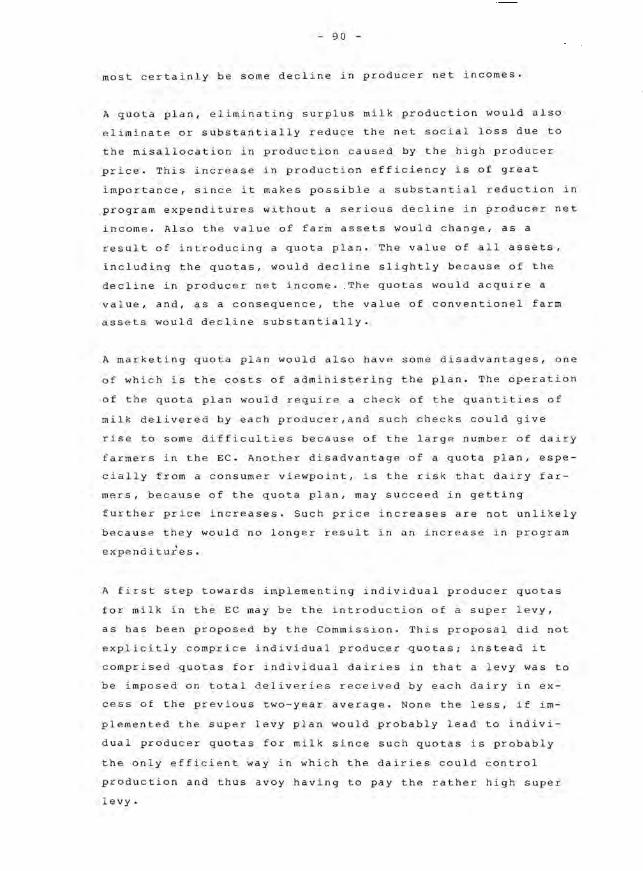
- 90
most certainly be some decline in producer net incomes.
A quota plan, eliminating surplus milk production would also
eliminate or substantially reduce the net social loss due to
the misallocation in production caused by the high producer
price. This increase in production efficiency is of great
importance, since it makes possible a substantial reduction in
program expenditures without a serious decline in producer net
income. Also the value of farm assets would change, as a
result of introducing a quota plan. The value of all assets,
including the quotas, would decline slightly because of the
decline in producer net income. The quotas would acquire a
value, and, as a consequence, the value of conventionel farm
assets would decline substantially.
A marketing quota plan would also have some disadvantages, one
of which is the costs of administering the plan. The operation
of the quota plan would require a check of the quantities of
milk delivered by each producer,and such checks could give
rise to some difficulties because of the large number of dairy
farmers in the EC. Another disadvantage of a quota plan, espe
cially from a consumer viewpoint, is the risk that dairy far
mers, because of the quota plan, may succeed in getting
further price increases. Such price increases are not unlikely
because they would no longer result in an increase in program
expenditures.
A first step towards implementing individual producer quotas
for milk in the EC may be the introduction of a super levy,
as has been proposed by the Commission. This proposal did not
explicitly comprice individual producer quotas; instead it
comprised quotas for individual dairies in that a levy was to
be imposed on total deliveries received by each dairy in ex
cess of the previous two-year average. None the less, if im
plemented the super levy plan would probably lead to indivi
dual producer quotas for milk since such quotas is probably
the only efficient way in which the dairies could control
production and thus avoy having to pay the rather high super
levy.
- 91
The pur p os e of th ~ s r epor t has been to examine po l icy
in s trume nt s u3 e d in th e u.s. and ~n Cd n adian d a i ry polici e s
a nd to indi c a te wh ether s ome of thesa i nstruments c o ul d b e
u s e d t o suppl e ment the e xisting dairy poli c y in lh e EC in
or d er to h ~ lp s o lv e t h e s urplus problem . Before any f in a l
c on c lusion c a n b e mad e a s to th e appropria t eness at cllanging
t h e exi sti n g d a 1 r y po l iC Y, furth e r more deca i led inveHt i gations
ha s ed up on the co ndic l ons in the EC are reguired . Su ch
inv e stigati on s , ho wever , are oucslde the sc o pe of thi s report.

- 9 3 -
SAMMENDR1\G
Rapport~n falde~ i tr~ dalu . F~r~ce del beskriver dels ma l ke
kv~gsaktaren , dels forbLug"t af mejeriprodukte~ i USA o y Ca
nada. Anden del beskr~v~r Oy analyserer markedsordninge r f or
mejerlprodukter 1 de to lande. Tredie de l s kltserer v iss e
mUlighedkr ror ~t fhJ~lp~ p ro b lemern e vedr,rende ove rs kud a f
mejerlprodukter 1 f2l1e5markedet ve d at supplere de e ks i s t e
rende ordRinger med marKe spolitiske inslrument~ r. d e r anv en
des L je amerikansk~ 09 de canadiske ordninger.
hrsagen til overskuddet df 1 ndbLugsprodukter.
de flest~ udvLkl~de markeds¢ko nomier har oVExskud aE l a nd
btugsproJukLer v~, t aL v~sHntligt landbrugSpol i t i sk p ~o ble m
gennem de s(!nes-cn drt~er. Den gr und~gg e nde i"lLSdg t.il delle
ov~r~kud af lsndbrugspradukter er i f¢lg e Hathaway viss e ka
rakterisLik v~d produkLion og forbruy aE Idndb r ugspro d u k tc r .
Disse karal(lerisLik" er: ') hastige leknologiske fre ms kr idt
~nden for den prim~re land br ugsse kt.or, 2 ) et. bety d 0 1 i yt om
idng af Easte ressourcer i sekt.oren, 3 ) t ilna.r mc ls e svi s ful d
Kommer. konkurr~nce, 4) en ueSkeden priselastic i t~t pa e f t e r
sp¢rgslen efter landbrugspro u kter Q9 t i lsvdr~nde 5) en bes k e
den Lndkomste lJ sliciLel.
Vlsse kaedkt~ri5tlka s mvilker kOrt fort"lt pa f¢lgen de ma d e :
Dc teknoLogiske fremskridt medE¢ ree en hast ig fU L¢gyl se af ud
buddet ,,[ ldndOrugsprodukter . Ef t er sp.rgsl en efter lan db r u gs
produkter fOr¢yes derlmoJ kun la nys omt , idet indkomst e d stici
tet"n er lay . "'en ho.sti,:!" fOl:\byelse af udbuddet oy <lIO n lu"y
somme for¢gois@ at ef ,,~sp_ryslen cesulloler i faldynda p tO
uukcpriscT , m~jm in dre pris[aldeL L o ~hindr e s genn e m p o litlske
Eoranst:all: ning ;;,r . lI"rl.1.1 kom mer" , a t tenden sen til t a l de n c. e
rroduktp LisHr fo%st~rke~, foedi pris~last l c ~tet"n . s~ v el h v ad
o,nglir o~fl"'ISP\lJlg5l 11 , s"m Ilv d dng "' u d buddet, e r L lV . "".l ud
buddt~ af l andOrugsprudukte r h ar en b es k ede n ~ ris e l~sti c lt~t
(_ h~~tt E~lJ p~ kurt a1 t) skyld"s del s deL beLydeli':!e om -
94 -
fang af faste ressourcer i landbrugssektoren, dels den tiln~r
melsesvis fuldkomne konkurrence.
Som f¢lge af ovenn~vnte tendens til faldende priser pa land
brugsprodukter og dermed til faldende indkomster i landbruget
har de fleste industrialiserede lande indf¢rt markedspolitiske
foranstaltninger. Disse foranstaltninger har imidlertid i man
ge tilf~lde medvirket til at fastholde ressourcer i landbrugs
sektoren og dermed ofte resulteret i overskud af landbrugspro
dukter.
Malkekv~gsektoren og forbruget af mejeriprodukter
i USA og Canada
Malkekv~gsektoren
Der findes malkekv~gbrug i stort set alle landbrugsomrader i
Nordamerika, men en v~sentlig del af malkekv~gbruget er kon
centreret i visse omrader. Dette drejer sig om the Lake States
og the North East, som tilsammen tegner sig for ca. halvdelen
af USA's m~lkeproduktion samt provinserne Quebec og Ontario,
som tegner sig for ca. tre fjerdedele af Canada's produktion.
Malkekv~gbruget er en betydelig sektor indenfor landbruget ba
de i USA og i Canada, men sektorens relative betydning har v~
ret svagt faldende i begge lande gennem de senes~e artier. I
USA var m~lkens andel af de samlede salgsindt~gter ab land
m~nd faldet til 11 procent i 1978-79. Det tilsvarende tal for
Canada var 15 procent.
I bade USA og Canada udviste m~lkeproduktionen en stigende ten
dens gennem dette arhundredes f¢rste halvdel, men denne ten
dens er blevet brudt i de sidste to artier. I begge lande nae
de m~lkeproduktionen rekordh¢jder i midten af 1960'erne, men
herefter faldt produktionen med sma 10 procent frem til
1973-74. Siden da er produktionen steget i USA, og i 1980 na
ede den en procent over den hidtidige rekord fra mid ten af
- 95 -
&O·~rne . 1 Canada derlrnod forblev produktl0nen pi o mt r en t
Ua>ndrf;;t niv eau igennem den sidsts ha lvde l af 7 0 ' ", rn e , dog me d
nog~n varlat10n fra Ar tll ar .
Struktu~en aE dEn amerikanske 0':] de n an diske malkekvre g s e kt o ~
har und~rgaet v~sentlLg8 rend r ing e r gennem d e scncste a rt i er.
S~v~ l d mi nd l e malkeKvregbr ug so m d e mi ndre ma l kekv~ghol d p A
st~rr~ landbruy ~I n""st~n forsvundet, I vorimod d e t i lbay e b1e v
ne malk ekvroybrug har ud'! del malkekvreglloldet . Denne omst ruktu
rerl.ng har resuTteret i en voksende ko nee nt r aLi o n af m<n l k e pr o
JukLlon~n . Af samtllge La ndbru~ i USA me d ~ t sd lg pd ove r 250 0 $
udg j Orde malkekvreybrugene (groit ta g et brug mM d ov.r 5 U p e t.
af sa ... gsindL<egten Ire! IOdlkekviegho!d) k un 1 2 p et . i 19 74 lkk e
desto min dr e tegnede disse b rug sig for 89 p et. af mal k ekv~g be
sta nder . De tllsvarLnd .. ta l for Canada var i 197 6 h e nhol dsvis
1"l 09 a pet.
Omstruktuceringen dt ru alkek v~gsek~oren hac ogsl medE,lL e n vok
se nd e sp€ciallSerLn~ df produktionen. Af s amLl i ge salysi ndt~g
t er udgjorde indt~gten fr~ sa l g af m~l k sal ed es HO p e t .
1974 i gen n e ms niL for amerLk~ n ske malke kvregbrug mod 77 p e t.
for cand disk e malkekviegbrug . SAvel indt~yten frd s a 19 a E
kreaLuLer som indL~~ten Era andre driftsgrene sp i lle r f~ l
ge1i9 k UIl en besked"H rolle fo r malkekva!gb r ugen e . Fo ud e n ma l
k",koholde~ har langt st'prstcde l en f mdlkekvaagbrugene do g o p
dra!t liyesom angt de fles t e selv produc~rer i de L mi nds e e
hovedparLen aE det g~ovfoder kvaagh oldet fo rt. rer .
Selv am st_trelsen aE malkekv~gbruy ene e r for. g et betyde 1 igt
gennem de senesr~ £rLiu~, er d e (leste af b r ug en~ Iorts a r
fumi li e bluy. 1 y~nn~msnit hav d e amerikanske mdlk~kv~y br ug i
1974 48 ma l k~kl~r oy ~t ar~al i omdritt pa 18 0 acres .
~anad~ske malk ekvagbluy hdvd~ ~ilsvdrende i l Y7b 3 5 m d lke ~¢e r
og 170 acres " rorbedret" la ndbEugsjord. I beg g e l dnde a nve nde s
lung t st.~sted len df malkekvregb rug enes are a l ~ il g rovfo der
dyrkning .
Tl t~oJs for at dun amcrlkanske oy d_rt canadiske mdlkek va gse k
lOI haI urtder~~et en vmti~ntllg om s tr uktureriny, spi lle r f a st e
- 96 -
ressourcer fortsat en stor rolle i sektoren. Dette skyldes,
dels at produktionen er baseret pa hjemmeavlet grovfoder og
derfor n~rt knyttet til jorden, dels at familien udf¢rer
st¢rstedelen af arbejdsindsatsen. Hertil kommer, at bygning
er, inventar og maskiner, der anvendes i malkekv~gsektoren, er
meget specifikke produktionsmidler.
I begge lande er produktiviteten, malt som forholdet mellem
udbytte og indsats, for¢get ganske betydeligt i malkekv~g
sektoren. Fra 1960 til 1980 er m~lkeproduktionen pro ko i USA
for¢get med 63 procent, m~lkeproduktionen pro foderenhed med
18 procent og m~lkeproduktionen pro arbejdstime med 353
procent. I Canada er m~lkeproduktionen pro ko for¢get med 45
procent fra 1960 til 1979. Disse betydelige produktivitetsfor
bedringer viser bl.a., at m~ngden af ressourcer anvendt i
malkekv~gsektoren har undergaet en kraftig reduktion, idet
produktionen var pa omtrent samme niveau i 1980 som i 1960.
Forbruget af mejeriprodukter
Det samlede forbrug af m~lk og mejeriprodukter i USA og i Ca
nada har udvist en forholdsvis beskeden stigning gennem de
sidste to artier. I USA var stigningen, opgjort ud fra
sm¢rfedtindhold ca. 6 procent fra 1960 til 1980 og i Canada
ca . 7 procent fra 1960 til 1973. Denne beskedne for¢gelse af
det sarnlede forbrug d~kker over et ikke ubetYdeligt fald i
forbruget pro capita, idet befolkningstallet er for¢get en
del. Nedgangen i pro capita forbruget udgjorde saledes ca. 15
prccent i USA og ca. 1 1 procent i Canada i ovenn~vnte perioder.
Denne nedgang afspejler betydelige ~ndringer i forbrugsm¢nste
ret. Dette drejer sig navnlig om en over gang til mindre fedt
holdig konsumm~lk, et fald i forbruget af srn¢r sarnt en stig
ning i forbruget af ost. Disse betydelige ~ndringer i for
brugsrn¢nsteret skyldes f¢rst og fremrnest ~ndringer i forbruger
nes preferencer og kun i mindre ornfang ~ndringer i forbruger
priser og i indkomsten pro capita.
- 97 -
Ma~kedsordnlnger £~r me]erip r odukter i USA 0 9 C ~ na da
USA og Canada h.r , l i0~som F~llesmarkedet. m 'k~dsQ r dn j nger
for m~lk. men b'99~ dlsse la nde har ti l Lu r skel f r ~ F~l l e s
markedet. sall"sk.llte onJn.lnyer fOl: henholdsvis indu s l.r i e l maalk
(m~ l~ anvendt. fortr.lnsv~s tl l frernsti ll ing aE s m¢r, o s t og
sKummetm~lkspulver) oy ko nsu mmaalk .
Navnllg den ~merl~unske.
for Lndusrri~l m~lk har
men o gs4 den ca n Bd i ske marke d so r dnlng
mange li g h edspunkt e r med F~ l le s mar ke-
ets markedsor jnLoy for m<e l k . Savel. le n ame r .l.kdns k e s am de n
canadls ke mark~dsordnln9 for i n d u striel maa lk si k rs r s ~ l u des.
:lgesom F~ ll e sm arKedets ordning, e n vis m.l o dste pr odu c ent pr is
p~ maa lk gennem lmpO tt reSLri ktioner 09 gennem opk¢ b df over skud
aE lndustri~lle mejeri p rod ukter. Den cdna di ske ma rk edsor dning
fDr 1ndustriel m~lk atvlg~r da ri mod f ra F~lletima r Ke d e t s mar
kl:dsordnl.ng Lor malll< ved at yde d ire k te pl: i s til s k d t il produ
centerne og v~d at ~¢re b~ug af markeds k vote r.
Den amerlkansk~ 09 d n cana d iske mdrke ds ordnin g for ko ns umm~lk
opr tholder priser pA kons umm~lk . der li9yer o v er pri s e r ne p~
in dustl <'I m .. lk.
Ma rk .. sO ldn1nger for i ndustr~e l m~lk i USA
Den d merikanske Itdrk;;dsoLdnl ng for i nd u striel ~l k <) 1" fa s lla g t:
.L Agrl.cult u ral Act of 1 '~-l'J med se n ete ~ndringer . ['le nne loy pa
l<!!gger lan btu':lSmlnlst~r,.n <..I t slkrl! pLodu c; ent ~L· n<.! "' '' Vl S m.lnd
st<.!pris pa .i ncJustt:.Lel lIU:i!lk . Denne ml n dst.spri s , k alde L s~ .p t ,,
pr.LSen, s k a l 11yg .. p~ eL nive~ u - l n uen for inter v all e L 75 til
9U procent a p ri~etsprs~n - Born mtnlsts Le n fi n der n¢dv e ndiy L
I " ~ at si .re en tilst.raakl:el ig l orsy nl.n'! m.v.
St:1)ttepr ise.n, ng.1.vt) pruce n t. f maalkens p ritet s pr i s .
frtsts~tt~. s~dv~nl~gvl~ ~n yang drl igL forud for m e J eri ~ £e t s
b~yyndels@. ~t¢ t~pri~en, ilnYl v et i doll c s . fasts~tt" S Llge-
1", es Veu m~Jetlal' ''ls b,=':!ynJ"l s e . men justere s h"Ludove l' med
- 98
visse mellemrum inden for aret i takt med ~ndringer i paritets
prisen.
Producentprisen pa m~lk sikres mod at falde under st¢tteprisen
gennem opk¢b af industrielle mejeriprodukter, navnlig sm¢r,
cheddar ost og skummetm~lkspulver. St¢tteopk¢bene har gennemga
ende v~ret beskedne i 70'erne, men med betydelige fluktuationer
- malt i forhold til den samlede m~lkeproduktion fra n~r ved
o procent i 1973-74 til 5-6 procent i 1970-71 og i 1979-80.
St¢tteopk¢bene er suppleret med savel importrestriktioner som
med foranstaltninger til afs~tning af overskudsproduktionen pa
hjemmemarkedet og pa eksportmarkederne. Den samlede import af
mejeriprodukter har v~ret beskeden - svarende til 1-3 procent
af den samlede m~lkeproduktion (pa sm¢rfedt basis) i 1970'erne.
Ogsa eksporten har v~ret beskeden - fra 0 til 2 procent.
Markedsregulativer for konsumm~lk i USA
Langt st¢rstedelen af m~lkeproduktionen i USA er af konsumkva
litet (85 procent i 1980). Kun omkring halvdelen af denne m~lk
anvendes dog til konsumm~lksprodukter, medens den overskyden-
de halvdel anvendes til fremstilling af industrielle mejeri
produkter. Pris e n pa m2lk af konsumkvalitet uanset om den anven
des til konsumm~lksprodukter eller til industrielle produkter
er reguleret af federale markedsregulativer i langt de fleste
omrader af USA. I 1980 var der i alt 47 sadanne markedsregula
tiver, der hvert d~kkede et n~rmer e afgr~nset geografisk omra
de.
Det enkelte markedsregulativ er udstedt af landbrugsministeren,
s~dvanligvis efter anmodning fra m~lkeprodu c enter inden for det
pag~ldende omrade. Men regulativet tr~d e r f¢rst i kratt, e fter
at det er vedtaget ved afstemning blandt producenterne.
Hvert regulativ fasts~tter minimumspriser savel pa m~lk anvendt
til konsumm~lksprodukter (1. klasses produkter) som pa m~lk
anvendt til andre produkter (2. klasses og i nogle regulativer
- 99 -
dt:suden 3 . klasses pr o dukLer). Di sse minimumspriset- , SOm meje
~l.rna ska1 bet Ie for m~lk af konsumkv ali t et , fa~ts~Lt s pa basls aE Mlnn~sota -~ls con s in (M - W) prist:n p~ indu str i~l m2 k .
P r is .. n pa l . k.ld !;:i":i m ... 1 k b e s t drs d led e s a f ~I - P r i s e n p 1 use t
Vlst ti ll~9, ·Je £ Vdrl"r~r gdns ke beLydel i g~ mell .. m mark e cso m-
r d,:rne (re9u ativer:>e) - 1. 19 76 fra 1.1 2 $ p r o <: W 1:. ( 45 , 4 kg)
i tie Upper ~ll.dwest til J , 15 $ pr o e wt i South",rn F l u rlda . Sam
f¢lg a. d~nne Va Latlon i t i ll~9yetS st¢rrel s e varlere r ogsa
prlsen pa 'I . !;l-sseS m ... lk. Prisen pa 2 . kldsses m ... l k er i aIle
Qmr;der stort set sammenfalde n de med M- W prisen, oy p ri sen pa 2. kld::;scs ~lk varl.erer sAledtls 1)<: k", me l l",m omr . d t!r n <! .
Oven na.vnte prlsstruktul
ior egentli9 kQnsumm~lk
aEspe ] ler det f o rho l d , l (narK-e der ne
9<! nn e mgaend e er l okalpl~ged e , Il vilke t
skyldes de rd~at vt h_Je o mko s tning er , de~ er i o rbund et med at
rrallspo!. e1.02 moelk oveL stlbrr e afstande , meden s IDdl"edet for
.ndee mejeriproJ uktel e~ nalionalt .
30m f~1ge af ot mlnimumsprisern€ pa m~lk af ko n sumkvallt e t er
koblede ti M-W pris~n pi i nd ust r ie l m~lk, varier~r dis se mi-
nimumsp r iser ovur t_d 1 ta k e mad ~ndringurn i M- W p i.. i se n .
Uett" '3a:ld.n· , hvad t'<nL"1I .enclrlngerne
~ndlLnqe r i mack~dssituatlonen e l 1el.
se n for ind usLrl",1 m~L~.
i M- W prise n be r u c pa
pa .cncl rillg e r J. t\6llep rl-
sJmkvalilet: , fl'ilwger at dens any ·ndels ." modr <1g e r d en en k e lte
Idndmand samms pl.!.. ior hale sin leverdnc~. PruJucentpra sen
~d~¢ces nemllY ~l ut ve)et g~nne m sn1. t d e r e1 basereC del s pA
1\1 s.,;",p1"i.se n e de" s 1?a den an ,,1 af m.elken, der cl :lv o nd e s ind e n
iClr ol., l",.p~kttv" kldssei 1. deL pa~~ltl .. nd e m rk",(Js o mr a Je
(pll(:r ur. d el tl.dell !,ld J .. t. Pdg~lde nd e mej ei-a ) . Produc .. ll tpr i s e n
var1.~r~r betyd~_Lgl m E ll ~m md r k edsumr'derne . DeLt e s k y t de s
l~ke al~llc den ffit omLal~e vclxiation i ' . ~ la s s e p ri sern e , men
oc:;sa e ll beL}del ':1 wdci Clo n melle '" om r'delne , hv",d .~ng Clr
m~lkens anvtndcls~ .
100 -
Markedsordninger for industriel m~lk i Canada
I Canada er reguleringen af markedet for industriel m~lk et
federalt anliggende, hvorimod reguleringen af markedet eller
markederne for konsumm~lk er et provinsielt anliggende. Denne
forskel med hensyn til reguleringen af markederne for m~lk
afspejler fordelingen af jurisdiktionen mellem den federale
regering og de provinsielle regeringer i henhold til den cana
diske grundlov. Den federale regering har if¢lge grundloven
jurisdiktion over markeder for landbrugsprodukter, der - som
fx industrielle mejeriprodukter - afs~ttes interprovinsielt og
internationalt. De provinsielle regeringer har derimod Juris
diktion over markeder for landbrugsprodukter, der afs~ttes in
den for de enkelte provinser, som det er tilf~ldet for konsum
m~lkens vedkommende. Kun markedsordningerne for industriel
m~lk behandles i denne rapport.
Markedsordningerne for industriel m~lk har undergaet v~sent
lige ~ndringer gennem de sidste to artier. Siden midten af
1960-erne har ordningerne dog omfattet en producentprisst¢tte,
dels i form af en markedsprisst¢tte, dels i form af et direkte
pristilskud. Desuden har ordningerne omfattet tilskudskvoter
i arene 1967-74 samt markedskvoter siden 1970.
Den samlede producentprisst¢tte fasts~ttes pa basis af en
politisk fastsat ~lkepris, kaldet malprisen. Malprisen er en
tilstr~bt, men s~dvanligvis ikke opnaet producentpris. Den ud
g¢res af en beregnet national markedspris ab landmand samt det
direkte pristilskud. At producentprisen har v~ret og fortsat
er lavere end malprisen, skyldes f¢rst og fremmest, at der fo
retages visse fradrag i tilskuddet eller i markedsprisen i
tilknytning til kvoteplanerne.
Siden april 1975 har malprisen v~ret reguleret pa basis af et
faktorprisindeks for malkekv~gbrug; dog med mUlighed for hen
syntagen til afs~tningsforholdene for mejeriprodukter. Regule
ringen af malprisen finder sted ved begyndelsen af hvert
mejeriar samt desuden i l¢bet af dret, safremt ~ndringerne i
det n~vnte faktorprisindeks overstiger en vis st¢rrelse.
1 CJ I
De l eks~ s t~rpr ing~n Eas t e r eg l e l me d h e n syn ~i l opd el i n gen
af m~lprisen p~ len h olJsvis ma r k ed sp r i s 09 d i r e k t ~ p r~s t il
akud . Men ved egyndelse n af m~ j e r i ~ r e t 198 0- 8 1 u dgJo r Je de to
pr1selementer henholdsJis 83 og 17 pr oc en t ar m~lpri s e n . Mar
k~dspr:sst¢tten sket genne m opk ¢b aE n a v n lig s ml t o g s ku mmet
mao lkspul v er .
Mdrke~sprisst¢tten 09 ~eL d~r ek t p r i s~il s ku d ta b l e l e r et v i s t
ge n ere l l producentpr~sn 1 ve au . Det te g e e _ el l ~ p r i s n i v ea u modi
ficeres d og i v~sentl1g gr a d af k votep l a n e r n e .
I 1967 blev tllskudskv Lep l anen for in d ustr i el mffi lk i nt roduce re t
bI . a . med det Eor m6i at b o r t s ka ff e d en d a var e n de ov e rs k udspr o
duktion . Hver industrial rn~l ke p ro d ucent f lk o p r i nu e l ig tildelt
en kvote at sa mm e s t ¢rrel s e s a m ha ns m~ l k el ev e r ance i ~ r e t
[orud for plan.ns etabl~ri n g . Dog v a ~ d er s ave l e n unJ e rgr~nse
som en oveEgr~n.e fO l st¢rr~l s e n a f de en ke lt e k voter .
T Llsku d sk v Qtepidnen plvLr k ede i kk~ ma rked s p r i s e n pa m~l k . men
tjent~ t il dt regula r e det f . r om ta lte dir e k t e p r istI l s k ud.
Producenten fik i¢r p La~e n s eta bl e ring u d b et a l t t i l s kud f or
he Ie h a n s m~lke everance . Un de r plan e n d er im o d t i k p ro Quc e n ten
kun s~¢t t e f or den del dE l evera n c e n , d er l ~ i nden fo t h a ns
kvate . Desuden blev der rn o ci regne t to fradra y i t ilskudd e t : et
beskede nt f l a d lag for l~ve rd n c er ~ nd e n fat kv u L~ n o g .L b t y
ligt Bt ¢r r e (o r lev~rancer udove r k v ote n . S i dstna vn te f rddr a g
L I~v dog f¢rst 1ntroduc~ret t o 1r efter pl a n e n s ik r at tt r~de n.
D~Ti u.Lrekte efie lo. df tJ _ S kuds k v ote p l cl ne n va r at " ta b l er e to
p,.snlvea u el , som d.,,, ellk~l L e pro d u c e nt stod o verf o lo : e t r,.,l a
tl.\'t h¢ ] !: giElldende for leve r a ll <.:er in d"n t or kvo t en Og a t: Va2sen t-
1 1g laver .. qceldendoi: for le v er an ce . ud ove r k v o t .. n . Fx udgjorde
producenLp r~scn ~r ave.kvo t e pr oduktion ku n 5 b p ro cen t af p rl
sen for k v oteprodukLion i 1 9 9 - 7 0 - de t f. r ste Ar d a Ov e rkvote
af9 i fL~n var Lk r drt .
Tjiskudskvor:eplane n umfactede k un Cd . 8 0 CO 0 c e n t a f de " m.., 1 k •
d~r ~ n v"ndtes til EremsLl111ng a ( i ndu st r.L el l e mD] er i pr u d uk t e r .
O~erskyde n d~ kons umm~lk , d e r u~ gjo [ d e d~ r "st~ l e n de ca. 20
[Hr:JC€nt , v 1. "",mliq ud",n;:or p l a n e n. Dette f o e hold v,l n:-.;k e l ig- 7 h
102 -
gjorde styringen af m~lkeproduktionen, og markedskvoteplanen
blev derfor introduceret i 1970. Tilskudskvoteplanen blev dog
f¢rst afviklet i 1974.
Ontario and Quebec deltog som de f¢rste provinser i markeds
kvoteplanen fra 1970, og alle provinser bortset fra New
Foundland var tilsluttet planen inden 1. april 1974.
Oprettelsen af planen skete ved aftale mellem the Canadian
Dairy Commission, der star for administrationen og udviklingen
af den federale markedspolitik for mejeriprodukter, og
provinsielle markedsudvalg for mejeriprodukter.
Markedskvoteplanen omfatter savel egentlig industriel m~lk som
overskydende konsumm~lk. Hver producent mod tog oprindelig en
markedskvote af samme st¢rrelse som hans tilskudskvote eller
som hans leverance i aret forud for provinsens tiltr~den af af
talen, h v is denne leveran c e var st¢rre end tilskudskvoten.
Under markedskvoteplanen l~gges der afgifter pa de enkelte pro
ducenters markedsprovenue - en beskeden afgift pa leverancer
inden for ~arkedskvoten og en v~sentlig st¢rre afgift pA lev8-
rancer udover kvoten. De forskellige afgifter har til formal
ikke alene at regulere m~lkeproduktionen gennem etablering af
forskellige producentprisniveauer, men ogsa at opsamle midler
til at d~kke tabet ved afs~tningen af overskudsproduktion.
Afgifterne erstattede de tidligere omtalte fradrag i det di
rekte pristilskud. Efterhanden som provinserne tiltradte pla
nen, udbetaltes tilskuddet derfbr fuldt ud - indtil 1974 for
leverancer inden for tilskudskvoten, og siden da for leveren
cer inden for markedskvoten.
Den direkte effekt af markedskvoteplanen er, at etablere
forskellige prisniveauer g~ldende for den enkelte producent.
Siden 1975 har den samlede nationale kvote stort set s v aret
til den kommercielle eftersp¢rgsel efter mejeriprodukter pa
sm¢rfedtbasis, og kvoteplanen har stort set forhindret
overskudsproduktion af sm¢rfedt.
1 03 -
E f fekten at fors k ell Lge rna r kedspoli ti ske lnstrumen e r i
c:lation t~ l overskuddet af mej e riprodukter 1 F~l lesrn ar kede t
Probleme!:. vedr_tande over skud af landbrug sproduk t~ r.
5;. en Hathaway ~ uegYl1delsen af 1960'er n e fr e msatte s i.n teori
on arsagen til ovcr s kuddet f landbrugspr od u k t er i USA , er der
sket en omfattenct - omstru kturering af l and br ugsprodu k tion e n -
bbdc i Nordd merika og i F~llesrnark edsl a n de ne. Desu d en e r den
Jdenla ndsk~ e r tersp0rgse1 efter la nd bruysprodukter ¢ ge t ganske
v~sen~ l l g t . Diss~ ~ndringe r r e Js er na tur l lgvi s sp~rgsma l~ t am
~eorlen fortsat holder.
[lmstruktur.;rin9",n af lc= n d bcugspr o duktio nen har omfa t tet indf¢
relse af nye tcknologler , ~ndringer i rBssour c e fo r b r u g~ t , h e r
und~r navn_Lg en red u kLion i arbeJdskraftforb r uget , sam t e nd
vider~ en ~uncenLratjon af produk~lonen p~ f~ r r e 1andbr ug . Den
ne omstr uk ~ u r o:.t_DO}, I, erunder is~r r edu k t i.one n i arbe j ds k raft
ior b r ug e t og i antallet a f La nctbrug , har me d virk e t t ll at be
sr~nse o v ers Ku dde t ~ f 1 ndbrugsprodukte r . Omstruktur e r1n gen
synes der i~ od ikke aL h ve med C¢rt , a t la ndbrug e t s r eS sourcer
er bl~vet v_s~nt~ig mi ndre fn9te end li dllgere. Oette be ty d er,
t landbrugss~k oren feresat har vanskeligheder me d at t ilpas-
se udbudeL af landbrugsprodukter t~l efte r sp¢ry slen
bi~Jel s e med pred ukt ivi_etsfo%_ g e1 ser .
x . i for-
I:o!" USA's vedk~mm nde holr den st i ge nde ud e nl n <l ske e t"r s p¢rg
s",l eieer Landbruysprodukter res u lt ~ret i, at en starrkt v o ks e n
de and~ l aE dets 1 ndbruys produkt lo n gar t ~l e kspor t - 1 1950
teyn~de ~ksportBn Sl~ tor un der e n tiend ede l af s~lys i nd Lagten
a b and m n d ; Ln~~n 80 var Jenne andel Yokset t ~ l nresle n en
t r~dJ~del . Denne £o r .gelse a t USA's l~ " dbrugsekspor t l ar natur
l~~v~s L v~s e n tlLg grad bidra g et til a t furm i ndsk e oveL s kudska
~~ ( lteten L USA's land LUg . I ¢vr i gt er dw i ntetnu peise r pA
U 5~'s viqti3ste ~tspoctvale r s tort set samruenfa l dend me d ver
d ~nHm~~kudspriselno, hv_lke L i ndebrer e r , a t ekspo~ten s to rt set
): III f ud r. s,:",d u .h : n cd,51-0) tSL¢tte.
104
For F~llesmarkedets vedkommende bidrager den stigende udenland
ske eftersp¢rgsel ikke pa tilsvarende made til at formindske
overskudskapaciteten. Dette skyldes bl.a., at F~llesskabets
landbrugspriser v~sentlig overstiger verdensmarkedspriserne,
og at eksport af landbrugsvarer derfor s~dvanligvis kr~ver en
betydelig eksportst¢tte.
Sammenfattende kan det siges, at tendensen til overskud af land
brugsprodukter fortsat synes at eksistere i bade Nordamerika og
i F~llesmarkedet. For USA's og Canada's vedkommende kan en
fortsat stigning i den udenlandske eftersp¢rgsel, hvis den
indtr~der, bidrage til en l¢sning af problemet. For F~llesmar
kedet er situationen imidlertid en anden, idet en eventuel
stigning i den udenlandske eftersp¢rgsel kun vanskeligt kan
udnyttes pa grund af de h¢je interne priser. Der er derfor god
grund til at unde rs¢ge , hvorledes de eksisterende markedsord
ninger i F~llesmarkedet kan ~ndres, sa overskudsproduktion
reduceres eller undgas.
Forskellige markedspolitiske instrum en ter
Trods mange lighedspunkter mellem markedsordningerne for meje
riprodukter i USA, Canada og F~llesmarkedet indeholder de ame
rikanske og de canadiske ordninger nogle tiltag, der hidtil ik
ke er anvendt i EF. Dette drejer sig bl.a. om 1 ) direkte p ris
tilskud til m~lkeproducenterne, 2) prisdifferentiering pa det
interne marked, 3) producentprisafgifter til finansiering af
tabet pa sekund~re markeder og 4) markedskvoter. Rapportens
sidste afsnit skitserer mulighederne for at l¢se F~llesmarke
dets overskudsproblem ved at supplere de eksisterende ordning
er for mejeriprodukter med disse tiltag.
Direkte pristilskud til producenterne
Direkte tilskud til producentprisen, som praktiseret i Canada
for industriel m~lk, kan blandt andet tjene som et middel til
at neds~tte forb rugerpriserne pa mejeriprodukter. Et sadant
10 5 -
produc ~ n t p ris ti l s k u d a s k il l e r 9ig i _konom i sk h nse ~ n de ikke
fra at t i lsk u d ti l direk t e n eds~tt e lse af f orbru g er p r i serne.
I rel a tion tLI oversku d e t af mejeriprodu k ter i F~l le sma rkedet
hac ~i skad Lil n ed s~t~el s e a f forbru g erp r ~ser en vis interes
se ; det t e g~lder h vad e n te n d e be n~vnes pr o d u c e nt - e ller for
brug~rtilak u d . En neds~ tt el s e af forbruge r prise rn e v i l l e nem-
1 1 g f¢re ti l e n udv~d~ls e af forbr u g e t pA de t i n t e r ne marked.
Herved v ille afs~ln~ngen a f me je r iproduk te r pcl d e s ekund~re
ma rkede r ku nne red u ceres , og de t samm e v i l l e F~l l essk a b ets
udg~fter L ~ l d~kn1 n g af tabet ved d e nne a f sretn i n g.
Til s k u d t ll neds~tte l se d f f Qrb r ugerp r ise~ er imi d l ert id en
bekoste lig for m for a f s retning s fremm e . Ef tersp_r g s l e n ef ter
a Il e b et y de nd e m eJ ~ r ipr odu k t e r er pris u e l as Li s k . Da t l e inde-
b~rer , a t f or¢y e lsen aE a fs~ cn i ng e n p d e t inter n e mark ed
gennem en p ri sneds~t lels~ resul t e e r i e t n eg a ~ i v t marg inalt
provenu~ . I m o ds~tnin g he r t il gi v er a n dr ~ f o rme r" f or af s~tning
aE ove r sk u ddet oft~ s t et pos it ivt prov en u e . T i lskud t~ l ned s~ t
te ls e at forbrug~rp r is~r ee s i l e des re la ti vl be ko s l e l ~ 9 og er
derior n~pp@ no g en l~sni n g a f o v e rsk u d s p rob le me t. De tLe g~lder,
se l vo m s lda nn e til sku d har p o s i Li ve s i d ~ r b~de set u d fra e t
forbruye r s yn spu n kt og set u d f ra at v e lf~r d s. k o llom i sk s yn spunkt.
PrlsdiEterentler i ng pa de t inte r ne ma rk ed
I b aae USA oy Canada dllven d e s pC 1 s dlf f er e nti e r in g mell e m for
skellige mejeriprodu k Ler p i d t i nL er ne mar ked (i U ~~ gennem
ell un i ldgelse fra monopol lovglvn i ngen) . i d · t der i b e g ~e Land e
o p retho l des h¢)ere pe i ser pi m~l k anve nd t ti l konsumm~l kspr od uk
ter e nd pa m~l k anv~ndt Li l a ndr~ f ormal .
Slg~eL med at anve n d~ prisdi ff e r ntie ri n g in e n for l an db rugs
politlkken ~t s~ vdnli ~vl s ~ t f o r ¢g e d e n g e n n em sn l t l i ge produ
cen~pr i s 09 dermed pro~ u ~enLerne s i n kom s Le r. Me dmindre st¢rrel
sen at p r oduk~i ~ nen rag u le ~ es , f¢ r~ r prl s di f terel t i er i n g inden
~cr Land b ru g ssekLor~ n dog p i l i dt l~nge r e s iy t s n aL e re til en
vis udvi d els~ d prod u ktio n o g f orb rug end t i l et h¢j e r e gennem-
106 -
snitligt prisnivau. Arsagen hertil er, at den oprindelige for¢
gelse af producentprisen s~dvanligvis resulterer i en udvidelse
af produktionen, og en sadan produktionsudvidelse medf¢rer fal
dende priser og et stigende forbrug.
Det er af interesse i relation til situationen i F~llesmarke
det, at prisdifferentiering kan anvendes som et middel til at
for¢ge det samlede forbrug af mejeriprodukter uden at pavirke
disse produkters gennemsnitlige prisniveau. En for¢gelse af
forbruget af mejeriprodukter pa det interne marked ville nem
lig indeb~re, at den tabgivende afs~tni~g pa sekund~re marke
der kunne reduceres.
Om forbruget af mejeriprodukter kan udvides v~sentligt gennem
prisdifferentiering afh~nger navnlig af forskellen mellem me
jeriprodukterne med hensyn til eftersp¢rgslens priselasticitet
Jo st¢rre forskel mellem disse priselasticiteter desto st¢rre
er muligheden for en forbrugsudvidelse.
Prisdifferentiering mellem forskellige anvendelser af m~lken
har imidlertid en r~kke negative sider, bl.a ville en sadan
prisdifferentiering give nogle af EF-landene fordele pa be
kostning af andre EF-lande. En prisdifferentiering, der bestod
i at h~ve prisen pa konsumm~lksprodukter og s~nke prisen pa
industrielle mejeriprodukter, ville saledes give lande med et
lille forbrug af konsumm~lksprodukter relativt til andre meje
riprodukter en fordel pa bekostning af lande med et relativt
stort konsumm~lksforbrug. En sadan forskel mellem landene kan
naturlig v is vanskeligg¢re indf¢relsen af prisdifferentiering
for mejeriprodukter.
Producentprisafgifter til finansiering af tabet pa sekund~re
markeder.
Den canadiske markedsordning for industriel m~lk omfatter et
system af afgifter pa producentprisen, der bl.a. har til for
mal at fremskaffe midler til at finansiere tabet ved afs~tning
en af overskudsproduktionen. Ved indf¢relse af medansvarsafgif-
107 -
ten L 197, tog F~_le5markedet de c f¢r s te sk r idt i s a mma reLning,
men rneda n svalsaf9Lft~n har hi dt i l kun d~kke t e n b e s ke den andel
~f udgifterne forbund8t med a£sat ni n ge n a f Dv ersk u d spr oduktio
n~n . En narliggende muliy h ed fo r a t reduc e r e nelt uu d g Lf Lerne
vedr.rende malkedsordnLngern e for md ] erLproduk l e r er i midlertid
s~mpe L h~n aL Eor~ge meda n svar s af g if te n ~ i l str~k k el i9 L til, at
provenuet Era denne dfgift k a n d~kk e ta be t ved a fs~tn L n gen p~
d~ ~~k u nd~re markeJer.
!~ saan for¢981se a! med d nsvarsafgiften vil l e imLdl e rtid re
Mulcere L en betydeIlg n~d g a n g i p r odu cen t pri s e n og der med i
produc~nternes lndkomsLer .
Desuden ville ploduktLOndn f o r mindsk es noge t sam f. l ge aE ned
~angen L producentprisen. 09 de t sa m fund sm~ssi g e velf~r d stab i
produkLlon~n, dar er ~~ resu l ta t af h. j e p roduc e nt pr is ~ r , ville
rejucer~s i takt mn nedga ng en i dlsse p r is e r. En s ad a n for¢gel
se af medansvarsafgifLe~ vil l e r midle rti d i kk e fo r hi n dr e m~lke
pradukt onen i forLsaL at overs~ i ge d e n ko mm e r c i ell e e f t e rsp¢rg
s~l. Dette be~yder, at _abe t p' ov e rs ku dsp roduk t i one n vi l le l~g
ge beslag pa en v~s~ n tl~g de l af pro duca n te rn es u d by t te Era de
h_J8 lnternn f or brugd~priser .
Markedskvoter
Og51 ind£.relsen af markedskvoter fo r m~l k p a p r o d uc e ntn iveau,
som del ~rak~lseres L Canada , ku nn s v~se n t lig r ed u c er s F~lles
skabets udy _f tel vddrwrende ma rk e d so r dn i nger f o r me je ri p r o
dukter. En s~dan kvotepldn v .l l e n em l iy v~re i s t an d ti l at
bcrtskarfe overskudsprodukt i onen .
l ndf¢r~lsen a en
med den kommer~r~
kvot~plan . der b r ag te produkti o n en p & niVlau
l~ ertcrs ~¢r g se l . Ville ut v i v l somc r e su ltere
i ~C mindre raId i produ ~ ~nte r nes i ndkom s t er , med mindr e planen
blev supplerel m~d andLe ~n d i nye r. Da tt e t a ld i produc e n ternes
indkomsL~r vllle fremkomme. ford i in dt~q t e n f ra d e n " ma rg inale"
m~lk~produktio n oversl~~er den dlter nat iv e v~ rdi af de r es sour
c~r, tier i qLveL raId mJtle f or la d e sek cor en . D e t t~ fa ld i pro-
108 -
ducenternes indkomster ville dog kunne opvejes, i det mindste
delvis, gennem en afvikling af medansvarsafgiften. Berettigel
sen af denne afgift ville nemlig bortfalde ved indf¢relsen af
markedskvoter.
Indf¢relsen af markedskvoter ville ogsa v~sentlig reducere
eller endog bortskaffe det samfundsm~ssige velf~rdstab i
produktionen, der ellers er en konsekvens af at opretholde
producentpriser over verdensmarkedspriserne. Formindskelsen af
dette velf~rdstab er et v~sentligt aspekt, idet det er a rsag
til, at udgifterne til markedsordningerne kan reduceres
v~sentlig mere, end hvad der svarer til nedgangen i producen
ternes indkomster. Indf¢relsen af markedskvoter ville derimod
ikke reducere det samfundsm~ssige velf~rdstab, der er et re
sultat af h¢je forbrugerpriser, idet bade forbruget og forbru
gerpriserne ville forblive upavirkede.
Indf¢relsen af markedskvoter ville pavirke v~rdien af landbrugs
aktiver. Kvoterne ville fa en markedsv~rdi, safremt de blev
gjort oms~ttelige. Derimod ville den samlede v~rdi af landbrugs
aktiverne, inclusive kvoterne, falde. Dette fald ville teoretisk
set blive identisk med den kapitaliserede v~rdi af nedgangen 1
producenternes nettoindkomster. Endelig ville v~rdien af de
konventionelle landbrugsaktiver falde endnu kraftigere. De
v~sentligste ulemper ved markedskvoter er formodentlig
vanskelighederne ved at administrere en sadan ordning.
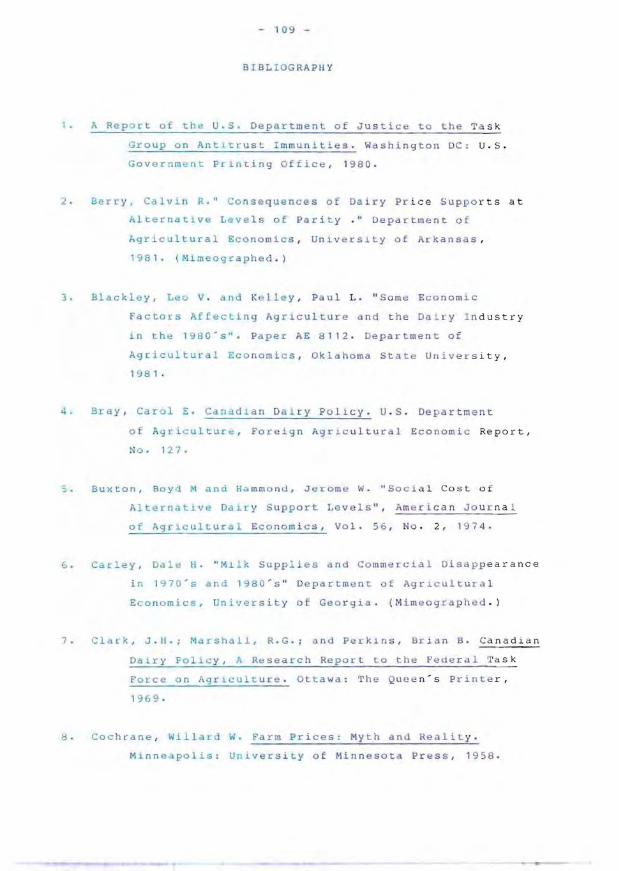
109 -
BI BL IOG RAPHY
1. A Report of the U.S. De partm e nt o f Justice to the T sk
Group on Antl~r us t I mmun ities. Washin g ton DC: U.S.
Go v ernment Pri.lt:ing Of rice , 1980 .
2, Berry, Calvin R," Consequenc es of
ALr:erllatlve Level s of Parity
Dairy Pr i ce Suppo rts at
Depdrtment o f
hgr~cultural Econo mics , O n ivers~ty of Arkansas ,
1981. ( ~limeographed . )
3. Blackl;:,y . Leo V . dnd Ke lley , Paul L . " Some Ec o no mic
Factors Affecting Agriculture and t he Da ry _n dustry
in the 10:.80'5". Paper AE 8112 . Departme n t of
AgrjcuLtural Eco nomi cs , Okla homa Stat e Univ e r s ity,
1981 .
4. Bray , Carol E. Canadl.an Da i ry Pol i c y. U. S . Depar t men t
of Agrlcultur~, Foreign Agricultural Economic Report,
No. 127.
:.. Buxton , Boyd ~1 ana Ha mm o n d , ,jerome 1'1. "Soci al Co s t of
AlternatLve Da1r y Support Levels " , American Jour nal
of Agt'io.:ultural Eco nomics . Vol . 5 6 , No .2 , 1974 .
6. Carley, Dale H. · Mll~ Suppli es and Commdrcial Disapp earance
in 1970's and 1980 's " Depat'tmen t of AgrIcultura l
Econom ic s, Univet'sity of G~ o rgia. (Mimeographed .)
7 . Clark , J.II.; Marshall, R.G.; a nd Pe!.k ln s , Br i an B . Canadian
Dairy Foliey, A Resear ch Repo r t to th~ Federdl Task
FOEce on Agricult ure. Ottawa; The Quee n's Print e r,
1969.
d. Cochrane , Willard W. Farm Pr ices; Myth and Rea l i t y.
Mlnne pol~s: UniverS ity of Min n esota P r ess , 1958 .
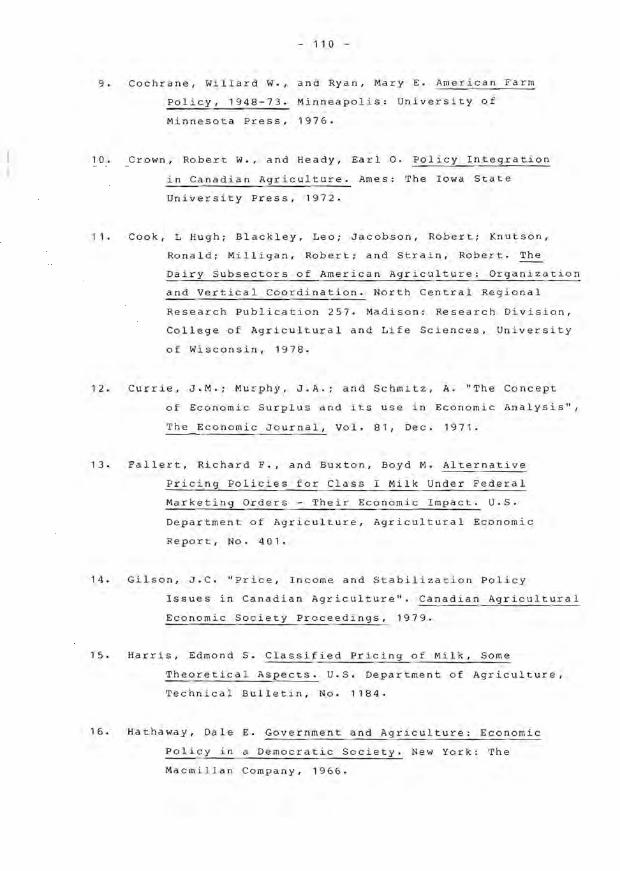
1 1 0
9. Cochrane, Willard W., and Ryan, Mary E. American Farm
policy, 1948-73. Minneapolis: University of
Minnesota Press, 1976.
10. Crown, Robert W., and Heady, Earl o. Policy Integration
in Canadian Agriculture. Ames: The Iowa State
University Press, 1972.
1 1 • Cook, L Hugh;
Rona ld;
Blackley, Leo; Jacobson, Robert; Knutson,
Milligan, Robert; and Strain, Robert. Th~
Dairy Subsectors of American Agriculture: Organization
and Vertical Coordination. North Central Regional
Research Publication 257. Madison: Research Division,
College of Agricultural and Life Scienc~s, University
of Wisconsin, 1978.
12. Currie, J.M.; Murphy, J.A.; and Schmitz, A. "The Concept
of Economic Surplus and its use in Economic Analysis",
The Economic Journal, Vol. 81, Dec. 1971.
13. Fallert, Richard P., and Buxton, Boyd M. Alternative
Pricing Policies for Class I Milk Under Federal
Marketing Orders - Their Economic Impact. U.S.
Department of Agriculture, Agricultural Economic
Report, No. 401.
14. Gilson, J.C. "Price, Income and Stabilization Policy
Issues in Canadian Agriculture". Canadian Agricultural
Economic Society Proceedings, 1979.
15. Harris, Edmond S. Classified Pricing of Milk, Some
Theoretical Aspects. U.S. Department of Agriculture,
Technical Bulletin, No. 1184.
16. Hathaway, Dale E. Government and Agriculture: Economic
Policy in a Democratic Society. New York: The
Macmillan Company, 1966.
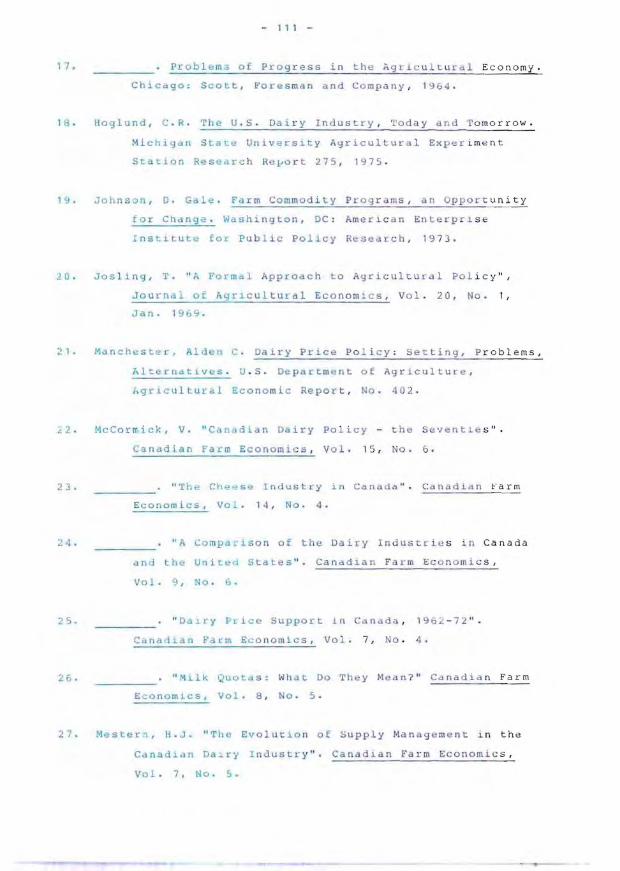
1 1 1
17 . Pr ob l ~m3 o f Pro gress in th e Ag r i c u l c u rd l E c onomy.
ChicCl g o: S coc t, Fore sman a nd Co mpany , 19 G4.
1" . Hoglund , C . R . The U .S. Dal 1' y I ndustry, Today <-l n d 1' omo rrow.
Mi chigan StacY Uni v er s Lty Ayr i culCur a l Expe r Lmenc
ScatLnn Researc h Rej,>ort 2 75 , 1':175.
19 . Joh n sen , D. Gale. Fa rm Commodi t y P o grams , a n Opport u nity
for Cn anye . Was h i ng to n, DC: AmerL c an Enterpr 1 se
LnscLt ut e for P ub l ic Pollcy Resedr~h, 1973.
20 . Jos l i n g , T . " A Formal Ap p oach t o Agricultural P o l i cy ",
of Ayrl. cu l tu l al Ec o nom ic s, Vol. 20, No. 1,
;! 1 . Mdnche s t<i: r , Alden C . Da iry Pr l. c e PolL c y : Se t ting, P roblems,
hlcernatlves . U.S. De partme n L of Agr i cul t ur e ,
I,gricultur",l Ec on o mi c Re por t, No . 4 0 2.
£2 . McCorrri ck, V. " C"Dudi ",n Da iry Po li cy - the Sev ent i e s".
23.
25.
C na di an Farm Ec o nomi cs , Vo l . 1 5 , No.6 .
"T he Cheo=s .. Indust r y in Ca ndd,," . Canadi a n ~'a rm
Eco n omicS, Vol . 14, No .4.
"A Comi-'a r is on o f the Dai r y lndustci" s in Canada
a nd the Un i cI<d S Late s ". Canad ian F rm Ec o n omi cs ,
Vo l. 9 , No . ,.
" Da1-ry Pric~ S u p po r t i n Ca n a da , 19 62 - 7:< " .
Cdnall.do Farm Ec onoml. c s, Vol. 7, No . 4.
" Milk Quota s : Wh a t Do Th e y Me an?" Ca nadia n Farm
Eco n omics , Vol . 8, No . 5 .
27 . Mest .H"l , ILJ . " Tile Ev oluti o n of Supply '.Ianag e me nt in th e
Canad1an Ddl r y In~u s try". Canad 1 an Farm EconomiC S ,
Vol . 7 , No . 5.
1 1 2 -
28. Organization for Economic Cooperation and Development.
29.
Interrelationship Between Income and Supply Problems
in Agriculture. Agricultural Policy Report. Paris,
1965.
Changes in the processing and Distribution of
Milk and Milk Products: A challenge to Farmers.
Vol. 2, Paris, 1974.
30. Paarlberg, Don. Farm and Food Policy - Issues of the 1980s.
Lincoln: University of Nebraska Press, 1980.
31. Report of the Commission of Inquiry Into Certain Allegations
Concerning Commercial Practices of the Canadian Dairy
Commission. Hull, Quebec: Canadian Government
Publishing Centre, 1981.
32. Report of the Federal Task Force on Agriculture. Canadian
Agriculture in the Seventies. Ottawa: The Queen's
Printer, 1970.
33. Schertz, Lyle P. et al. Another Revolution in U.S. Farming7
U.S. Department of Agriculture, 1979.
34. Shaw, C.N. and Levine, 5.5. Government's Role in Pricing
Fluid Milk in the United States. U.S. Department of
Agriculture, Agricultural Economic Report, No. 397.
35. Sorenson, Vernon L. International Trade Policy : Agricul
ture and Development. Michigan State University:
Division of Research, Graduate School and Business
Administration, 1975.
36. Stonehouse, D. Peter. "Government Policies for the
Canadian Dairy Industry". Canadian Farm Economics,
Vol. 14, Nos. 1-2.
1 13 -
17. Tomek, Will~am G. nd Robinson , Kenneth L. Agr i cul t ural
Product Prices, Ithac - : Cornell Univ e rsity Pr e ss ,
1981.
38. U . S . Departm",nt of Agr icul tur e. "Da ir y Price Support and
3'" •
4f).
Related Programs, 1949-1968" , Agricult ur a l Ec: o nomic
Report No. 165 .
" Federal Milk Ord",r Market St a ti st i cs, 1 9~ O
rlnnu I Summary" , Statistica l Bull.,tin No. 67 0.
" Agricultural Prices a nd Parity" , Major
Sta~istical 5 .. %ies of Lhe 0.5. De partme~ t of
hgriculture. Ho w they are Constructed and Use d ,
Vol. 1 , Agricultural Handbook No. 365 .
41. V.l.al, Edmund E. "P rices and Co n s umptl. on of Dairy P l oducts ,
wIth ~r.lC'" Suppo r ts an d Milk Ordyrs ", Agr ic:u lt u ral
Economi c Report No. 226 . U.S. Uepa r tment of
Agrlculture, 1~72 .
42. Wa lla ce , T.O . "Measures of Social Cos es of Agricult ural
Pro9rams", olnllrnal of F arm Economlc:s, Vol . 41j , 1 9 62 .