family consumer science17 - csus.edu
TRANSCRIPT

Fact Book
Fall 2017
6000 J Street, MS 6028 Sacramento, CA 95819 Phone: (916) 278-6566
Fax: (916) 278-6828 http://www.csus.edu/oir
Fall 2012-Spring 2017
Family and
Consumer Sciences

TABLE OF CONTENTS
INPUT: STUDENTS
Table 1: New Undergraduate Student Background .......................................................... 1 Table 2: All Undergraduate Student Profile ..................................................................... 2 Table 3: New Graduate Student Background .................................................................. 3 Table 4: Graduate Student Profile ................................................................................... 4 Table 5: All Student Enrollment by Program and Concentration ..................................... 5
PROCESS: CURRICULUM AND INSTRUCTION
Table 6: Student Course Load ........................................................................................ 6 Table 7: Class Size ......................................................................................................... 7 Table 8: Course Enrollment ............................................................................................ 8 Table 9: FTE and Student/Faculty Ratio ...................................................................... 10 Table 10: Faculty Profile .............................................................................................. 11
OUTCOMES: STUDENT ACADEMIC PERFORMANCE
Table 11: Grades and Course GPA by Level ................................................................. 12 Table 12: Undergraduate Degree GPA by Ethnicity ..................................................... 14 Table 13: Degrees Conferred ........................................................................................ 15 Table 14a: Retention Rates for First-Time Freshmen and Transfers ............................... 16 Table 14b: Retention Rates by Program/Concentration................................................. 18 Table 15a: Graduation Rates for First-Time Freshmen and Transfers ............................ 19 Table 15b: Graduation Rates by Program/Concentration .............................................. 21
APPENDIX
Appendix A: Faculty Workload Fall ......................................................................... A - 1 Appendix B: Faculty Workload Spring ..................................................................... B - 1 Appendix C: Student Flow Chart ............................................................................. C - 1

TABLE 1: New Undergraduate Student Background
5-Year
First-Time Freshmen 2012 2013 2014 2015 2016 Mean
HeadcountDepartment (Majors) 19 38 29 33 53 34
Pre-Major/Expressed Interest
College (Majors) 244 222 244 239 288 247
Pre-Major/Expressed Interest 76 171 167 156 146 143
% of College 5.9% 9.7% 7.1% 8.4% 12.2% 8.8%
Average SAT Scores
SAT Verbal 442 462 456 445 448 451
SAT Math 432 470 462 455 445 453
Combined SAT 874 932 918 900 893 903
College Mean 950 948 937 937 925 939
University Mean 960 952 946 952 936 949
High School GPA
Department Mean 3.27 3.26 3.24 3.27 3.22 3.25
College Mean 3.21 3.21 3.25 3.26 3.21 3.23
University Mean 3.26 3.25 3.27 3.30 3.25 3.27
Need Remediation (Regular Admit)
Department 78.9% 52.6% 69.0% 72.7% 67.9% 68.2%
College 57.5% 54.5% 63.7% 60.5% 60.4% 59.3%
University 55.7% 53.2% 58.9% 55.0% 54.6% 55.5%
New Transfers
Headcount
Department (Majors) 73 95 83 84 77 82
Pre-Major/Expressed Interest
College (Majors) 549 721 623 697 838 686
Pre-Major/Expressed Interest 219 211 116 93 66 141
% of College 9.5% 10.2% 11.2% 10.6% 8.5% 10.0%
Transfer GPA
Department Mean 3.05 2.94 2.97 3.03 3.00 3.00
College Mean 3.00 2.99 3.02 3.05 3.01 3.02
University Mean 3.05 3.04 3.07 3.09 3.07 3.06
Transfer Units
Department Mean 74 77 82 78 79 78
College Mean 73 74 76 74 75 74
University Mean 78 79 79 79 79 79
*Transfer units are recalculated and updated each year after the evaluation process has been completed.
Entering in Fall
Notes: Only programs which have been designated as being "impacted" will have students within the "expressed interest" group.
Family and Consumer Sciences 1

TABLE 2: All Undergraduate Student Profile
Total Enrolled*Department (Majors)
Pre-Major/Expressed Interest
College (Majors)
Pre-Major/Expressed Interest
% of College
EthnicityAfrican American 35 7.0% 43 7.3% 42 6.9% 50 7.7% 53 7.5%
American Indian 3 0.6% 2 0.3% 2 0.3% 2 0.3% 3 0.4%
Asian 102 20.5% 139 23.7% 141 23.1% 153 23.6% 172 24.5%
Latino 97 19.5% 128 21.8% 157 25.7% 183 28.2% 178 25.3%
Pacific Islander 1 0.2% 3 0.5% 5 0.8% 6 0.9% 6 0.9%
Underrepresented Minority 136 27.3% 176 30.0% 206 33.8% 241 37.1% 240 34.1%
All Minority 238 47.8% 315 53.7% 347 56.9% 394 60.7% 412 58.6%
Multiracial 26 5.2% 34 5.8% 44 7.2% 45 6.9% 59 8.4%
White/Caucasian 192 38.6% 195 33.2% 171 28.0% 155 23.9% 196 27.9%
Foreign 2 0.4% 6 1.0% 11 1.8% 19 2.9% 23 3.3%
Other/Unreported 40 8.0% 37 6.3% 37 6.1% 36 5.5% 13 1.8%
Minority (College) 2,204 48.1% 2,525 51.8% 2,652 53.5% 2,768 55.0% 2,917 54.8%
Minority (University) 13,120 51.4% 13,963 53.7% 14,764 55.4% 15,574 56.3% 15,714 56.4%
GenderDepartment- Female 425 85.3% 500 85.2% 509 83.4% 544 83.8% 596 84.8%
Department- Male 73 14.7% 87 14.8% 101 16.6% 105 16.2% 107 15.2%
College-Female 3,187 69.6% 3,333 68.3% 3,387 68.4% 3,436 68.3% 3,645 68.5%
College-Male 1,391 30.4% 1,546 31.7% 1,567 31.6% 1,598 31.7% 1,678 31.5%
University-Female 14,497 56.8% 14,696 56.5% 15,007 56.3% 15,464 55.9% 15,570 55.9%
University-Male 11,044 43.2% 11,316 43.5% 11,641 43.7% 12,177 44.1% 12,306 44.1%
AgeUnder 18 2 0.4% 4 0.7% 8 1.3% 3 0.5% 3 0.4%
18-24 371 74.5% 442 75.3% 451 73.9% 472 72.7% 518 73.7%
25 and over 125 25.1% 141 24.0% 151 24.8% 174 26.8% 182 25.9%
BackgroundLow Income Family 252 50.6% 321 54.7% 322 52.8% 347 53.5% 365 51.9%
First Generation 125 25.1% 156 26.6% 164 26.9% 188 29.0% 208 29.6%
Commuter StatusLiving on Campus 10 2.0% 17 2.9% 18 3.0% 20 3.1% 27 3.8%
Commuters 488 98.0% 570 97.1% 592 97.0% 629 96.9% 676 96.2%
* Total enrollment includes new, continuing, and returning students. All counts are based on primary majors. Graduate students enrolled in undergraduate degree programs (2nd Bachelor) are included in Table 4.
Note: Ethnic headcounts may differ from those reported before 2013. The Fact Book now uses new ERSR (Race/Ethnicity) data, collected since 2009, to complete the historical record.
Fall
2015 20162012 2013 2014
498 587 610 649 703
4,278 4,310 4,431 4,579 4,933
10.9% 12.0% 12.3% 12.9% 13.2%
300 569 523 455 390
Family and Consumer Sciences 2

TABLE 3: New Graduate Student Background
5-Year
Graduates - First-time 2012 2013 2014 2015 2016 Mean
Degree Objective
2nd Bachelor's Degree
Master's Degree
Other Degree 8 2
Total 8 2
Institution of Origin
Sacramento State 2 0
Out of State 2 0
State College 3 1
University of California 1 0
Private School
Other Institute
Total 8 2
% Sacramento State Students 25.0% 5.0%
Graduate Transfers
Degree Objective
2nd Bachelor's Degree
Master's Degree
Other Degree
Total
Institution of Origin
Sacramento State
Out of State
State College
University of California
Private School
Other Institute
Total
% Sacramento State Students
Entering in Fall
Family and Consumer Sciences 3

TABLE 4: Graduate Student Profile
Total Enrolled*
Department Total
College Total
% of College
Ethnicity
African American
American Indian
Asian 1 9.1% 3 33.3%
Latino 1 11.1% 4 36.4% 1 11.1% 1 11.1%
Pacific Islander
Underrepresented Minority 1 11.1% 4 36.4% 1 11.1% 1 11.1%
All Minority 1 11.1% 5 45.5% 4 44.4% 1 11.1%
Multiracial 1 11.1% 1 9.1% 2 22.2%
White/Caucasian 7 77.8% 4 36.4% 4 44.4% 1 100% 6 66.7%
Foreign
Other/Unreported 1 9.1% 1 11.1%
Minority (College) 75 27.5% 70 30.3% 61 26.2% 63 30.6% 62 30.1%
Minority (University) 981 32.7% 919 32.8% 921 34.1% 970 36.7% 931 35.3%
Gender
Department- Female 9 100% 11 100% 9 100% 1 100% 9 100%
Department- Male
College-Female 174 63.7% 133 57.6% 115 49.4% 106 51.5% 123 59.7%
College-Male 99 36.3% 98 42.4% 118 50.6% 100 48.5% 83 40.3%
University-Female 2,055 68.5% 1,843 65.8% 1,736 64.3% 1,699 64.3% 1,706 64.8%
University-Male 943 31.5% 956 34.2% 965 35.7% 944 35.7% 928 35.2%
Enrollment Status
New 8 88.9% 8 72.7% 8 88.9% 8 88.9%
Continuing 1 11.1% 2 18.2% 1 11.1% 1 100%
Returning 1 9.1% 1 11.1%
Residence
California Resident 9 100% 11 100% 9 100% 1 100% 7 78%
Outside California 2 22.2%
Foreign
9 11 9 1 9
Fall
2015 20162012 2013 2014
Note: Ethnic headcounts may differ from those reported before 2013. The Fact Book now uses new ERSR (Race/Ethnicity) data, collected since 2009, to complete the historical record.
206
3.3% 4.8% 3.9% 0.5% 4.4%
* Total enrollment includes new, continuing, and returning students. All counts are based on primary majors, including Master, 2nd Bachelor, and Doctoral degree programs.
273 231 233 206
Family and Consumer Sciences 4

TABLE 5: All Student Enrollment by Program and Concentration
2012 2013 2014 2015 2016
Undergraduate StudentsFashion Merchandising and Design
Fashion Merchandising & Design 106 134 137 120 116
Sub-Total 106 134 137 120 116
Family & Consumer Sciences
Family & Consumer Sciences 1 1 0 0 0
Pre-Credential Single Subject Program in Home Economics
2 1 2 10 17
Sub-Total 3 2 2 10 17
Family Studies
Family Studies 49 53 62 82 93
Sub-Total 49 53 62 82 93
Nutrition and Food
Nutrition and Food 340 398 409 437 477
Sub-Total 340 398 409 437 477
Graduate Students - 2 BA
Family & Consumer Sciences
Family & Consumer Sciences 5 1 0 0 0
Sub-Total 5 1 0 0 0
Family Studies
Pre-Credential Single Subject Program in Home Economics
0 0 0 1 0
Sub-Total 0 0 0 1 0
Nutrition and Food
Nutrition and Food 1 2 1 0 1
Sub-Total 1 2 1 0 1
Graduate Students - Unclassified
Family & Consumer Sciences
Dietetics Internship 3 8 8 0 8
Sub-Total 3 8 8 0 8
Departmental Total 507 598 619 650 712
Entering in Fall
Note: Some programs/concentrations are not listed if there were no students majored in those programs in the past five years.
Family and Consumer Sciences 5

TABLE 6: Student Course Load
10-Term
Mean
Fall Spring Fall Spring Fall Spring Fall Spring Fall Spring
Course Load (Undergraduate)
# Full-Time 370 369 469 449 471 448 485 472 555 540 463
# Part-Time 128 99 118 131 139 153 164 160 148 142 138
Dept. Mean Units 12.1 12.4 12.6 12.3 12.2 12.0 12.2 12.3 12.6 12.7 12.3
College Mean Units 12.4 12.5 12.6 12.4 12.4 12.3 12.5 12.4 12.7 12.7 12.5
University Mean Units 12.6 12.5 12.8 12.3 12.3 12.4 12.5 12.5 12.9 12.8 12.6
Course Load (Graduate)
# Full-Time 7 8 8 8 8 8 6 6 6
# Part-Time 2 1 3 3 1 2 1 2 3 2 2
Dept. Mean Units 11.2 8.3 9.8 8.9 12.2 9.4 6.0 2.5 8.3 9.8 8.6
College Mean Units 6.5 6.6 6.7 6.4 7.0 6.4 6.5 6.3 6.7 6.6 6.6
University Mean Units 9.9 9.6 10.1 9.7 10.1 9.5 10.2 9.6 10.4 9.8 9.9
Academic Year
2015-16 2016-172012-13 2013-14 2014-15
11.5
12.0
12.5
13.0
Fall Spring Fall Spring Fall Spring Fall Spring Fall Spring
2012-13 2013-14 2014-15 2015-16 2016-17
Ave
rage
Uni
t
Average Unit LoadUndergraduate Students
Dept. Mean Units College Mean Units University Mean Units
Family and Consumer Sciences 6

TABLE 7: Class Size
10-Term Mean
Fall Spring Fall Spring Fall Spring Fall Spring Fall Spring
Number of Sections (Non-supervision)1
Lower Division 14 14 16 16 15 13 17 14 21 21 16
Upper Division 34 32 39 37 42 37 43 43 48 50 40
Graduate 3 2 3 2 3 2 3 2 2
Department Total 51 48 58 55 60 52 60 57 72 73 59
College Total 432 457 471 463 499 485 517 508 539 540 491
% of College 11.9% 10.6% 12.3% 11.8% 11.9% 10.8% 11.5% 11.2% 13.4% 13.5% 11.9%
Average Section Size (Non-supervision)Lower Division 55 64 65 56 61 56 61 63 59 51 59
Upper Division 40 40 39 39 38 39 39 37 36 35 38
Graduate 7 8 8 8 8 8 8 8 6
Department Mean 42 45 45 43 42 42 45 44 42 39 43
College Mean 48 46 48 46 45 43 44 44 45 43 45
University Mean 35 33 34 34 34 33 34 33 33 32 33
Number of Sections (Supervision)2
Lower Division
Upper Division 4 3 3 4 3 3 4 4 3 4 4
Graduate 1 1 3 3 2 3 2 2 2
Department Total 5 4 6 7 5 6 4 4 5 6 5
College Total 161 178 187 159 162 159 136 145 142 144 157
% of College 3.1% 2.2% 3.2% 4.4% 3.1% 3.8% 2.9% 2.8% 3.5% 4.2% 3.3%
% Course Enrollment for MajorsLower Division 24% 19% 28% 30% 34% 40% 30% 32% 36% 38% 31%
Upper Division 58% 63% 67% 68% 67% 73% 76% 80% 77% 79% 71%
Graduate 100% 96% 93% 100% 100% 100% 100% 100% 79%
Department Total 47% 45% 52% 55% 55% 61% 58% 63% 60% 64% 56%
2 Includes Independent Study, Field Work, Practice Teaching, Work-study, Thesis, and Studio instruction.
1 Includes Lecture, Laboratory, Seminar and Activity sections. Beginning with this edition of the Factbook, the percentage of course enrollment by major has been calculated based on end-of-term data.
Academic Year2016-172015-162012-13 2013-14 2014-15
30
35
40
45
50
2012-13 2013-14 2014-15 2015-16 2016-17
Ave
rage
Siz
e
Average Size of Course Sections (non-supervision)
DepartmentMean
CollegeMean
UniversityMean
Family and Consumer Sciences 7

TABLE 8: Course Enrollment
10-Term
Total
Course* Fall Spring Fall Spring Fall Spring Fall Spring Fall SpringFACS009 46 72 54 57 88 122 439
FACS010 299 317 436 319 347 194 412 338 537 359 3,558
FACS011 50 49 51 75 52 51 50 53 80 93 604
FACS030 41 33 43 43 41 41 35 33 310
FACS031 38 24 42 32 33 28 21 26 244
FACS032 17 25 22 19 23 24 21 20 17 23 211
FACS050 265 399 330 317 309 321 328 303 332 327 3,231
FACS052 40 43 35 34 37 189
FACS100 131 122 124 128 134 136 775
FACS107 34 82 89 86 111 118 95 90 705
FACS108 42 47 40 37 35 40 47 42 95 42 467
FACS109 57 50 62 49 218
FACS110 48 61 48 48 46 48 47 71 72 77 566
FACS112 28 27 55
FACS113 129 87 134 88 122 86 140 125 148 115 1,174
FACS114 43 45 91 42 39 89 84 40 82 114 669
FACS115 44 50 46 74 45 43 72 41 79 76 570
FACS116 41 44 41 46 41 25 41 31 36 25 371
FACS117 29 29 25 27 25 23 24 24 19 24 249
FACS118A 25 32 28 29 25 139
FACS118B 20 23 24 21 19 107
FACS119 43 41 34 34 58 42 45 83 77 78 535
FACS120 38 32 40 39 65 214
FACS130 38 27 43 42 35 29 34 40 288
FACS131 31 43 35 39 33 181
FACS133 34 41 42 42 33 192
FACS134 37 26 44 37 34 35 31 15 33 17 309
FACS135 42 40 46 44 28 200
FACS136 45 42 40 45 36 208
FACS137 47 47 47 44 41 226
FACS139 39 39 40 43 31 192
FACS140 81 83 87 111 107 103 101 134 121 147 1,075
FACS141 91 80 89 90 78 83 91 90 113 119 924
FACS150 122 108 115 106 102 65 72 64 67 63 884
FACS152 40 39 37 44 40 200
FACS154 21 20 22 32 28 29 32 36 40 43 303
FACS155 31 34 40 27 34 37 203
FACS159 38 47 42 41 35 41 244
FACS160 48 90 85 82 305
Academic Year
2016-172015-162012-13 2013-14 2014-15
Family and Consumer Sciences 8
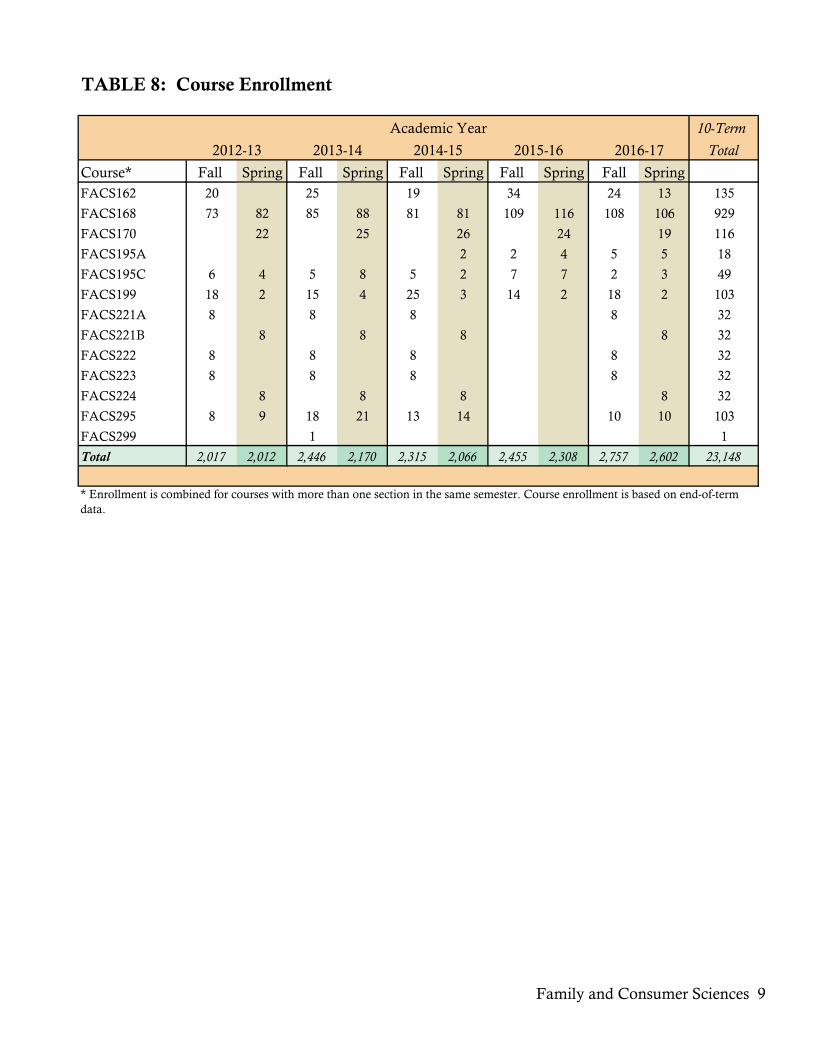
TABLE 8: Course Enrollment
10-Term
Total
Course* Fall Spring Fall Spring Fall Spring Fall Spring Fall Spring
Academic Year
2016-172015-162012-13 2013-14 2014-15
FACS162 20 25 19 34 24 13 135
FACS168 73 82 85 88 81 81 109 116 108 106 929
FACS170 22 25 26 24 19 116
FACS195A 2 2 4 5 5 18
FACS195C 6 4 5 8 5 2 7 7 2 3 49
FACS199 18 2 15 4 25 3 14 2 18 2 103
FACS221A 8 8 8 8 32
FACS221B 8 8 8 8 32
FACS222 8 8 8 8 32
FACS223 8 8 8 8 32
FACS224 8 8 8 8 32
FACS295 8 9 18 21 13 14 10 10 103
FACS299 1 1
Total 2,017 2,012 2,446 2,170 2,315 2,066 2,455 2,308 2,757 2,602 23,148
* Enrollment is combined for courses with more than one section in the same semester. Course enrollment is based on end-of-term data.
Family and Consumer Sciences 9

TABLE 9: FTE and Student/Faculty Ratio
10-Term
Mean
Fall Spring Fall Spring Fall Spring Fall Spring Fall Spring
Full-Time Equivalent Student (FTES) 1
Lower Division 141.9 163.1 193.0 159.0 168.4 132.0 188.6 158.6 224.5 183.3 171.2
Upper Division 257.2 237.7 287.1 270.0 286.4 274.4 301.3 304.6 318.2 329.7 286.7
Graduate 6.6 6.5 6.9 5.9 6.9 5.9 4.8 5.2 4.9
Department Total 405.6 407.2 487.0 434.9 461.7 412.3 489.9 463.2 547.5 518.1 462.8
College Total 4,214.0 4,329.8 4,522.7 4,261.6 4,470.9 4,201.5 4,493.9 4,439.2 4,763.2 4,635.3 4,433.2
% of College 9.6% 9.4% 10.8% 10.2% 10.3% 9.8% 10.9% 10.4% 11.5% 11.2% 10.4%
Instructional Full-Time Equivalent Faculty (FTEF) 2
Lower Division 2.9 3.4 3.9 4.1 3.8 3.1 4.2 3.0 4.8 3.8 3.7
Upper Division 8.9 7.9 9.5 9.2 10.4 9.4 11.3 10.7 12.5 13.1 10.3
Graduate 0.7 0.6 1.0 1.0 0.8 0.7 0.7 0.6 0.6
Department Total 12.5 11.9 14.5 14.3 15.1 13.3 15.6 13.7 18.0 17.6 14.6
College Total 132.2 138.7 142.1 138.4 152.7 146.8 153.1 154.2 165.4 163.7 148.7
% of College 9.4% 8.6% 10.2% 10.3% 9.9% 9.0% 10.2% 8.9% 10.9% 10.7% 9.8%
Student/Faculty Ratio (SFR)3
Lower Division 48.3 48.0 49.0 38.5 43.9 42.5 44.5 52.6 46.9 47.8 46.2
Upper Division 29.0 30.0 30.1 29.4 27.6 29.1 26.6 28.4 25.5 25.1 28.1
Graduate 10.1 10.3 6.6 6.1 8.3 8.3 6.6 8.7 6.5
Department Total 32.6 34.1 33.6 30.5 30.7 31.1 31.4 33.7 30.4 29.5 31.7
College Total 31.9 31.2 31.8 30.8 29.3 28.6 29.3 28.8 28.8 28.3 29.9
University Total 27.3 25.3 26.4 25.3 25.5 24.9 25.5 24.6 25.1 24.1 25.4
3 Student-Faculty Ratio is FTES divided by FTEF
1 Full-Time Equivalent Students are calculated by dividing the sum of the Student Credit Units (SCU) by 15 for Undergraduates and 12 for Graduate Students. For example, if a course is a 3- credit unit class with an enrollment of 47 undergraduate students and 1 graduate student, the student FTE would be computed as (47x3)/15+(1x3)/12=9.4+0.25=9.65. Please note that FTES calculated from the student enrollment file should be close, but not exactly equal, to that calculated from the course section file.
2 Instructional Full-Time Equivalent Faculty: This incorporates only those faculty members with in-classroom workloads, including supervisory teaching, and/or instructors who are administrators or staff. The FTE for Full-time faculty is calculated as WTU/12. The FTE for Part-time, FERP, and Teaching Assistants are calculated as WTU/15. Instructional FTEF are allocated to the department offering the course, regardless of the instructor’s affiliation.
Academic Year
2016-172015-162012-13 2013-14 2014-15
Family and Consumer Sciences 10

TABLE 10: Faculty Profile
Total Faculty
Department
College
University
Ethnicity
African American 1 4.2% 1 3.7%
American Indian
Asian 4 16.7% 5 18.5% 3 10.3% 4 15.4% 5 15.6%
Latino 1 3.7% 1 3.4% 2 7.7% 3 9.4%
Underrepresented Minority 1 4.2% 2 7.4% 1 3.4% 2 7.7% 3 9.4%
All Minority 5 20.8% 7 25.9% 4 13.8% 6 23.1% 8 25.0%
Multiracial 1 3.7% 1 3.8% 1 3.1%
White/Caucasian 19 79.2% 18 66.7% 22 75.9% 16 61.5% 18 56.3%
Other/Unreported 1 3.7% 3 10.3% 3 11.5% 5 15.6%
Minority (College) 54 28.0% 68 31.8% 64 27.5% 65 28.8% 77 29.5%
Minority (University) 323 23.4% 351 23.7% 370 23.5% 387 23.8% 426 24.7%
Gender
Department- Female 18 75.0% 23 85.2% 25 86.2% 22 84.6% 27 84.4%
Department- Male 6 25.0% 4 14.8% 4 13.8% 4 15.4% 5 15.6%
College-Female 96 49.7% 112 52.3% 127 54.5% 122 54.0% 145 55.6%
College-Male 97 50.3% 102 47.7% 106 45.5% 104 46.0% 116 44.4%
University-Female 707 51.2% 744 50.3% 771 49.0% 784 48.2% 842 48.7%
University-Male 675 48.8% 735 49.7% 803 51.0% 841 51.8% 886 51.3%
Rank
Full Professor 4 16.7% 4 14.8% 5 17.2% 6 23.1% 7 21.9%
Associate Professor 2 8.3% 2 7.4% 1 3.4% 2 7.7% 2 6.3%
Assistant Professor 2 8.3% 2 7.4% 3 10.3% 1 3.8% 2 6.3%
Lecturer 16 66.7% 19 70.4% 20 69.0% 17 65.4% 21 65.6%
Tenure Status
Tenure 6 25.0% 6 22.2% 6 20.7% 8 30.8% 9 28.1%
On Tenure Track 2 8.3% 2 7.4% 3 10.3% 1 3.8% 2 6.3%
Non-Tenure Track 16 66.7% 19 70.4% 20 69.0% 17 65.4% 21 65.6%
Note: Faculty members with more than one assignment are only counted once and are attributed to the department with the greatest portion of FTE based on HR Census data (October 1). Total faculty count of the university includes instructors, librarians and coaches.
2016
32
261
1,728
2012
24
193
1,382 1,625
Fall
2013
27
214
1,479
2014
29
233
1,574
2015
26
226
Family and Consumer Sciences 11

TABLE 11: Grades and Course GPA by Level
10-Term
MeanFall Spring Fall Spring Fall Spring Fall Spring Fall Spring
Lower DivisionA 88 149 149 210 249 214 252 245 290 213 206
B 252 289 382 299 306 268 367 334 490 401 339
C 221 241 283 177 201 156 235 151 258 239 216
D 93 58 79 46 68 43 59 32 66 50 59
F 47 49 45 34 35 34 30 31 38 41 38
CR 0 1 0
NC
I 1 0 0 2 3 8 13 8 2 4 4
WU 2 14 18 16 12 7 2 3 0 4 8
W 5 13 9 11 14 3 3 8 8 5 8
Other
Total 709 814 965 795 888 733 961 812 1,152 957 879
Upper DivisionA 475 410 406 315 459 392 506 526 584 437 451
B 493 505 718 657 600 647 667 669 736 792 648
C 202 191 229 288 251 213 229 221 188 310 232
D 44 29 39 42 41 20 43 29 25 31 34
F 20 18 20 16 16 15 30 22 18 26 20
CR 10 6 5 8 5 7 12 13 9 9 8
NC 0 1 0 1 0
I 3 2 6 1 5 2 3 2 0 4 3
WU 12 6 4 4 4 2 2 5 4 5 5
W 17 6 11 6 9 5 2 9 7 4 8
Other
Total 1,276 1,173 1,438 1,338 1,390 1,303 1,494 1,496 1,571 1,619 1,410
Graduate LevelA 18 8 25 16 16 16 24 16 14
B 6 0 1
C
D
F
CR 8 9 18 21 13 14 10 10 10
NC
I 0 8 1
WU
W
Other 8 0 1
Total 32 25 43 37 37 30 34 26 26
Academic Year
2015-16 2016-172012-13 2013-14 2014-15
Note: All grades shown reflect those of students regularly enrolled as of the Census Date. Students enrolled through the College of Continuing Education (CCE) have been excluded.
Family and Consumer Sciences 12

TABLE 11: Grades and Course GPA by Level
10-Term
MeanFall Spring Fall Spring Fall Spring Fall Spring Fall Spring
Academic Year
2015-16 2016-172012-13 2013-14 2014-15
Average Course GPA (Lower Division)Department 2.33 2.48 2.49 2.72 2.70 2.77 2.75 2.89 2.77 2.68 2.66
College 2.67 2.61 2.67 2.61 2.69 2.64 2.75 2.67 2.73 2.67 2.67
University 2.74 2.68 2.75 2.68 2.72 2.66 2.75 2.68 2.74 2.69 2.71
Average Course GPA (Upper Division)Department 3.03 3.06 3.00 2.91 3.02 3.04 3.04 3.09 3.14 2.96 3.03
College 2.83 2.83 2.85 2.86 2.86 2.90 2.87 2.90 2.88 2.86 2.86
University 2.96 2.97 2.97 2.98 2.98 3.01 3.01 3.02 3.02 3.01 2.99
Average Course GPA (Graduate)Department 3.59 4.00 3.95 4.00 4.00 4.00 0.00 0.00 3.96 4.00 3.92
College 3.62 3.69 3.65 3.67 3.60 3.70 3.61 3.72 3.75 3.67 3.67
University 3.76 3.77 3.77 3.75 3.74 3.76 3.76 3.78 3.79 3.78 3.77
A-F - Letter Grade NC - No Credit WU - Unauthorized WithdrawalCR - Credit I - Incomplete W - WithdrawalOther:RD - Report Delayed AU - AuditRP - Report in Progress Blank - No Grade
Grade:
0%
20%
40%
60%
80%
100%
Fall Spring Fall Spring Fall Spring Fall Spring Fall Spring
2012-13 2013-14 2014-15 2015-16 2016-17
% A
and
B
A and B Grade by Level
Lower Division Upper Division Graduate
Family and Consumer Sciences 13
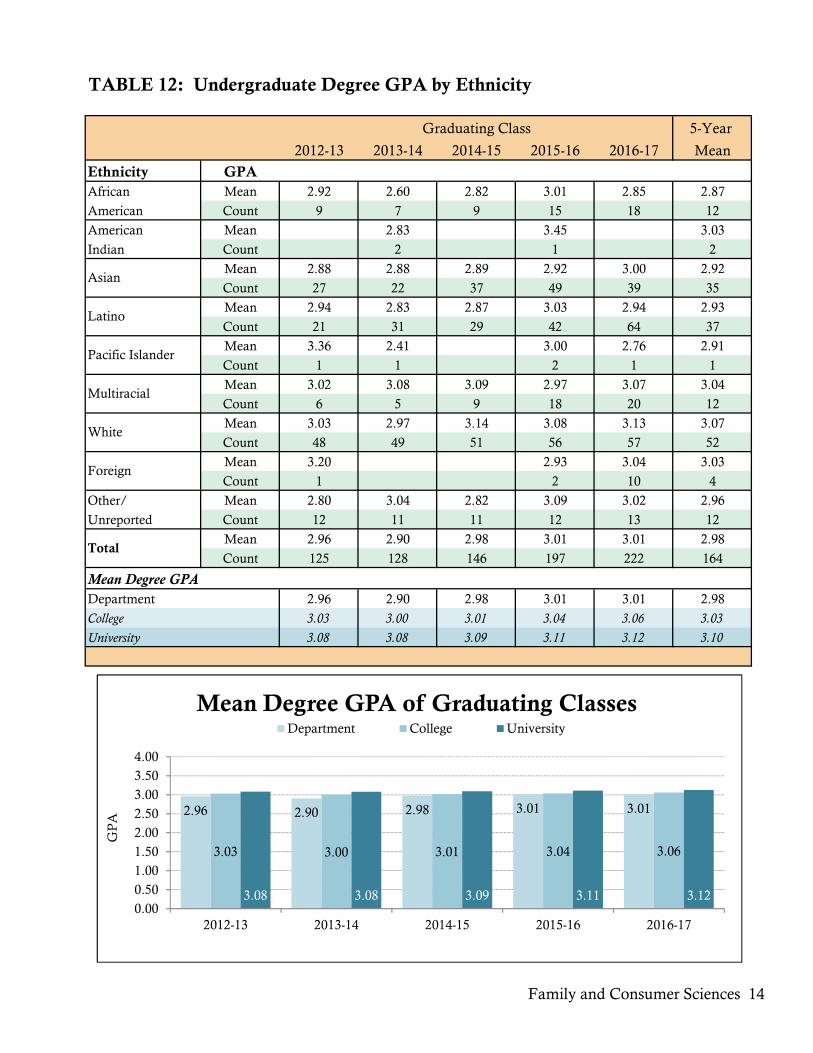
TABLE 12: Undergraduate Degree GPA by Ethnicity
5-Year
2012-13 2013-14 2014-15 2015-16 2016-17 Mean
Ethnicity GPAAfrican Mean 2.92 2.60 2.82 3.01 2.85 2.87
American Count 9 7 9 15 18 12
American Mean 2.83 3.45 3.03
Indian Count 2 1 2
Mean 2.88 2.88 2.89 2.92 3.00 2.92
Count 27 22 37 49 39 35
Mean 2.94 2.83 2.87 3.03 2.94 2.93
Count 21 31 29 42 64 37
Mean 3.36 2.41 3.00 2.76 2.91
Count 1 1 2 1 1
Mean 3.02 3.08 3.09 2.97 3.07 3.04
Count 6 5 9 18 20 12
Mean 3.03 2.97 3.14 3.08 3.13 3.07
Count 48 49 51 56 57 52
Mean 3.20 2.93 3.04 3.03
Count 1 2 10 4
Other/ Mean 2.80 3.04 2.82 3.09 3.02 2.96
Unreported Count 12 11 11 12 13 12
Mean 2.96 2.90 2.98 3.01 3.01 2.98
Count 125 128 146 197 222 164
Mean Degree GPADepartment 2.96 2.90 2.98 3.01 3.01 2.98
College 3.03 3.00 3.01 3.04 3.06 3.03
University 3.08 3.08 3.09 3.11 3.12 3.10
White
Foreign
Total
Graduating Class
Asian
Latino
Pacific Islander
Multiracial
2.96 2.90 2.98 3.01 3.01
3.03 3.00 3.01 3.04 3.06
3.08 3.08 3.09 3.11 3.120.00
0.50
1.00
1.50
2.00
2.50
3.00
3.50
4.00
2012-13 2013-14 2014-15 2015-16 2016-17
GP
A
Mean Degree GPA of Graduating ClassesDepartment College University
Family and Consumer Sciences 14
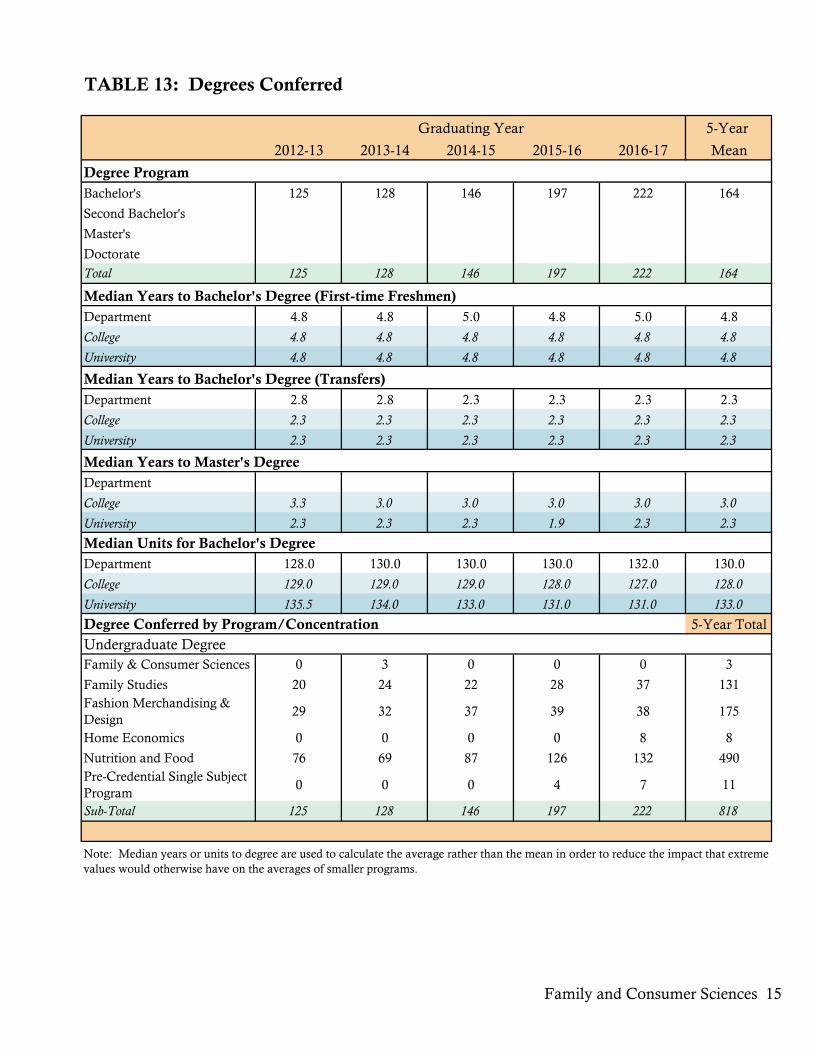
TABLE 13: Degrees Conferred
5-Year
2012-13 2013-14 2014-15 2015-16 2016-17 Mean
Degree Program
Bachelor's 125 128 146 197 222 164
Second Bachelor's
Master's
Doctorate
Total 125 128 146 197 222 164
Median Years to Bachelor's Degree (First-time Freshmen)
Department 4.8 4.8 5.0 4.8 5.0 4.8
College 4.8 4.8 4.8 4.8 4.8 4.8
University 4.8 4.8 4.8 4.8 4.8 4.8
Median Years to Bachelor's Degree (Transfers)
Department 2.8 2.8 2.3 2.3 2.3 2.3
College 2.3 2.3 2.3 2.3 2.3 2.3
University 2.3 2.3 2.3 2.3 2.3 2.3
Median Years to Master's Degree
Department
College 3.3 3.0 3.0 3.0 3.0 3.0
University 2.3 2.3 2.3 1.9 2.3 2.3
Median Units for Bachelor's Degree
Department 128.0 130.0 130.0 130.0 132.0 130.0
College 129.0 129.0 129.0 128.0 127.0 128.0
University 135.5 134.0 133.0 131.0 131.0 133.0
Degree Conferred by Program/Concentration 5-Year Total
Undergraduate DegreeFamily & Consumer Sciences 0 3 0 0 0 3
Family Studies 20 24 22 28 37 131Fashion Merchandising & Design
29 32 37 39 38 175
Home Economics 0 0 0 0 8 8
Nutrition and Food 76 69 87 126 132 490Pre-Credential Single Subject Program
0 0 0 4 7 11
Sub-Total 125 128 146 197 222 818
Graduating Year
Note: Median years or units to degree are used to calculate the average rather than the mean in order to reduce the impact that extreme values would otherwise have on the averages of smaller programs.
Family and Consumer Sciences 15

TABLE 14a: Retention Rates for First-Time Freshmen and Transfers
First-Time FreshmenNumber EnteringAfter One YearDepartment Retention Rate* 33 79% 18 95% 33 87% 20 69% 30 91%
College Retention Rate 284 82% 264 83% 330 84% 326 84% 326 79%
University Retention Rate 2,371 81% 2,590 82% 2,760 82% 2,938 80% 3,058 81%
After Two YearsDepartment Retention Rate* 31 74% 16 84% 27 71% 19 66% -- --
College Retention Rate 247 72% 241 75% 288 73% 301 73% -- --
University Retention Rate 2,076 71% 2,269 72% 2,460 73% 2,577 70% -- --
After Three YearsDepartment Retention Rate* 31 74% 15 79% 30 79% -- -- -- --
College Retention Rate 238 69% 224 70% 274 70% -- -- -- --
University Retention Rate 1,903 65% 2,121 67% 2,305 68% -- -- -- --
Undergraduate TransfersNumber EnteringAfter One YearDepartment Retention Rate* 61 85% 61 84% 83 87% 73 88% 78 93%
College Retention Rate 686 86% 656 85% 793 85% 648 88% 700 89%
University Retention Rate 2,991 86% 3,073 86% 3,709 85% 3,103 87% 3,138 88%
After Two YearsDepartment Retention Rate* 56 78% 56 77% 82 86% 73 88% -- --
College Retention Rate 653 82% 620 81% 743 80% 607 82% -- --
University Retention Rate 2,789 80% 2,869 80% 3,453 79% 2,850 80% -- --
42 19 38 29 33
Entering in Fall
2011 2012 2013 2014 2015
2011 2012 2013 2014 2015
Entering in Fall
72 73 95 83 84
* Retention rate is the sum of the counts of continuation and graduation divided by original entering student numbers.
Family and Consumer Sciences 16
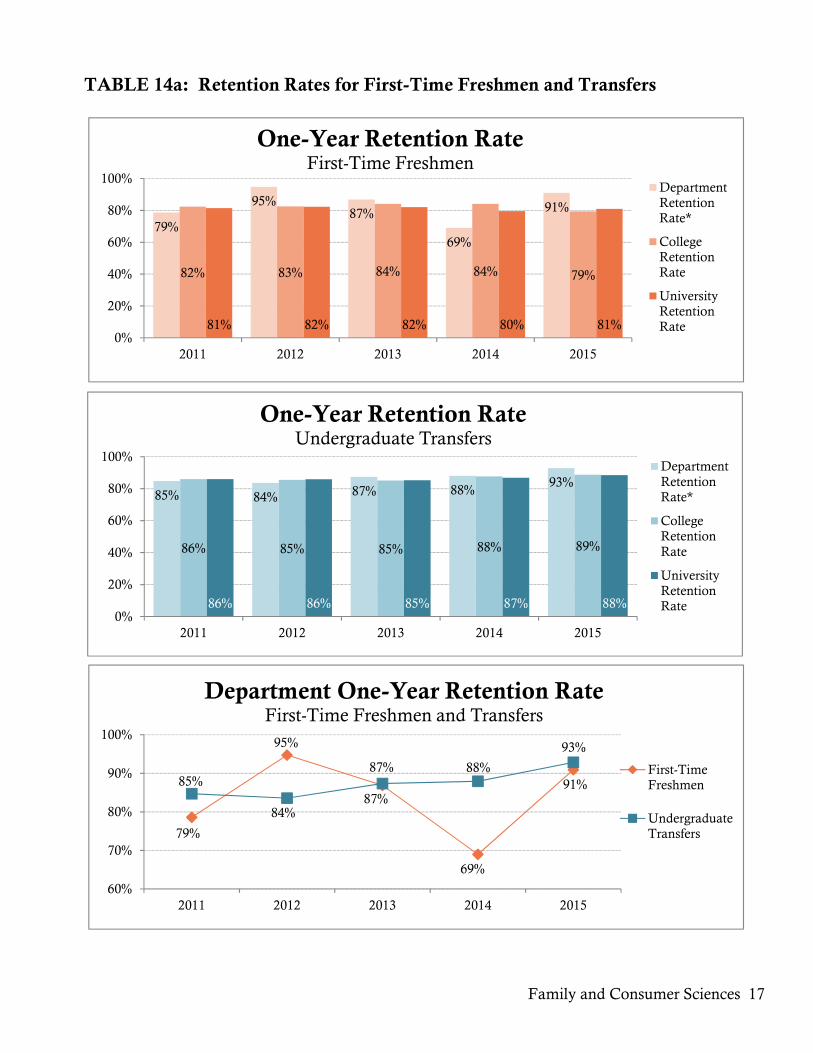
TABLE 14a: Retention Rates for First-Time Freshmen and Transfers
79%
95%87%
69%
91%
82% 83% 84% 84% 79%
81% 82% 82% 80% 81%0%
20%
40%
60%
80%
100%
2011 2012 2013 2014 2015
One-Year Retention RateFirst-Time Freshmen
DepartmentRetentionRate*
CollegeRetentionRate
UniversityRetentionRate
85% 84% 87% 88%93%
86% 85% 85% 88% 89%
86% 86% 85% 87% 88%0%
20%
40%
60%
80%
100%
2011 2012 2013 2014 2015
One-Year Retention RateUndergraduate Transfers
DepartmentRetentionRate*
CollegeRetentionRate
UniversityRetentionRate
79%
95%
87%
69%
91%85%
84%
87% 88%
93%
60%
70%
80%
90%
100%
2011 2012 2013 2014 2015
Department One-Year Retention RateFirst-Time Freshmen and Transfers
First-TimeFreshmen
UndergraduateTransfers
Family and Consumer Sciences 17

TABLE 14b: Retention Rates by Program/Concentration
First-Time FreshmenNutrition and FoodNumber Entering
After One Year 24 89% 11 92% 18 86% 14 67% 20 87%
After Two Years 22 81% 9 75% 15 71% 14 67% -- --
After Three Years 22 81% 8 67% 18 86% -- -- -- --
Apparel Marketing & DesignNumber Entering
After One Year 9 60% 7 100% 15 88% 6 75% 7 100%
After Two Years 9 60% 7 100% 12 71% 5 63% -- --
After Three Years 9 60% 7 100% 12 71% -- -- -- --
Undergraduate TransfersNutrition and FoodNumber Entering
After One Year 46 85% 48 83% 65 87% 52 87% 55 93%
After Two Years 41 76% 43 74% 65 87% 52 87% -- --
After Three Years 40 74% 38 66% 62 83% -- -- -- --
Apparel Marketing & DesignNumber Entering
After One Year 8 80% 10 91% 15 94% 9 82% 13 100%
After Two Years 9 90% 10 91% 14 88% 9 82% -- --
After Three Years 9 90% 10 91% 14 88% -- -- -- --
10 11 16 11 13
7
54 58 75 60 59
2011 2012 2013 2014 2015
Entering in Fall
Entering in Fall
2011 2012 2013 2014 2015
27 12 21 21 23
15 7 17 8
Family and Consumer Sciences 18

TABLE 15a: Graduation Rates for First-Time Freshmen and Transfers
First-Time FreshmenNumber Entering4-Year Graduation RateDepartment Rate 6 22% 2 6% 1 3% 5 12% 1 5%
College Rate 42 12% 42 11% 44 13% 47 14% 46 14%
University Rate 191 7% 203 7% 243 9% 242 8% 276 9%
5-Year Graduation RateDepartment Rate 13 48% 10 29% 12 36% 18 43% -- --
College Rate 119 35% 153 38% 140 41% 142 41% -- --
University Rate 748 29% 894 29% 883 32% 942 32% -- --
6-Year Graduation RateDepartment Rate 20 74% 18 51% 19 58% -- -- -- --
College Rate 170 49% 215 54% 185 54% -- -- -- --
University Rate 1,121 43% 1,400 46% 1,320 48% -- -- -- --
Undergraduate TransfersNumber Entering2-Year Graduation RateDepartment Rate 16 25% 14 19% 11 15% 23 24% 18 22%
College Rate 243 30% 210 26% 201 26% 299 32% 239 32%
University Rate 844 24% 818 24% 857 24% 1,119 26% 969 27%
3-Year Graduation RateDepartment Rate 34 53% 37 51% 38 52% 63 66% -- --
College Rate 503 63% 510 64% 479 62% 602 65% -- --
University Rate 2,044 58% 2,069 59% 2,123 59% 2,549 59% -- --
4-Year Graduation RateDepartment Rate 42 66% 51 71% 47 64% -- -- -- --
College Rate 597 75% 599 75% 552 72% -- -- -- --
University Rate 2,517 71% 2,478 71% 2,509 70% -- -- -- --
Entering in Fall
2008 2009 2010 2011 201227 35 33 42 19
Entering in Fall
64
2010 2011 2012 2013 201472 73 95 83
Family and Consumer Sciences 19

TABLE 15a: Graduation Rates for First-Time Freshmen and Transfers
66% 71%64%
75% 75% 72%
71% 71% 70%0%
20%
40%
60%
80%
100%
2010 2011 2012
Entering in Fall...
Four-Year Graduation RateUndergraduate Transfers
DepartmentRate
College Rate
UniversityRate
74%
51%58%
49% 54% 54%
43% 46% 48%0%
20%
40%
60%
80%
100%
2008 2009 2010
Entering in Fall...
Six-Year Graduation RateFirst-Time Freshmen
DepartmentRate
College Rate
UniversityRate
74%
51%58%
66%
71%64%
0%
20%
40%
60%
80%
100%
Cohort 1 Cohort 2 Cohort 3
Department Graduation RateFirst-Time Freshmen and Transfers
First-TimeFreshmen
UndergraduateTransfers
Family and Consumer Sciences 20
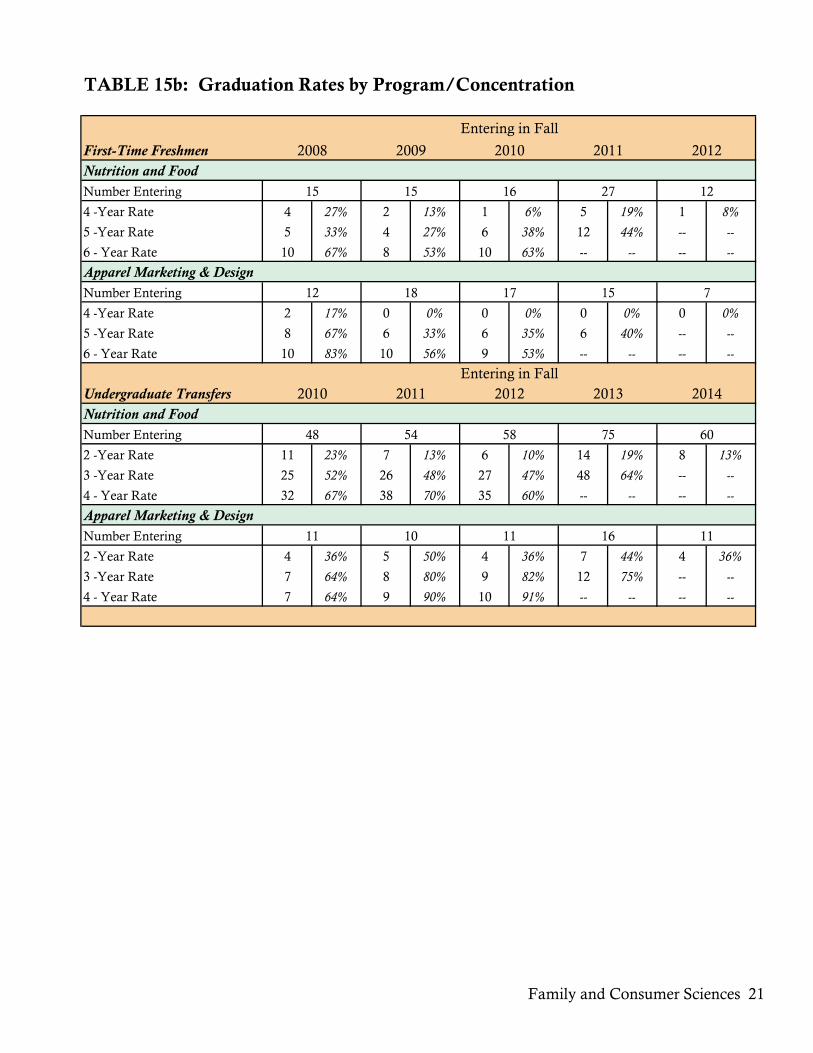
TABLE 15b: Graduation Rates by Program/Concentration
First-Time FreshmenNutrition and FoodNumber Entering
4 -Year Rate 4 27% 2 13% 1 6% 5 19% 1 8%
5 -Year Rate 5 33% 4 27% 6 38% 12 44% -- --
6 - Year Rate 10 67% 8 53% 10 63% -- -- -- --
Apparel Marketing & DesignNumber Entering
4 -Year Rate 2 17% 0 0% 0 0% 0 0% 0 0%
5 -Year Rate 8 67% 6 33% 6 35% 6 40% -- --
6 - Year Rate 10 83% 10 56% 9 53% -- -- -- --
Undergraduate TransfersNutrition and FoodNumber Entering
2 -Year Rate 11 23% 7 13% 6 10% 14 19% 8 13%
3 -Year Rate 25 52% 26 48% 27 47% 48 64% -- --
4 - Year Rate 32 67% 38 70% 35 60% -- -- -- --
Apparel Marketing & DesignNumber Entering
2 -Year Rate 4 36% 5 50% 4 36% 7 44% 4 36%
3 -Year Rate 7 64% 8 80% 9 82% 12 75% -- --
4 - Year Rate 7 64% 9 90% 10 91% -- -- -- --
2012
2010 2011 2012 2013 2014
11 10 11 16 11
48 54 58 75 60
Entering in Fall
Entering in Fall
15 15 16 27 12
12 18 17 15 7
2008 2009 2010 2011
Family and Consumer Sciences 21

Name Course SectionStudent Course Credits
EnrollmentTeam
TeachingStudent
FTEWTU
Albers, LR FACS 221A 1 3 8 100 1.6 3.0
Albers, LR FACS 222 1 1 8 100 0.5 1.0
Albers, LR FACS 295 1 2.7 6 100 1.1 3.0
Albers, LR FACS 295 2 2 4 100 0.5 2.0
Albers, LR Total 26 3.7 9.0
Amato, E FACS 168 1 3 29 100 5.8 3.0
Amato, E FACS 168 2 3 45 100 9.0 3.0
Amato, E FACS 168 3 3 34 100 6.8 3.0
Amato, E Total 108 21.6 9.0
Baca, J FACS 223 1 2 8 100 1.1 2.0
Baca, J Total 8 1.1 2.0
Buchan, WM FACS 113 1 3 42 100 8.4 3.0
Buchan, WM FACS 118A 1 2 25 100 3.3 2.0
Buchan, WM FACS 118A 2 1 25 100 1.7 1.3
Buchan, WM FACS 199 1 1 9 56 0.6 3.0
Buchan, WM Total 101 14.0 9.3
Caldwell, KJ FACS 032 1 1 17 100 1.1 1.0
Caldwell, KJ FACS 032 2 2 17 100 2.3 2.6
Caldwell, KJ Total 34 3.4 3.6
Chih, YF FACS 100 2 3 31 100 6.2 3.0
Chih, YF FACS 100 3 3 33 100 6.6 3.0
Chih, YF FACS 100 4 3 31 100 6.2 3.0
Chih, YF Total 95 19.0 9.0
Cook, JL FACS 050 3 3 119 100 23.8 3.0
Cook, JL FACS 100 1 3 39 100 7.8 3.0
Cook, JL FACS 150 1 3 32 100 6.4 3.0
Cook, JL Total 190 38.0 9.0
Dunlea, AD FACS 154 4 3 8 27 1.6 0.8
Dunlea, AD* Total 8 1.6 0.8
Dunn-Hall, T FACS 119 2 3 38 100 7.6 3.0
Dunn-Hall, T FACS 120 1 3 39 100 7.8 3.0
Dunn-Hall, T Total 77 15.4 6.0
Elfant, M FACS 107 2 3 32 100 6.4 3.0
Elfant, M Total 32 6.4 3.0
El-Murr, R FACS 107 3 3 33 100 6.6 3.0
El-Murr, R Total 33 6.6 3.0
Garg, P FACS 031 1 3 26 100 5.2 3.0
Garg, P Total 26 5.2 3.0
Gazzaniga-Moloo, J FACS 010 2 3 110 82 22.0 2.4
Gazzaniga-Moloo, J FACS 010 5 3 121 100 24.2 3.0
Gazzaniga-Moloo, J FACS 010 81 3 25 19 5.0 0.6
Gazzaniga-Moloo, J Total 256 51.2 6.0
Appendix A: Faculty Work Load (Fall 2016)
A - 1

Name Course SectionStudent Course Credits
EnrollmentTeam
TeachingStudent
FTEWTU
Appendix A: Faculty Work Load (Fall 2016)
Gill, S FACS 154 2 3 9 23 1.8 0.7
Gill, S* Total 9 1.8 0.7
Hanna, L FACS 115 1 3 39 100 7.8 3.0
Hanna, L FACS 115 2 3 40 100 8.0 3.0
Hanna, L FACS 119 1 3 39 100 7.8 3.0
Hanna, L Total 118 23.6 9.0
Moylan, JA FACS 154 1 3 11 27 2.2 0.8
Moylan, JA FACS 155 1 3 37 100 7.4 3.0
Moylan, JA FACS 162 1 2 24 100 3.2 2.0
Moylan, JA FACS 162 2 1 24 100 1.6 2.0
Moylan, JA FACS 195C 2 2 1 50 0.1 0.2
Moylan, JA* Total 97 14.5 8.0
Mulasi, U FACS 113 4 3 34 100 6.8 3.0
Mulasi, U FACS 114 1 3 82 100 16.4 3.0
Mulasi, U Total 116 23.2 6.0
Narvand, P FACS 141 1 3 113 100 22.6 3.0
Narvand, P Total 113 22.6 3.0
Paulson, A FACS 108 1 3 95 94 19.0 2.8
Paulson, A FACS 140 2 3 33 100 6.6 3.0
Paulson, A FACS 140 4 3 23 100 4.6 3.0
Paulson, A FACS 150 2 3 35 100 7.0 3.0
Paulson, A* Total 186 37.2 11.8
Peck, P FACS 195A 1 1.8 5 100 0.6 1.7
Peck, P* Total 5 0.6 1.7
Pierce, N FACS 154 3 3 12 24 2.4 0.7
Pierce, N* Total 12 2.4 0.7
Ransbury, K FACS 113 3 3 35 100 7.0 3.0
Ransbury, K Total 35 7.0 3.0
Rapalyea, L FACS 050 1 3 98 80 19.6 2.4
Rapalyea, L FACS 050 80 3 24 20 4.8 0.6
Rapalyea, L Total 122 24.4 3.0
Samarron, S FACS 010 1 3 92 79 18.4 2.4
Samarron, S FACS 010 4 3 80 100 16.0 3.0
Samarron, S FACS 010 80 3 25 21 5.0 0.6
Samarron, S FACS 113 2 3 37 100 7.4 3.0
Samarron, S Total 234 46.8 9.0
Shebloski, B FACS 050 2 3 91 100 18.2 3.0
Shebloski, B FACS 052 1 3 37 100 7.4 3.0
Shebloski, B FACS 140 1 3 33 100 6.6 3.0
Shebloski, B FACS 140 3 3 32 100 6.4 3.0
Shebloski, B Total 193 38.6 12.0
Shen, D FACS 030 1 3 35 100 7.0 3.0
A - 2

Name Course SectionStudent Course Credits
EnrollmentTeam
TeachingStudent
FTEWTU
Appendix A: Faculty Work Load (Fall 2016)
Shen, D FACS 134 1 3 33 100 6.6 3.0
Shen, D FACS 135 1 3 28 100 5.6 3.0
Shen, D Total 96 19.2 9.0
Shilts, MK FACS 107 1 3 30 100 6.0 3.0
Shilts, MK FACS 117 1 2 19 100 2.5 2.0
Shilts, MK FACS 117 2 1 19 100 1.3 2.0
Shilts, MK Total 68 9.8 7.0
Teh, K FACS 010 3 3 84 100 16.8 3.0
Teh, K Total 84 16.8 3.0
Thompson, KR FACS 110 1 3 35 100 7.0 3.0
Thompson, KR FACS 110 2 1 20 100 1.3 1.5
Thompson, KR FACS 110 3 1 15 100 1.0 1.5
Thompson, KR FACS 110 4 3 37 100 7.4 3.0
Thompson, KR FACS 110 5 1 19 100 1.3 1.5
Thompson, KR FACS 110 6 1 18 100 1.2 1.5
Thompson, KR Total 144 19.2 12.0
Torres, CI FACS 011 1 2 27 100 3.6 2.0
Torres, CI FACS 011 2 1 27 100 1.8 1.3
Torres, CI FACS 011 3 2 27 100 3.6 2.0
Torres, CI FACS 011 4 1 27 100 1.8 1.3
Torres, CI FACS 011 5 2 26 100 3.5 2.0
Torres, CI FACS 011 6 1 26 100 1.7 1.3
Torres, CI Total 160 16.0 9.9
Trujillo, J FACS 009 1 2 49 100 6.5 2.0
Trujillo, J FACS 009 2 2 39 100 5.2 2.0
Trujillo, J Total 88 11.7 4.0
Turner, N FACS 133 1 2 33 100 4.4 2.0
Turner, N FACS 133 2 1 33 100 2.2 1.3
Turner, N FACS 137 1 3 41 100 8.2 3.0
Turner, N Total 107 14.8 6.3
Wie, S FACS 195C 2 2 1 50 0.1 0.2
Wie, S FACS 199 1 1 7 44 0.5 2.3
Wie, S Total 7 0.5 2.5
Yager, R FACS 116 1 4 36 100 9.6 4.0
Yager, R Total 36 9.6 4.0
Grand Total 3024 547.5 198.3
Source: APDB report, Fall 2016, excluding the instructors without college/department affiliation.
Please Note: (*) Indicates that the instructor teaches courses in more than one department.
A - 3
Name Course SectionStudent Course Credits
EnrollmentTeam
TeachingStudent
FTEWTU
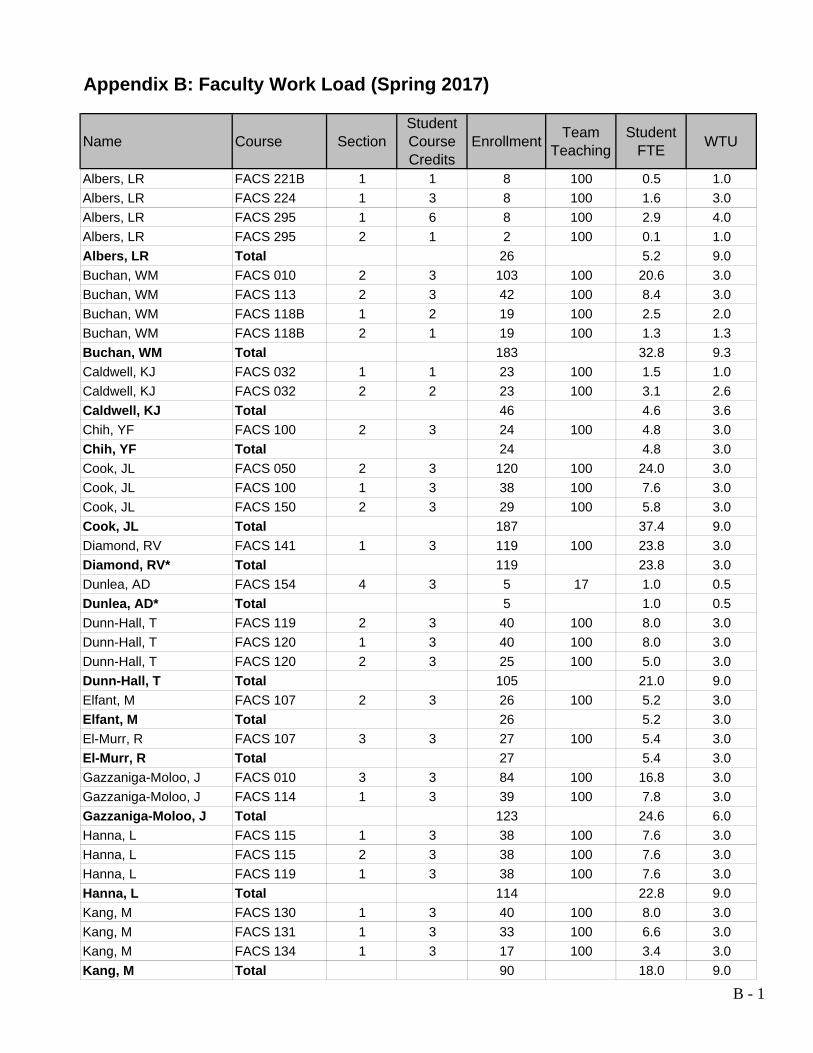
Albers, LR FACS 221B 1 1 8 100 0.5 1.0
Albers, LR FACS 224 1 3 8 100 1.6 3.0
Albers, LR FACS 295 1 6 8 100 2.9 4.0
Albers, LR FACS 295 2 1 2 100 0.1 1.0
Albers, LR Total 26 5.2 9.0
Buchan, WM FACS 010 2 3 103 100 20.6 3.0
Buchan, WM FACS 113 2 3 42 100 8.4 3.0
Buchan, WM FACS 118B 1 2 19 100 2.5 2.0
Buchan, WM FACS 118B 2 1 19 100 1.3 1.3
Buchan, WM Total 183 32.8 9.3
Caldwell, KJ FACS 032 1 1 23 100 1.5 1.0
Caldwell, KJ FACS 032 2 2 23 100 3.1 2.6
Caldwell, KJ Total 46 4.6 3.6
Chih, YF FACS 100 2 3 24 100 4.8 3.0
Chih, YF Total 24 4.8 3.0
Cook, JL FACS 050 2 3 120 100 24.0 3.0
Cook, JL FACS 100 1 3 38 100 7.6 3.0
Cook, JL FACS 150 2 3 29 100 5.8 3.0
Cook, JL Total 187 37.4 9.0
Diamond, RV FACS 141 1 3 119 100 23.8 3.0
Diamond, RV* Total 119 23.8 3.0
Dunlea, AD FACS 154 4 3 5 17 1.0 0.5
Dunlea, AD* Total 5 1.0 0.5
Dunn-Hall, T FACS 119 2 3 40 100 8.0 3.0
Dunn-Hall, T FACS 120 1 3 40 100 8.0 3.0
Dunn-Hall, T FACS 120 2 3 25 100 5.0 3.0
Dunn-Hall, T Total 105 21.0 9.0
Elfant, M FACS 107 2 3 26 100 5.2 3.0
Elfant, M Total 26 5.2 3.0
El-Murr, R FACS 107 3 3 27 100 5.4 3.0
El-Murr, R Total 27 5.4 3.0
Gazzaniga-Moloo, J FACS 010 3 3 84 100 16.8 3.0
Gazzaniga-Moloo, J FACS 114 1 3 39 100 7.8 3.0
Gazzaniga-Moloo, J Total 123 24.6 6.0
Hanna, L FACS 115 1 3 38 100 7.6 3.0
Hanna, L FACS 115 2 3 38 100 7.6 3.0
Hanna, L FACS 119 1 3 38 100 7.6 3.0
Hanna, L Total 114 22.8 9.0
Kang, M FACS 130 1 3 40 100 8.0 3.0
Kang, M FACS 131 1 3 33 100 6.6 3.0
Kang, M FACS 134 1 3 17 100 3.4 3.0
Kang, M Total 90 18.0 9.0
Appendix B: Faculty Work Load (Spring 2017)
B - 1

Name Course SectionStudent Course Credits
EnrollmentTeam
TeachingStudent
FTEWTU
Appendix B: Faculty Work Load (Spring 2017)
Lewis, K FACS 154 2 3 15 35 3.0 1.0
Lewis, K* Total 15 3.0 1.0
Malroutu, YL FACS 168 1 3 35 100 7.0 3.0
Malroutu, YL FACS 168 2 3 42 100 8.4 3.0
Malroutu, YL FACS 168 3 3 29 100 5.8 3.0
Malroutu, YL Total 106 21.2 9.0
Mulasi, U FACS 114 2 3 75 100 15.0 3.0
Mulasi, U Total 75 15.0 3.0
Nichols, T FACS 162 1 2 13 100 1.7 2.0
Nichols, T FACS 162 2 1 13 100 0.9 2.0
Nichols, T Total 26 2.6 4.0
Paulson, A FACS 108 1 3 42 89 8.4 2.7
Paulson, A FACS 140 2 3 40 100 8.0 3.0
Paulson, A FACS 140 4 3 40 100 8.0 3.0
Paulson, A FACS 150 1 3 34 100 6.9 3.0
Paulson, A* Total 156 31.3 11.7
Peck, P FACS 195A 2 1 3 100 0.2 1.0
Peck, P* Total 3 0.2 1.0
Pierce, N FACS 154 1 3 12 27 2.4 0.8
Pierce, N* Total 12 2.4 0.8
Ransbury, K FACS 113 1 3 36 100 7.2 3.0
Ransbury, K Total 36 7.2 3.0
Rapalyea, L FACS 050 1 3 119 100 23.8 3.0
Rapalyea, L FACS 100 3 3 39 100 7.8 3.0
Rapalyea, L FACS 100 4 3 35 100 7.0 3.0
Rapalyea, L FACS 159 1 3 41 100 8.2 3.0Rapalyea, L Total 234 46.8 12.0
Samarron, S FACS 010 1 3 88 100 17.6 3.0
Samarron, S FACS 010 4 3 84 100 16.8 3.0
Samarron, S FACS 113 3 3 37 100 7.4 3.0
Samarron, S FACS 170 1 3 19 100 3.8 3.0
Samarron, S* Total 228 45.6 12.0
Shebloski, B FACS 050 3 3 88 100 17.6 3.0
Shebloski, B FACS 140 1 3 34 100 6.8 3.0
Shebloski, B FACS 140 3 3 33 100 6.6 3.0
Shebloski, B FACS 152 1 3 40 100 8.0 3.0
Shebloski, B Total 195 39.0 12.0
Shen, D FACS 030 1 3 33 100 6.6 3.0
Shen, D FACS 136 1 3 36 100 7.2 3.0
Shen, D FACS 139 1 3 31 100 6.2 3.0
Shen, D Total 100 20.0 9.0
Shilts, MK FACS 107 1 3 37 100 7.4 3.0
B - 2

Name Course SectionStudent Course Credits
EnrollmentTeam
TeachingStudent
FTEWTU
Appendix B: Faculty Work Load (Spring 2017)
Shilts, MK FACS 117 1 2 24 100 3.2 2.0
Shilts, MK FACS 117 2 1 24 100 1.6 2.0
Shilts, MK Total 85 12.2 7.0
Thompson, KR FACS 011 3 2 23 100 3.1 2.0
Thompson, KR FACS 011 4 1 23 100 1.5 1.3
Thompson, KR FACS 011 7 2 22 100 2.9 2.0
Thompson, KR FACS 011 8 1 22 100 1.5 1.3
Thompson, KR FACS 110 4 3 40 100 8.0 3.0
Thompson, KR FACS 110 5 1 40 100 2.7 1.5Thompson, KR Total 170 19.7 11.1
Torres, CI FACS 011 1 2 25 100 3.3 2.0
Torres, CI FACS 011 2 1 25 100 1.7 1.3
Torres, CI FACS 011 5 2 23 100 3.1 2.0
Torres, CI FACS 011 6 1 23 100 1.5 1.3
Torres, CI FACS 110 1 3 37 100 7.4 3.0
Torres, CI FACS 110 2 1 20 100 1.3 1.5
Torres, CI FACS 110 3 1 17 100 1.1 1.5
Torres, CI Total 170 19.5 12.6
Trujillo, J FACS 009 2 2 40 100 5.3 2.0
Trujillo, J FACS 009 3 2 44 100 5.9 2.0
Trujillo, J Total 84 11.2 4.0
Waechter-McMillan, MR FACS 154 3 3 11 23 2.2 0.7
Waechter-McMillan, MR*Total 11 2.2 0.7
Wie, S FACS 009 1 2 38 100 5.1 2.0
Wie, S FACS 195A 1 2 2 100 0.2 0.7
Wie, S FACS 195C 1 2 3 100 0.4 1.0
Wie, S FACS 199 1 2 2 100 0.2 0.7
Wie, S Total 45 5.9 4.3
Yager, R FACS 116 1 4 25 100 6.7 4.0
Yager, R Total 25 6.7 4.0
Grand Total 2851 518.1 198.7
Source: APDB report, Spring 2017, excluding the instructors without college/department affiliation.
Please Note: (*) Indicates that the instructor teaches courses in more than one department.
B - 3

College of Social Sciences and Interdisciplinary Studies: Student Flow from Initial Major to Final Degree2010 Freshman Cohort Initial Major(Entering in Fall 2010) ANTH ASIA ECON ENVS ETHN FACS GERO GOVT LBST PSYC SOC SSCI WOMS CollegeCohort Headcount 11 5 7 12 1 33 0 25 36 169 32 11 0 342Anthropology 3 3Asian Studies 1 1Economics 2 2Environmental Studies 6 1 7Ethnic Studies 0Family & Consumer Science 1 9 10Gerontology 0Government 8 8Liberal Studies 1 1 17 19Psychology 2 2 1 4 44 3 56Sociology 2 4 6Social Science 3 1 4Withdrew 5 3 4 2 1 12 0 11 14 63 17 4 0 136Enrolled in Fall 2016 0 0 0 2 0 2 0 1 0 14 2 0 0 21Graduated (Initial major) 3 1 2 6 0 9 0 8 17 44 4 1 95
Flowed in from undeclared group 2 0 3 1 1 12 3 5 3 7 7 0 0 44Flowed in from other SSI majors 0 0 3 1 0 2 2 8 0 2 3 0 0 21Flowed in from other colleges of Sac State 1 3 22 5 9 25 21 13 19 18 37 3 4 176Total Inflow 3 3 28 7 10 39 26 26 22 27 47 3 4 241Adjusted Cohort 11 7 34 17 11 62 26 46 53 148 70 8 4 493
Flowed out to other SSI majors 0 0 0 1 0 1 0 0 2 12 2 3 0 21Flowed out to other colleges of Sac State 3 1 1 1 0 9 0 5 3 36 7 3 0 69Total Outflow 3 1 1 2 0 10 0 5 5 48 9 6 0 90
From initial Major1 27.3% 20.0% 28.6% 50.0% 0.0% 27.3% 32.0% 47.2% 26.0% 12.5% 9.1% 27.8%Add inflow students2 54.5% 57.1% 88.2% 76.5% 90.9% 77.4% 100.0% 73.9% 73.6% 48.0% 72.9% 50.0% 100.0% 68.2%Add outflow students3 (Official rate) 54.5% 40.0% 42.9% 66.7% 0.0% 57.6% 52.0% 61.1% 54.4% 40.6% 63.6% 54.1%
Withdraw Rate 45.5% 60.0% 57.1% 16.7% 100.0% 36.4% 44.0% 38.9% 37.3% 53.1% 36.4% 39.8%Outflow Rate 27.3% 20.0% 14.3% 16.7% 0.0% 30.3% 20.0% 13.9% 28.4% 28.1% 54.5% 26.3%
3. This rate is calculated by dividing the number of students who graduated from their initial major plus outflow students by the number of students in the original cohort. This is the official graduate ratefor each major and college.
1. This rate is calculated by dividing the number of students who graduated from their initial major by the number of students in the original cohort.
Final Degree (Graduated by Summer 2016)
Student Inflow
Student Outflow
6‐Year Graduation Rate
6‐Year Attrition Rate
2. This rate is calculated by dividing the number of students who graduated from their initial major plus inflow students by the number of students in the adjusted cohort (original cohort plus inflowstudents minus outflow students). This is the actual graduation rate for each major and college.
C - 1

College of Social Sciences and Interdisciplinary Studies: Student Flow from Initial Major to Final Degree2012 Transfer Cohort Initial Major(Entering in Fall 2012) ANTH ASIA ECON ENVS ETHN FACS GERO GOVT LBST PSYC SOC SSCI WOMS CollegeCohort Headcount 38 5 47 21 6 73 5 64 99 294 92 23 1 768Anthropology 22 22Asian Studies 3 1 4Economics 31 1 32Environmental Studies 11 11Ethnic Studies 3 1 4Family & Consumer Science 1 37 1 39Gerontology 4 4Government 44 44Liberal Studies 70 2 72Psychology 2 3 156 9 1 1 172Sociology 1 1 1 1 56 1 61Social Science 1 13 14Women's Studies 0Withdrew 12 1 9 8 1 21 1 15 20 60 22 4 1 175Enrolled in Fall 2016 2 0 4 1 0 5 0 1 0 21 4 3 0 41Graduated (Initial major) 22 3 31 11 3 37 4 44 70 156 56 13 0 450
Flowed in from undeclared group 0 0 0 0 0 0 0 1 0 1 0 0 0 2Flowed in from other SSI majors 1 0 2 0 1 4 0 5 1 1 9 16 2 42Flowed in from other colleges of Sac State 2 1 42 7 6 12 11 8 4 14 31 4 0 142Total Inflow 3 1 44 7 7 16 11 14 5 16 40 20 2 186Adjusted Cohort 39 5 88 27 11 79 16 74 95 253 122 40 3 852
Flowed out to other SSI majors 0 1 1 0 1 2 0 0 2 16 5 1 0 29Flowed out to other colleges of Sac State 2 0 2 1 1 8 0 4 7 41 5 2 0 73Total Outflow 2 1 3 1 2 10 0 4 9 57 10 3 0 102
From initial Major1 57.9% 60.0% 66.0% 52.4% 50.0% 50.7% 80.0% 68.8% 70.7% 53.1% 60.9% 56.5% 0.0% 58.6%Add inflow students2 64.1% 80.0% 85.2% 66.7% 90.9% 67.1% 93.8% 78.4% 78.9% 68.0% 78.7% 82.5% 66.7% 74.6%Add outflow students3 (Official rate) 63.2% 80.0% 72.3% 57.1% 83.3% 64.4% 80.0% 75.0% 79.8% 72.4% 71.7% 69.6% 71.9%
Withdraw Rate 31.6% 20.0% 19.1% 38.1% 16.7% 28.8% 20.0% 23.4% 20.2% 20.4% 23.9% 17.4% 100.0% 22.8%Outflow Rate 5.3% 20.0% 6.4% 4.8% 33.3% 13.7% 0.0% 6.3% 9.1% 19.4% 10.9% 13.0% 0.0% 13.3%
3. This rate is calculated by dividing the number of students who graduated from their initial major plus outflow students by the number of students in the original cohort. This is the official graduate rate for each major and college.
Final Degree (Graduated by Summer 2016)
Student Inflow
Student Outflow
4‐Year Graduation Rate
4‐Year Attrition Rate
1. This rate is calculated by dividing the number of students who graduated from their initial major by the number of students in the original cohort.2. This rate is calculated by dividing the number of students who graduated from their initial major plus inflow students by the number of students in the adjusted cohort (original cohort plus inflow students minus outflow students). This is the actual graduation rate for each major and college.
C - 2