faculty patenting and the open science environment
TRANSCRIPT

Research Policy 37 (2008) 914–931
Available online at www.sciencedirect.com
Commercializing the laboratory: Faculty patenting andthe open science environment
Kira R. Fabrizio a,∗, Alberto Di Minin b
a Haas School of Business, University of California, Berkeley, Berkeley, CA 94720, USAb Berkeley Roundtable on the International Economy (BRIE), University of California Berkeley, Berkeley, CA 94720, USA
Received 17 August 2005; received in revised form 14 December 2007; accepted 8 January 2008Available online 3 April 2008
Abstract
This paper investigates the relationship between patenting and publication of research results by university faculty members.Our study adds to the limited evidence on this topic with an empirical investigation based on a panel data set for a broad sampleof university researchers. Results suggest that publication and patenting are complementary, not substitute, activities for facultymembers. This is not consistent with recent concerns regarding deleterious effects of patenting on the research output of faculty
members. Average citations to publications, however, appear to decline for repeat patenters, suggesting either a decrease in qualityor restrictions on use associated in patent protection.© 2008 Elsevier B.V. All rights reserved.PACS: I28; 031; 032; 038
Keywords: Technology management; Intellectual property policy
1. Introduction
University research has traditionally been associatedwith norms of rapid disclosure of research results andan environment of knowledge sharing, co-authorship,and joint projects that contribute to cumulative learningand innovation (Dasgupta and David, 1994). The rewardsystem for faculty provides incentives for being first todiscover and disclose new research results, and valuable
reputations are built on diffusion of these results amongthe scientific community. Faculty members thereforehave the incentive to pursue impactful research prob-∗ Corresponding author. Permanent address: Goizueta BusinessSchool, Emory University, 1300 Clifton Road, Atlanta, GA 30322,USA. Tel.: +1 404 727 4198; fax: +1 404 727 6663.
E-mail address: Kira [email protected] (K.R. Fabrizio).
0048-7333/$ – see front matter © 2008 Elsevier B.V. All rights reserved.doi:10.1016/j.respol.2008.01.010
lems and disclose research results openly and quickly(David, 1998; David et al., 1992). These activities stim-ulate the cumulative research process by facilitating thegenerating of fundamental discoveries and the transfer ofknowledge among researchers. These norms and incen-tives are being challenged by the increasing patenting ofuniversity research results. In this study, we examine therelationship between a faculty member’s involvement inpatenting research results and the quantity and quality ofpublications generated. Our goal is to evaluate the recentconcerns that patenting negatively affects the generationand publication of academic research.
This is an important question because academic
research results contribute substantially to the industrialR&D process (Mansfield, 1991, 1995, 1998; Narin etal., 1997). To varying degrees, respondents in all indus-tries report that a significant percentage of their product
Researc
awtidrmfifomrTtc
pr1dAsioeurtgup
ti
e
stfitfpiAwr
lRs1
K.R. Fabrizio, A. Di Minin /
nd process innovations could not have been developedithout academic research, or would have been substan-
ially delayed. University research was reported as anmportant source of new projects for 31% of respon-ents and an important source of information for 36% ofespondents (Cohen et al., 2002). In their survey of R&Danagers across many industries, Cohen et al. (2002)nd that the most important channel for knowledge trans-er from universities or government labs is publicationf the research, followed by informal exchange, publiceetings or conferences, and consulting. Patents were
anked as one of the least important transfer channels.1
herefore, it is important both that academics continueo pursue fundamental research question and that theyontinue to publish their research findings.
There is reason to believe that the influence ofatenting and commercialization activity on universityesearchers has grown in recent years. Since the late970s, the university research environment has changedramatically. Policy changes, such as the Bayh-Dolect of 1980,2 encouraged commercialization of univer-
ity research results by standardizing policies grantingntellectual property rights to university researchers forutcomes of federally under research.3 At the time, fed-rally funded research made up approximately 70% ofniversity research.4 In addition, sources of academicesearch funding shifted substantially from the 1970so the 1980s to include more industry funding and less
overnment funding (Mansfield, 1995).5 Universitiesnderwent organizational changes to attempt to betterromote the commercialization of university research1 The pharmaceutical industry stands in contrast to these generaliza-ions, with more knowledge transfer through the information disclosedn patents.
2 Patent and Trademark Act Amendments (P.L. 96-517).3 See Jaffe (2000) and Mowery and Ziedonis (2001) for a more
xtensive history of the policy changes.4 University faculty members do hold patents from prior to the pas-
age of the Bayh-Dole Act. Some of these inventions were not patentedhrough the university (i.e. they were patented by firms with which theaculty member worked or they were patented by the faculty personndividually and not assigned to the university). However, even beforehe Bayh-Dole Act, universities could and did patent some inventionsrom faculty research. For example, the famous Cohen and Boyeratent on recombinant DNA technology was applied for in 1979 ands assigned to Stanford University. The importance of the Bayh-Dolect is that it streamlined and standardized the rights of universitiesith respect to intellectual property stemming from federally funded
esearch.5 Industry funding of university research increased from $630 mil-
ion to $1.896 billion between 1985 and 1998, university-industry joint&D centers grew 60% during the 1980s, and the number of univer-
ity offices of technology transfer increased more than 800% between980 and 1995 (Cohen et al., 2002).
h Policy 37 (2008) 914–931 915
results (Argyres and Leibeskind, 1998). In response tothese policy, institutional, and market changes, patent-ing by university researchers increased dramatically inthe last two decades (Henderson et al., 1998a,b). Thisincrease in patent volume was accompanied by a sig-nificant increase in the number of universities that werepatenting innovations Henderson et al. (1998a).6 Pro-viding researchers with the incentive to patent theirfindings may encourage commercialization of researchfindings, as intended by the Bayh-Dole Act. How-ever, the increased focus on patenting may also leadto increased secrecy, delayed publication, and a shiftin faculty research effort and time away from scien-tific research and toward commercialization activities,thereby decreasing the production and/or quality of sci-entific publications.
The existing empirical studies that attempt to uncoverthe relationship between academic patenting and pub-lishing activities have presented contradictory pictures.Several surveys of academic researchers have docu-mented the secrecy, delay of publication, and re-focusingof research activities that accompany involvement inpatenting and commercialization activities (Blumenthalet al., 1996a,b; Campbell et al., 2002). However, thefew existing studies of individual research publishingand patenting activities have failed to find such a neg-ative impact. Agrawal and Henderson (2002) examinethe patenting and publishing of faculty members in twodepartments at MIT (Mechanical and Electrical Engi-neering), and find no relationship between patenting andthe generation of publications, but do find that the num-ber of citations to publications is positively related tothe level of patenting, which they interpret as evidencethat patenting is positively correlated with the impact ofresearch. Azoulay et al. (2004) examine the publicationactivity of faculty members in the life sciences field andfind a positive relationship between patenting and thegeneration of publication, but do not examine citationsto the publications. Positive correlations between pub-lishing and patenting can be found in recent empiricalinvestigations of non-U.S. context (Breschi et al., 2005;
Buenstorf, 2006; Looy et al., 2005). Interestingly, Buen-storf’s investigation of publishing behavior of Max PlantInstitutes’ Directors show that the positive correlation6 Mowery and Ziedonis (2001) find that of the 224 universities withpatents issued after 1980, 51 universities had 10 or more issued patentsapplied for between 1970 and 1980, 92 universities had fewer than 10issued patents during 1970–1980, and 81 universities has no patentsissued during 1970–1980. This indicates the significant entry of inex-perienced and less experienced universities into the pool of patentinguniversities.
Researc
the academic community, the reward structure remainsprimarily focused on publications.8 Therefore, facultymembers with research results that are patentable andalso publishable are likely to publish the results even if
7 Note that this conceptualization is implicitly conditional on thefaculty researcher remaining in academia. Career effects of universitypatenting is a topic of future research.
8 Based on a study of French academics, Carayol (2004) finds that theusual academic reward system does not provide incentives for patent-
916 K.R. Fabrizio, A. Di Minin /
between publishing and patenting is somehow weakenedin the few cases where the disclosed inventions werecommercialized.
This study extends the existing literature in severalways. First, we draw from a broad sample of institu-tions and fields in which patenting is occurring, ratherthan focusing on one institution or one academic area.We develop a matched sample of non-patenting facultyresearchers, and employ researcher-level fixed effects toestimate the relationship between patenting and annualpublications or average citations to publications. Thisgenerates results that are more generalizable than someof the other studies. Second, we investigate the differ-ential impacts of university, industry, and unassignedpatents. Third, we examine the possibility that the num-ber of patents held has a curvilinear relationship with thenumber of publications generated. Finally, our analysiscontrols for current researcher quality differently thanthis existing work and results suggest that these controlsare important.
Our findings are consistent with most of these stud-ies, importantly contradict some results, and extend thisbody of literature. Results presented here indicate thatpublication and patenting are complementary activities,but the positive relationship between them declines withan increasing number of cumulative patents held by thefaculty researcher. Although we caution against causalinterpretation of these results, this evidence suggeststhat faculty researchers are not generating less scien-tific research or limiting the open publication of researchresults as they patent, with the possible exception of afew very patent-intensive faculty members. Results ofthe analysis of citations to faculty publications indicatethat the number of citations to a faculty members’ pub-lications is related to the productivity of the researchers,but not substantially different following the first patentby the faculty member. In fact, the citation intensity fallsas a faculty member repeatedly patents his or her researchresults. This is contradictory to the limited previous evi-dence. Although we are focused on average quality andimpact of publications rather than the citation patternsassociated with an individual paper, our results are con-sistent with the anti-commons hypothesis put forth andtested by Murray and Stern (2005).
The remainder of the paper is organized as follows.The next section considers the possible relationshipbetween faculty publishing and patenting activities anddevelops the hypotheses to be tested. Section 3 describes
our sample and data, summary statistics of which arereported in Section 4. Section 5 presents our empiricalstrategy and results with respect to the production ofpublications by faculty members. Section 6 continuesh Policy 37 (2008) 914–931
by exploring the relationship between patenting and thenumber of citations to these publications. Limitations ofthe study are discussed in Section 7, and conclusions areprovided in Section 8.
2. How are patents and publications related?
We focus our study at the researcher level, allowingus to explore individual trade-offs and complemen-tarities between patenting and publication for facultyresearchers.7 There are competing factors which maydrive the relationship between patenting and publica-tion in opposite directions. The null hypothesis is thatfaculty publication is unrelated to patenting: if the fac-ulty member chooses to apply for patent protection forsome of his research discoveries, this does not changehis production of publications from what it would havebeen. The two alternatives we consider and test for arethat publication and patenting may be either complemen-tary or substitute activities for faculty members in U.S.universities.
2.1. Patenting and publishing may be complements
University researchers may experience some comple-mentarities between patenting and publishing. First andforemost, the same research stream may naturally leadto publications and yield patents. Faculty researchersinterviewed by Agrawal and Henderson (2002) statedthat “most patentable research is also publishablepatent-inten,” and that the decision of whether or not topatent research is something that happens after theresearch process, not in the selection of research projects.The academic norm of rewarding priority in disclo-sure of research results provides incentive for rapidopen publication of research results by faculty mem-bers (David, 1998). Although patents may be valued by
ing by faculty members. “The reputational reward of patents withinthe academic community seems to be low: Career profiles and patentproduction are not related,” (Carayol, 2004). This may be less true inU.S. universities, some of which have begun to focus on patenting aswell as publication in promotion decisions.

Researc
tp
wpwsproisiOwrstilrmtr(
bpPietrna
lufs
aivoputs
pc
K.R. Fabrizio, A. Di Minin /
hey are also patented, although they may wait until theatent application is filed to submit the publication.9
In addition, the experience of patenting, licensing, andorking with the licensee to transfer technology mayrompt additional research questions. As the licenseeorks to develop the patented innovation, the univer-
ity researcher may learn or encounter challenges thatoint to new research questions. Academic researcherseport that problems they work on in academic researchften come from ideas and problems encountered dur-ng industrial consulting (Mansfield, 1995). A survey ofcientists found that 65% of researchers reported thatnteraction with industry has influenced their research.ne respondent commented, “There is no doubt thatorking with industry scientists has made me a better
esearcher. They help me refine my experiments andometimes have a different perspective on a problemhat sparks my own ideas” (Siegel et al., 1999). Thisnvolvement and feedback may produce additional pub-ications and potentially additional patents. Universityesearcher involvement in commercialization activitiesay also provide information to the researcher about
he relative value of various research streams, much asesearch grants and consulting have, and continue to doFeller, 1990).10
Patenting of university research by a faculty mem-er may also increase incentives for that researcher toublish more articles related to the patented research.ublications may serve as a type of advertisement,
ncreasing the awareness and knowledgability of the rel-vant scientific community with regard to the patentedechnology. This can raise the value of the patentedesearch because it increases the legitimacy of the tech-ology and creates a set of researchers who know aboutnd may be interested in utilizing the patented research.
Finally, patenting, and the subsequent (potential)icensing revenue and industry involvement may allow a
niversity researcher access to additional funding (eitherrom licensing revenue or industry funding) that he couldpend on additional equipment, researchers, and junior9 There is a 1-year grace period following publication during whichU.S. patent must be filed before the published research is considered
n the public domain. In order to avoid potential problems, some uni-ersity administrators and faculty have instituted a conservative policyf submitting the publication and patent at roughly the same time. Aatenting MIT faculty member that we spoke with stated that theresed to be conflict between open publication and patenting, but thathey had solved this by waiting to submit their publication until theyubmitted their patent application.10 In addition, collaborating with industry researchers may facilitatelacement of PhD graduates (Adams et al., 2005), which could lead toontinuing research funding and collaboration.
h Policy 37 (2008) 914–931 917
faculty members, all of which could contribute positivelyto the publications and patents produced by the lab. Therespondent quoted above stated, “Also, my involvementwith firms has allowed me to purchase better equipmentfor my lab, which means I can conduct more experi-ments,” (Siegel et al., 1999). This may be reflected inboth an increase in the productivity of the universityresearch and an increased lab size, with more researchersworking under the inventing faculty member.
These drivers all lead to the expectation that facultymembers that patent will subsequently generate morepublications. Hence, our first hypothesis is
Hypothesis 1. The number of publications generatedby a faculty researcher will be higher following the appli-cation for a patent by the researcher.
2.2. Patenting and publishing may be substitutes
Alternatively, there are several reasons that a uni-versity researcher involved in patenting might publishfewer articles than he or she otherwise would have. First,involvement in patenting and commercialization activi-ties may detract from the researcher’s time and attentionpaid to scientific research. As researchers become moreinvolved in the patenting process, and spends time locat-ing licensees for their patents or working with thelicensee to transfer the technology, time spent doingresearch may be compromised. The analysis here can-not explore the effect of licensing or commercializationactivities directly because we do not have data on theseactivities. However, these activities are likely to bepositively correlated with patenting, and therefore therelationship between patenting and publishing may beconfounded by the influences of licensing and commer-cialization activities.
Second, patenting and licensing changes the incen-tives faced by the faculty members. According to thetraditional norms of academic promotion, faculty mem-bers are rewarded for novel, fundamental discoveriesgenerated and openly published in the scientific lit-erature. The possibility to license-patented researchprovides an incentive for researchers to focus more timeon research projects with more commercial potential.This may encourage a shift of resources away from fun-damental research and toward commercially orientedresearch at the expense of more basic, fundamental, andpublishable research projects.
Third, growing awareness and attention paid to intel-lectual property concerns may make researchers moreinclined to secrecy, and less willing to openly share andpublish research results. Thursby and Thursby (2000)

Researc
subject, PhD granting institution, and PhD date. For fac-ulty members that received their MD instead of PhD,we also use the American Medical Association Physi-
11 A similar empirical approach has been taken by Buenstorf (2006),as they considered longitudinal patent and publication data to explorethe effects of patenting, licensing, and commercialization on the pro-ductivity of researchers.12 This was done manually by comparing the address, assignee, and
technology class for all patents potentially attributable to each inventor
918 K.R. Fabrizio, A. Di Minin /
report that more than half of the firms responding totheir survey include delay of publication clauses in atleast 90% of their university contracts. Several surveys(Louis et al., 2001; Blumenthal et al., 1996a,b; Campbellet al., 2002) have found that industry funding, commer-cial goals, and patenting have led researchers to increasesecrecy with regard to research methodology and results.Blumenthal et al. (1996a,b) surveyed companies thatfund life sciences research at universities and found that47% of the respondents reported that their agreementswith universities occasionally require that the univer-sity protect the confidentiality of research results forlonger than is necessary for a patent application. In addi-tion, faculty themselves sometimes delay publication inorder to protect the confidentiality or financial value ofthe results (Blumenthal et al., 1996a,b). This extendsthe desire for secrecy from the research result beingpatented to related results, methodologies, and streams ofresearch.
These reasons combine to form our second hypothe-sis:
Hypothesis 2. The number of publications generatedby a faculty researcher will be lower following the appli-cation for a patent by the researcher.
It may also be the case that the first few patents bya researcher provide many of the positive benefits ofpatenting, such as interactions with industry researchers,while faculty researchers who patent many of theirresearch results may be afflicted with some of the neg-ative influences of patenting, such as limited time orindustry capture. Managing the patenting process for onepatent that happened to come out of research being doneby a researcher is substantially different than altering aresearch trajectory to focus on more patentable researchprojects. We therefore also examine the curvilinear rela-tionship that may exist if the negative influences becomemore important as the number of faculty member patentsincreases:
Hypothesis 3. There is an inverted-U relationshipbetween the cumulative number of patents granted toa researcher and the number of publications by theresearcher.
3. Sample and data
The empirical analysis relies on developing a sam-ple of university researchers that have patented theirresearch results and a corresponding sample of univer-sity researchers that have not patented research results.
h Policy 37 (2008) 914–931
By collecting publication and patent count data for a longtime period, we are able to examine a given researcherover time, as well as compare that researcher with thenon-patenting control sample.11
This analysis requires two data sets: data on patentsfor all faculty members in the inventor sample anddata on publications for all faculty members in boththe inventor and non-inventor (control) samples. Wehave constructed these data sets from existing publicsources, making new use of data sets that have beenexploited for other purposes by combining patenting andpublication data at the individual researcher level withresearcher characteristics. The patent data is collectedusing the NBER patent databases (Hall et al., 2001).Using information on the inventors and assignees forall U.S. utility patents applied for between 1975 and1995, we create a panel data set of patent information foreach inventor in our sample. Because the inventor namedata field in this database is uncleaned, data construc-tion requires manually searching the inventor databaseto identify all permutations (i.e. various abbreviationsand misspellings) of a given name that were truly thesame inventor and exclude others with similar or identi-cal names.12 For each inventorsample faculty member,we assembled a panel data set of the number of successfuluniversity-assigned, unassigned, and industry-assignedpatents applied for in each year. For each inventor andcontrol sample member, we construct a data set contain-ing the number of publications in each year from theScience Citation Index.13
For each member of the inventor and control sample,we also collect data on their field, current institution, theyear in which they received their PhD, and the degreegranting institution. The first two of these data items arecollected from web searches. The PhD date and institu-tion come primarily from the UMI International DigitalDissertations database, which includes records of dis-sertations filed since 1861, including author name, title,
and excluding those patents that did not fit the profile of the inventorin the sample. A similar method, automated for application to a muchlarger sample, is described by Trajtenberg (2005).13 The source we used is the ISI Web of Knowledge online at
http://isi3.isiknowledge.com/portal.cgi/wos.

Researc
cmmww
3
rpaedWc
taautasAottmhtci1ro
iTrsasIoomoe
neb
K.R. Fabrizio, A. Di Minin /
ian Select, which provides biographical information onembers of the medical profession. Finally, for facultyembers who do not appear in either of these databases,e relied on information from their web page or othereb-based information.
.1. Faculty inventor sample
Our goal for the inventor sample is for the sample toepresent the fields in which university researchers areatenting and not limit our sample to researchers at one orfew universities. This allows for a broad, but unbiased,xploration of patenting behavior. We begin with a ran-om sample of inventors on university-assigned patents.e then verify that they are indeed faculty members, and
ollect the necessary data for each.We draw the sample of university inventors from
he NBER database of patents and inventors (Hall etl., 2001). For the 23,930 university-assigned patentspplied for between 1975 and 1995, there are 26,880nique first name–last name combinations for inven-ors listed. Of these, there are 11,642 unique names thatppear as the first inventor on the patent.14 A randomample of 400 of these 11,642 inventors was selected.
closer examination of these names yielded a samplef 384 that were truly unique. Based on web searches ofhe inventor name and assignee institution, we attemptedo locate the inventor, confirm that he or she is a faculty
ember, and collect information on date of PhD, positioneld, gender, and departmental affiliation of the inven-or. Of these 384, 230 faculty inventors were found andonfirmed as faculty.15 Others were not found, work-ng in industry, non-faculty, retired or deceased prior to
995, or located outside the U.S. For each of the 230emaining inventor sample members, we collect datan publications and citations and PhD date. A common14 We found that it was much easier to locate information on the firstnventors, which is why we use this in the selection of the sample.his may introduce some bias. It is possible that being first on a patent
epresents heading up the team of inventors, and so may also indicateome success in research. However, in some fields the lab directorppears last on the patent. Correspondence with university inventors ineveral fields indicate that the meaning of first inventor varies by field.t is true that university inventors who ever appear as the first inventorn a patent are, on average, inventors on more patents. For this reason,ur sample can be seen as composed on university researchers who areore heavily involved in patenting. This may limit the generalizability
f our results. However, for the goal of evaluating potential negativeffects of patenting activity, if may be the most appropriate sample.15 Although manually verifying each inventor is time consuming andecessitates a limited sample size, the alternative pursued by Azoulayt al. (2004) is to drop individuals who seem to drop out of academiaased on their publication record.
h Policy 37 (2008) 914–931 919
name prevented collection of publication data for 39 ofthese people, and no PhD date information was availablefor 25 of them.
3.2. Control sample
For each of the 166 remaining inventors in the sam-ple, we select the faculty member currently in thesame department at the same institution with the clos-est PhD date that IS NOT recorded as an inventor on anyU.S. patents.16 Similar matching between inventors andnon-inventors has been used in other empirical investi-gators. Two studies replicate the already cited study by(Agrawal and Henderson, 2002) in two European institu-tions: Buenstorf (2006) compares publication behaviorof inventor and non-inventor Directors of the Max PlantInstitutes in Germany, while Looy et al. (2005) focuson the K.U. Leuven in Belgium. A more similar cross-institutional analysis is attempted in Breschi et al. (2005),where the authors look at the entire population of patent-ing faculty from Italian universities, matching them withnon-inventors from the same disciplinary fields. Each ofthese three studies construct their control groups match-ing inventors with non-inventors belonging to the samedisciplinary fields and with similar PhD years.
For each control member, we also collected infor-mation on publications and PhD date. For eight of theinventors, no acceptable match was available, and foreight of the control members, a common name pre-vented collection of publication data. In order to maintainour matched sample, dropping these control membersrequired also excluding the inventor match from the anal-ysis. This left us with a sample of 300 total researchers,evenly split between inventors and non-inventors.
By matching the control sample based on insti-
tution and department, we approximate a qualitymatch as closely as possible.17 In addition, by match-ing at the institution level, the inventor and controlsample members are operating under the same institu-16 For each faculty member selected for the control sample, a searchwas done on the U.S. Patent and Trademark Office (USPTO) websitefor matching inventors. If any inventors were found that could reason-ably be judged to match the faculty member in question, based on nameand location, a different member of the same department at the sameinstitution was selected for the control sample. We also matched thefaculty members based on position (i.e. Professor, Associate Professor,etc.).17 This method of matched sample development is similar to that
used, for example, by Trajtenberg et al. (1997) to match university andcorporate patents, by Almeida (1996) to match the patents of foreignand U.S. firms, and by Remafedi et al. (1998) to match bisexual andhomosexual high school students.

Research Policy 37 (2008) 914–931
Table 1Summary of inventor and control sample, 1975–1995
Inventors Non-inventors
Number 150 150Mean PhD date 1973 1973Percentage in:
Mechanical Engineering (%) 7 7Computer Science/Electrical
Engineering (%)11 11
Medical (%) 31 31Chemistry (%) 12 12Biomedical/Genetics/
Microbiology (%)17 17
Chemical Engineering/MaterialsScience (%)
10 10
Physics (%) 2 2Other Science—Plant and Animal
Sciences (%)6 6
Behavioral, Philosophy, CognitiveScience (%)
3 3
Percentage that are:Professors (%) 75 76Assoc. Professors (%) 11 13Assistant Professors (%) 0 1
150 faculty inventors hold only one patent), while a fewinventors hold many patents (five faculty inventors hold50 patents or more, while only one holds more than 100
920 K.R. Fabrizio, A. Di Minin /
tional environment. As Owen-Smith and Powell (2001)describe, institutional characteristics strongly influencethe propensity of faculty members to patent. Matchingon the PhD date allows approximate cohort matching.Additional criteria for matching based on characteris-tics indicating research quality, such as grant moniesreceived, would be desirable as well, but such data wasnot available in this case.
Although the analysis below uses researcher levelfixed effects to control for time-invariant heterogene-ity across individuals and controls for the average lifecycle pattern of publications, the control sample is use-ful as a comparison group. Since all faculty members inthe inventor sample do patent at some point during their(observed) careers, their publication activity in the lateryears of their careers may be affected by the patenting.Therefore, the average life cycle pattern described by thepublication activity of the inventor sample alone may beaffected by patenting, and thus may not be an adequatecontrol for the actual life cycle pattern. For example, ifwe were to only examine the inventor faculty members,and if patenting is associated with a subsequent drop inpublication production, the life cycle effects will be bias(downward) in the later years and will pick up the dropin publications as part of the “natural” life cycle of fac-ulty members. Likewise, if patenting is associated witha subsequent increase in publications, the increase willappear to be part of the common life cycle. In either case,the coefficients on the patenting variable will be biasedtoward zero. Therefore, we use the control sample in theanalysis, and include estimates using only the inventorsample for comparison.
4. Summary statistics
By constructing the non-inventor control sample tobe as similar as possible (along observable dimensions)to the inventor sample, we arrive at a well-matched pairof samples. The comparative summary statistics for thecontrol and inventor sample are reported in Table 1.There may be some remaining concern that faculty mem-bers engaged in patenting during their career may bedoing inherently different work than the faculty membersthat never patent, resulting in unobserved heterogene-ity across researchers in the sample. In the analysisbelow, we control for unobserved heterogeneity usingresearcher-level fixed effects.
We limit our observations to the year of and all years
following the PhD date of each sample member. Thisresults in 5461 observations at the researcher-year level.For the 1975–1995 sample period, our data covers 1545patents by inventor sample inventors, 1184 of which areProfessors Emeritus (%) 9 7Research Professors (%) 5 4
university-assigned, 274 are assigned to corporate enti-ties, and 87 are unassigned. A histogram of the number ofpatents held by the faculty inventors in our sample is dis-played in Fig. 1 and the summary statistics of the numberof patent by type of assignee are reported in Table 2. Thedistribution of the number of patents from 1975 to 1995is highly skewed toward one or a few patents (18 of the
Fig. 1. Histogram of total patents per inventor.

K.R. Fabrizio, A. Di Minin / Research Policy 37 (2008) 914–931 921
Table 2Summary statistics of total patents per faculty inventor by type
Minimum Maximum Mean S.D.
University patents 1 117 7.9 12.6Industry patents 0 58 2.0 5.8Unassigned patents 0 25 0.6 2.4All patents 1 118 10.5 15.4
F
pbfonc
pstulttstthg
ihD
Hs
ig. 2. Number of sample inventor faculty patents by assignee type.
atents).18 Over the 1975–1995 period, the average num-er of university patents per year per inventor increasedrom about two to greater than three, while the numberf industry-assigned patents increased slightly and theumber of unassigned patents remained approximatelyonstant (see Fig. 2).
For the 1975–1995 period, our data cover 17,063ublications for members of the inventor and controlample. Fig. 3 displays a histogram of the number ofotal publications during this period held by sample fac-lty member. Although the distribution is skewed to theeft, it is flatter and has more mass at the higher valueshan the histogram of patents above.19 Table 3 provideshe annual and total summary statistics for the entireample and by inventor status. A difference of meansest for the number of publications per year for inven-
ors and non-inventors suggests that those researchersolding a patent applied for between 1975 and 1995enerate significantly more publications per year than18 The faculty member that holds more than 100 patents is a professorn the biochemistry department at the University of Wisconsin. Heolds 28 patents that were applied for prior to the passage of the Bayh-ole Act.
19 This is consistent with the data summary reported by Agrawal andenderson (2002), although the distribution of publications in their
ample is noticeably flatter.
Fig. 3. Histogram of total publications per researcher.
non-inventors.20 Table 5 provides summary statistics forthe variables used in the analysis, for the full sample aswell as for the inventor and non-inventor subsamples.
5. Empirical analysis and results
With this data, we are able to test the competinghypotheses described above. Before assessing withinfaculty member changes in publications, it is interest-ing to briefly explore the differences across facultymembers. Simple correlation coefficients across all sam-ple members tell the basic story. There are significantpositive correlations between publications and laggedpublications, patents and lagged patents, publicationsand lagged patents, and patents and lagged publications(see Table 4). This suggests that in the cross-section,researchers with more patents also have more publica-tions. In order to control for life cycle, field, and yeareffects, we investigate the relationship with regressionanalysis. Due to the count nature of the publication data,we employ a negative binomial specification.21 A nega-tive binomial regression of the form:
E(Publicationsi,t|InventorID, YearsSincePhD, Field, Year)
= exp{β1YearsSincePhDi,t + β2InventorIDi
+∑
fγf Fieldf +
∑tαtFieldf Yeart} (1)
20 Non-inventors publish on average 2.24 publications per year whileinventors publish on average 3.99 publications per year. The differenceis significant at the 1% level.21 We first ran a Poisson specification, but a test for over dispersion
rejected the constraint of the Poisson model at the 1% level, suggestingthe need for the negative binomial specification.

922 K.R. Fabrizio, A. Di Minin / Research Policy 37 (2008) 914–931
Table 3Patent and publication summary statistics for inventors and non-inventors
Inventors Non-inventors All
Mean S.D. Mean S.D. Mean S.D.
Annual publications 3.99 5.18 2.24 2.96 3.12 4.32Annual patents 0.56 1.55 0 0 0.28 1.14Total publications 79.93 84.78 43.71 47.72 62.00 71.30Total patents 11.02 16.21 0 0 5.57 12.77
Table 4Correlations of current and lagged publications and patents
Pubt Pubt−1 Pubt−2 Pubt−3 Patst Patst−1 Patst−2 Patst−3
Pubt 1Pubt−1 0.78 1Pubt−2 0.77 0.78 1Pubt−3 0.72 0.78 0.78 1Patst 0.30 0.30 0.28 0.30 1
0.300.310.31
Patst−1 0.30 0.32 0.31Patst−2 0.28 0.29 0.31Patst−3 0.26 0.28 0.28
describes a reduced form of the observable determi-nants of publications in a year, where Publicationsi,t isthe number of publications in year t for researcher i,InventorIDi is a dummy variable equal to one in all yearsfor researchers that are ever listed as an inventor on apatent, YearsSincePhDi,t is equal to the number yearssince the PhD date for faculty person i in year t, Fieldi isa dummy variable equal to 1 for faculty members in fieldf, and Fieldf Yeart is a field-year dummy variable equalto one for observations of faculty members in field f inyear t.22 This interaction variable allows the year effectsto vary by field.
Results of this pooled analysis are reported inTable 6.23 As one would expect, the number of pub-lications per year increases with the years since aresearcher’s PhD date, but at a decreasing rate over
time.24 Confirming the difference in means reportedabove, inventor sample faculty members generate,on average, significantly more publications per year.22 The fields of discipline for faculty in our sample areMechanical Engineering, Computer Science/Electrical Engineering,Medical, Chemistry, Biomedical/Genetics/Microbiology, ChemicalEngineering/Materials Science, Physics, Other Science, and Behav-ioral/Philosophy/Cognitive Science. Note that the matching for thecontrol sample was done on much more detailed fields, such as geneticsor inorganic chemistry.23 Robust standard errors, clustered by individual, are reported, allow-
ing for correlation across the observations for each individual.24 This is consistent with the findings of Levin and Stephan (1991)
with respect to the publication life cycle of academic researchers.
0.59 10.52 0.59 10.41 0.49 0.57 1
Even when controls for recent publication activity areincluded, as in column (2), faculty members that are everinventors on a patent generate more publications. Theseresults suggest that the inventors in our sample are moreprolific in terms of annual publications, to the order of25–70% more publications, than their non-inventor col-leagues, consistent with the results of Meyer (2006).25
These pooled results suggest that there are some con-sistent differences across faculty members in the sample.In the following analyses, we control for the time-invariant difference between researchers with researcherlevel fixed effects, estimating the relationship betweenchanges in a researcher’s annual publications and variousmeasures of that researcher’s patenting activity, control-ling for field, year, and the overall career pattern ofpublication activity.
5.1. Relationship between patenting and publishingactivity
In this section, we examine the evidence with respect
to whether publication and patenting are complementsor substitutes for individual faculty members. The condi-tional mean of the negative binomial publication function25 A model allowing for self-selection into being an inventor, pre-dicting inventorship using the number of patents held by the facultymembers’ degree granting institution, the first year in which the grad-uate degree granting institution employed 0.5 full time employees in atechnology transfer office, and the prior patents of the faculty members’current institution, yields a consistent result.

K.R. Fabrizio, A. Di Minin / Research Policy 37 (2008) 914–931 923
Table 5Summary statistics for full sample, inventor sample, and non-inventor sample
Full sample Inventors Non-inventors
Mean S.D. Mean S.D. Mean S.D.
Annual publications 3.12 4.32 3.99 5.18 2.24 2.96#Cites/publication 31.07 118.32 34.92 109.33 27.13 126.73Cumulative publication 28.75 46.24 36.57 56.57 20.78 30.49Annual patents 0.28 1.13 0.56 1.54 0 0Annual university patents 0.22 0.98 0.43 1.35 0 0Annual industry patents 0.05 0.41 0.10 0.58 0 0Annual unassigned patents 0.02 0.18 0.03 0.25 0 0Cumulative #patents 0.34 1.27 0.67 1.72 0 0Years since PhD 14.62 9.42 14.87 9.54 14.37 9.29
Table 6Inventor and non-inventor faculty publications, pooled results
(1) (2)
Inventor ID 0.539 (0.099)** 0.226 (0.049)**YearsSincePhD 0.109 (0.013)** 0.028 (0.009)**YearsSincePhD2 −0.002 (0.000)** −0.001 (0.000)**#pubst−1 0.073 (0.006)**#pubst−2 0.056 (0.007)**#pubst−3 0.025 (0.007)**Constant −0.055 (0.347) 0.223 (0.310)
Observations 5461 4561
Unit of observation is the individual-year for the 1975–1995 period.Dependent variable is the count of the number of publications in year tasa
f
E
wFufmdfitfvfa
qo
nd estimation is performed using a negative binomial model. Robusttandard errors, clustered by individual, in parentheses; **significantt 1%. All equations include field and field-year fixed effects.
or researcher i in year t is
(Pubs|Patents, YearsSincePhD, FEi)
= exp{β1YearsSincePhDi,t + β2PostPati,t} (2)
here YearsSincePhDi,t is the same as above. TheEi are research-level fixed effects, controlling for thenobserved heterogeneity across individuals, such as dif-erences in ability or type of research. This effectivelyakes the estimation one of predicting with researcher
ifferences. We estimate this equation using conditionalxed effects Poisson quasi-maximum likelihood estima-
ion. This functional form is quite flexible and makesew restrictions, while allowing for correlation in the
ariance–covariance matrix to adjust the standard errorsor the possibility of correlation across observations ofgiven individual.2626 For more information on conditional fixed effects Poissonuasi-maximum likelihood estimation, see http://econpapers.repec.rg/software/bocbocode/s456821.htm.
Fig. 4. Trends of pre-patent annual publications for control and inven-tor samples.
This empirical strategy relies on comparing the pre-and post-patenting publication activity of an inven-tor to evaluate whether or not there are significantchanges in publication activity. As in other differences-in-differences work, this methodology relies on a controlsample not affected by patenting, the non-inventor fac-ulty members. In order for this approach to be valid,the pretreatment (here pre-patent) slope of the depen-dent variable must be indistinguishable between thetreatment (inventor) and control sample. Based on agraphical investigation of the annual average numberof patents per researcher in the control and inventorsamples during the pre-patent period, the trends onthe pre-period are the same for the two sets of indi-viduals (see Fig. 4).27 We also test the similarity of
pre-patent trends with a regression of the annual pub-lication count in each pre-patent year on the relevanttime variable (years since publication) and this variable27 We identified the pre-patent year for the control sample based onthe first patent of the matched inventor.

Researc
924 K.R. Fabrizio, A. Di Minin /interacted with an inventor indicator variable, controllingfor year effects, field-year effect, and individual-levelfixed effects. The results indicate that the slope of thenumber of publications generated per year is not signif-icantly different between the inventor and non-inventorsample during the pre-patent years, justifying the use ofthe difference-in-differences approach. The fact that thepatent application(s) of each inventor occurs in a dif-ferent year of his or her career allows us to distinguishbetween temporal shocks and changes associated withpatenting.
We test three specifications of the patenting variable.The first, PostPati,t, is an indicator for all years follow-ing the first patent of an inventor. The coefficient on thisvariable reflects a shift in the average publication pro-duction for the research from pre- to post-first patent. Insome specifications we replace PostPati,t with either avariable equal to the number of patents in the current-year, Patentsi,t, or the cumulative number of patentsheld by the inventor, Cum.Patentsi,t−1, and the square ofthis term. Including the contemporaneous patenting vari-able explores the short-term change in publications bythe researcher. The cumulative number of prior patentsallows an examination of the change in publication activ-ity for faculty members that are repeat patenters.28
As a dependent variable, we employ the number ofpublications in year t by researcher i, Pubsi,j. A z-testfor significance of exp(β2) indicates the significance ofa within-researcher difference in publishing before andafter a patent (or alternatively the significance of con-temporaneous or cumulative impact effects). Inclusionof the non-patenting control sample members improvesthe estimation of the life cycle of publication describedby the years since PhD variables, and also helps estimatethe average year effects.29
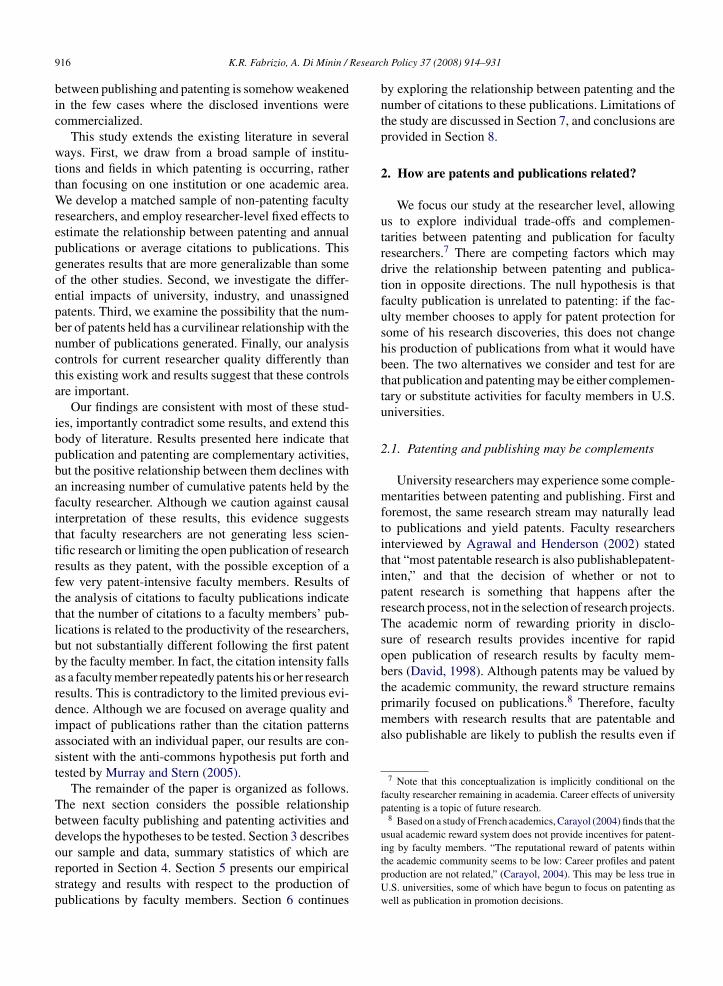
Table 7 reports the results of the researcher fixedeffects estimates for the annual number of publications.In all equations, the life cycle pattern (i.e. the relation-
ship between years since PhD and publications) is thesame as above. In the first equation, the coefficient onPostPati,t is positive and significant, indicating that after28 Note that matching patent and publication data on the time dimen-sion is tricky. We follow Agrawal and Henderson (2002) matchingthe publication year of articles with the application year of patents. Inorder to meet patent requirements, patenting researchers do not wantto publish their research prior to applying for the patent, so the publi-cation date will be contemporaneous with or later than the applicationdate for related research. We evaluate the sensitivity of results to thistiming assumption below.29 Note that for members of the control sample, the patenting variables
are always equal to zero.
h Policy 37 (2008) 914–931
controlling for time-invariant unobserved researchercharacteristics, publications per year are greater fol-lowing a researcher’s first patent by 20%. The secondequation includes the log of the current-year patentsby the researcher, Patentsi,t, the coefficient of which ispositive and significant. Both of these results confirmHypothesis 1 and contradict Hypothesis 2. Eq. (3) reportsthe results using the cumulative count of patents bythe researcher through the prior year, Cum.Patentsi,t−1,and this term squared. The linear term is not signifi-cant, very small in magnitude, and the squared term issmall, negative and significant only at the 6% level.30
This does not provide support for Hypothesis 3 and sug-gest that only in the most extreme cases, in terms ofthe cumulative number of patents, is the relationshipnegative.
In order to make sure that our results are notsensitive to the nature of the control group, we re-estimated Eq. (2) using only the inventors in thesample. The results, reported in column (4) are consis-tent with the results when we use the control sample.Not surprisingly, the magnitude of the coefficient issmaller because all individuals in the inventor sam-ple are “treated” at some point. These results indicatethat the number of publications is not lower, and infact appears to be higher, following a patent by aresearcher.31
One potential concern is that the members of thecontrol sample may be substantially different from theinventors in a way that biases the estimates of the controlvariables, including the life cycle effects. To investi-gate this, we re-estimated the equations allowing thelife cycle profile, as reflected in the years since PhDvariables, to differ from inventors and non-inventorsby including the interactions of these variables with aninventor indicator variable. The results were robust tothis modification. In fact, the interaction variables werenot statistically significant, suggesting that the life cycleprofiles of inventors and non-inventors are not substan-tially different after controlling for all other factors.To address this concern further, we re-estimated these
equations with the sub-sample of inventing faculty (i.e.excluding the control group members entirely). The esti-mates corresponding to Eq. (2) are reported in Eq. (4)30 The same relationship holds when we exclude the outlier with morethan 100 patents during the period.31 We also investigated the possibility of a possible “dip” in publi-
cation production preceding a patent by examining the relationshipbetween publications and several years’ leads and lags of patenting.There is no evidence suggesting any reduction in the number of pub-lications produced in the 3 years prior to or following a patent.
K.R. Fabrizio, A. Di Minin / Research Policy 37 (2008) 914–931 925
Table 7Faculty publications as a function of patenting, fixed effects results
(1) (2) (3) (4) (5)
Post-Patent 0.188 (0.055)**#patentst 0.022 (0.005)** 0.018 (0.005)** 0.016 (0.005)*Cum.Patentst−1 0.007 (0.007)Cum.Patents2
t−1 −0.000 (0.000)#patentst−1 −0.009 (0.008)#patentst−2 −0.002 (0.008)#patentst−3 −0.015 (0.012)#pubst−1 0.023 (0.004)**#pubst−2 0.019 (0.004)**#pubst−3 −0.005 (0.003)YearsSincePhD 0.114 (0.010)** 0.120 (0.010)** 0.118 (0.010)** 0.133 (0.014)** 0.079 (0.010)**YearsSincePhD2 −0.002 (0.000)** −0.002 (0.000)** −0.002 (0.000)** −0.002 (0.000)** −0.001 (0.000)**
Observations 5461 5461 5461 2758 4560
U . DepenE ust stand*
ar
iHtpatrlporttosp
bjImwtoedt
iw
nit of observation is the individual-year for the 1975–1995 periodstimation per-formed using Poisson quasi-maximum likelihood. Rob*significant at 1%. All equations include researcher fixed effects.
nd confirm that the control sample is not biasing theesults.32
The final equation in the table provides a compar-son to the methodology employed by Agrawal andenderson (2002), who do not find a significant rela-
ionship between the number of publications and theast patenting activity of the researchers investigatedt MIT. In order to compare results with our sample toheir analysis, we estimate an equation similar to theesults they report, including the lagged number of pub-ications for each researcher. By including the laggedublications in fixed effects regression of publicationsn patenting, the patenting variable can only pick upemaining variation in the number of current publica-ions that is not related to lagged publications. Includinghis control decreases the magnitude of the coefficient
n the patenting variable, but does not eliminate theignificant positive relationship between patenting andublishing.3332 One concern is that the number of applied research journals maye increasing more over time than the number of theoretical researchournals, and patenting faculty members tend to do more applied work.f this were the case, we would expect to see publications by facultyembers doing applied work (and patenting) increase over time. Thisould not be captured in the year effects, because those capture only
he average year effect for the each field. To account for the possibilityf differing year effects for the inventors and non-inventors, we re-stimated Eqs. (1)–(3) using year effects interacted with an inventorummy equal to one in all years for inventors. Results were robust tohis flexibility.33 Fixed effects analysis with lagged dependent variables may resultn biased estimates of the coefficients, and is especially problematicith count data models (see Blundell et al. (2002) and Wooldridge
dent variable is the count of the number of publications in year t.ard errors, clustered by individual, in parentheses; *significant at 5%;
Although the fixed effect controls for research-levelheterogeneity, this analysis faces the additional chal-lenge that patenting is an endogenous choice by theresearcher. It may be the case that a faculty memberdecides to apply for a patent in a particular year inexpectation of publishing a substantial set of researchin the following year(s). We cannot rule out the possibil-ity that the results reflect a strategic choice regard whena researcher patents their research results. Our resultsmust therefore be interpreted with caution and should beinterpreted as reflecting correlation, not causation.34
5.2. Variation in patents
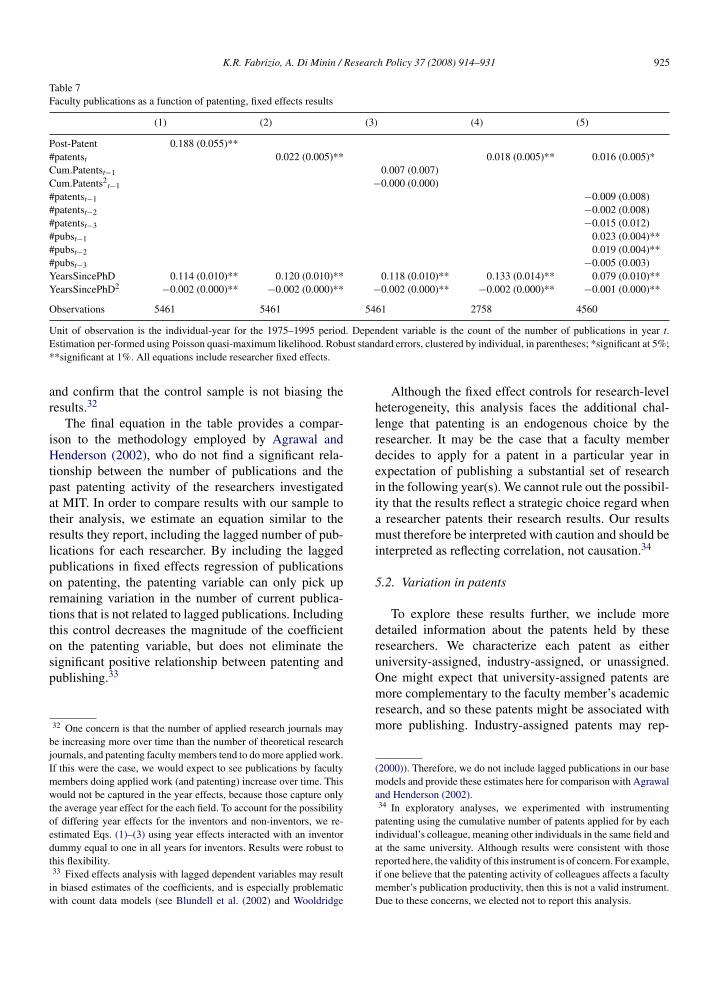
To explore these results further, we include moredetailed information about the patents held by theseresearchers. We characterize each patent as eitheruniversity-assigned, industry-assigned, or unassigned.One might expect that university-assigned patents are
more complementary to the faculty member’s academicresearch, and so these patents might be associated withmore publishing. Industry-assigned patents may rep-(2000)). Therefore, we do not include lagged publications in our basemodels and provide these estimates here for comparison with Agrawaland Henderson (2002).34 In exploratory analyses, we experimented with instrumenting
patenting using the cumulative number of patents applied for by eachindividual’s colleague, meaning other individuals in the same field andat the same university. Although results were consistent with thosereported here, the validity of this instrument is of concern. For example,if one believe that the patenting activity of colleagues affects a facultymember’s publication productivity, then this is not a valid instrument.Due to these concerns, we elected not to report this analysis.
926 K.R. Fabrizio, A. Di Minin / Researc
Table 8Faculty publications as a function of patenting, fixed effects resultswith assignee type
(1) (2)
Post-UniversityPatent 0.162 (0.056)*Post-IndustryPatent 0.029 (0.076)Post-UnassignedPatent −0.103 (0.160)#UniversityPatentst 0.027 (0.006)**#IndustryPatentst −0.027 (0.026)#UnassignedPatentst 0.051 (0.040)YearsSincePhD 0.115 (0.010)** 0.121 (0.011)**YearsSincePhD2 −0.002 (0.000)** −0.002 (0.000)**
Observations 5461 5461
Unit of observation is the individual-year for the 1975–1995 period.Dependent variable is the count of the number of publications in yeart. Estimation performed using Poisson quasi-maximum likelihood.
Robust standard errors, clustered by individual, in parentheses; *sig-nificant at 5%; **significant at 1%. All equations include researcherfixed effects.resent a deviation from traditional academic science,and may be associated with more of a drain on theresearcher’s time, and therefore act as more of a sub-stitute to publications. However, as discussed above,industry-assigned patents by the researcher may also beassociated with more industry interaction, which couldprompt further research questions and may result in morepublications.
We repeated the conditional fixed effects regressionswith these more detailed counts of faculty patents, andresults are reported in Table 8. Eq. (1) includes threedummy variables indicating the post-patent measure foruniversity, industry, and unassigned patents.35 Interest-ingly, the only significant and positive coefficient is onthe university patent variable. In Eq. (2), the variables ofinterest measure the number of patents of each type in thecurrent-year. Again, university patents are the only typewith a positive relationship with current publications.From this analysis, it is apparent that publications donot have the same relationship with all types of patents:university-assigned patents appear to be complementaryto publication activity while industry and unassignedpatents do not demonstrate a significant relationshipwith publications. However, this analysis does have thelimitation that 76% of the patents by inventors in thesample were university-assigned, so the coefficients on
the industry and unassigned patents may be not preciselyestimated.35 Note that these variables differ in a time dimension for a givenresearcher. If that researcher is an inventor on a university-assignedpatent first, and later is an inventor an industry-assigned patent, theindustry patent variable is switched to one at the later time period.
h Policy 37 (2008) 914–931
6. Patenting and publication quality
The results thus far demonstrate that faculty mem-bers who patent their research do not generate fewerpublications after patenting. This discussion above alsohighlighted the possibility that patenting may be asso-ciated with a reallocation of research effort away fromfundamental, basic science to more commercial, appliedresearch projects. We investigate this related concernusing the number of citations to a researchers’ publica-tions as a measure of the impact or quality of the research.High quality, fundamental, basic science will be citedmore in future research because it is foundational, andtherefore is relied upon in follow-on work. On the otherhand, research aimed solely at a commercializable out-come is likely to be of less value to other researchers.If faculty members involved in patenting and commer-cialization activities are in fact changing the focus orcompromising the quality of their research, the followinghypothesis will hold:
Hypothesis 4. The number of citations to a facultymember’s publications will be lower following a patentby the researcher.
In order to test this hypothesis, we collected data onthe number of citations to publications in each year byeach of the sample researchers. For the faculty membersin our sample, this includes 812,996 citations. Our unitof analysis remains the research-year, so the dependentvariable employed is the average number of citationsper publication per year.36 We use the natural log ofthis value, ln(AvgCitesi,t), in the analysis because theskewness of the distribution of the average number ofcites. The general form of the equation to be estimatedis as follows:
ln(AvgCitesi,t)
= β1YearsSincePhDi,t + β2PostPati,t + β3Pubsi,t
+ β4Pubs2i,t +
∑tαtFieldf Yeart + γiFEi + εi,t
(3)
This analysis controls for the number of publications byresearcher i in year t and this value squared. This is partic-ularly appropriate for the citation analysis because (a) the
count of publications will help control for time-varyingresearcher quality and (b) extremely prolific researchers36 This is calculated as the total number of citations received as ofMay, 2003 by publications in that year divided by the number ofpublications made in that year for each researcher.

K.R. Fabrizio, A. Di Minin / Research Policy 37 (2008) 914–931 927
Table 9Inventor and non-inventor faculty average citations, pooled results
(1) (2)
Inventor ID 0.348 (0.113)** −0.023 (0.077)#pubst 0.409 (0.037)**#pubs2
t −0.012 (0.002)**YearsSincePhD 0.094 (0.015)** 0.028 (0.012)*YearsSincePhD2 −0.002 (0.000)** −0.001 (0.000)**Constant 1.376 (0.518)** 1.383 (0.484)**
Observations 5461 5461R-Squared 0.15 0.42
Unit of observation is the individual-year for the 1975–1995 period.Dependent variable is the natural log of the number of publicationsin year t, and estimation is performed using OLS. Robust standarderrors, clustered by individual, in parentheses; *significant at 5%;*e
mpm
fnara(tfaofttc
rsfiooo(ccnprtol
rpu
blic
atio
nsas
afu
nctio
nof
pate
ntin
g,fix
edef
fect
sre
sults
(1)
(2)
(3)
(4)
(5)
(6)
0.13
1(0
.094
)−0
.016
(0.0
81)
0.03
5(0
.014
)**
0.01
1(0
.021
)s t
−1−0
.004
(0.0
06)
−0.0
21(0
.008
)**
0.36
2(0
.038
)**
0.36
2(0
.038
)**
0.36
7(0
.036
)**
−0.0
10(0
.002
)**
−0.0
10(0
.002
)**
−0.0
11(0
.002
)**
hD0.
092
(0.0
51)
0.09
4(0
.051
)0.
096
(0.0
52)
0.05
3(0
.044
)0.
052
(0.0
43)
0.05
3(0
.043
)hD
2−0
.003
(0.0
00)*
*−0
.003
(0.0
00)*
*−0
.003
(0.0
00)*
*−0
.002
(0.0
00)*
*−0
.002
(0.0
00)*
*−0
.002
(0.0
00)*
*1.
424
(0.4
80)*
*1.
413
(0.4
61)*
*1.
410
(0.4
86)*
*0.
973
(0.4
05)*
0.98
0(0
.405
)**
0.98
2(0
.385
)*
s54
6154
6154
6154
6154
6154
610.
070.
100.
100.
370.
370.
37
rvat
ion
isth
ein
divi
dual
-yea
rfo
rth
e19
75–1
995
peri
od.D
epen
dent
vari
able
isth
elo
gof
the
aver
age
num
ber
ofci
tatio
nsre
ceiv
edby
publ
icat
ions
inye
art.
Est
imat
ion
met
hod
isO
LS.
dard
erro
rs,c
lust
ered
byin
divi
dual
inpa
rent
hese
s;*s
igni
fican
tat5
%;*
*sig
nific
anta
t1%
.All
equa
tions
incl
ude
rese
arch
erfix
edef
fect
s.
*significant at 1%. All equations include field and field-year fixedffects.
ay contribute less value added with each additionalublication, and therefore each incremental publicationsay be cited less.Before estimating the fixed effects model, it is use-
ul to briefly examine differences across patenting andon-patenting faculty members in terms of the aver-ge number of citations received. Estimates of pooledegressions are reported in Table 9. Although on aver-ge inventors’ publications are cited more heavily (Eq.1)), this does not hold once the publication activity ofhe faculty member is controlled for. Including controlsor the current publication production of the researcher,reasonable proxy for researcher quality, the number
f citations received by inventors is not distinguishablerom the number received by non-inventors. Note thathe expected curvilinear relationship between publica-ions and average number of citations per publication isonfirmed.
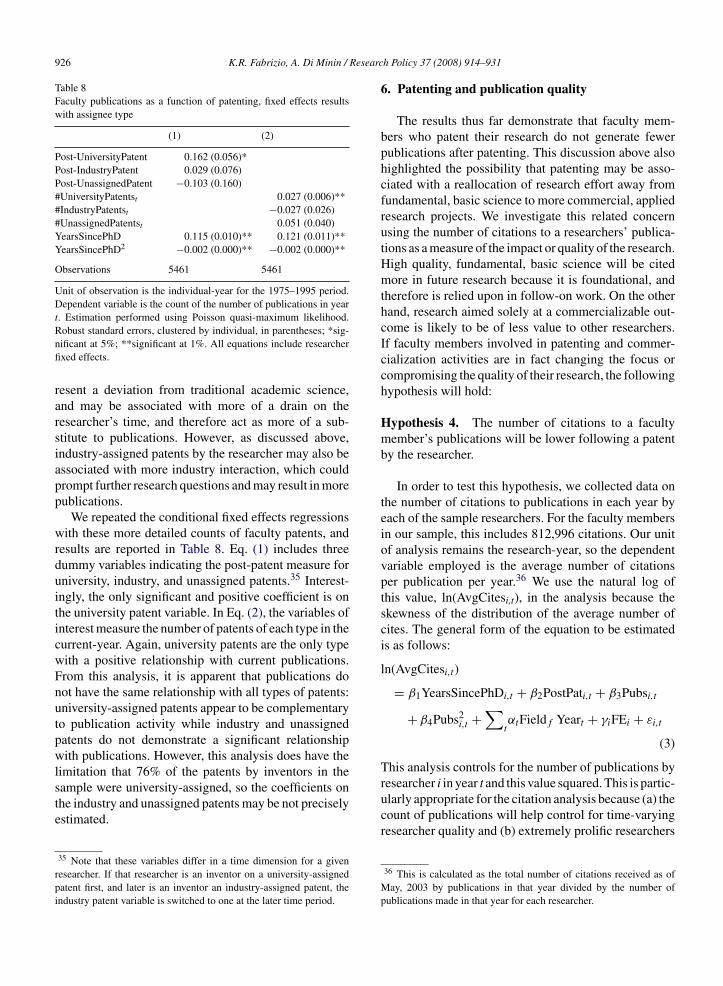
Results including researcher level fixed effects areeported in Table 10. We again consider three mea-ure of relevant patenting activity: before and after therst patent for an inventor (PostPati,t), contemporane-us patenting (#patentsi,j), and the cumulative numberf patents by the inventor (Cum.Patentsi,j). For eachf the three, we estimate the equation with (Columns4)–(6)) and without (Columns (1)–(3)) controls forurrent publication activity. Without the controls forurrent publications, there is evidence of a greaterumber of citations to publications in the year of aatent application (column 2). Once controls for the cur-
ent publication activity are included (Columns (4)–(6))he positive association between the average numberf citations received and concurrent patenting is noonger significant and there is no significant change Table
10C
itatio
nspe
Post
Pat
#pat
ents
t
Cum
.Pat
ent
#pub
s t#p
ubs2 t
Yea
rsSi
nceP
Yea
rsSi
nceP
Con
stan
t
Obs
erva
tion
R-S
quar
ed
Uni
tof
obse
Rob
usts
tan

928 K.R. Fabrizio, A. Di Minin / Research Policy 37 (2008) 914–931
Table 11Comparison to Agrawal & Henderson results for citations per publication
Cum.Cites (1) Cum.Cites (2) Cites/Pub (3) Cites/Pub (4)
Deprec.Cum.Pubst 0.005 (0.000)** −0.000 (0.000)Deprec.Cum.Patentst 0.021 (0.008)** −0.044 (0.010)**#pubst 0.096 (0.002)** 0.139 (0.017)**#patentst 0.030 (0.013)* 0.008 (0.012)#patentst−1 −0.045 (0.025) −0.053 (0.025)*#patentst−2 0.012 (0.018) 0.001 (0.022)#patentst−3 −0.060 (0.016)** −0.055 (0.022)*#pubst−1 0.020 (0.006)** −0.016 (0.009)#pubst−2 0.005 (0.006) −0.028 (0.007)**#pubst−3 −0.004 (0.006) −0.009 (0.007)YearsSincePhD 0.134 (0.005)** 0.113 (0.005)** 0.108 (0.015)** 0.091 (0.015)**YearsSincePhD2 −0.003 (0.000)** −0.003 (0.000)** −0.003 (0.000)** −0.002 (0.000)**Constant −1.412 (0.042)** −1.300 (0.042)** 1.446 (0.135)** 1.383 (0.132)**
Observations 5461 5461 4561 4561
Unit of observation is the individual-year for the 1975–1995 period. Dependent variable in (1) and (2) is the log of the depreciated cumulative countof citation to publications through year t. Estimation method is negative binomial. Dependent variable in (3) and (4) is the log of the average number
OLS. Ser fixed
of citations received by publications in year t. Estimation method is*significant at 5%; **significant at 1%. All equations include research
in average number of citations received following aninventor’s first patent (Eq. (3)). However, the cumulativenumber of patents by the faculty members is signifi-cantly and negatively related to the number of citationsreceived.
Therefore, the results testing Hypothesis 4 are mixed.The evidence suggests that there is no average changein citation intensity following an inventor’s first patent.However, if a researcher patents repeatedly, then theaverage citation intensity is lower, suggesting a possi-ble decline in research quality or impact. These resultsare contradictory to those reported in Agrawal andHenderson (2002). In their analysis of citations to pub-lications, those authors regress the depreciated stockof citations on the depreciated stock of papers and thedepreciated stock of patents.37 They find a positive coef-ficient on this measure of patenting activity. Eq. (1) inTable 11 provides a comparable analysis with our dataset. The coefficient on the depreciated stock of patents ispositive and significant, in agreement with Agrawal andHenderson’s results. However, further analysis suggeststhat this result is not robust to controlling for currentpublication activity. Eq. (2) includes the current-year
publications of the researcher. With this control, the evi-dence suggests a negative and significant relationshipbetween the depreciated stock of patents and depreci-37 Agrawal and Henderson use a 20% annual depreciation rate, andinclude citations, papers, and patents through the current year. We dothe same here.
tandard errors in parentheses, clustered by individual in (3) and (4);effects.
ated stock of paper citations, consistent with the resultsreported above.
Eqs. (3) and (4) examine this further using theaverage citations for the dependent variable andexamining the relationship to several lags of patentsand publications by the researcher. Recent and currentcounts of publications are highly correlated with averagecitations to current publications, perhaps reflecting therecent quality of the researcher, but current patentsare not significant. This suggests that the citation ofcurrent publications may be more related to recentpublication activity than to patenting. In addition, thereis some evidence that during the years following apatent application, the average number of citations to afaculty member’s publications falls (Eq. (4)).
7. Limitations
This empirical analysis attempts to make inferencesabout the factors influencing the publication behav-ior of faculty members over time. There are no doubtunobserved factors influencing both publishing andpatenting for these individuals. We have attempted toprovide analyses robust to these concerns by usingresearcher level fixed effects to control for unob-served heterogeneity across researchers, exploratory
analysis using instrumental variables to instrument theendogenous decision to patenting, and confirming therobustness of the results to limiting the analysis to thesub-sample of faculty inventors. However, we caution
Researc
aotis
8
btuaautrfir
pifasesfauapwasf
sdpristpptcpvta
K.R. Fabrizio, A. Di Minin /
gainst attributing strong causality to the results. With-ut further analysis of the mechanisms underpinninghe noted increased in publication production follow-ng patenting, the reasons for such an increase remainpeculative.
. Conclusion
The Bayh-Dole Act and increasing collaborationetween industry and university researchers have servedo dramatically increase patenting by university fac-lty members. As patenting has grown, so has concernbout the possible negative effects on the generationnd publication of fundamental research results by fac-lty members. How the change in norms has impactedhe open publication and use of university researchesults is a matter of concern for policy makers andrm managers in need of accessing university researchesults.
This research contributes to the existing literature byroviding an empirical investigation of faculty patent-ng and publishing with a data set containing inventorsrom multiple fields at many institutions in many fieldscross many years. Our results confirm the results inome existing work, contradict others, and extend thexisting literature. The results presented here are not con-istent with the concern that the publication activity ofaculty researchers would fall with increasing patentingctivity. The annual number of publications by a fac-lty member is in fact higher following application forsuccessful patent, controlling for field, year, and timerofile of publications by matched non-inventors. Again,e stress that this should be interpreted as a correlation,
s we cannot test or assert causation from this analy-is. This result is consistent with other recent studies ofaculty patenting.
Interestingly, results here demonstrate that univer-ity patents (and not corporate or unassigned patents)rive the positive relationship. This suggests that theositive relationship is not attributable to academicesearchers gaining new insights and ideas from work-ng with industry researchers. If that were the case, wehould expect to see at least an equal positive rela-ionship between industry-assigned patents and facultyublications. Since the same research often underliesublications and patents, this result may indicate thathe research embodied in university-assigned patents isloser to academic research, which yields subsequent
ublications. The results may also be driven by uni-ersity technology licensing offices electing to patenthe most promising research results, which are alsossociated with more publications, and passing on lessh Policy 37 (2008) 914–931 929
promising results, which are then either patented with-out an assignee or picked up by a corporation thatappears as the assignee on the granted patent. Furtherresearch into the mechanisms responsible for the differ-ences across types of patents is needed to examine thesepossibilities.
The relationship between patenting and citations topublications suggests that there is not a large-scale shiftto lower quality or less impactful research followingan inventor’s first patent. However, faculty membersthat repeatedly patent their research results generatepublications that receive fewer citations. This may bean indication that these faculty members are in factre-focusing their research on more applied or com-mercializable research, at the expense of fundamentalscience. It may also be a result of increasing intellec-tual property rights inhibiting the use of their publishedresearch results in follow-on studies. This evidence iscontradictory to the limited prior evidence concern-ing the relationship between patenting and the qualityor impact of faculty publications, but is consistentwith the results of Murray and Stern (2005), whopresent an analysis of matched publication and patentscovering the same research result. Their results sug-gest that citations to papers decrease when a patentrelated to the same research is granted. This is con-sistent with the interpretation that increasing patentprotection to a faculty member’s research results isassociated with fewer citations to that individual’spublications.
Comparing these results with Agrawal and Henderson(2002) suggests that the relationship between facultypatenting and publishing may be different for facultymembers in general than it is for faculty at elite institu-tions, such as MIT. Perhaps one reason is that patenting,licensing, and commercialization activities may allow afaculty member access to more industry funding. MITfaculty may not be as constrained by limited funding asresearchers at other schools, and they therefore benefitless from added access to funding. There are likely tobe other institutional differences driving the variation inresults as well. In a comparison between Stanford andBerkeley Electrical Engineering and Computer Sciencedepartments, Kenney and Goe (2003) find that a differ-ent attitude towards commercialization partially explainsthe more intense technology transfer activities at Stan-ford. In Europe, Debackere and Veugelers (2005) findconvincing evidence that universities allocating a higher
percentage of royalties to inventors are more effec-tive in technology transfer activities. Further researchwill consider the alternative explanations for the notedincrease in publications following a patent application,
Researc
930 K.R. Fabrizio, A. Di Minin /as well as an evaluation of possible differences acrossinstitutions of varying quality. Based on the evidencepresented here, increasing faculty members’ incentivesto patent research results does not seem to be overwhelm-ing the incentives for faculty members to publish theirresearch.
References
Adams, J., Black, J., Stephan, P., 2005. Scientific teams and institu-tional collaborations: evidence from U.S. universities. ResearchPolicy 34 (3), 253–257.
Agrawal, A., Henderson, R., 2002. Putting patents in context: explor-ing knowledge transfer from MIT. Management Science 48 (1),44–60.
Almeida, P., 1996. Knowledge sourcing by foreign multinationals:patent citation analysis in the U.S. semiconductor industry. Strate-gic Management Journal 17, 155–165.
Argyres, N.S., Leibeskind, J.P., 1998. Privatizing the intellectual com-mons: universities and the commercialization of biotechnology.Journal of Economic Behavior & Organization 35, 427–454.
Azoulay, P., Ding, W., Stuart, T., 2004. The impact of academic patent-ing on (public) research output. Working Paper.
Blumenthal, D., Campbell, E., Anderson, M., Causino, N., Louis, K.,1996a. Withholding research results in academic lifescience: evi-dence from a national survey of faculty. Journal of The AmericanMedical Association 277 (15), 1224–1228.
Blumenthal, D., Causino, N., Campbell, E., Seashore, K., 1996b.Relationships between academic institutions and industry in thelife sciences—an industry survey. The New England Journal ofMedicine 334 (6), 368–373.
Blundell, R., Griffith, R., Windmeijer, F., 2002. Individual effects anddynamics in count data models. Journal of Econometrics 108,113–131.
Breschi, S., Lissoni, F., Montobbio, F., 2005. The Scientific Produc-tivity of Academic Inventors. Bacconi University, Mimeo.
Buenstorf, G., 2006. Commercializing Basic Science as a Competitoror Complement of Academic Accomplishment? The Case of MaxPlanck Directors. Max Plan Institute of Economics, Mimeo.
Campbell, E.G., Clarridge, B.R., Gokhale, M., Birenbaum, L., Hilgart-ner, S., Holtzman, N.A., Blumenthal, D., 2002. Data withholding inacademic genetics. Journal of The American Medical Association287 (4), 473–480.
Carayol, N., 2004. Academic incentives and research organization forpatenting at a large French university. Working Paper.
Cohen, W.M., Nelson, R.R., Walsh, J.P., 2002. Links and impacts:the influence of public research on industrial R&D. ManagementScience 48 (1), 1–23.
Dasgupta, P., David, P.A., 1994. Toward a new economics of science.Research Policy 23, 487–521.
David, P.A., 1998. Common agency contracting and the emergence of“open science” institutions. The American Economic Review 88(2), 15–21.
David, P., Mowery, D.C., Steinmueller, W.E., 1992. Analysing the eco-
nomic payoffs from basic research. Economics of Innovation andNew Technology 2, 73–90.Debackere, K., Veugelers, R., 2005. The role of academic technol-ogy transfer organizational in improving industry science links.Research Policy 34 (3), 321–342.
h Policy 37 (2008) 914–931
Feller, I., 1990. Universities as engines of R&D-based economicgrowth: they think they can. Research Policy 19, 335–348.
Hall, B., Jaffe, A., Trajtenberg, M., 2001. The NBER patent cita-tion data file: lessons, insights and methodological tools. NBERWorking Paper (8498).
Henderson, R., Jaffe, A., Trajtenberg, M., 1998a. Universities as asource of commercial technology: a detailed analysis of universitypatenting, 1965–1988. Review of Economics and Statistics 80 (1),119–127.
Henderson, R., Jaffe, A., Trajtenberg, M., 1998b. University patent-ing amid changing incentives for commercialization. In: Navaretti(Ed.), Creation and Transfer of Knowledge. Institutions and Incen-tives.
Jaffe, A., 2000. The U.S. patent system in transition: policy innovationand the innovation process. Research Policy 29, 531.
Kenney, M., Goe, W., 2003. The role of social embeddedness in profes-sorial entrepreneurship: a comparison of electrical engineering andcomputer science at UC Berkeley and Stanford. Research Policy33 (3), 691–707.
Levin, S.G., Stephan, P.E., 1991. Research productivity over the lifecycle: evidence for academic scientists. The American EconomicReview 81 (1), 114–132.
Looy, B.V., Callaert, J., Debackere, K., 2005. Publication and PatentBehavior of Academic Researchers: Conflicting, Reinforcing orMerely Co-existing? K.U. Lueven, Mimeo and Belgium.
Louis, K., Jones, L., Anderson, M., Blumenthal, D., Campbell, E.,2001. Entrepreneurship, secrecy, and productivity: a comparisonof clinical and non-clinical faculty. Journal of Technology Transfer26 (3), 233–245.
Mansfield, E., 1991. Academic research and industrial innovation.Research Policy 20, 1–12.
Mansfield, E., 1995. Academic research underlying industrial inno-vations: sources, characteristics, and financing. The Review ofEconomics and Statistics 77, 55–65.
Mansfield, E., 1998. Academic research and industrial innovation: anupdate of empirical findings. Research Policy 26, 773–776.
Meyer, M., 2006. Are patenting scientists the better scholars? Anexploratory comparison of inventorauthors with the non-inventingpeers in nano-science and technology. Research Policy 35,1646–1662.
Mowery, D.C., Ziedonis, A.A., 2001. Numbers, quality, and entry:how has the Bayh-Dole Act effected U.S. university patentingand licensing? In: Jaffe, A.B., Lerner, J., Stern, S. (Eds.), Inno-vation Policy and the Economy 1. The MIT Press, Cambridge,Massachusetts, pp. 187–220.
Murray, F., Stern, S., 2005. Do formal intellectual property rights hin-der the free flow of scientific knowledge? NBER Working Paper11465.
Narin, F., Hamilton, K.S., Olivestro, D., 1997. The increasing linkagebetween U.S. technology and public science. Research Policy 26,317–330.
Owen-Smith, J., Powell, W.W., 2001. To patent or not: faculty deci-sions and institutional success at technology transfer. Journal ofTechnology Transfer 26, 99–114.
Remafedi, G., French, S., Story, M., Resnick, M.D., Blum, R., 1998.The relationship between suicide risk and sexual orientation:results of a population-based study. American Journal of Public
Health 88 (1), 57–60.Siegel, D.S., Waldman, D., Link, A., 1999. Assessing the impact oforganizational practices on the productivity of university technol-ogy transfer offices: an exploratory study. Research Policy 32,27–48.

Researc
T
T
K.R. Fabrizio, A. Di Minin /
hursby, J.G., Thursby, M.C., 2000. Who is selling the ivory tower?
The sources of growth in university licensing. NBER WorkingPaper (7718).rajtenberg, M., 2005. The mobility of inventors and the produc-tivity of research. In: Conference presentation, NBER SummerInstitute.
h Policy 37 (2008) 914–931 931
Trajtenberg, M., Henderson, R., Jaffe, A., 1997. Universities vs. corpo-
rate patents: a window on the basicness of innovations. Economicsof Innovation and New Technology 5 (1), 19–50.Wooldridge, J.M., 2000. A framework for estimating dynamic, unob-served effects panel data models with possible feedback to futureexplanatory variables. Economic Letters 68, 245–250.