patenting - technologia.co.uk
TRANSCRIPT
copy 2011wwwpatanalysecom
Patentingin the UK
Dr Victor Zhitomirsky PatAnalyse LtdMick McLean amp Jeremy Klein Technologia Ltd
ldquoUK Patent AttorneysldquoSatellite Report
wwwpatanalysecomuk_attorneys
wwwtechnologiacouk
2
table of Contents
Case Study ldquoAdvanced Energy Storage Technologies
Patent Trends and Company Positioningrdquo
wwwpatanalysecompamphlet
PatAnalyse Presentation A brief review of PatAnalyse services
wwwpatanalysecompresentation
Free White PaperldquoNew Frontiers in the Strategic Use
of Patent Informationrdquo
wwwpatanalysecomwhitepaper
Executive summary 3
Introduction 5
Overview of UK- originated patenting 7
Timeline 8
Clustering 11
UK patenting amp the rest of the world 17
UK patents and overall RampD spend 19
Conclusions 29
Appendix 1 The PatAnalyse database Key techniques amp further statistics 30
Appendix 2 About the authors 32
PatAnalyse BrochureIntroduction to our tools and serviceswwwpatanalysecombrochure
3
PatAnalyse delivers lsquoIP intelligencersquo to its clients We use structured information from patent databases to guide our clientsrsquo strategic decision making ndash so we have to get the patent data right PatAnalyse has accordingly spent a lot of effort developing the most advanced patent search management methods and proprietary bibliographic management tools to lsquocleanrsquo patent data
As an exercise to show how well these tools work together with Technologia ndash a consultancy specialising in technology commercialisation - we undertook to analyse the pattern of patenting by UK inventors using the most up to date information in the patent database The benchmarking of patent activities of various UK companies and universities is interesting in itself ndash our analysis shows which companies are patenting the most reveals the clustering of UK assignees by technology sectors and helps provides an overview of patenting activities by UK academia
The availability of our reliable lsquocleanedrsquo databases of UK patenting activity also offered the prospect comparing patterns of patenting with other measures of UK RampD activity such as reported corporate spending Whereas reporting of RampD spend in the UK might be incentivised by RampD tax credits patenting will receive a similar stimulus if as seems likely tax relief is offered in future on profits that rely on patents
While patent numbers are lsquoobjectiversquo their interpretation is not necessarily straightforward In contrast to scientific papers which are used to record the outcome of academic research patents are principally used by commercial companies to protect key technological solutions developed during the process of transferring the results of successful research into the product development phase
But the relevance and importance of patenting varies considerably depending on where companies are focused in the spectrum of activities which make up RampD and by sector It is easy to understand why companies heavily involved in service development like the Royal Bank of Scotland HSBC Barclays Reed Elsevier Sage Tesco and Thomson Reuters have gained very few - less than 25 patents invented in UK since 2007 - while recording more than pound75 billion of RampD spend over the same period It is evident to us that the development of novel proprietary technical solutions requiring patent protection is not core to their businesses
When we started our analysis we expected to uncover a complex relationship between patenting and RampD spend because of the well studied variations in patenting behaviour between different industries Our results indeed show certain sectoral differences However we were positively surprised to find that for most sectors the RampD spend divided by the number of patents was constant at around pound2m per patent Where sectors depart from this value it is sometimes possible to trace why from the role of patents within the sectorPatents have a great advantage over RampD spend as a tool for analysis With patents it is possible to delve into the topics of research So in addition to seeing how much invention is occurring in the UK it is also possible to identify the subject areas and sectors The main
executive summary
4
UK contributors of patents are polymers amp plastics pharmaceuticals computing and control communications and electrical power engineering
In the database it is possible to isolate the contribution of universities The sectoral pattern of patenting activities of UK Universities does not follow that of UK industry Pharmaceutical patents are particularly dominant In pharma UK universities file some 25 of patents in the field originating from UK inventors By contrast UK Universities are responsible for filing only about 6 of non-pharma patents Whatever the reasons for this focus on pharma we believe that the special characteristics of pharma have not been sufficiently taken into account in the formulation of policies around university knowledge transfer
The sectoral pattern and the relationship to RampD spend is pertinent to the current UK policy debate around tax relief for patent-related profits the so called lsquopatent boxrsquo At the very least some sectors are much more dependent on patents than others regardless of the pattern of RampD spend and innovation
We conclude that with better understanding of sectoral behaviour patenting metrics based on lsquocleanedrsquo data have the potential to provide a useful source of up to date information on the pattern of RampD activity in the UK Given the relative ease of compiling patent data compared to gathering information on RampD spending or other output indicators from published accounts or surveys promise to provide an efficient way of tracking and hopefully supporting British inventiveness for the future
ldquoExECUTIvE sUmmARyrdquo
5
This report presents the results of research which Patanalyse and Technologia have undertaken to provide a profile of recent patenting activity in the UK and to compare the pattern of patenting with the RampD spending landscape as revealed by the RampD scoreboard1 What does patenting measure In our experience a patent provides convincing evidence that some sort of RampD activity has been undertaken Even if some preliminary patents are filed on the basis simply of an inventive idea if and when they proceed to a full application the standards of description required by the examiner demand systematic investigation of novel technical solutions It may be of course that patent may be based on the accumulated results of RampD carried out in the past Our experience nevertheless supports the view that levels of patenting are an excellent indicator of a particular phase of RampD effort ndash the transition from research into development - although of course this is not the only one So patents are always an indicator of prior RampD
But the inverse relationship does not hold RampD does not necessarily produce patents And we acknowledge that the relationship between patenting and RampD is complex It is well known that the propensity to patent changes over time between companies between countries and especially between industry sectors because of a wide variety of economic factors
Nevertheless as the OECD reference manual2 on the use of patent data observesldquowhile patents do not cover all kinds of innovation activity they do cover a considerable part of it hellip The special proximity of patents to the output of industrial RampD and other inventive and innovative activities means that there is no other equivalent indicator for this purposerdquo
It is also recognised that analyses based on levels of patenting activity require skilful interpretation PatAnalyse and Technologia have been using lsquopatent analyticsrsquo to guide technology policy and strategy for over a decade and while we are well aware of the drawbacks of patent statistics we are convinced of their immense value if interpreted with care
PatAnalyse has produced the patent portfolio for this study using its proprietary patent analytics tools Patenting is part of a complex international system for example companies may file preliminary patents in one country to establish a priority date but then complete the process in another territory for strategic reasons So identifying patents that have resulted from inventive activity in the UK requires us to look further than patents filed with the UK patent office The data include all patents where the invention originated in the UK regardless of the territory of eventual patenting
1 lsquoThe 2010 RampD scoreboard the top 1000 UK and 1000 global companies by RampD investmentrsquo2 USING PATENT DATA AS SCIENCE AND TECHNOLOGY INDICATORS PATENT MANUAL 1994 pp 15 and 16 http
wwwoecdorgdataoecd33622095942pdf
introduction
6
The database covers patents with priority years from 2007 to 20113 corrects for patent families and has been screened for spelling variations that would lead to misleading results (for example a company name being spelt differently in different patents and therefore not appearing as the same assignee) Particular emphasis was given to calculating assignee information using several legal reassignment databases as well as bibliographic information of all national patents representing the same patent family4
Over a decade of experience of analysing patent data has taught us to exclude from consideration patents filed in only in a single territory (unless it is the US or EP patent) The database is thus restricted to what we regard as lsquoseriousrsquo patents ie those which are prosecuted with significant territorial coverage5 We have included in our calculations for patents invented in UK
raquo all GB patents with priorities from 2007 (30200 patents) raquo all US PCT and EP patents with priorities from 2007 claiming priority from GB patent
(48500 patents) raquo all patents with priorities from 2007 filed in EP and PCT patent offices by UK patent
attorneys (104000 patents) raquo all patents with priorities from 2007 filed in EP PCT and US patent offices by the 200
most active assignees identified in the first draft of the patent database plus all of the 200 most active companies from the RampD scoreboard which were missed in our initial draft patent database (about 600000 individual patents were considered this way)
The PatAnalyse UK patent database comprises 21416 patent families representing about 73150 individual patents and we estimate that the database is accurate to better than 1 in terms of both specificity and sensitivity6 We therefore believe that this database is now the most relevant and accurate record of recent patenting by UK inventors
We offer our high quality time series data on UK patenting to other researchers who are investigating the relationships between patenting and other indicators of RampD and innovation We believe that research using our data might well be more revealing of underlying patterns than the relatively lsquorawrsquo patent data loaded with omissions and misspellings that are often employed by scholars
3 Because of variable delays in publication of patent applications 2010 and 2011 are only partially covered in the data ndash so our analysis mostly focuses on the three complete years from 2007 to 2009
4 Patents are often organised into lsquofamiliesrsquo (representing the same invention taken to various national patent offices) so counting individual patents would tend to overstate the levels of invention
5 For more explanation of how the geography of patent prosecution is taken into account and other methodological aspects see white paper available from httpwwwpatanalysecomwhitepaper as well as Appendix 1 to this report
6 Specificity measures how well we have captured ONLY UK patents ndash detailed inspection of a sample of the database by experts confirms that more than 99 of all records are patents with UK inventors Sensitivity measures how well we have captured ALL the UK patents ndash the number of false negatives is harder to estimate than false positives but a decade of experience leads us to believe that possibly up to 1 of UK invented patents have been missed because they have been filed by SMEs only at the USPO Technical difficulties make these particular patents hard to identify
ldquoInTRODUCTIOnrdquo
7
Our database covers patents originating from UK inventors filed in any country but avoids double counting of patent families Our database also excludes patents seeking protection in only a single country like UK (but as explained above includes patents filed only in US EP or PCT for the most recent patents)
Of patents invented in UK some 44 come from companies that file five or more patents a year 40 are from companies that file only a few patents a year 8 are from universities and around another 8 are lsquounassignedrsquo and belong to the individual inventors More specifically out of 21416 patents
raquo 1697 patents are from universities raquo 1635 patents are genuinely unassigned raquo 9503 patents are from medium to large players (with more than 15 patents since 2007)
including 6853 patents filed by the lsquotop 50rsquo commercial companies (32 of the total) raquo 8581 patents are from inventors working in smaller companies raquo When sorted by priority date the totals are raquo 5277 with priority year 2007 raquo 6841 with priority year 2008 raquo 6735 with priority year 2009 (this year is almost complete only a tiny fraction is not yet
published at the moment) raquo 2342 with priority year 2010 (incomplete data due to the 18 month delay between the
priority date and the first publication date) raquo a trace amount of patents with priority year 2011 have also been published
Overview of UK- originated patenting
8
Companies
The top 30 company assignees are shown in [ Figure 1 ] Together these companies account for 26 of patents in the database The most prolific patenting companies such as Rolls Royce IBM NXP and Unilever are granted 100 to 200 patents each a year We also note the respectable position for BT which is actively patenting despite ever increasing focus of its innovation on networked IT services ndash a field which is less patented than traditional network technology
Apparent features are the dramatic increases in the patent activities of Rolls-Royce Airbus Operations and STM in 2010 as well as Dyson in 2009 IBM in 2008 and Smith amp Nephew in 2007 These are quite large fluctuations in the patent activities of individual companies Some of these anomalies are most likely connected to dramatic changes in external or internal policies but some are most likely correlated with the substantial real changes in the available RampD budgets Further investigation is required to understand the reason in each particular case For instance Dyson whose founder is a passionate advocate of lsquoPatent Boxrsquo tax concessions patents more than some companies ten times larger than itself We note that this may well be an example of lsquostrategic patentingrsquo ndash filing a thicket of patents to lsquoring fencersquo a development area in this case the lsquodigital motorrsquo
We have also found many examples of apparently similar companies with profoundly different patenting strategies We plan further research into whether essentially similar companies have dissimilar patenting strategies and what impact these strategies seem to have on profitability and growth
timeline
9ldquoTImElInErdquo
[ Figure 1 ] Top 30 UK company assignees
10
Sectors
Using the set of patent codes assigned to the individual patents within each patent family it is possible to create a picture of the sectoral patterns of patenting The distribution of patenting activity across sectors and priority years is shown in [ Figure 2 ]
Uniform colours indicate that unlike the results shown for individual companies the normalised level of patenting in each sector has been fairly constant over the three full years (2007 2008 and 2009) covered by the database with the single exception of power engineering It seems that the substantial increase of patenting by Dyson is alone responsible for the lsquohot spotrsquo relative rise in UK electrical power engineering patents in 2009
The main UK sectors involved in patenting are polymers amp plastics pharmaceuticals computing and control communications and electrical power engineering This seems broadly in line with what we would expect to see given our experience of the UK high technology scene A more formal comparison with reported RampD spend is shown in the next chapters of this report
[ Figure 2 ] sectoral split
ldquoTImElInErdquo
11
Clustering
Major 100 companies which together represent about 33 of the overall patent portfolio of UK innovations
[ Figure 3 ] represents the clustering1 of chemical activities ndash 8 of the total Here as well as an ecosystem of companies involved in pharmaceuticals there is also a clear cluster of food and consumer product companies
[ Figure 4 ] represents the clustering of engineering activities ndash 10 of the total The defence and aerospace cluster is evident in the centre Also it shows a small cluster of medical device companies (Electa AB Gyrus Medical Nellcor Puritan Bennett Siemens) and automotive companies (Delphi Ford Motor Cummins)
[ Figure 5 ] represents the clustering of electronics and software activities ndash 15 of the total patent portfolio Quite a complex corporate ecosystem is evident with twin foci on semiconductors and telecommunications It is also interesting to note that NXP Semiconductors and IBM - two companies dominating the patent landscape of Figure 5 - are entirely missing from the UK RampD scoreboard
1 Clustering of data is a part of the proprietary patent map builder tool developed by PatAnalyse for presenting statistical information for patent portfolios
12
[ Figure 3 ]
Cluster of chemical activities
ldquoClUsTERIngrdquo
13ldquoClUsTERIngrdquo
[ Figure 4 ]
Cluster of engineering activities
14
[ Figure 5 ] Cluster of activities in electronics and software
ldquoClUsTERIngrdquo
15
UK Universities
The top UK university assignees are shown in [ Figure 6 ] The sectoral pattern of patenting activities of UK Universities does not follow that of UK industry - pharmaceutical patents are particularly dominant In pharma universities file some 25 of overall patents originating from UK inventors Excluding pharma activities UK Universities are responsible for only about 6 of the remaining patent portfolio of UK innovations
This exceptional concentration on a single sector is we believe an unusual feature of the UK A recent OECD study notes that globally ldquoInstitutions such as universities are also essential to these fields [pharmaceuticals and biotechnologies] with 10-12 of patents originating from the education sector1 Furthermore as we note in the next chapter there is a high cost involved in developing patent portfolios in bio-pharma In the sectors of the economy related to engineering and electronics it is often enough to cover inventions in the US and Europe ndash which are the major consumer markets In bio-pharma patents are regularly taken in many more territories as illustrated by [Figure 7 ] This wider geographical coverage greatly increases the cost of building an IP position for a single invention in biopharma ndash we estimate that UK Universities are spending considerably more than half of their available IP budgets on building their patent portfolios in the pharmaceuticals sector
The emphasis of UK Universities on bio-pharma is most likely related to the active financing of life science activities by government and government agencies However as shown in the next chapters the RampD spend per patent in pharmaceutical companies is about 16 times higher than that in most other industrial sectors Such differences are reinforced by the well known high cost of capital for venture-backed early stage companies in life sciences Biopharma and biotech in general have several challenging features for venture investors high risk of failure long time to market excessive requirement for on-going development capital the need for establishing partnerships with large strategic partners in order to achieve an exit etc
Apart from Universities we show on the same graph other state bodies including ITI Scotland NHS and MRC Other research councils with their own research establishments are not present due to their lack of patent activities We believe this may be explained by differences in their approaches to IP
1 OECD Science Technology and Industry Scoreboard 2011 p5 httpwwwoecdorgdataoecd633248712591pdf
ldquoClUsTERIngrdquo
16
[ Figure 6 ] Clustering UK Universities
ldquoClUsTERIngrdquo
17
UK patenting amp the rest of the world
Even when an initial patent application is made in the UK the eventual patenting strategy almost invariably involves other territories The database allows us to explore how the geographic pattern of patent protection sought differs between sectors
[ Figure 7 ] shows for example that pharmaceutical companies tend to patent across the world whereas engineering companies are more selective To emphasise further the difference between the sectors we show a normalised plot [ Figure 8 ]
[ Figure 7 ]national patent filing by sector for UK-originated inventions
18
The green colour on the normalised plots correspond to the averaged trend the colder (eg blue) colours correspond to activities well below the average the warmer colours (eg red) emphasise levels of activity well above the average Normalised plots are an efficient way of analysing portfolios with very dissimilar categories For instance [ Figure 8 ] helps to highlight that a wide geographical coverage is also inherent for agricultural biotechnology and for food and consumer chemicals As everyone might be expected software related patents (under computing and control) are more focused towards filing in the US compared with any other sector
[ Figure 8 ] national patent filing by sector ndash normalised plot
ldquoUK PATEnTIng amp ThE REsT OF ThE WORlDrdquo
19
UK patents and overall RampD spend
While we are aware of the substantial body of academic research dealing with the suitability of patents as indicators of RampD output our approach differs firstly in that we are interested in patent data as a source of strategically valuable intelligence per se and that as we have explained we place more emphasis than many other researchers on processing the lsquorawrsquo data to provide a high quality basis for the analysis
We have compared the pattern of patenting of inventions originated in the UK with a widely used and officially funded source of information on RampD activity by UK firmsndash the Governmentrsquos soon-to-be-abandoned RampD Scoreboard1 We chose this source because like our patent database it was constructed (albeit at considerable cost) from company-specific information in the public domain
We find that the two pictures differ in some significant ways partly as a result of the differences between companies in their propensity to patent Some of these discrepancies can also be explained by the well studied sector-specific differences2 But UK patenting activity is also broadly consistent with our understanding of hi-tech industrial sectors in the UK and for us the most useful explanations of apparent sectoral differences seem to lie in fundamental differences in the nature of the products involved and in the competitive dynamics of the sectors
We have compared the patent statistics with the RampD scoreboard which lists companiesrsquo overall RampD spend as reported in their company accounts Reporting of RampD expenditure is governed by national and international accounting standards and is therefore agreed to be a consistent measure We note in particular that the scoreboard data do include spending by British firms on RampD which is carried out overseas So what we are comparing is the pattern of UKrsquo inventivenessrsquo within Britain with the overall RampD spending of UK companies active in patenting
Some 165 companies appear in both the RampD scoreboard and our database of patenting companies They are responsible for about 7561 patent families (35 of the total patent portfolio) and for about 65 of the RampD spend reported in the RampD scoreboard data (see Figure 9 below)
Further comparison with RampD scoreboard data reveals 78 companies not in the scoreboard which are assignees on 2863 patents It is clear some of these ndash eg NXP Semiconductors IBM Schlumberger 3M Nortel Networks Skype - are firms active in UK RampD but with head offices overseas
1 The official source of UK RampD spend is the BIS BERD survey The Scoreboard was funded by BIS but has never been an official statistic Its advantage was that it collated reported RampD spending from corporate accounts by named companies The disadvantage was that this could include RampD carried out overseas but funded from the UK or for various reasons reported in the UK
2 Academic research on sectoral differences in patenting has tended to focus on identifying differences in theoretical constructs such as sector-specific lsquopropensities to patentrsquo and the productivity of RampD
20
But this does not seem to be the cause of their omission since these firms do file UK accounts with Companies House ndash for instance NXP Semiconductors UK Ltd recorded pound50 millions of RampD spending re-charged to the parent in 2009 and claims an RampD tax credit - but for some reason we do not understand this RampD budget is not included in the UK RampD scoreboard data
It is possible that some of these 78 firms make significant investments in UK RampD and thus substantial contributions to the innovation ecosystem which ndash because of the complexities of accounting practice - are not recognised by policy makers ndash this deserves further study
[ Figure 9 ] sectoral split of companies in scoreboard that patent
ldquoUK PATEnTs AnD OvERAll RampD sPEnDrdquo
21ldquoUK PATEnTs AnD OvERAll RampD sPEnDrdquo
The statistics and analyses which follow regarding the relationship between patenting by UK inventors and overall RampD spend of UK firms are based on the set of 165 companies and their 7561 patents which are covered by both sources We note that pound16bn is roughly the amount of private sector RampD spend in the UK recorded in the BERD survey So this confirms that the scoreboard includes a lot of overseas performed RampD reported in the UK accounts of MNEs
However some 27 of UK patent activity by large companies originates from firms that do not appear in the RampD scoreboard (most likely because of simple errors of omission and the complexities of accounting practice ndash UK performed RampD accounted elsewhere and vice versa) ndash see [ Figure 10 ]
[ Figure 10 ] sectoral split of companies not on scoreboard
22
Conversely there are over 250 companies that appear on the Scoreboard but do not patent ndash see Figure 11 It might be that some of these companies do have filed occasional patents but as a rule they are ignored by our analysis if they have filed less than 5 patents since 2007 We believe the main explanation is that these firms are in sectors ndash banking for example whose products methods and services are not generally protected by patents Combined these companies represent 30 of all RampD spend recorded in UK
This is a striking example of the phenomenon we have already noted that the propensity to use patenting varies considerably between sectors In many sectors which are not related to developing novel technologies or carrying out applied research - like fashion and furniture for example - there may be alternative forms of IPRs (copyright design rights3) that fit the results of the development activities in such industries far better than patents4
However until quite recently development activities in fashion or the furniture industries would not generally have been regarded as RampD because their development did not involve the problem solving element that is the fundamental property of RampD according to the official definitions in the so called lsquoFrascati Manualrsquo not because the sectors per se were excluded
The OECD Frascati Manual5 runs to 240 pages and defines RampD broadly covering not only the natural sciences and engineering but also the social sciences and humanities
In accounting practice RampD activities are treated even more broadly in order to capture what are essentially late stage development activities so that pure product or service development is nowadays considered part of the RampD spend
We have also tried hard not to blur the distinction between lsquoinventionrsquo and lsquoinnovationrsquo There is a big difference between making money for businesses (which might result from innovative products or business models) and developing new products underpinned by advances in technologies (which in our experience are usually a result of patented inventions) Many sectors of the modern economy in the UK are not involved in advancing or applying new technologies but instead rely on business innovation It is therefore not surprising that in typical surveys of innovation many more firms report using strategic IP such as confidentiality secrecy design complexity etc than patenting
Such sectoral preferences support the conventional wisdom shared by many economists that patents (which we believe are an excellent indicator of inventions) are only a partial indicator of innovation (which is often not related to any advances in technology) And when we look at the actual products and competitive dynamics involved in different sectors we can quickly make sense of many of these sectoral differences
3 We understand that Innovation Survey data suggest that around 10 of UK enterprises who report undertaking RampD in 2006-2008 also report applying for a patent while around 35 report taking out a registered industrial design
4 We are aware that there is an IPO funded research project currently underway on ldquoalternatives to patentsrdquo that attempts to quantify this using Innovation Survey data
5 The Frascati Manual is a document setting forth the methodology for collecting statistics about research and development The Manual was prepared and published by the Organisation for Economic Co-operation and Development
ldquoUK PATEnTs AnD OvERAll RampD sPEnDrdquo
23
For example in [ Figure 11 ] banks finance and software predominate It is widely perceived that RampD in the financial sector revolves mostly around developing application software such as CRM systems and payment systems involving both hardware and software such RampD is counted as development for tax purposes but generally not patented (for a very good reason as it close to pure development and usually lacks any real novelty)
Looking at the companies appearing in the RampD Scoreboard that do file patents we have found that the amount of overall RampD spend in relation to each UK patented invention varies widely between sectors ndash see Figure 12 A UK generated patent in the pharmaceutical industry is by far the most lsquocostlyrsquo in terms of average overall RampD spend whereas a patent in recreational products corresponds to far less overall RampD spend If we order the sectors in terms of notional spend per patent then four groups seem to be apparent (1) pharma (2) telecoms and automotive (3) software oil and gas and food (4) the rest
[ Figure 11 ] sectoral split of companies on scoreboard but not patenting
ldquoUK PATEnTs AnD OvERAll RampD sPEnDrdquo
24
Using this relatively crude measure it is evident that pharmaceuticals is in a class of its own with a notional RampD spend per patent of around pound32m Explanatory factors could include the fact that an individual new drug may be underpinned by a very limited number of patents for the active ingredient (or new chemical entity) and potentially for a new method of delivery unlike more complex technical products (for example a mobile phone) in which many hundreds of features may be patented Furthermore the development cost (a part of RampD) in bringing a new invention (new drug) to market including the costs of clinical trials is high ndash as much as $800m according to a much-quoted estimate from Tufts University Thus each patent in pharmaceuticals must be supported by a huge amount of required development effort thus raising the notional RampD spend per patent
The remaining industrial sectors seem to fall into three groups telecoms and automotive at approx pound12m RampD spend per UK generated patent oil and gas software and food at approx pound7m per patent and the remainder at approx pound2m per patent This apparent clustering is the subject of further investigation but we can already advance some hypotheses based on our understanding of the nature of the products and services involved and the varying competitive dynamics of the sectors
It is tempting to speculate that pound2m RampD spend per patent is the common baseline for many genuine technology-based industries We believe it is useful to enquire what raises the value for other sectors above this base RampD costs are a combination of average salaries the time spent by researchers and the capital equipment required to carry out the initial feasibility study the proof of principal demonstration and the final development of pre-production prototypes
It is highly plausible that the required RampD spend to support new invention from the feasibility stage to the final product is quite similar in the telecoms and automotive sectors to that in the rest of industry Both sectors have also been heavily patented for several decades past which may mean that diminishing returns in terms of lsquopatentabilityrsquo of new engineering solutions may be setting in However it is probably more important that in both industries there is a significant amount of general development which is unrelated to developing truly novel technical solutions
For instance modern cars are a complex engineering product which requires substantial amount of development effort from mechanical and electronic engineers who donrsquot always need to find any radically new way of resolving technical problems More often they need to make sure that their design solution (based on well established best practise design steps) meets all pre-determined technical specifications and provides a reliable module which is capable of being fully integrated within the car
The food industry may we believe illustrate a tendency common to process industries ndash whereby substantial amounts of know-how are difficult to enforce legally and thus are less appealing to patent Thus a relatively small proportion of RampD in the sector is considered to be lsquopatentablersquo with much of the IP emerging in the form of secret processes recipes and branded goods This is another good example of the fact that patents are only a partial indicator of innovation in this particular sector
The higher cost per patent in oil and gas is most probably related to the need of using specialised equipment making development efforts lsquomore expensiversquo although it might be expected that oil and gas also represent process industries ndash which encourages a larger
ldquoUK PATEnTs AnD OvERAll RampD sPEnDrdquo
25
share of technical innovation retained as internal know-how
Software patents themselves have actually only recently been permitted ndashthey are still most clearly allowed in the US If we consider a company like Microsoft it is interesting to note that it has filed 90 of its patent portfolio during last 10 years and less than 3 of its portfolio prior to 1996 So it is not surprising to conclude that most RampD activity in the software industry is related to lsquopurersquo development efforts (however underpinned by a highly educated and intelligent workforce) thus raising the notional RampD spend per patent in the same manner as in the automotive industry
The following two graphs replicate the data presented in [ Figure 9 ] and [ Figure 12 ] But they demonstrate a useful way to show again the appearance of four clusters of industries which are described by different relationships between the levels of UK originated patenting and overall RampD spend
This analysis while interesting of cause does not provide a true measure of differences in RampD efficiency between different sectors The only sensible metric for RampD efficiency is return on investment and gathering and analysing such data are well outside the scope of this paper
The current set of data is useful only to confirm a rough correlation between patenting activities and RampD spend for most industry sectors ndash at least for the major cluster of industries on [ Figure 12 ] The nature of the apparent correlation patterns revealed here might
[ Figure 12 ] Overall RampD spend per UK patent
ldquoUK PATEnTs AnD OvERAll RampD sPEnDrdquo
26
deserve further investigation
The utility of treating patent activities as a rough measure of RampD spend of major players goes far beyond an academic discussion Both patent data and reported RampD spend suffer from comparable time delays Patent data are easier to access since they are stored in a common format in public domain databases Furthermore patents show precisely what RampD the company is doing not just how much of it they are doing
As the OECD guidelines of the use of patent data observes ldquo A further extremely important advantage is the very detailed classification in patent documents which allows almost unlimited choice of aggregation levels from broad fields of technology down to single products Here patent indicators are much better than RampD expenditures or trade and production statistics where the degree of disaggregation is much lessrdquo 6
6 USING PATENT DATA AS SCIENCE AND TECHNOLOGY INDICATORS PATENT MANUAL 1994 p16 httpwwwoecdorgdataoecd33622095942pdf
[ Figure 13 ]
Overall RampD spend per year vs the total number of UK patents
ldquoUK PATEnTs AnD OvERAll RampD sPEnDrdquo
27
Furthermore the same report goes on to state ldquoPatents can be particularly helpful in identifying the direction taken by the RampD and innovation effort of a firm while information on RampD expenditure is rarely available at a disaggregated level and industrial secrecy may protect the specific content of research projects The patent portfolios of large firms can be investigated in order to study a companyrsquos innovation strategy its technological diversification and how different fields of knowledge are combined in the firmrsquos activity
In fact most large firms carry out technological activities in a range of fields broader than their production activities in order to explore potential future areas of activity7rdquo
While patents are conventionally regarded as lsquolaggingrsquo indicators ndash being the result of research done in the past we believe they are also useful lsquoleadingrsquo indicators of development
work which may be a decade or more in the future
7 op cit p59
ldquoUK PATEnTs AnD OvERAll RampD sPEnDrdquo
[ Figure 14 ]
Overall RampD spend per year vs the total number of UK patent ndash expanded view
28
PatAnalyse frequently delivers so called lsquopatent mappingrsquo studies to its clients in order to provide unique business intelligence about the RampD efforts of major competitors Unlike marketing reports which usually analyse information easily accessible in the public domain a patent mapping study offers a deep dive into the Invisible Web ndash to the reliable information which can be derived from paid subscription patent databases
In such commercial patent mapping studies all assignees of interest work in a similar area of technology which greatly improves the correlation between the RampD spend and patenting activities In addition in such patent mapping studies we apply project specific taxonomies to each individual patent to benchmark the activities of major players against a set of bespoke technical categories The resulting in-depth analysis of RampD strategies of major competitors against a bespoke technical taxonomy is not available from any other source of data
A good overview of the activities of major players is essential for the cross-fertilisation of RampD efforts at an international level Business intelligence derived from such knowledge frequently helps strategic decision making Improving access to the information buried within patent databases creates huge opportunities for businesses especially for new entrants that have yet to build up significant internal technology know-how
Patent lsquolandscapesrsquo can be used to visualise patterns of technology competition on a global scale Patent landscaping as the process is called is the tool increasingly used by large corporations to inform product development and technology strategies By analysing vast amounts of data in patents databases users can gain a significant competitive advantage For example patent mapping can give firms comprehensive insights into innovation trends and the position of rivals can show gaps and opportunities the parts of the world where specific new technologies are being developed and so on
Further example of a typical patent landscape study is available at wwwpatanalysecombrochure
ldquoUK PATEnTs AnD OvERAll RampD sPEnDrdquo
29
This analysis confirms that as might be expected patenting by UK inventors and RampD expenditure by UK firms are not perfectly correlated The differences seem to be of more than academic interest Because RampD spend already attracts tax credits and income derived from patents is soon to do so questions arise as to the appropriate balance of the relative tax subsidies based on these two indicators
For instance both the pharmaceutical industry and software development stand to gain from RampD tax credits and it is widely believed that big pharma will be far and away the largest beneficiary of the patent box although other sector such as electronics hardware (ARM for example) would probably also benefit substantially from patent-based tax relief
We believe that with better understanding of sectoral behaviour based on the nature of products and the differences in competitive dynamics between sectors patenting metrics have the potential to add important cost-effective and timely information to the overall picture of RampD and invention in the UK and some insights into factors influencing the level of innovation Although of course we are well aware of their limitations and that patenting metrics should not be used in isolation As the OECD manual states
ldquoalthough patent indicators do reflect an important part of the overall innovation process for a number of reasons they should not be used in isolation this need for an integrated view of innovation indicators applies to other series as well and even the classic series such as RampD expenditures should be viewed in a wider contextrdquo
Nevertheless given the relative ease of compiling patenting metrics from public domain sources compared to the effort involved in gathering information on RampD spending or other output indicators patent analytics promises to provide a very cost-efficient way of tracking key aspects of British inventiveness for use in the future
Conclusions
30
We have included in our calculations
raquo all GB patents with priorities from 2007 (30200 patents) raquo all US PCT and EP patents with priorities from 2007 claiming priority from GB patent
(48500 patents) raquo all patents with priorities from 2007 filed in EP and PCT patent offices by UK patent
attorneys (104000 patents) raquo all patents with priorities from 2007 filed in EP PCT and US patent offices by the top
200 assignees form the first draft of the patent database plus all top 200 companies from the RampD scoreboard which have been missed in our initial draft patent database (about 600000 individual patents were considered this way)
We retain in the final database only patent families in which inventors record a UK postal address as their address of residence In the case of patents with inventors from multiple countries we use a proprietary algorithm taking into account an assignee address and a priority country to calculate the actual country of the invention
We do not regard patent families with a single GB patent as a meaningful invention We require at least one extra significant country in the family ndashat least Japan or Germany ndash for a patent family to be taken into account However we do take account of patent families with a single US patent because of the substantial market coverage provided with a US patent Equally we also admit lsquolonelyrsquo EP or PCT patents (during first 30 months from its priority) More generally we use a proprietary metric to calculate a geographical score of the patent family as a filter for the final patent portfolio in order to remove patents with insignificant geographical coverage Lonely GB patents are automatically removed by this filter from the final patent portfolio
It should be noted that priority information in most patent databases is not reliable ndash a substantial part of patents with priority dates from 2007 actually belong to simple patent families with patents having much earlier priorities This problem is resolved by reconstructing the correct earliest priority date at the level of the patent family using our proprietary algorithms
Simple patent families combining the same invention (but with patents taking this invention to different countries) are constructed using algorithms which take into account various metrics including the statistical correlation of semantics of claims and abstracts of the patent documents as well as the exact matching of the list of inventors In this way we are able to split large INPADOC patent families into much more sensible sets of simple patent families
Because of an error in the algorithm used by INPADOC it is not unusual to find INPADOC patent families combining more than 100 individual patents it is also not unusual to come across an INPADOC patent family which contains up to 1000 separate patents We correct corrupted INPADOC information in order to base our analysis on much more sensible simple patent families
appendix 1the Patanalyse database Key techniques and further statistics
31
the total portfolio includes
21405 patent families representing 73075 individual documents (3 to 4 patents in each family on average) including
During the process of lsquocleaningrsquo the bibliographic data via the process of constructing proprietary simple patent families we have also calculated the assignee information using legal reassignment databases For instance the INPADOC Legal Database (maintained by the European patent office) has been used to provide assignee data for 85 of all US patents and the US Reassignment database (not fully synchronised with INPADOC) was used to add correct assignee data for additional 5 of US patents Additionally 4 of US patents have inherited assignee data from another patents in their patent family or had the actual assignee information in their original bibliographic records Only 6 of US patents were left unassigned after using our algorithms The large amount of reassignment data stems from the legal requirement to assign patents to inventors during the initial filing of the patent document with the US patent office
In the contrast only 7 of European patents and only 2 of GB patents have reassignment data for this relatively fresh set of patent data
Assignee data are lsquocleanedrsquo using a master database of various dissimilar spelling of assignee data For the current project we have used about 5000 individual records For example Schlumberger has 40 different versions in this database Unilever ndash 16 records Rolls-Royce ndash 18 records GSK ndash 21 records and Reckitt Benckiser ndash 25 individual records
A similar procedure is used to clean inventorsrsquo names (3700 records in the project database) and patent attorneysrsquo information (5300 separate records in the master database) For example just one single UK patent attorney firm - Marks amp Clerk ndash has 160 individual dissimilar records in the project database The variety of spelling of inventorsrsquo names is more limited for instance the inventor lsquoWatson Jamesrsquo can be also recorded either as WATSON James Nicholas or WATSON James N
Out of the patents in the overall portfolio
raquo 16261 patents were drafted and prosecuted by UK patent attorneys (76 of the total) raquo 16400 patents claiming priority from GB patent or GB provisional application (which
does not always progress towards a published GB patent) ndash some 77 of total raquo It is interesting to note that these numbers are practically identicalndash and for a good
reason UK patent attorneys will tend to use a GB provisional patent application as a document to establish priority Also
raquo 2856 patents claim priority from US patent ndash 13 of total raquo 2150 patents are claiming priority directly from PCT or EP patent ndash 10 of total
[ APPEnDIx 1 ] ThE PATAnAlysE DATAbAsE
raquo 19900 PCT patents raquo 12900 US patents raquo 11900 EP patents raquo 9600 GB patents (out of 30200 filed in
GB during the same period of time) raquo 3700 Chinese patents
raquo 3050 Japanese patents raquo 2800 Canadian patents raquo 2500 Australian patents raquo 1500 Korean patents raquo 1300 Indian patents raquo 1000 Mexican patents
32
about Patanalyse
PatAnalyse is an integrated technology consultancy specialising in high quality patent searching and strategic analysis
We transform the patent search process from lsquoblack magicrsquo into a traceable self-learning iteration process Our clients are usually shocked when they learn the limitations of the conventional patent search strategies used by their advisors or internal teams
For over ten years PatAnalyse has delivered IP intelligence to its clients We take responsibility for finding the patent information required by our clients and then structure and make sense of it
We use a proprietary search management system to capture expert judgments and combine these with artificial intelligence algorithms to produce a pre-analysed universe of data tailored exactly to each clientrsquos needs
Experience in technology consultancy allows us to provide an interpretation of the competitive intelligence landscape our analysis is closely aligned to the clientrsquos business strategy
Our client as the user first influences how the universe of patent data is gathered and structured and then can exploit it using the on-line patent management system provided by PatAnalyse
We have significant experience in delivering raquo patent landscaping - competitor intelligence studies raquo due-diligence studies before in-licensing or acquisition raquo strategic portfolio alignment raquo freedom to operate (FTO) analysis raquo litigation support for nullifying claims of asserted patents
For further information please contact
Dr Victor ZhitomirskyManaging Directorvictorzhpatanalysecom
appendix 2 about the authors
33
about technologia
Technologia is a boutique consultancy specialising in science technology and high tech markets The company was formed in 2008 through the management buy-out of the former public sector and financial services practice of Sagentia a leading international product development consultancy Technologia covers a very broad range of sectors and markets and works for private sector clients in the UK and EU the EC UK government regulators Scottish Enterprise Invest Northern Ireland amp Enterprise Ireland
The company is experienced and adept at working in consortiums with organisations with complementary skills to tackle challenging projects Also as a small company with limited resources we have made a strategic decision to undertake RampD in collaboration with complementary specialist firms
Accordingly in June 2010 we formed an alliance with Patanalyse - run by a former colleague at Sagentia - to undertake joint RampD projects and to share the work of marketing the resulting offerings
For further information please contact
Mick McLeanManaging Directormickmcleantechnologiacouk
[ APPEnDIx 2 ] AbOUT ThE AUThORs
Case Study ldquoAdvanced Energy Storage Technologies
Patent Trends and Company Positioningrdquo
wwwpatanalysecompamphlet
PatAnalyse Presentation A brief review of PatAnalyse services
wwwpatanalysecompresentation
Free White PaperldquoNew Frontiers in the Strategic Use
of Patent Informationrdquo
wwwpatanalysecomwhitepaper
PatAnalyse BrochureIntroduction to our tools and serviceswwwpatanalysecombrochure
ldquoUK Patent AttorneysldquoSatellite Report
wwwpatanalysecomuk_attorneys
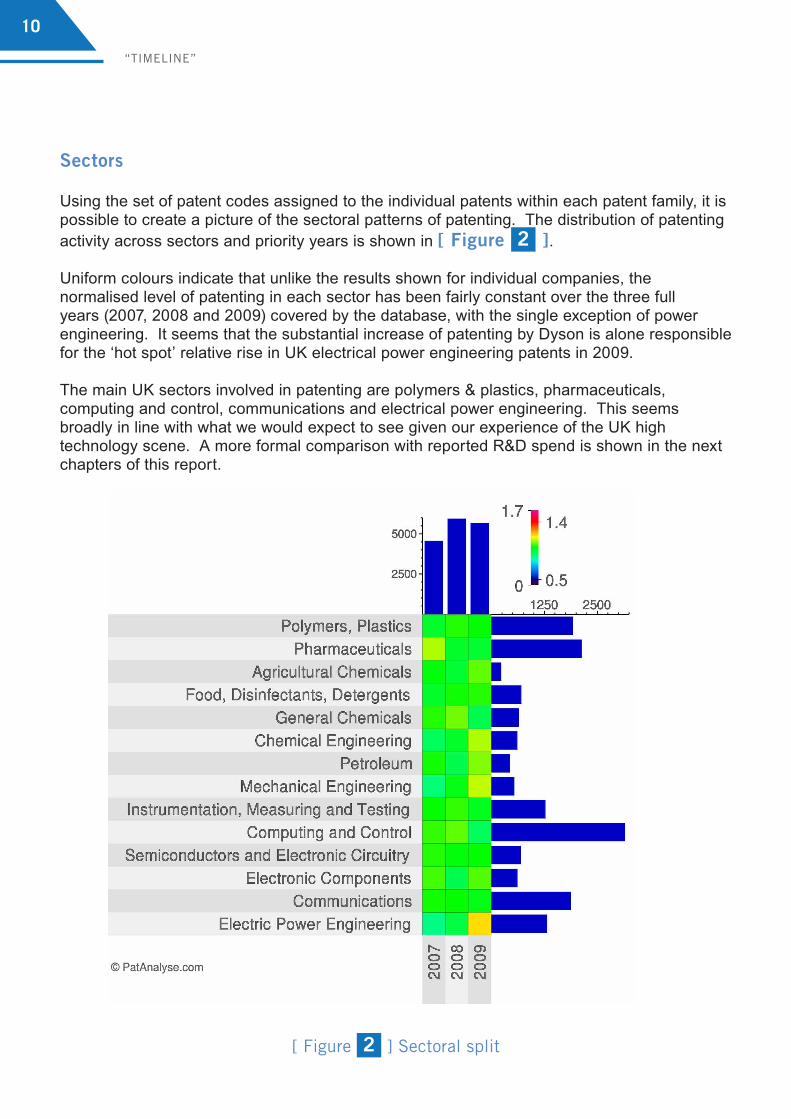
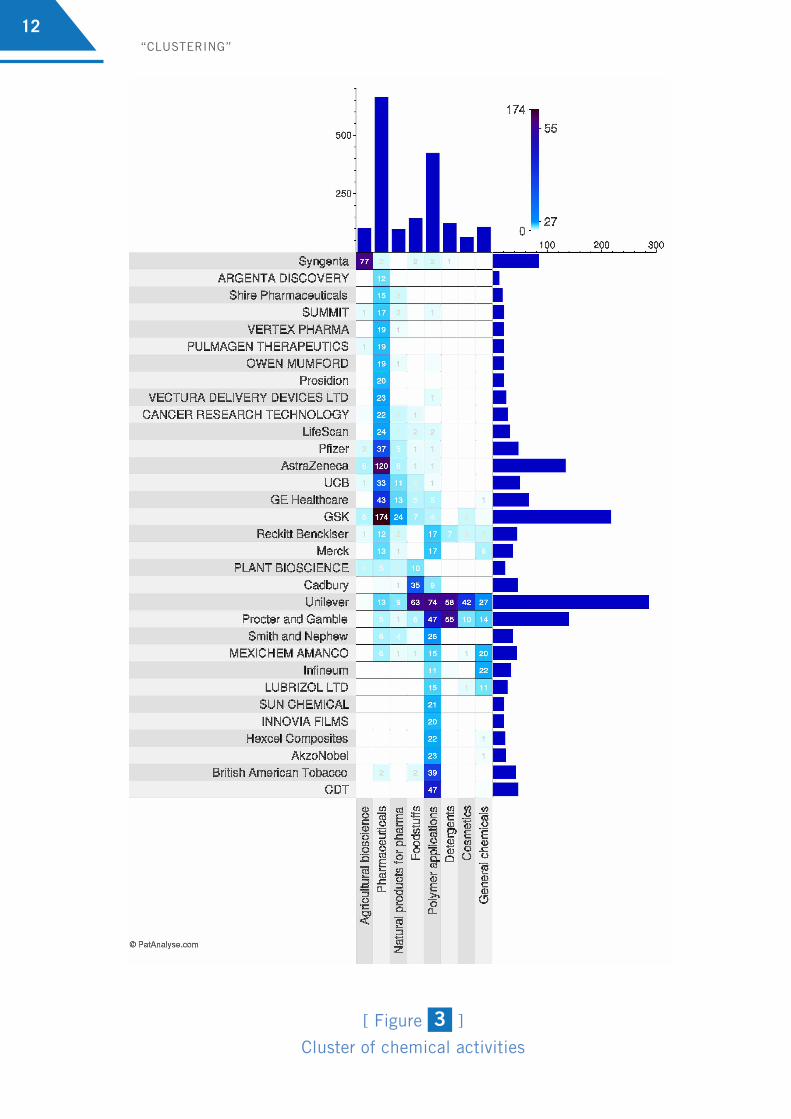
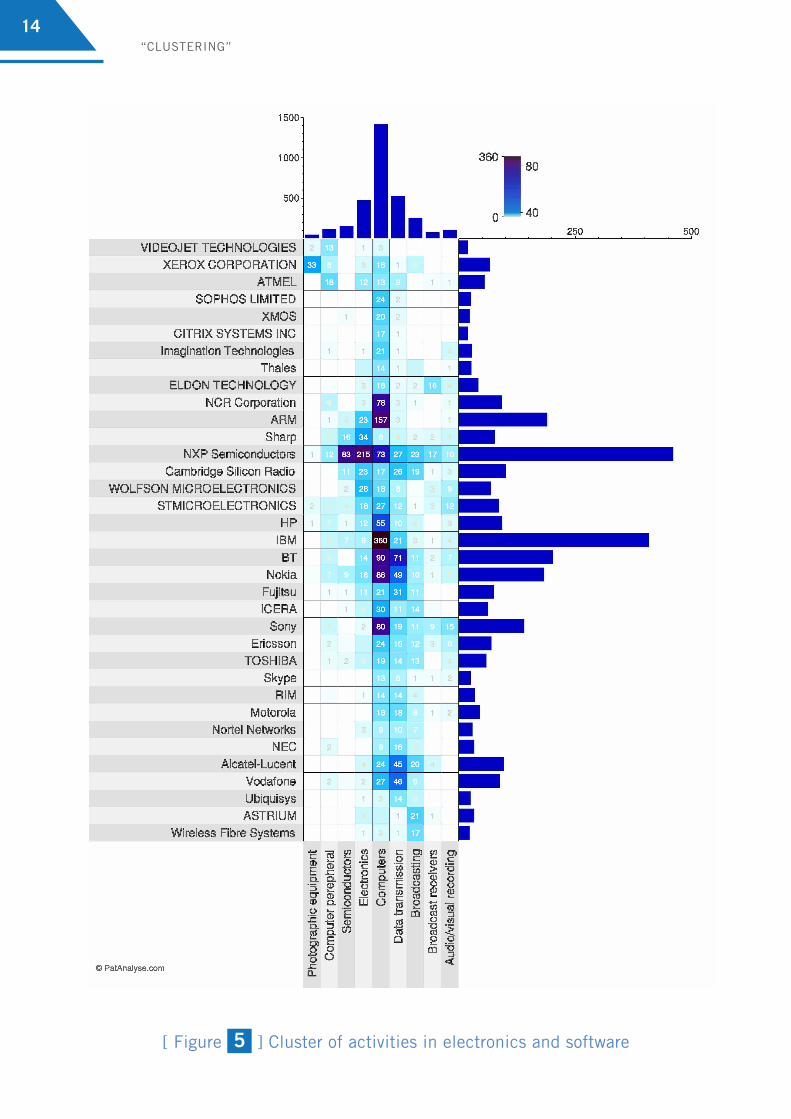
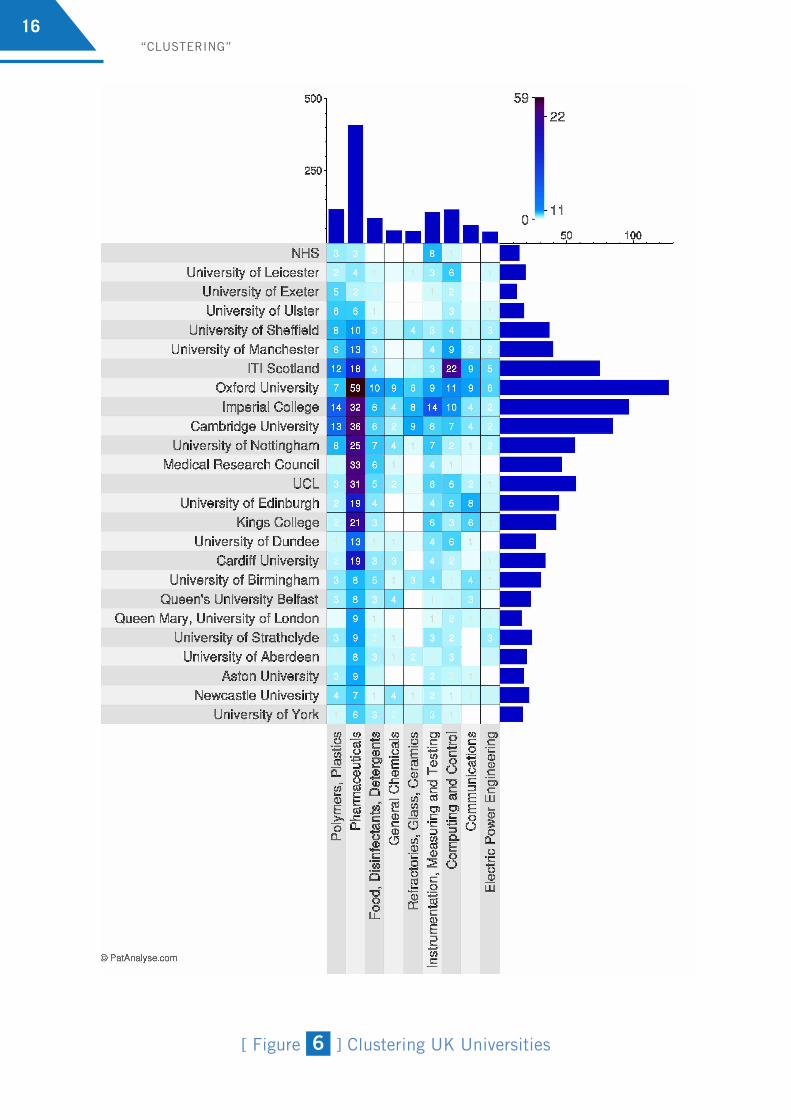
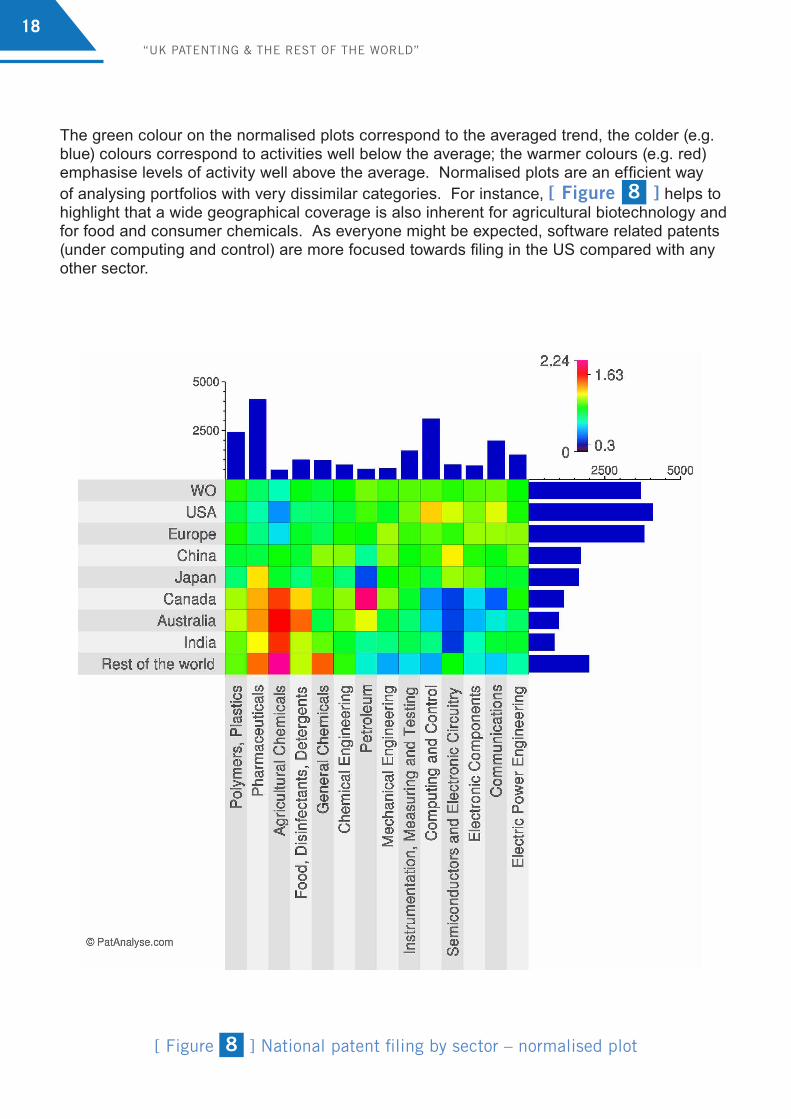
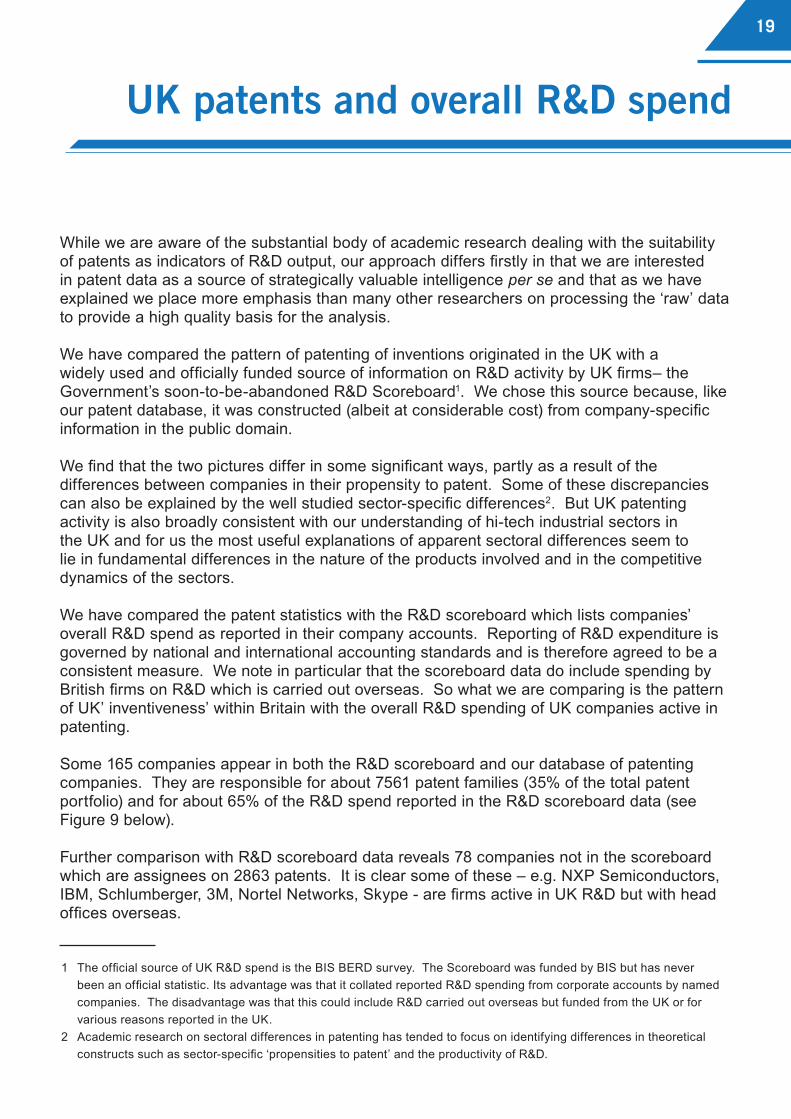
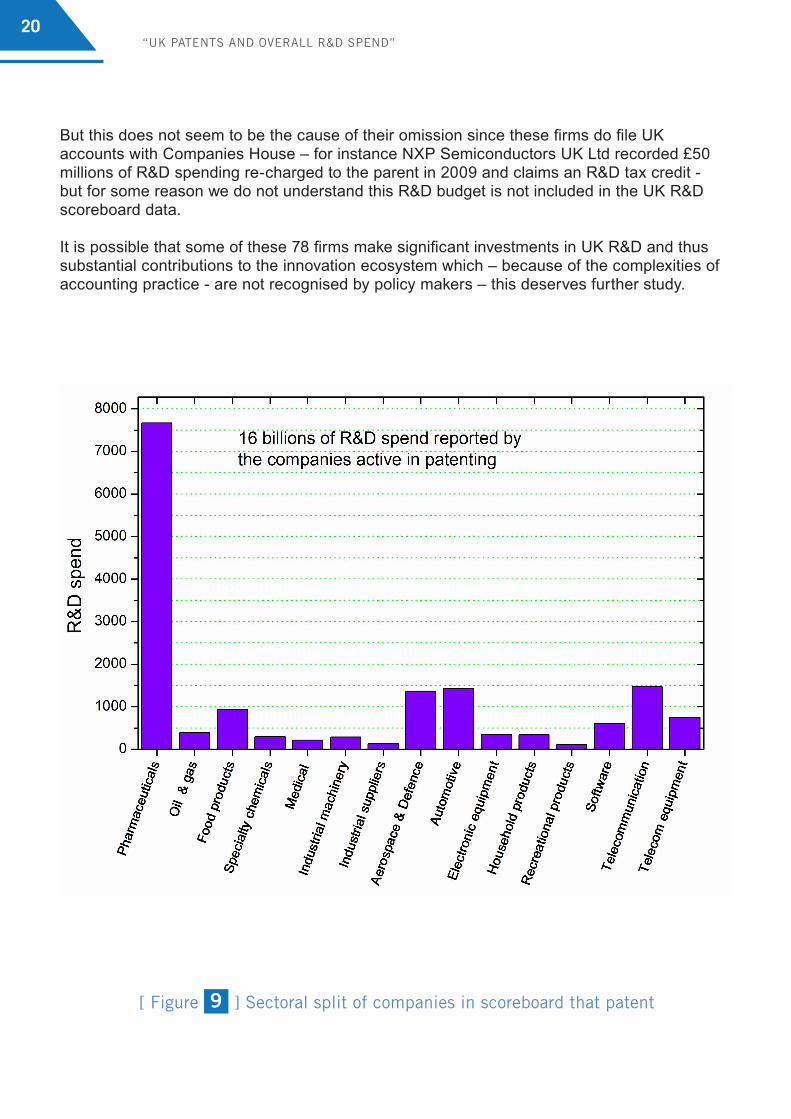
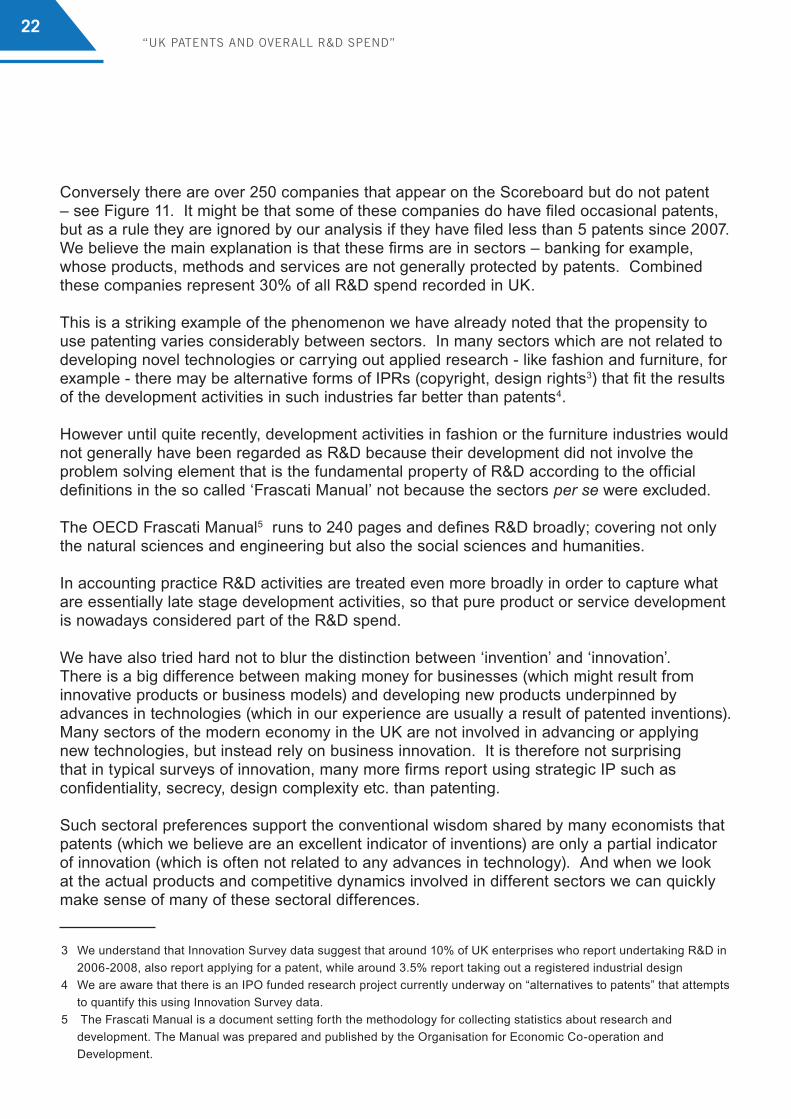
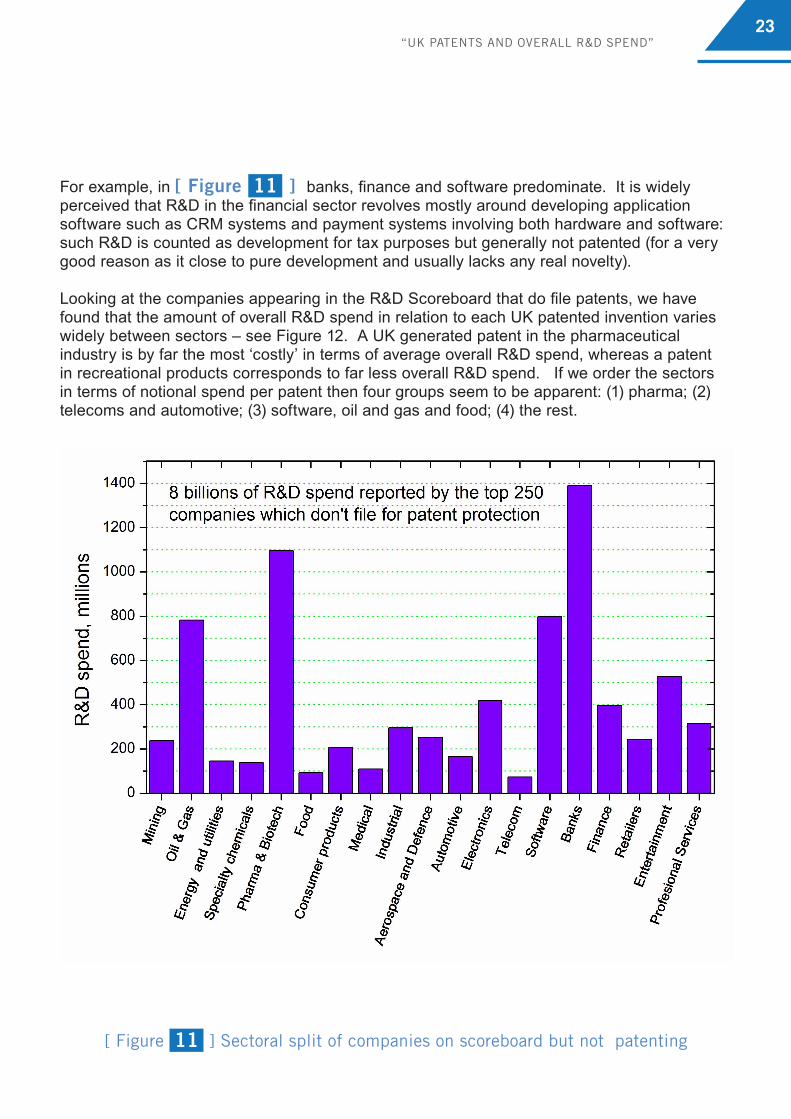
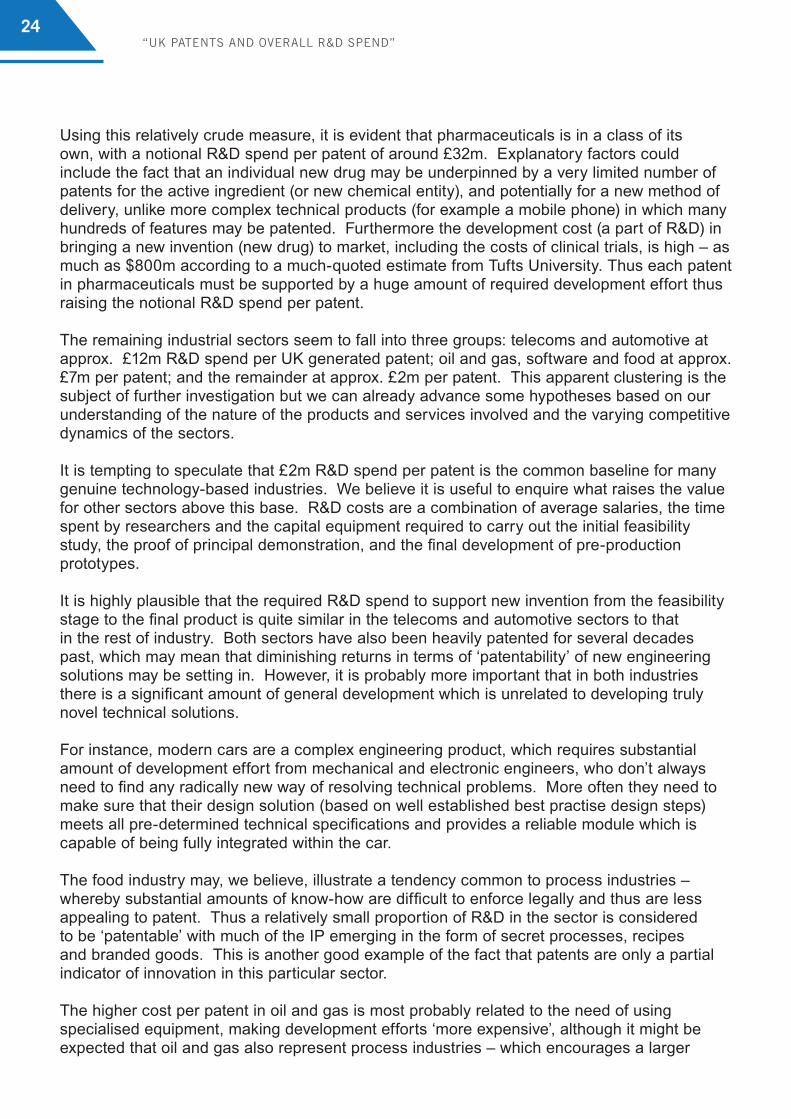
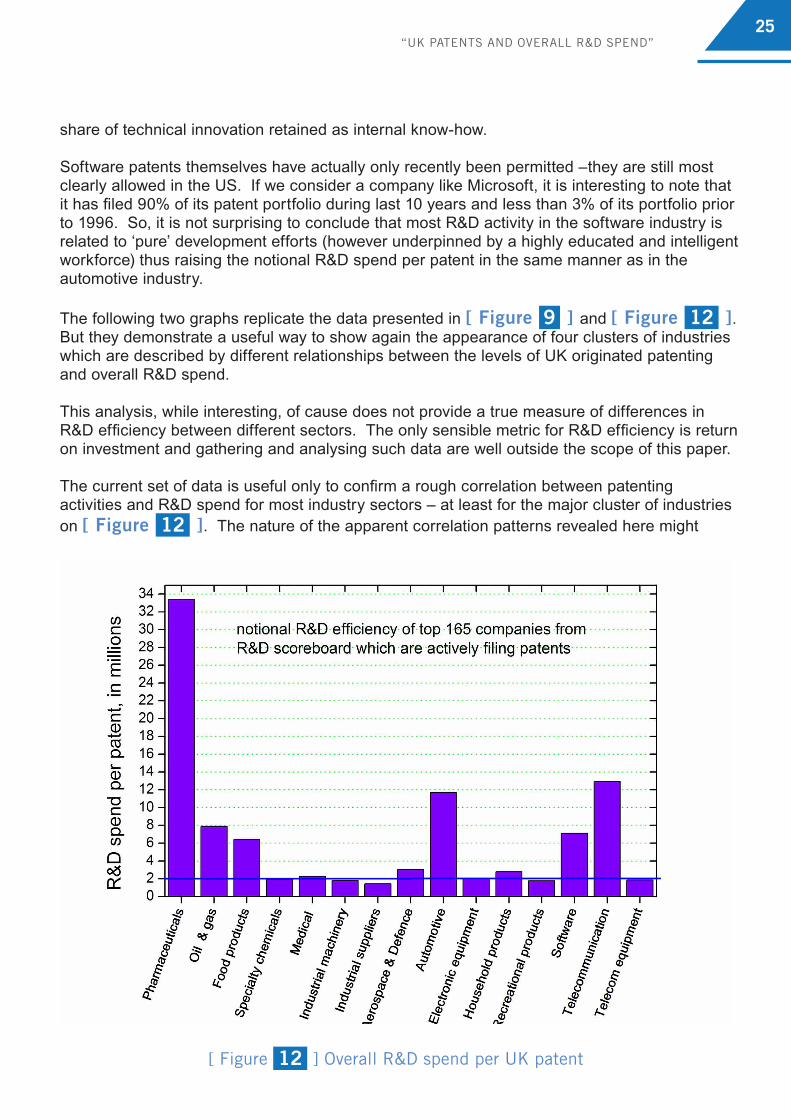
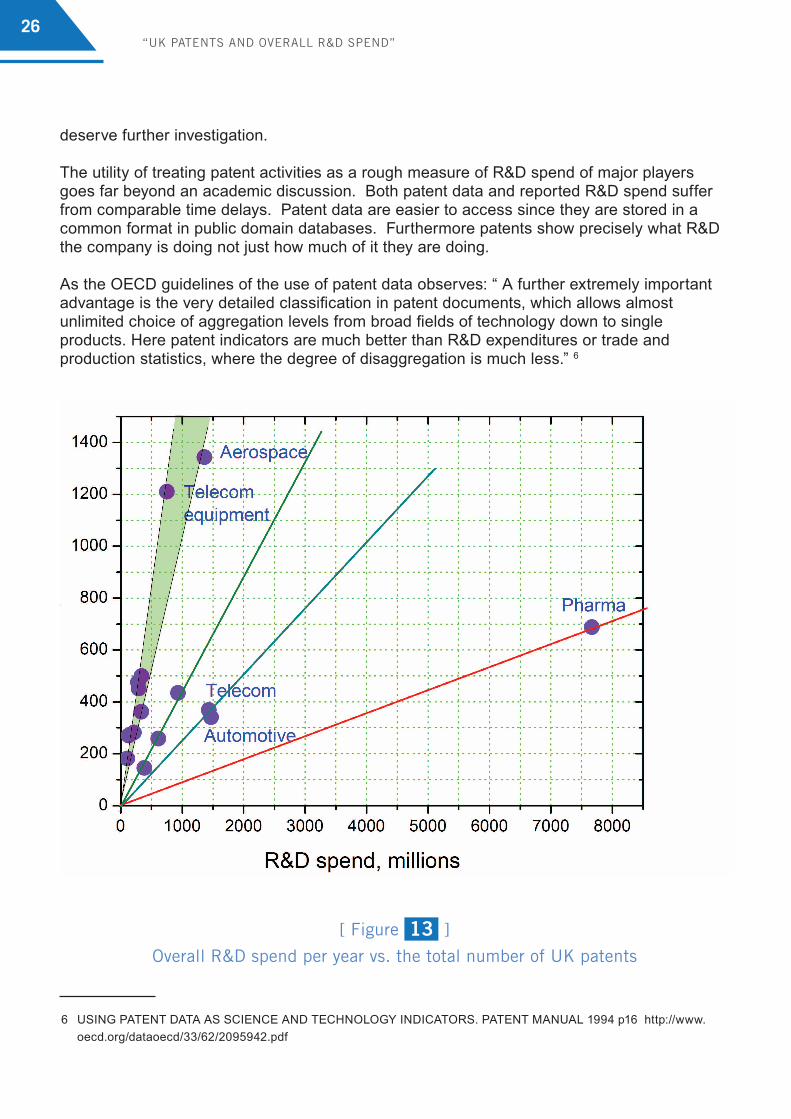
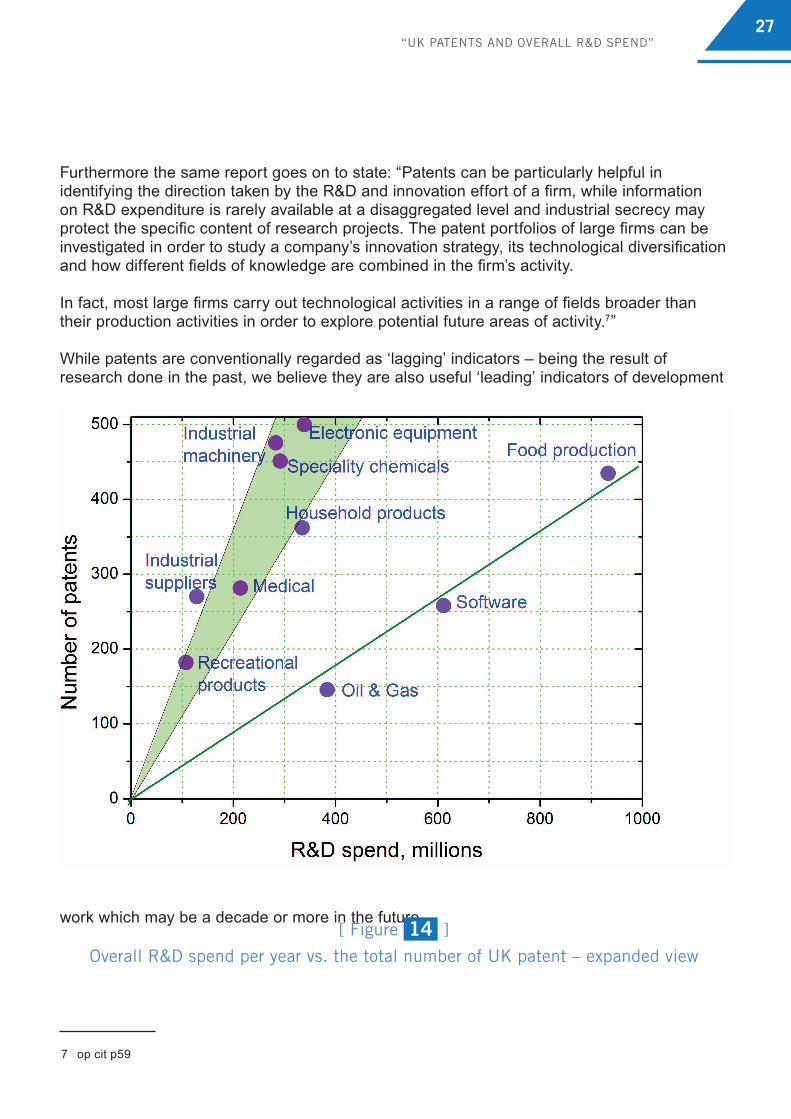
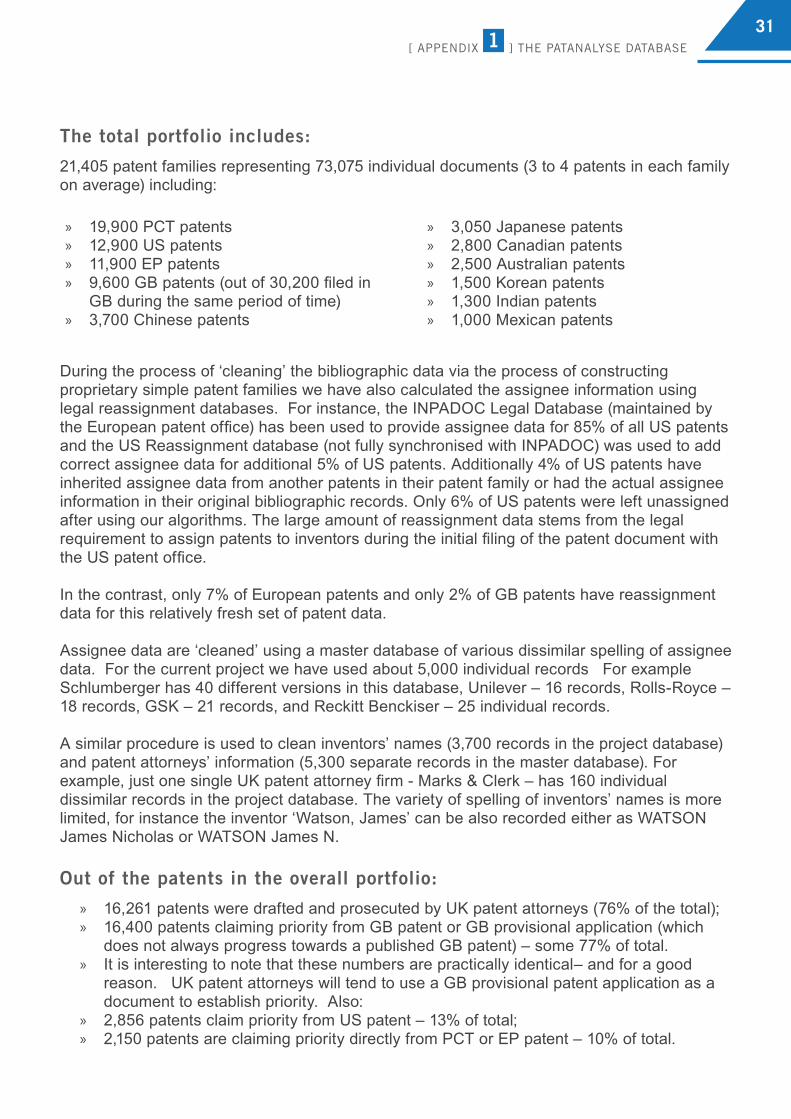