extreme rainfall analysis on the december 2014 flood,...
TRANSCRIPT
265
Extreme Rainfall Analysis on the December 2014 Flood, Pahang Mohd Azhar Bin Alias1,a* and Nor Eliza Binti Alias1,b
1Faculty of Civil Engineering, Universiti Teknologi Malaysia, Malaysia [email protected]
Keywords: Rainfall, Inverse Distance Weighted (IDW), flood Abstract. Extreme rainfall can be the main factor for natural disaster. Flood could occur due to the extreme rain such as the December 2014 flood event in Pahang. The objective of this study is to analyze the rainfall distribution pattern based on rain gauge stationsin Pahang (15 – 29 December 2014). The analysis uses 94 rainfall stations. The rainfall depth spatial pattern uses Inverse Distance Weighted (IDW) and Kriging spatial interpolation technique via ArcGis 10.1.2 software. With the application of ArcGis 10.2.1, spatial analysis of the computed extreme rainfall was able to be conducted. Then, the comparisons of rainfall event of December 2014 with historical rainfall of 25 years record were carried out. 9 areas (e.g Kg. Kedaik, Sg. Kepasing, Temeris, JKR Kg. Manchis, Kampung Batu Gong, Kg, Salong, Kg. Merting, Ulu Tekai (A) and Kuala Tahan) were identified as areas having rainfall values exceeding the historical records. IDW and Kriging interpolation method was also used to obtain the spatial distribution of the historical rainfall events. It was found that the extreme rainfall events could contribute to the Pahang December 2014 flood. We can conclude that, the spatial interpolation of both method Kriging and IDW show the rainfall depth pattern over the recent event and varies according to the type of model chosen. Both method does not contrast from originate data outcome of rainfall distribution. The rainfall exceeding historical records can caused flooding in certain areas.
Introduction
The heavy seasonal rains and strong winds have affected most parts of Malaysia during December 2014. The rains caused severe flooding in the East Coast Terengganu, Pahang, and Kelantan states [1]. On 20 December 2014, heavy rains had been pouring non-stop as part of the northeast monsoon and most river in Kelantan, Pahang and Terengganu had reached dangerous level [2]. By 27 December, most roads in Pahang were closed [3]. Thousands of flood victims were located in various relief centers such as in Kuantan (15,072), Jerantut (5,802), Temerloh (4,522), Maran (3,332), Pekan (3,128), Lipis (2,470), Raub (666), Bera (528) and Rompin (40) [3]. Although it is known that flood at the east coast of Peninsular Malaysia is an annual occurrence during the Northeast Monsoon, the magnitude and damage due to the flood are not as high as compared to the recent flood event in which many areas have been submerged. From the public view, the most sensation assumption that were made is the changing of land-use through uncontrolled logging for reforestation, and establishment of industrial timber and oil palm plantations at the upstream of the river. It is known, that the forest at the upstream of river reacts as a reservoir to soak up rain water. However, changing of the land in those areas will contribute to less forested area and increase the run off. This will make flood easier and frequent to form in the lower area normally at the downstream of river in which those areas consist of high population and big cities. The December 2014 flood event which was the worst ever recorded in decades caused millions of ringgit property damage with thousands of people affected and life loss. Therefore, there is a need to study the extreme rainfall during December 2014 which could be the main cause of the Pahang December 2014 flood.
266
Objectives This study aims to analyze the extreme rainfall event occurred during the December 2014 rainfall event which is hypothesized to influence the main or major flood in Pahang using reliable and sufficient amount of rain gauge station data. The analysis includes various cumulative rainfall distribution periods of 1-day, 3-day, 5-day, 7-day, 9-day, 11-day, 13-day and 15-day rainfall. There are specific objectives in this study, which are;-
� To compare historical rainfall against the event rainfall of December 2014 Pahang flood.
� To create rainfall spatial distribution using Inverse Distance Weighted Average (IDW) and Kriging Technique based on rain gauge data.
� To assess the spatial cumulated rainfall depth during the rainfall events of the 15-29 December in Pahang.
Significant of Study The finding of this study will reveal the rainfall distribution pattern of the flood events that occurred over Pahang during December 2014. The information of the rainfall distribution patterns can help in identifying the rainfall characteristics which could be the main cause of the Pahang December 2014 flood. Two interpolation methods were used for developing the spatial rainfall distribution in Pahang. The methods chosen were Kriging and Inverse Distance Weighting (IDW) using ArcGIS software. Kriging requires analysis of a semi-variogram to ascertain which function is necessary to fit the data. At this point, Inverse Distance Weighting (IDW) was chosen for comparison to Kriging method, since no such initial condition is required. The study also compares the rainfall event against historical records, thus identifying how severe and rare the rainfall is during the December 2014 flood.
Literature Review Extreme Rainfall Recent increases in the frequency and intensity of extreme rainfall events have raised concern that human activity might have resulted in an alteration of the climate system. It is believed that rise in both frequency and intensity of extreme rainfall events are the major impacts of global warming [4]. Intense rainfall occurrences in short temporal scales or persistent rainfall over long period of time often lead to massive floods resulting in hazardous situations. Peninsular Malaysia experiences unpredictable rainfall events, which causes havoc, and costs millions of Malaysian ringgit. The increase in massive flood cases, including flash flood and landslides in the last decade, is due to the increase in rainfall intensities [5]. These findings agree with several studies done throughout the Asian region particularly in Malaysia. Increasing trends in both the total amount of rainfall and the frequency of wet days during the northeast monsoon give rise to the increasing trend of rain fall intensity for the period of 1971–2004 [6]. However, both studies have found a significant decrease in the number of wet days during this period. Besides extreme rainfall trends, extreme temperature and dry spell trends are also being studied in some regions. Increasing trends in temperature extremes, particularly a significant increase in the number of warm nights and heat waves with much longer dry spells interspersed with periods of increased extreme precipitation over Australia [7]. Spatial Rainfall Distribution A spatial distribution is the arrangement of a phenomenon across the earth's surface and a graphical display of such an arrangement is an important tool in geographical and environmental statistics. A graphical display of a spatial distribution may summarize raw data directly or may reflect the outcome of more sophisticated data analysis. Many different aspects of a phenomenon can be shown in a single graphical display by using a suitable choice of different colors to represent
267
differences. But for hydrology and water resources management, spatial distribution of rainfall is important for variety of applications. Many methods can be interpolated for spatial rainfall distribution but the complexity lies in choosing the one that best reproduces the most accurate data [8]. From rain gauged measurement, spatial rainfall distribution can be constructed by using different interpolation method and have two main group (deterministic and geostatiscal) [9].
Interpolation In the mathematical field of numerical analysis, interpolation is a method of constructing new data point within the range of a discrete set of known data point [9]. The deterministic method are the Inverse Distance Weighting (IDW), which are based on the location of the measured stations and on measured value [10]. Kriging is an example of a group of geostatistical method. Geostatiscal method has capability of producing a prediction surface but also provide some measures of the certainty and accuracy of the predictions. However, geostatistical method can estimate the rainfall values for areas where no rainfall stations exist [11].
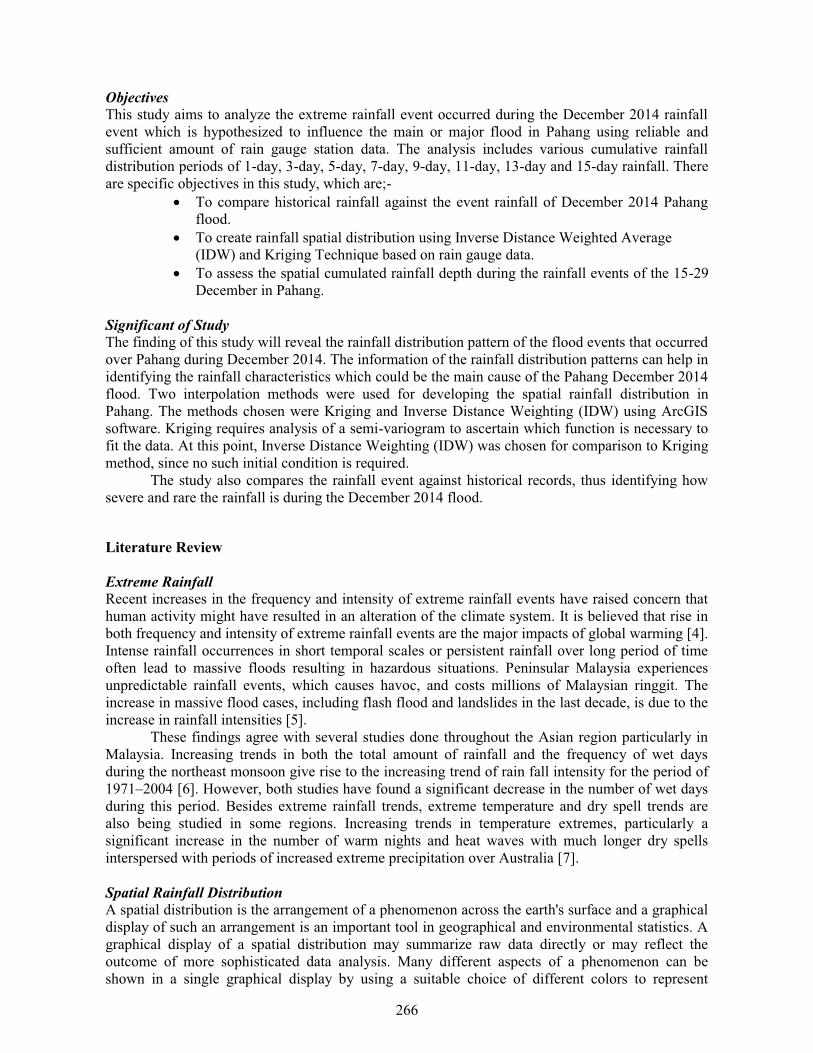
Methodology Spatial Rainfall Distribution Two spatial distributions were plotted. One is the spatial historical maximum rainfall plot and the other is the December 2014 rainfall event plot. Analysis on the spatial event rainfall distribution included a total of 94 rainfall station which consist of Pahang (35), Kelantan (7) and Terengganu (52). While, only a selection of stations were used for the historical plot. Stations with records of more than 25 years were used for the historical maximum rainfall plots. Figure 1 (a) and (b) illustrates the data processing for spatial rainfall distribution for this study. Each interpolation method uses the same datasets.. These spatial interpolation methods have various decision parameters. The techniques used in this study, IDW and Kriging are available in ArcGIS 10.2.1 software.
(a)
268
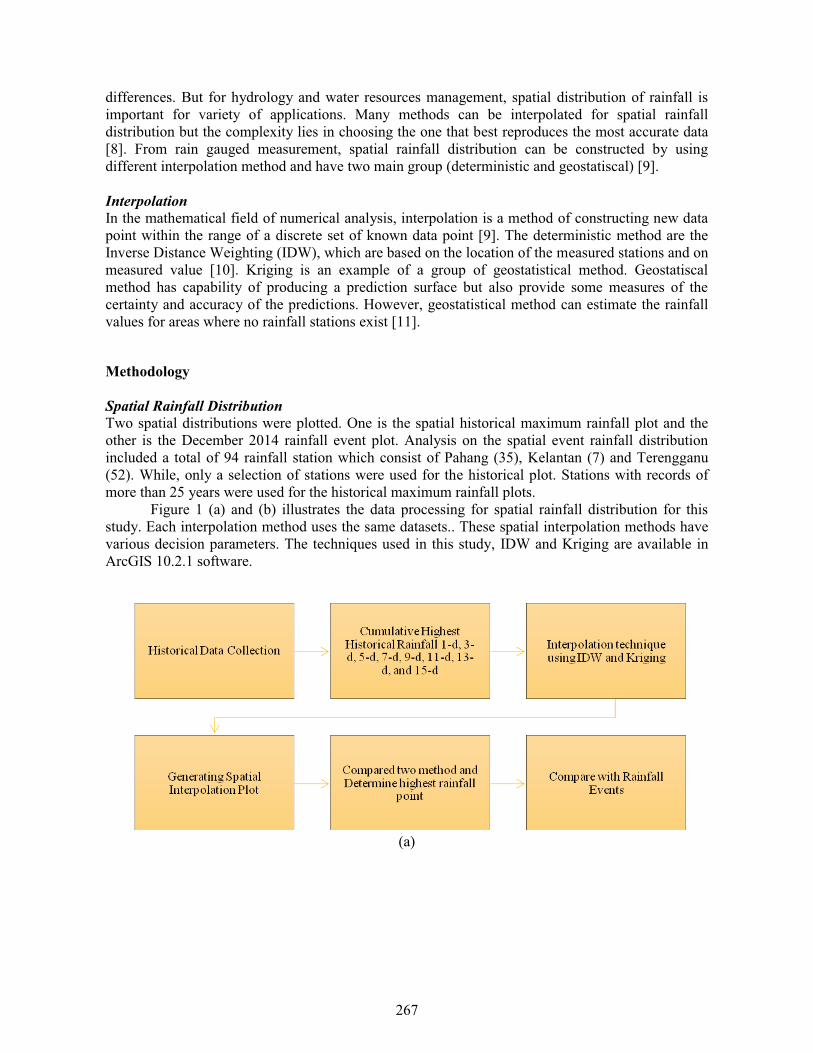
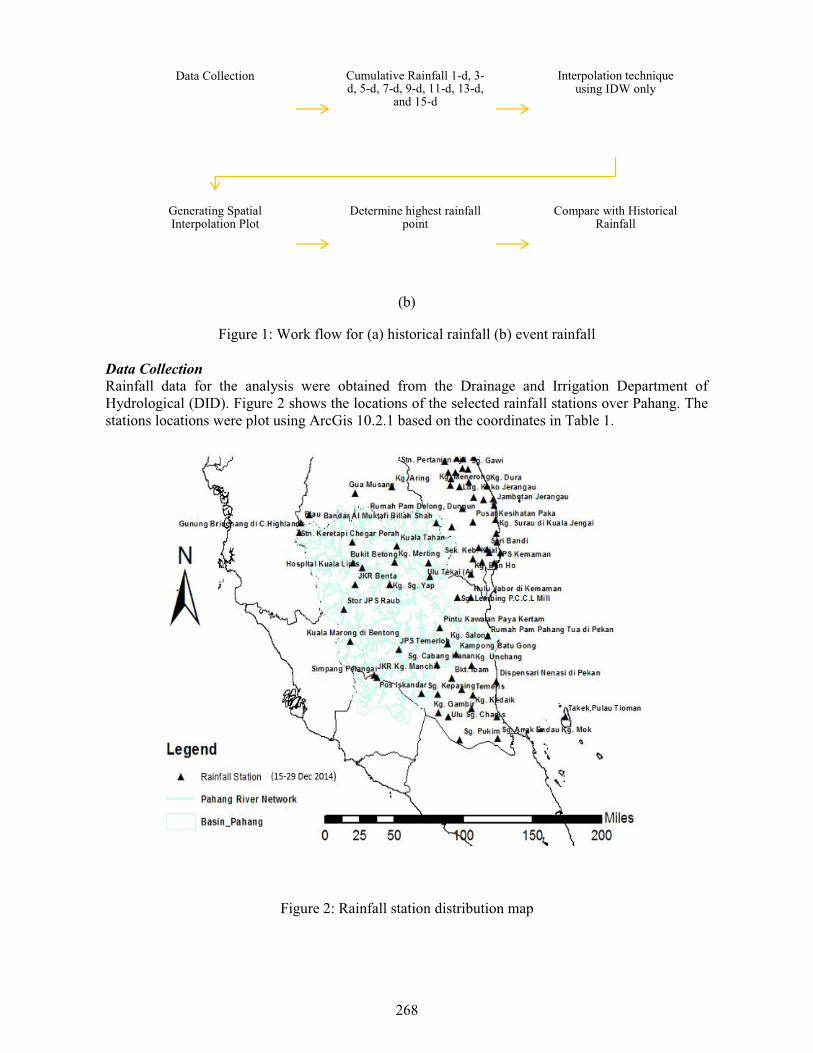
(b)
Figure 1: Work flow for (a) historical rainfall (b) event rainfall Data Collection Rainfall data for the analysis were obtained from the Drainage and Irrigation Department of Hydrological (DID). Figure 2 shows the locations of the selected rainfall stations over Pahang. The stations locations were plot using ArcGis 10.2.1 based on the coordinates in Table 1.
Figure 2: Rainfall station distribution map
Data Collection Cumulative Rainfall 1-d, 3-d, 5-d, 7-d, 9-d, 11-d, 13-d,
and 15-d
Interpolation technique using IDW only
Generating Spatial Interpolation Plot
Determine highest rainfall point
Compare with Historical Rainfall

269
Table 1: The list of rainfall station used for the spatial rainfall distribution
Station no Station name State Latitude Longitude
2630001 Sg. Pukim Pahang 2.603 103.057
2634193 Sg. Anak endau kg. Mok Pahang 2.617 103.458
2828173 Kg. Gambir Pahang 2.85 102.839
2829001 Ulu sg. Chanis Pahang 2.813 102.938
2831179 Kg. Kedaik Pahang 2.889 103.186
2834001 Stn. Pertanian rompin-endau Pahang 2.813 103.45
2841001 Takek,pulau tioman Pahang 2.818056 104.1653
3026156 Pos iskandar Pahang 3.027778 102.6583
3028001 Sg. Kepasing Pahang 3.020833 102.8319
3030178 Pecah batu bkt. Raidan Pahang 3.065278 103.0806
3032167 Temeris Pahang 3.016667 103.1986
3121143 Simpang pelangai Pahang 3.175 102.1972
3129177 Bkt. Ibam Pahang 3.168056 102.9764
3134165 Dispensari nenasi di pekan Pahang 3.1375 103.4417
3221001 Jkr kg. Manchis Pahang 3.202778 102.1625
3228174 Sg. Cabang kanan Pahang 3.298611 102.8222
3231163 Kg. Unchang Pahang 3.2875 103.1889
3330109 Kampong batu gong Pahang 3.390278 103.0264
3424081 Jps temerloh Pahang 3.438889 102.4264
3429096 Kg. Salong Pahang 3.486111 102.9333
3519125 Kuala marong di bentong Pahang 3.5125 101.9153
3533102 Rumah pam pahang tua di pekan Pahang 3.561111 103.3569
3628001 Pintu kawalan paya kertam Pahang 3.633333 102.8556
3818054 Stor jps raub Pahang 3.805556 101.8472
3930012 Sg. Lembing p.c.c.l mill Pahang 3.916667 103.0361
4019001 Jkr benta Pahang 4.033333 101.9667
4023001 Kg. Sg. Yap Pahang 4.031944 102.325
4120064 Hospital kuala lipis Pahang 4.186111 102.0431

270
4127001 Kawasan (b) ulu tekai Pahang 4.105556 102.7531
4219001 Bukit betong Pahang 4.233333 101.9403
4223115 Kg. Merting Pahang 4.243056 102.3833
4227001 Ulu tekai (a) Pahang 4.233333 102.7333
4324001 Kuala tahan Pahang 4.386111 102.4028
4419047 Stn. Keretapi chegar perah Pahang 4.425 101.9333
4513033 Gunung brinchang di c.highlands Pahang 4.516667 101.3833
3933001 Hulu jabor di kemaman Terengganu 3.918056 103.175
4131001 Kg. Ban ho Terengganu 4.133333 103.175
4232002 Jambatan air putih Terengganu 4.270833 103.1986
4232104 Sek. Keb. Pasir gajah Terengganu 4.238889 103.2972
4234109 Jps kemaman Terengganu 4.231944 103.4222
4332001 Jambatan tebak Terengganu 4.377778 103.2625
4333001 Seri bandi Terengganu 4.3625 103.3472
4333096 Klinik bidan di kg. Ibok Terengganu 4.327778 103.3681
4334094 Sek. Keb. Kijal Terengganu 4.331944 103.4875
4434093 Sek. Men. Keb. Badrul alam shah Terengganu 4.427778 103.4514
4529001 Rumah pam paya kempian, pasir raja Terengganu 4.568056 102.9792
4534092 Sek. Keb. Kerteh di kemaman / paya labuhan, kemaman
Terengganu 4.508333 103.4444
4631001 Bandar al muktafi billah shah Terengganu 4.603333 102.8186
4634085 Pusat kesihatan paka Terengganu 4.613889 103.1986
4730002 Kg. Surau di kuala jengai Terengganu 4.636111 103.4375
4734079 Sek. Men. Sultan omar di dungun Terengganu 4.734722 103.0875
4832011 Jambatan jerangau Terengganu 4.7625 103.4194
4833078 Rumah pam delong, dungun Terengganu 4.843056 103.2042
4834001 Klinik bidan di kuala abang Terengganu 4.816667 103.3097
4929001 Kg.embong sekayu di ulu terengganu Terengganu 4.827778 103.4167
4930038 Kg. Menerong Terengganu 4.952778 102.9667
4931061 Ldg. Koko jerangau Terengganu 4.938889 103.0611
4933001 Klinik bidan di jambu bongkok pindah ke sek men Terengganu 4.977778 103.1583

271
keb jambu bongkok
5029034 Kg. Dura Terengganu 4.943056 103.3486
5029035 Sek. Keb. Kg. Dusun di k. Brang Terengganu 5.066667 102.9417
5030039 Hospital k. Brang / jba kuala brang (dipindahkan ke jps.hulu trg.)
Terengganu 5.008333 102.9694
5031062 Kg. Bukit diman ulu terengganu Terengganu 5.070833 103.0139
5128001 Sg. Gawi Terengganu 5.098056 103.1472
5129040 Rumah pam paya rapat Terengganu 5.172222 102.9014
5130063 Stn. Pertanian ajil Terengganu 5.102778 103.0903
5131064 Sek. Men. Bkt. Sawa Terengganu 5.191667 103.1
5230041 Sek. Keb. Kuala telemong Terengganu 5.202778 103.0319
5230042 Rumah pam pulau musang Terengganu 5.294444 103.0958
5232065 Sek. Keb. Marang (pindah ke sek. Men. Tg. Lela segara) pindah ke star kanan
Terengganu 5.208333 103.2069
5328002 Bkt. Durian di chalok-site 3 Terengganu 5.390278 102.8236
5328043 Kg. Bkt. Berangan di setiu Terengganu 5.316667 102.8389
5328044 Kg. Sg. Tong Terengganu 5.355556 102.8861
5330046 Sek. Keb. Kg. Gemuroh Terengganu 5.35 103.0139
5331048 Setor jps kuala terengganu Terengganu 5.318056 103.1333
5424001 Kg. Keruak di ulu besut (sek. Keb. Keruak) Terengganu 5.483333 102.4917
5426001 Kg.hulu seladang, setiu Terengganu 5.476389 102.675
5428025 Sek. Keb. Kg. Rahmat Terengganu 5.465278 102.8056
5430049 Kg. Padang maras di kuala terengganu Terengganu 5.429167 103.0403
5524001 Kg. La Terengganu 5.530556 102.4833
5527024 Stesen kg banggol Terengganu 5.561111 102.7722
5529027 Kg. Merang Terengganu 5.531944 102.9514
5624001 Empangan jajar Terengganu 5.674833 102.49
5625003 Ibu bekalan sg. Angga, ulu besut Terengganu 5.6 102.5153
5625011 Sek. Keb. Kg. Jabi Terengganu 5.679167 102.5639
5626001 Institut pertanian besut Terengganu 5.643056 102.6222
5724003 Jambatan jertih Terengganu 5.739722 102.4931

272
5725006 Klinik kg. Raja di besut / sek. Men. Keb. Pengkalan nyireh
Terengganu 5.797222 102.5653
5726013 Sek. Keb. Kg. Tembila di besut Terengganu 5.740278 102.6083
4614001 Brook Kelantan 4.67639 101.4847
4717001 Blau Kelantan 4.6 101.4
4819027 Gua musang Kelantan 4.879 101.969
4923001 Kg. Aring Kelantan 4.938 102.353
5322044 Kg. Laloh Kelantan 5.3083 102.275
5723056 Telusan Kelantan 5.7583 102.3222
5923081 Tok ajam Kelantan 5.9042 102.3819
Data Processing Hourly rainfall data for December 2014 and historical was converted to daily data. Afterwards, the data was processed using Microsoft Excel to make it into the maximum 1-day and cumulative maximum 3-day, 5-day, 7-day, 9-day, 11-day, 13-day and 15-day for the event (December 2014) rainfall. While, the historical data was sorted out using MATLAB programming software to find the highest maximum 1-day and cumulative maximum 3-day, 5-day, 7-day, 9-day, 11-day, 13-day and 15-day from 1985 until 2013.
Results and Discussion Highest Historical Rainfall Distribution The stations used for the highest historical rainfall analysis are shown in Figure 3. The plots are based on the datasets in table 1. The data was interpolated based on more than 25 years historical record using IDW and Kriging method. Results are shown in figure 4 (a) to (p). The highest receiving rainfall for maximum 1-day was Kawasan (B) Ulu Tekai rain station (1511.5 mm) and Sg. Cabang Kanan rain station (621.5 mm). Kawasan (B) Ulu Tekai also has the highest recorded rainfall for other rainfall periods of 3-day, 5-day, 7-day, 9-day, 11-day, 13-day and 15-day. Comparison of two different spatial distribution IDW and Kriging shows the same general pattern of rainfall distribution but slightly different amount of rainfall and cumulated rainfall depth (mm). Comparison with the rainfall during the December 2014 Pahang flood can be made against historical maximum. Hence the severity of the rainfall during the event can be shown.

273
Figure 3: Location of selected rainfall stations for highest historical record
(a) Max 1-day (IDW) (b) Max 1-day (Kriging)

274
(d) Max 3-day (Kriging) (c) Max 3-day (IDW)
(e) Max 5-day (IDW) (f) Max 5-day (Kriging)
(g) Max 7-day (IDW) (h) Max 7-day (Kriging)

275
(k) Max 11-day (IDW)
(m) Max 13-day (IDW)
(i) Max 9-day (IDW)
(l) Max 11-day (Kriging)
(j) Max 9-day (Kriging)
(n) Max 13-day (Kriging)

276
Figure 4: (a) – (p) Historical maximum rainfall For this particular study, result of Kriging and IDW interpolation shows IDW method is better because IDW did not change the original data. For Kawasan (B) Ulu Tekai rain station for 1-day historical is 1511 mm, this agree with figure 4(a) where the data plotted has the range of 1451-1700 mm. But in figure 4(b) using Kriging interpolation method, Kawasan (B) Ulu Tekai rain station was plotted as in the range of701-900 mm. So, from this Kriging has change the original data. Dispersion of interpolated rainfall depths are focused on the rainfall station when using the IDW as the interpolation method. That is why we can see the concentration of rainfall depths focusing on the rain gauge station itself. On the other hand, Kriging rainfall depths is much dispersing around the area of the interpolated station. Kriging and IDW interpolation has other differences also. IDW interpolation tools used directly based on the surrounding rainfall station to measure the interpolated rainfall depth. While Kriging is much more complex using a mathematical function to a specific number of rainfall station to determine the cumulative rainfall depth for each location. Thus for the next interpolation for determining the Pahang extreme rainfall event on the 15-29 December 2014, method IDW interpolation were used, since it shows better and accurate result.
Extreme Rainfall Event IDW interpolation method were used to see whether the event during the December 2014 Pahang flood exceed the historical flood. The spatial cumulated rainfall depth during the rainfall events of the 15-29 December in Pahang are assessed. That means, the analysis includes various cumulative rainfall distribution periods of 1-day, 3-day, 5-day, 7-day, 9-day, 11-day, 13-day and 15-day. In the 1-day event, heavy rainfall was pouring which are the North-West of Pahang (eg. Stn. Pertanian Rompin-Endau, 350.2 mm) and two station (Kg. Salong and Kuala Tahan station) was exceeding the value of historical rainfall. Comparison can be made to see whether the event rainfall during the December 2014 Pahang flood exceed the historical. Following 3-day event, Kg. Merting at the North-West of Pahang are exceeding the value of historical rainfall (298.6 mm).
(o) Max 15-day (IDW) (p) Max 15-day (Kriging)

277
(a) 1-day (b) 3-day
(c) 5-day (d) 7-day
(e) 9-day (f) 11-day

278
Figure 5 (a) – (h) Spatial distribution using IDW interpolation on the flood event 15 – 29 December 2014
For 5-day event, there were six stations exceeding historical rainfall in the North-East, East and South-East area. The first area is North-East was Kuala Tahan, Ulu Tekai (A) and Kg. Merting with cumulative rainfall of 428.1 mm, 627.1 mm and 363.3 mm exceeding the historical rainfall of 286 mm, 546.5 mm and 363.3 mm respectively. For the east area, Kg. Salong receiving cumulated rainfall of 582.4 mm exceeding historical rainfall of 449.8 mm. Meanwhile, the third area located in South-East area was Kg. Kedaik and Sg. Kepasing, receiving cumulative rainfall for 5-day event of 676.9 mm and 346.1 mm exceeding historical rainfall of 658.5 mm and 321.1 mm respectively. Heavy rainfall continue on moving downwards from North and South side of Pahang. Later on the 15-day event at Ulu Tekai (A) located in North-East area with cumulative rainfall of 1021.1 mm surpassing historical rainfall of 854.6 mm. In Temeris and Kampong Batu Gong also in North-East area, it receives a cumulative rainfall of 867.5 mm and 880.7 mm exceeding historical value of 829 mm and 842.5 mm. Comparison of Highest Historical Rainfall and Rainfall Event In earlier discussion, the comparison between historical rainfall with cumulative rainfall depth has been made and 9 main area identified to exceed historical rainfall are Kg. Kedaik, Sg. Kepasing, Temeris, JKR Kg. Manchis, Kampung Batu Gong, Kg, Salong, Kg. Merting, Ulu Tekai (A) and Kuala Tahan. Table 2 shows the comparison between highest historical rainfall for 25 years and rainfall event for 15-29 December 2014. This comparison has been made using IDW and Kriging interpolation in the previous section. The highlighted area in table 2 show the value of rainfall events exceeding highest historical events. From this, it can be summarized extreme rainfall occurred at these 9 areas could be the cause of flood during Pahang December 2014 flood.
(h) 15-day (g) 13-day

279
Table 2: Comparison of historical rainfall and cumulative rainfall depth
Station name 1-day Historical
(mm)
1-day Event (mm)
3-day Historical
(mm)
3-day Event (mm)
5-day Historical
(mm)
5-day Event (mm)
7-day Historical
(mm)
7-day Event (mm)
Kg. Kedaik 430.5 246.9 608.5 524.1 658.5 676.9 674.5 729.5
Sg. Kepasing 181 151.1 286.1 256.8 321.1 346.1 345.3 380.5
Temeris 335.2 274.5 572.6 558.3 632 623.5 787.6 661.1
JKR Kg. Manchis
54.7 41.3 89.5 65.5 115.9 94.7 132 122.6
Kampong Batu Gong
305 237.6 484.2 447.1 601 562 763.5 616.4
Kg. Salong 203.7 212.7 341.3 442.5 449.8 582.4 536.4 623.3
Kg. Merting 151.5 142.9 279.3 298.6 280.3 363.3 284.8 414
Ulu Tekai (A) 310.5 250.2 416 534.6 546.5 627.1 662.5 722.9
Kuala Tahan 175.5 193.1 283.5 395.2 286 428.1 325.2 494.2
Station name 9-day Historical
(mm)
9-day Event (mm)
11-day
Historical (mm)
11-day
Event (mm)
13-day
Historical (mm)
13-day
Event (mm)
15-day
Historical (mm)
15-day
Event (mm)
Kg. Kedaik 721 841.2 753 857.8 814 894.2 835 904.8
Sg. Kepasing 356 442.9 434.1 443.8 444.8 444.3 463.7 455.8
Temeris 824.4 798.6 826.3 813.7 827.3 825.4 829.8 867.5
JKR Kg. Manchis 151 139.5 151.8 171.1 183.1 175.7 219.6 177.9
Kampong Batu Gong
770.5 743.9 796 770.8 803 779.8 842.5 880.7
Kg. Salong 593.4 738 640 757.1 640.5 765.6 640.5 856.7
Kg. Merting 336 480.6 346 517.2 379.8 518 423.9 567
Ulu Tekai (A) 741.6 785.1 792.5 905.8 803.7 918 854.6 1020.1
Kuala Tahan 339.5 537.2 355.3 604.9 438.7 608.1 451.2 664.2
Topography and River Flooding occurs most commonly from heavy rainfall when natural watercourses do not have the capacity to convey excess water. However, floods are not directly caused by heavy rainfall. They can result from other influences such as topography and river location. During flood December 2014 Pahang, areas flooded were influenced by the topography. Heavy rainfall at higher area will flow to the lower area. Figure 6 shows the flood area having lower elevation. They are Kg. Kedaik, Sg. Kepasing, Temeris, JKR Kg. Manchis, Kampung Batu Gong, Kg, Salong, Kg. Merting, Ulu Tekai (A) and Kuala Tahan.

280
Figure 6: Area flood during December 2014 Pahang.
Figure 7 shows the main river in Pahang. Stations nearby to Sungai Pahang were flooded (e.g. Kuala Tahan, Ulu Tekai (A), Kg. Merting, Kg. Salong, Kampung Batu Gong and JKR Kg. Manchis). While stations near Sungai Rompin; stations Temeris, Sg. Kepasing and Kg. Kedaik were also flooded. Flooding often occurs in lowlands. This is because rivers flow more slowly in low-lying areas. If the water volume increases suddenly, floods occur. Heavy rainfall raises the water level. When the water level is higher than the river bank or the dams, the water overflowfrom the river, causing flooding.
Figure 7: River in Pahang state

281
Conclusion
Extreme rainfall can be the main factor leading to natural disasters such as flood especially during the December 2014 flood event in Pahang. Besides, topography and location of river also influence flood event in Pahang. The objective of this study is to analyze the rainfall distribution pattern based on extreme rainfall in Pahang (15 – 29 December 2014) using rain gauge stations. From the analyses of the rainfall pattern, more than 90 rainfall stations were used. The rainfall depth pattern were developed using Inverse Distance Weighted (IDW) and Kriging spatial interpolation technique via ArcGis 10.1.2 software. With the application of ArcGis 10.2.1, spatial analysis of the computed extreme rainfall was able to be conducted. Then, the comparison of rainfall event of December 2014 with historical rainfall of 25 years record was carried out. 9 areas (e.g Kg. Kedaik, Sg. Kepasing, Temeris, JKR Kg. Manchis, Kampung Batu Gong, Kg, Salong, Kg. Merting, Ulu Tekai (A) and Kuala Tahan) were identified as values of rainfall event exceeding the values of historical events. IDW and Kriging interpolation method were also used to get the spatial distribution of historical events. However to get the cumulative rainfall event for December 2014 flood in Pahang, IDW interpolation method was only used. When using ArcGis 10.2.1 software, method IDW interpolation is more accurate than method Kriging interpolation. For this particular study, IDW were seen to be more accurate. IDW method can be become good tools for engineers to understand and analyze extreme rainfall event using interpolation to construct spatial distributions of the rainfall. Meanwhile the results presented here may benefits for many local agencies partners such as state and country civil defense or state department of land and natural resources who are concerned with flood and relevant policy making. In future study, if the extreme rainfall statistics from the presented study were merged with other geographic information system data layer like historical damage and land use, then it would be possible to update the state flood risk management.
References [1] Information on http://reliefweb.int/report/malaysia/malaysia-seasonal-floods-2014-information-bulletin-n-1
[2] Information on http://www.thesundaily.my/news/1272390
[3] Information onhttp://www.thestar.com.my/news/nation/2014/12/27/floods-central-pahang-on-high-alert/
[4] Sen Roy, S., A Spatial Analysis of Extreme Hourly Precipitation Patterns in India, International Journal of Climatology. 29(3) 2009 345–355.
[5] Suhaila, J., Deni, S.M., Zin, W.Z.W. and Jemain, A.A., Trends in Peninsular Malaysia Rainfall Data during the Southwest Monsoon and Northeast Monsoon Seasons: 1975–2004, Sains Malaysiana. 39(4) 2010 533–542.
[6] Zin, W.Z.W., Jamaludin, S., Deni, S.M. and Jemain, A.A., Recent changes in extreme rainfall events in Peninsular Malaysia: 1971–2005, Theoretical and Applied Climatology. 99(3-4) 2010 303-314.
[7] Alexander, L.V. and Arblaster, J.M., Assessing Trends in Observed and Modelled Climate Extremes Over Australia in Relation to Future Projections, International Journal of Climatology. 29(3) 2009 417–435.
[8] Caruso, C. and Quarta, F., Interpolation Method Comparison, Computers & Mathematics with Applications. 35(12) 1998 109-126.
282
[9] Ly, S., Charles, C. and Degre, A. Different Methods for Spatial Interpolation of Rainfall Data for Operational Hydrology Modeling at Watershed Scale: A Review, Biotechnology Agronomy Society and Environment. 17(2) 2013 392-406.
[10] Dirk, K.N., Hay, J.E., Stow, C.D. and Harris, D., High Resolution Studies of Rainfall on Norfolk Island. Part 2: Interpolation of Rainfall Data, Journal of Hydrology. 208(3-4) 1998 187-193.
[11] Suhaila, J. and Hanisah, S., Spatial Interpolation on Rainfall Data Over Peninsular Malaysia Using Ordinary Kriging, Jurnal Teknologi (Sciences & Engineering). 63(2) 2013 51–58.