explanatory notes c08 - ministry of statistics and...
TRANSCRIPT
The activity of mining and quarrying covers underground and surface mines, quarries and wells andincludes extraction of minerals and also all the supplemental activities such as dressing andbeneficiation of ores, crushing, screening, washing, cleaning, grading, milling floatation, melting,palletising, topping and other preparations carried out at the mine site whichare needed to render the material marketable.
This section presents data on quantity, value and Index Numbers of Mineral Production in India, whichcovers the entire production in the mining and quarrying sector except those minerals which are declaredas prescribed substances under the Atomic Energy Act, 1962.
The primary sources of the data on production of minerals other than solid and fossil fuels, atomicminerals and minor minerals are the statutory returns submitted by mine owners to the Indian Bureau ofMines(IBM) under provisions of Rule 45 the Mineral Conservation and Development Rules,1988. IBM obtains data oncoal and lignite from the Office of the Coal Controller, Kolkata and that on petroleum and natural gasfrom the Ministry of Petroleum & Natural gas, New Delhi and Sulphur from Fertilizer plants and oil refineries. Statistics relatingto "minor minerals" are collected from State Governments.
Data on Minerals, Metals and Mineral Based Product:Production statistics of natural gas and petroleum (crude) are shown separately for off-shore deposits
These tables present consolidated data on production and value of minerals other than 'atomic minerals' coveredunder Atomic Energy Act, 1962 and are based on the basic data received through the statutory returns submitted bythe mine owners to the Indian Bureau of Mines under Mineral Conservation and Development Rules (MCDR), 1988 framedunder Mines and Minerals Development & Regulation (MMRD)Act, 1957 excepting for coal, lignite, petroleum andnatural gas (utilized) and minor minerals. As regards coal & lignite, Coal Controller's Office, Kolkata provides all the basic informationfor all the States. Data on petroleum and natural gas are received from Ministry of Petroleum and Natural Gas, New Delhiand minor minerals from the various States Governments. Atomic minerals do not fall under the purview of MCDR, 1988 andno data are released for public use on these minerals.
The Index of Mineral Production (base : 1993-94=100) covers all the minerals in the mining and quarrying sectorexcepting, atomic minerals. Minor minerals are also represented in the Index of Mineral Production. The Index includes 67items and these have been classified according to the National Industrial Classification (NIC).In preparing the weighingdiagram for the index in question the gross value added has been taken into account instead of the net value addedwhich was employed for the index released previously.
107
8. MINING
Table 8.1 and 8.2
Table 8.3

108
All Year/State/ Minerals Union Territory _________________ ______________________________________________
Total Total Coal Lignite Total Bauxite Chro- Copper Gold Iron Lead mite Conc. Ore Conc.
1 2 3 4 5 6 7 8 9 10 11 12
1994-95 3746 563 559 4 690 189 22 13 8 276 8
1997-98 3352 575 571 4 612 184 24 11 8 226 8
1998-99 3283 567 562 5 622 182 23 11 8 236 8
1999-00 3210 611 606 5 572 177 21 10 8 214 8
2000-01 3191 596 591 5 565 182 22 8 6 208 9
2001-02 3193 570 564 6 574 181 20 8 3 221 9
2002-03 3145 562 556 6 591 177 20 7 3 242 8
2003-04 3132 562 554 8 612 188 20 6 2 266 6
2004-05 (P) 3168 562 554 8 615 191 20 5 3 270 6
2004-05(P)
State :
Andhra Pradesh 413 66 66 - 30 - - - - 6 -
Arunachal Pradesh - - - - - - - - - - -
Assam 9 6 6 - - - - - - - -
Bihar 10 - - - - - - - - - -
Chhattisgarh 138 54 54 - 22 9 - - - 11 -
Goa 72 - - - 72 3 - - - 62 -
Gujarat 432 3 - 3 91 91 - - - - -
Haryana 2 - - - - - - - - - -
Himachal Pradesh 28 - - - - - - - - - -
Jammu & Kashmir 8 4 4 - - - - - - - -
Jharkhand 303 173 173 - 53 30 - - 1 20 -
Karnataka 235 - - - 95 5 2 - 2 71 -
Kerala 38 - - - 3 3 - - - - -
Madhya Pradesh 335 72 72 - 56 30 - 1 - 6 -
Maharashtra 156 51 51 - 35 12 1 - - 9 -
Manipur - - - - - - - - - - -
Meghalaya 5 1 1 - - - - - - - -
Orissa 240 24 24 - 140 3 17 - - 82 -
Rajasthan 389 3 - 3 11 - - 2 - 3 6
Sikkim 2 - - - 2 - - 2 _ - -
Tamil Nadu 183 2 - 2 5 5 - - - - -
Uttar Pradesh 29 3 3 - - - - - - - -
Uttranchal 28 - - - - - - - - - -
West Bengal 113 100 100 - - - - - - - -
Fuels
MINING
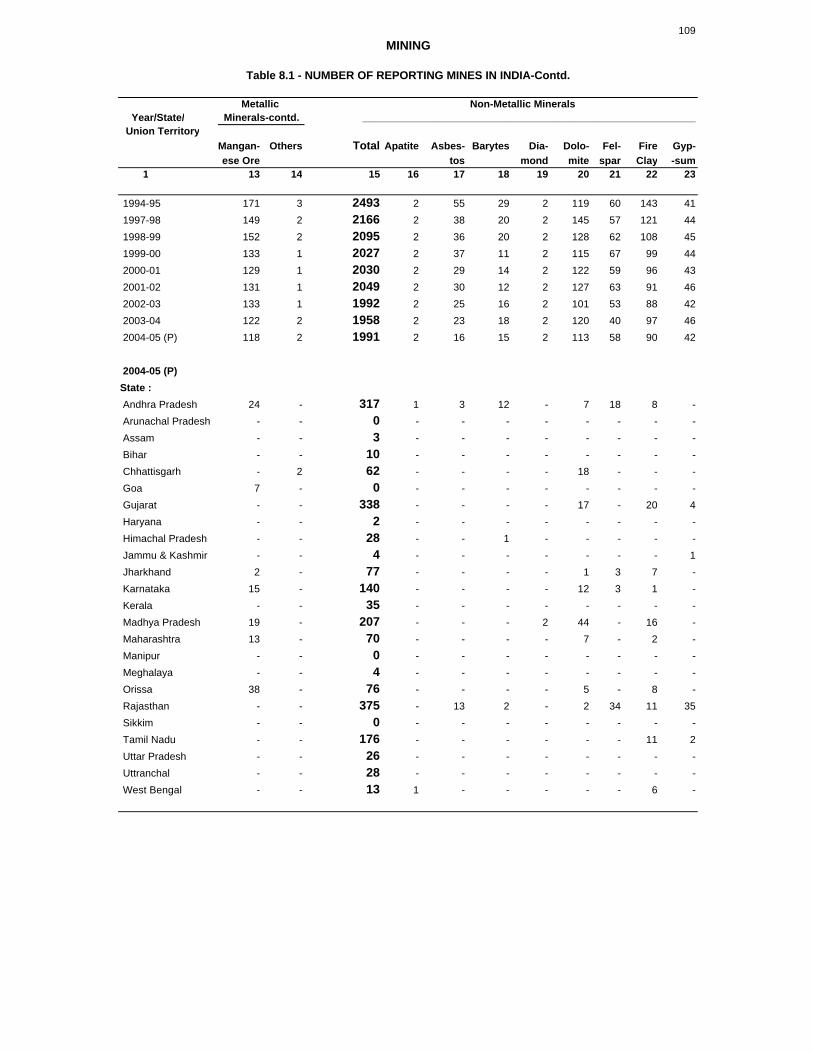
Table 8.1 - NUMBER OF REPORTING MINES IN INDIA
Metallic Minerals
109
Year/State/ Union Territory
Mangan- Others Total Apatite Asbes- Barytes Dia- Dolo- Fel- Fire Gyp-ese Ore tos mond mite spar Clay -sum
1 13 14 15 16 17 18 19 20 21 22 23
1994-95 171 3 2493 2 55 29 2 119 60 143 41
1997-98 149 2 2166 2 38 20 2 145 57 121 44
1998-99 152 2 2095 2 36 20 2 128 62 108 45
1999-00 133 1 2027 2 37 11 2 115 67 99 44
2000-01 129 1 2030 2 29 14 2 122 59 96 43
2001-02 131 1 2049 2 30 12 2 127 63 91 46
2002-03 133 1 1992 2 25 16 2 101 53 88 42
2003-04 122 2 1958 2 23 18 2 120 40 97 46
2004-05 (P) 118 2 1991 2 16 15 2 113 58 90 42
2004-05 (P)
State :
Andhra Pradesh 24 - 317 1 3 12 - 7 18 8 -
Arunachal Pradesh - - 0 - - - - - - - -
Assam - - 3 - - - - - - - -
Bihar - - 10 - - - - - - - -
Chhattisgarh - 2 62 - - - - 18 - - -
Goa 7 - 0 - - - - - - - -
Gujarat - - 338 - - - - 17 - 20 4
Haryana - - 2 - - - - - - - -
Himachal Pradesh - - 28 - - 1 - - - - -
Jammu & Kashmir - - 4 - - - - - - - 1
Jharkhand 2 - 77 - - - - 1 3 7 -
Karnataka 15 - 140 - - - - 12 3 1 -
Kerala - - 35 - - - - - - - -
Madhya Pradesh 19 - 207 - - - 2 44 - 16 -
Maharashtra 13 - 70 - - - - 7 - 2 -
Manipur - - 0 - - - - - - - -
Meghalaya - - 4 - - - - - - - -
Orissa 38 - 76 - - - - 5 - 8 -
Rajasthan - - 375 - 13 2 - 2 34 11 35
Sikkim - - 0 - - - - - - - -
Tamil Nadu - - 176 - - - - - - 11 2
Uttar Pradesh - - 26 - - - - - - - -
Uttranchal - - 28 - - - - - - - -
West Bengal - - 13 1 - - - - - 6 -
Non-Metallic MineralsMetallic Minerals-contd.
Table 8.1 - NUMBER OF REPORTING MINES IN INDIA-Contd.
__________________________________________________________
MINING

110
Year/State/
Union Territory
Kaolin Kyanite Lime Magne- Mica Phosp- Pyrites Salt- Silli- Stea- Vermi- OthersStone site (Crude) horite rock manite tite culite
1 24 25 26 27 28 29 30 31 32 33 34 35
1994-95 173 7 664 17 95 12 2 2 4 209 10 847
1997-98 166 4 543 15 58 10 1 1 4 174 7 755
1998-99 156 3 534 18 54 10 1 1 4 178 6 728
1999-00 154 3 527 16 37 9 1 1 4 153 8 808
2000-01 137 6 544 15 38 9 1 1 4 162 6 740
2001-02 126 6 568 16 33 11 1 1 4 181 4 725
2002-03 117 5 556 19 32 10 - 1 4 186 3 730
2003-04 118 8 552 15 31 8 - 2 4 168 2 702
2004-05 (P) 120 8 571 17 35 8 - 1 4 175 2 712
2004-05 (P)
State :
Andhra Pradesh 11 - 79 - 21 - - - - 33 1 123
Arunachal Pradesh - - - - - - - - - - - -
Assam - - 3 - - - - - - - - -
Bihar - - 5 - 1 - - - - 1 - 3
Chhattisgarh 3 - 37 - - - - - - 1 - 3
Goa - - - - - - - - - - - -
Gujarat 30 - 114 - - - - - - 2 - 151
Haryana - - - - - - - - - - - 2
Himachal Pradesh - - 26 - - - - 1 - - - -
Jammu & Kashmir - - 3 - - - - - - - - -
Jharkhand 16 1 19 - 6 - - - - - - 24
Karnataka 4 3 59 3 - - - - - 1 - 54
Kerala 21 - 1 - - - - - 1 - - 12
Madhya Pradesh 8 - 80 - - 3 - - - 2 - 52
Maharashtra 1 4 28 - - - - - 2 - - 26
Manipur - - - - - - - - - - - -
Meghalaya - - 4 - - - - - - - - -
Orissa 4 - 14 - - - - - 1 2 - 42
Rajasthan 17 - 24 3 7 5 - - - 107 - 115
Sikkim - - - - - - - - - - - -
Tamil Nadu - - 74 9 - - - - - 1 1 78
Uttar Pradesh - - - - - - - - - - - 26
Uttranchal - - 1 2 - - - - - 25 - -
West Bengal 5 - - - - - - - - - - 1
Notes: 1. "All minerals" excludes data for atomic and minor minerals, natural gas and petroleum (crude). 2. Data in respect of Union Terrtiries is nil/negligible.
Source : Indian Bureau of Mines, Ministry of Mines
MINING
Table 8.1 - NUMBER OF REPORTING MINES IN INDIA
Non-Metallic Minerals-Contd.

111
(Value: Rs.'000)All minerals
___________ Year/State/ Union Territory Value Total __________________ __________________ _____________________
** value Quantity Value Quantity Value Quantity Value*** (th.tonne) (th.tonne) (1)
1 2 3 4 5 6 7 8 9
1994-95 307363198 255258079 257770 113521920 19256 7384968 17339 32185800 1997-98 441927997 364977958 296656 177241570 23052 9558436 23168 57076774 1998-99 454075632 372382189 296508 188502640 23419 11118437 25705 59248494 1999-00 523066212 426761654 304103 197413300 22124 10510245 26885 71454117 2000-01 587652535 479010302 313696 203519700 24247 14175382 27860 80702400 2001-02 609308233 493240240 327787 216479600 24813 16951200 28038 81391200 2002-03 647846528 530428948 341272 241873900 26018 17426768 29964 87073200 2003-04 713818869 554806920 361156 258877700 27958 20383610 30908 89658000 2004-05 (P) 750181419 572279591 382137 271568047 30341 21846794 30820 89401200
2004-05 (P)State: Andhra Pradesh 62226082 39534936 35302 33188116 - - 1696 5088000 Arunachal Pradesh 408133 406610 - - - - - - Assam 30999446 30928062 628 919982 - - 2053 3695400 Bihar 8644995 - - - - - - - Chhattisgarh 50458737 37468163 69081 37468163 - - - - Goa 8287991 - - - - - - - Gujarat 54562076 49670357 - - 8226 4509467 3585 10755000 Haryana 1487198 - - - - - - - Himachal Pradesh 762463 - - - - - - - Jammu & Kashmir 232894 15663 24 15663 - - - - Jharkhand 57572357 52483259 78028 52483259 - - - - Karnataka 21094011 - - - - - - - Kerala 2528896 - - - - - - - Madhya Pradesh 51792567 44960726 52683 44960726 - - - - Maharashtra 33471787 28103498 34529 28103498 - - - - Manipur 2866 - - - - - - - Meghalaya 7963014 7830372 5345 7830372 - - - - Mizoram 8847 - - - - - - - Nagaland 1774 - - - - - - - Orissa 58077863 27292362 66080 27292362 - - - - Punjab 51174 - - - - - - - Rajasthan 28732244 1036350 - - 548 403350 211 633000 Sikkim 3040 - - - - - - - Tamil Nadu 23889739 20995847 - - 21567 16933977 628 1884000 Tripura 895534 892800 - - - - 496 892800 Uttar Pradesh 25050867 12061361 16803 12061361 - - - - Uttaranchal 73679 - - - - - - - West Bengal 28018393 27244545 23634 27244545 - - - -
Union Territory: A. & N. Islands 92803 - - - - - - - Chandigarh 45 - - - - - - - D.& N. Haveli - - - - - - - - Daman and Diu 381 - - - - - - - Delhi - - - - - - - - Lakshadweep - - - - - - - - Pondicherry 1624 - - - - - - -
Bombay High 191354680 191354680 - - - - 22151 66453000Pvt. & Joint Vent.Cos. - - - - - - - -
(1) In million cubic metres (Gas Utilised). Note: "All Minerals" excludes the value output of'atomic minerals'. For notes, please refer to next page.**It consists of corresponding figures in col nos.(3),(12),(29) and(68)***It consists of corresponding figures in col nos.(5),(7),(9) and(11)
MINING
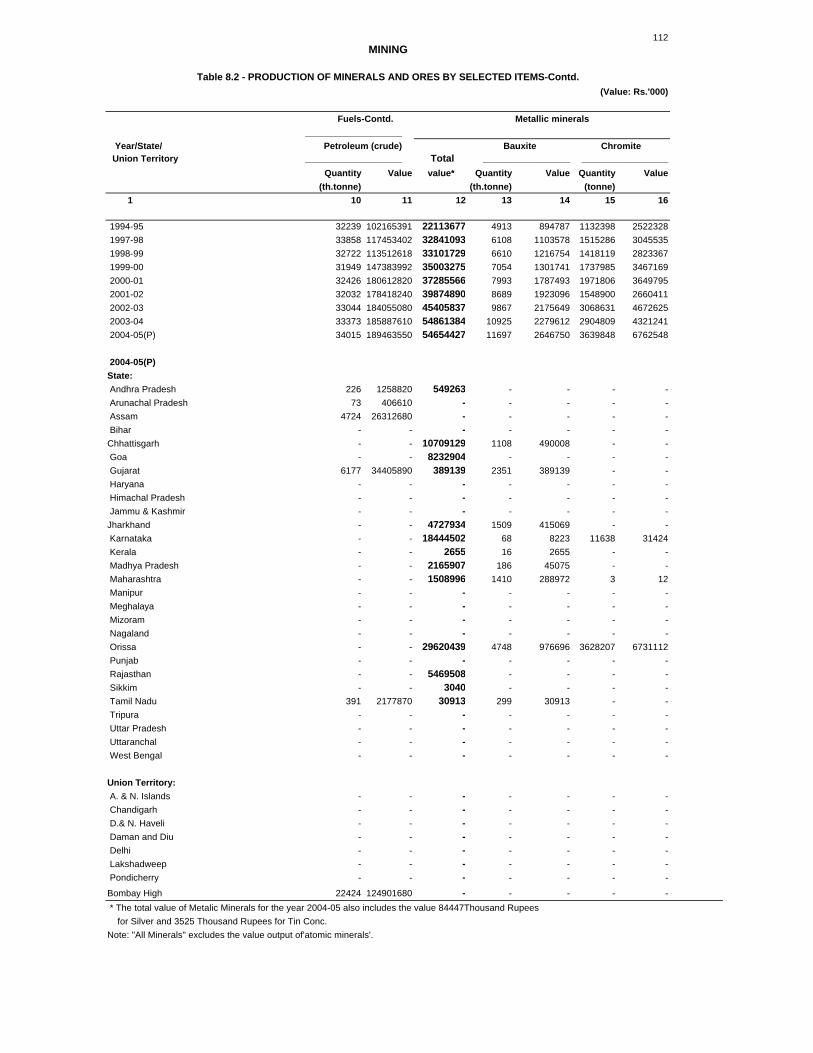
Table 8.2 - PRODUCTION OF MINERALS AND ORES BY SELECTED ITEMS
Fuels
Coal Lignite Natural gas
112
(Value: Rs.'000)
Metallic minerals
Year/State/ Union Territory Total
Quantity Value value* Quantity Value Quantity Value(th.tonne) (th.tonne) (tonne)
1 10 11 12 13 14 15 16
1994-95 32239 102165391 22113677 4913 894787 1132398 2522328 1997-98 33858 117453402 32841093 6108 1103578 1515286 3045535 1998-99 32722 113512618 33101729 6610 1216754 1418119 2823367 1999-00 31949 147383992 35003275 7054 1301741 1737985 3467169 2000-01 32426 180612820 37285566 7993 1787493 1971806 3649795 2001-02 32032 178418240 39874890 8689 1923096 1548900 2660411 2002-03 33044 184055080 45405837 9867 2175649 3068631 4672625 2003-04 33373 185887610 54861384 10925 2279612 2904809 4321241 2004-05(P) 34015 189463550 54654427 11697 2646750 3639848 6762548
2004-05(P)State: Andhra Pradesh 226 1258820 549263 - - - - Arunachal Pradesh 73 406610 - - - - - Assam 4724 26312680 - - - - - Bihar - - - - - - -Chhattisgarh - - 10709129 1108 490008 - - Goa - - 8232904 - - - - Gujarat 6177 34405890 389139 2351 389139 - - Haryana - - - - - - - Himachal Pradesh - - - - - - - Jammu & Kashmir - - - - - - -Jharkhand - - 4727934 1509 415069 - - Karnataka - - 18444502 68 8223 11638 31424 Kerala - - 2655 16 2655 - - Madhya Pradesh - - 2165907 186 45075 - - Maharashtra - - 1508996 1410 288972 3 12 Manipur - - - - - - - Meghalaya - - - - - - - Mizoram - - - - - - - Nagaland - - - - - - - Orissa - - 29620439 4748 976696 3628207 6731112 Punjab - - - - - - - Rajasthan - - 5469508 - - - - Sikkim - - 3040 - - - - Tamil Nadu 391 2177870 30913 299 30913 - - Tripura - - - - - - - Uttar Pradesh - - - - - - - Uttaranchal - - - - - - - West Bengal - - - - - - -
Union Territory: A. & N. Islands - - - - - - - Chandigarh - - - - - - - D.& N. Haveli - - - - - - - Daman and Diu - - - - - - - Delhi - - - - - - - Lakshadweep - - - - - - - Pondicherry - - - - - - -
Bombay High 22424 124901680 - - - - -
* The total value of Metalic Minerals for the year 2004-05 also includes the value 84447Thousand Rupees for Silver and 3525 Thousand Rupees for Tin Conc.Note: "All Minerals" excludes the value output of'atomic minerals'.
MINING
Table 8.2 - PRODUCTION OF MINERALS AND ORES BY SELECTED ITEMS-Contd.
Fuels-Contd.
Petroleum (crude)___________________
___________________
_________________ _________________Bauxite Chromite

113
(Value: Rs.'000)
Metallic minerals-Contd.
Year/State/ Union Territory _______________________ ___________________ __________________ ____________________
Quantity Value Quantity Value Quantity Value Quantity Value(th.tonne) (Kilogram) (th.tonne) (tonne)
( 1 ) ( 1 ) 1 17 18 19 20 21 22 23 24
1994-95 4767 2089190 2373 1140752 64507 11862407 52724 454657 1997-98 223 3859748 2846 1529751 75723 18197018 60881 688445 1998-99 199 3377249 2683 1726935 72230 18559485 62842 705352 1999-00 165 3105642 2586 1557613 77604 19737556 62899 904011 2000-01 164 3243259 2615 1234926 80587 21179513 54487 797994 2001-02 164 2789293 2810 1281082 86226 24969189 52386 649855 2002-03 152 2184409 3153 1658736 99072 29648653 59107 515245 2003-04 143 2067351 3457 1864804 122838 46497470 73069 546210 2004-05(P) 146 1985554 3526 2145243 142711 59883133 81635 669902
2004-05(P)State: Andhra Pradesh - - - - 2680 471282 - - Arunachal Pradesh - - - - - - - - Assam - - - - - - - - Bihar - .. - - - - - -Chhattisgarh - .. - - 23118 10219121 Goa - - - - 22309 8227988 - - Gujarat - - - - - - - - Haryana - - - - - - - - Himachal Pradesh - - - - - - - - Jammu & Kashmir - - - - - - - -Jharkhand - - 25 15545 16087 4294573 - - Karnataka - - 3501 2129698 37176 16014935 - - Kerala - - - - - - - - Madhya Pradesh 81 1197215 - - 201 14431 - - Maharashtra - - - - 554 46407 - - Manipur - - - - - - - - Meghalaya - - - - - - - - Mizoram - - - - - - - - Nagaland - - - - - - - - Orissa - - - - 40567 20592848 - - Punjab - - - - - - - - Rajasthan 64 785333 - - 19 1548 81601 669868 Sikkim - 3006 - - - - 34 34 Tamil Nadu - - - - - - - - Tripura - - - - - - - - Uttar Pradesh - - - - - - - - Uttaranchal - - - - - - - - West Bengal - - - - - - - -
Union Territory: A.& N. Islands - - - - - - - - Chandigarh - - - - - - - - D.& N. Haveli - - - - - - - - Daman and Diu - - - - - - - - Delhi - - - - - - - - Lakshadweep - - - - - - - - Pondicherry - - - - - - - -Bombay High - - - - - - - -
1. Data is for copper ore up to 1996-97
Gold Iron ore Lead concentrate
MINING
Table 8.2 - PRODUCTION OF MINERALS AND ORES BY SELECTED ITEMS-Contd.
Copper Conc.
114
(Value: Rs.'000)
______________________________________________ ____________________________________________ Year/State/ Union Territory ____________________ __________________________ Total ___________________
Quantity Value Quantity Value Value Quantity Value(th.tonne) (Tonne) (Tonne)
1 25 26 27 28 29 30 31
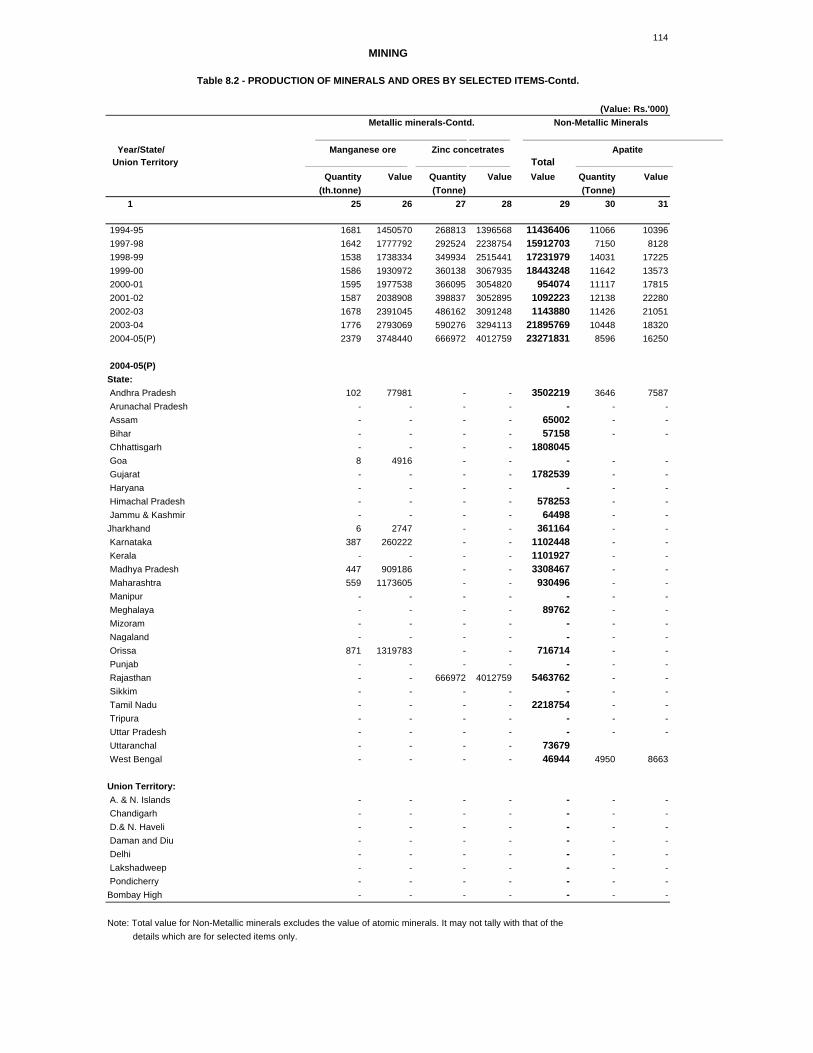
1994-95 1681 1450570 268813 1396568 11436406 11066 10396 1997-98 1642 1777792 292524 2238754 15912703 7150 8128 1998-99 1538 1738334 349934 2515441 17231979 14031 17225 1999-00 1586 1930972 360138 3067935 18443248 11642 13573 2000-01 1595 1977538 366095 3054820 954074 11117 17815 2001-02 1587 2038908 398837 3052895 1092223 12138 22280 2002-03 1678 2391045 486162 3091248 1143880 11426 21051 2003-04 1776 2793069 590276 3294113 21895769 10448 18320 2004-05(P) 2379 3748440 666972 4012759 23271831 8596 16250
2004-05(P)State: Andhra Pradesh 102 77981 - - 3502219 3646 7587 Arunachal Pradesh - - - - - - - Assam - - - - 65002 - - Bihar - - - - 57158 - - Chhattisgarh - - - - 1808045 Goa 8 4916 - - - - - Gujarat - - - - 1782539 - - Haryana - - - - - - - Himachal Pradesh - - - - 578253 - - Jammu & Kashmir - - - - 64498 - -Jharkhand 6 2747 - - 361164 - - Karnataka 387 260222 - - 1102448 - - Kerala - - - - 1101927 - - Madhya Pradesh 447 909186 - - 3308467 - - Maharashtra 559 1173605 - - 930496 - - Manipur - - - - - - - Meghalaya - - - - 89762 - - Mizoram - - - - - - - Nagaland - - - - - - - Orissa 871 1319783 - - 716714 - - Punjab - - - - - - - Rajasthan - - 666972 4012759 5463762 - - Sikkim - - - - - - - Tamil Nadu - - - - 2218754 - - Tripura - - - - - - - Uttar Pradesh - - - - - - - Uttaranchal - - - - 73679 West Bengal - - - - 46944 4950 8663
Union Territory: A. & N. Islands - - - - - - - Chandigarh - - - - - - - D.& N. Haveli - - - - - - - Daman and Diu - - - - - - - Delhi - - - - - - - Lakshadweep - - - - - - - Pondicherry - - - - - - -Bombay High - - - - - - -
Note: Total value for Non-Metallic minerals excludes the value of atomic minerals. It may not tally with that of the details which are for selected items only.
Manganese ore Zinc concetrates Apatite
MINING
Table 8.2 - PRODUCTION OF MINERALS AND ORES BY SELECTED ITEMS-Contd.
Metallic minerals-Contd. Non-Metallic Minerals

115
(Value: Rs.'000)
Year/State/ Union Territory _______________________ ___________________ ___________________ __________________
Quantity Value Quantity Value Quantity Value Quantity Value(Tonne) (Tonne) (carat) (th.tonne)
1 32 33 34 35 36 37 38 39
1994-95 28326 19275 530714 234911 25518 115128 3419 603205 1996-97 27180 21281 381832 214461 31836 220329 3469 704196 1997-98 26034 19277 453073 320433 33898 213176 2991 721134 1998-99 20111 18962 660854 502591 38617 221009 2922 717197 1999-00 18550 20049 360538 154485 40956 213985 2842 684442 2000-01 15397 21132 845001 373251 57407 300687 3032 744306 2001-02 11148 19525 915976 353763 81436 396047 3251 764384 2002-03 14139 17693 679628 252208 84407 396307 3630 900900 2003-04 10107 18907 723075 416153 71260 318107 4051 906090 2004-05(P) 5619 18857 1161332 505308 78315 375621 4309 941994
2004-05(P)State: Andhra Pradesh 795 18088 1156701 502585 - - 879 204853 Arunachal Pradesh - - - - - - - - Assam - - - - - - - - Bihar - - - - - - - -Chhattisgarh - - - - - - 1137 246199 Goa - - - - - - - - Gujarat - - - - - - 84 6778 Haryana - - - - - - - - Himachal Pradesh - - 1014 1318 - - - - Jammu & Kashmir - - - - - - - -Jharkhand - - - - - - 233 151090 Karnataka - - - - - - 280 31888 Kerala - - - - - - - - Madhya Pradesh - - - - 78315 375621 128 11787 Maharashtra - - - - - - 89 10713 Manipur - - - - - - - - Meghalaya - - - - - - - - Mizoram - - - - - - - - Nagaland - - - - - - - - Orissa - - - - - - 1269 251377 Punjab - - - - - - - - Rajasthan 4824 769 3617 1405 - - 210 27309 Sikkim - - - - - - - - Tamil Nadu - - - - - - - - Tripura - - - - - - - - Uttar Pradesh - - - - - - - -Uttaranchal - - - - - - - - West Bengal - - - - - - - -
Union Territory: A.& N. Islands - - - - - - - - Chandigarh - - - - - - - - D.& N. Haveli Daman and Diu - - - - - - - - Delhi - - - - - - - - Lakshadweep - - - - - - - - Pondicherry - - - - - - - -Bombay High - - - - - - - -
MINING
Table 8.2 - PRODUCTION OF MINERALS AND ORES BY SELECTED ITEMS-Contd.
Non-Metallic minerals-Contd.
Asbestos Barytes Diamond Dolomite

116
(Value: Rs.'000)
Year/State/ Union Territory _______________________ ___________________ ___________________ ___________________
Quantity Value Quantity Value Quantity Value Quantity Value (Tonne) (Tonne) (th.tonne) (Tonne)
1 40 41 42 43 44 45 46 47
1994-95 92219 10983 426792 39294 1646 218058 732233 471278 1997-98 112238 15191 450214 48743 2195 313095 790802 478253 1998-99 114948 14678 469721 58928 2267 338254 740542 596680 1999-00 194158 29514 407296 47204 3247 512041 815595 642064 2000-01 179574 24004 487332 55498 2667 440705 872831 760116 2001-02 228735 30670 495752 60011 2859 401457 814759 805165 2002-03 239093 36907 513980 66187 2653 289811 822751 912232 2003-04 332220 54058 657080 87712 2774 312964 896884 982208 2004-05(P) 373212 61065 558716 71751 3555 430538 904989 1052722
2004-05(P)State: Andhra Pradesh 286480 50955 39063 4227 - - 66285 7004 Arunachal Pradesh - - - - - - - - Assam - - - - - - - - Bihar - - - - - - - - Chhattisgarh - - - - - - 2970 367 Goa - - - - - - - - Gujarat - - 98632 6126 - 5 222614 46087 Haryana - - - - - - - - Himachal Pradesh - - - - - - - - Jammu & Kashmir - - - - 34 15827 - - Jharkhand 8009 1005 8463 1025 - - 53310 38056 Karnataka 1816 226 13077 2673 - - 15918 12838 Kerala - - - - - - 310588 898664 Madhya Pradesh - - 58875 4934 - - 15326 1340 Maharashtra - - 8072 605 - - 730 58 Manipur - - - - - - - - Meghalaya - - - - - - - - Mizoram - - - - - - - - Nagaland - - - - - - - - Orissa - - 93872 18707 - - 8005 2082 Punjab - - - - - - - - Rajasthan 73298 8007 129897 22409 3516 413668 142144 15532 Sikkim - - - - - - - - Tamil Nadu 3609 872 40221 3458 4 1038 - - Tripura - - - - - - - - Uttar Pradesh - - - - - - - - Uttaranchal - - - - - - - - West Bengal - - 68544 7587 - - 67099 30694
Union Territory: A. & N. Islands - - - - - - - - Chandigarh - - - - - - - - D.& N. Haveli - - - - - - - - Daman and Diu - - - - - - - - Delhi - - - - - - - - Lakshadweep - - - - - - - - Pondicherry - - - - - - - -Bombay High - - - - - - - -
Non-Metallic minerals-Contd.
MINING
Table 8.2 - PRODUCTION OF MINERALS AND ORES BY SELECTED ITEMS-Contd.
Felspar Fire-clay Gypsum Kaolin(total)

117
(Value: Rs.'000)
Year/State/ Union Territory
Quantity Value Quantity Value Quantity Value(tonne) (th.tonne) (tonne)
1 48 49 50 51 52 53
1994-95 4564 2052 93207 7362124 334487 256157 1997-98 6068 3208 110417 10367500 373520 379984 1998-99 6134 4081 110968 11077239 349852 386127 1999-00 6191 4746 128762 12611150 325764 377830 2000-01 4865 3578 127338 13474522 317763 380172 2001-02 4225 3146 130912 13848395 287985 350526 2002-03 5327 4643 155744 15569625 278267 350404 2003-04 9057 8494 153390 15933681 323977 411592 2004-05(P) 7710 6585 161462 16768728 381327 529723
2004-05(P)State: Andhra Pradesh - - 28601 2656459 - - Arunachal Pradesh - - - - - - Assam - - 422 65002 - - Bihar - - 242 57024 - - Chhattisgarh 14772 1561479 - - Goa - - - - - - Gujarat - - 18166 1723528 - - Haryana - - - - - - Himachal Pradesh - - 7083 573124 - - Jammu & Kashmir - - 201 48671 - - Jharkhand 5446 5272 822 164634 - - Karnataka 1355 624 12897 1030404 26523 23592 Kerala - - 544 162258 - - Madhya Pradesh - - 24938 2879705 - - Maharashtra 909 689 10293 912281 - - Manipur - - - - - - Meghalaya - - 444 89762 - - Mizoram - - - - - - Nagaland - - - - - - Orissa - - 2198 368410 - - Punjab - - - - - - Rajasthan - - 25182 2738436 171 286 Sikkim - - - - - - Tamil Nadu - - 14636 1735565 308808 473493 Tripura - - - - - - Uttar Pradesh - - - - - - Uttranchal - - 21 1986 45825 32352 West Bengal - - - - - -
Union Territory: A. & N. Islands - - - - - - Chandigarh - - - - - - D.& N. Haveli - - - - - - Daman and Diu - - - - - - Delhi - - - - - - Lakshadweep - - - - - - Pondicherry - - - - - -Bombay High - - - - - -
MINING
Table 8.2 - PRODUCTION OF MINERALS AND ORES BY SELECTED ITEMS-Contd.
Non-Metallic minerals-Contd.
Kyanite Lime-stone Magnesite______________________________________________________

118
(Value: Rs.'000)
Year/State/ Union Territory _______________________ __________________ __________________ ______________
Quantity Value Quantity Value Quantity Value Quantity Value(tonne) (tonne) (tonne) (tonne)
1 54 55 56 57 58 59 60 61
1994-95 1988 25662 1096651 1098986 118000 51330 2874 2334 1997-98 1697 23750 1141671 1625562 125474 78919 2801 3288 1998-99 1484 23190 1262238 1917670 88730 93255 2607 3214 1999-00 1807 35325 1191640 1771705 9539 10025 2813 4042 2000-01 1154 26238 1350715 2341330 - - 2530 3585 2001-02 2026 48864 1239414 1876562 - - 2679 4554 2002-03 1232 32833 1201408 1990561 - - 1620 2009 2003-04 1076 24504 1435959 2400731 - - 1813 2248 2004-05(P) 1366 36167 1184351 1967103 - - 3073 3811
2004-05(P)State: Andhra Pradesh 1330 35800 - - - - - - Arunachal Pradesh - - - - - - - - Assam - - - - - - - - Bihar 1 7 - - - - - - Chattishgarh - - ` - - - - - Goa - - ` - - - - - Gujarat - - - - - - - - Haryana - - - - - - - - Himachal Pradesh - - - - - - 3073 3811 Jammu & Kashmir - - - - - - - -Jhharkhand 8 82 - - - - - - Karnataka - - - - - - - - Kerala - - - - - - - - Madhya Pradesh - - 86839 35028 - - - - Maharashtra - - - - - - - - Manipur - - - - - - - - Meghalaya - - - - - - - - Mizoram - - - - - - - - Nagaland - - - - - - - - Orissa - - - - - - - - Punjab - - - - - - - - Rajasthan 27 278 1097512 1932075 - - - - Sikkim - - - - - - - - Tamil Nadu - - - - - - - - Tripura - - - - - - - - Uttar Pradesh - - - - - - - - Uttaranchal - - - - - - - - West Bengal - - - - - - - -
Union Territory: A. & N. Islands - - - - - - - - Chandigarh - - - - - - - - D. N. Haveli - - - - - - - - Daman & Diu - - - - - - - - Delhi - - - - - - - - Lakshadweep - - - - - - - - Pondicherry - - - - - - - -Bombay High - - - - - - - -
Mica (crude) Phosphorite Pyrites Salt (Rock)
Table 8.2 - PRODUCTION OF MINERALS AND ORES BY SELECTED ITEMS-Contd.
Non-Metallic minerals-Contd.
MINING

Non-Metallic minerals-Concld. _______________________________________________________________ Minor*
Year/State/ minerals Union Territory __________________________________________ ___________________ _____________
Quantity Value Quantity Value Quantity Value Value(tonne) (tonne) (tonne)
1 62 63 64 65 66 67 68 1994-95 9982 23574 408754 187457 1475 2024 18555036 1997-98 12458 44875 474541 340476 4699 3368 28196243 1998-99 12123 48089 481554 345489 4274 3773 31359735 1999-00 14938 56306 557112 322120 3123 3315 42264839 2000-01 15498 58688 595909 377485 5003 5074 51012222 2001-02 14720 54319 598366 362937 5097 7031 55805654 2002-03 13290 44832 688135 393672 5499 6483 70867863 2003-04 19729 67697 726398 335126 4493 4686 82254796 2004-05(P) 28761 122559 749969 358520 3273 4529 99975570
2004-05(P)State: Andhra Pradesh - - 54628 13984 1007 677 18639664 Arunachal Pradesh - - - - - - 1523 Assam - - - - - - 6382 Bihar - - 846 127 - - 8587837Chhattisgarh - - - - - - 473400 Goa - - - - - - 55087 Gujarat - - 142 15 - - 2720041 Haryana - - - - - - 1487198 Himachal Pradesh - - - - - - 184210 Jammu & Kashmir - - - - - - 152733Jharkhand - - - - - - - Karnataka - - 1845 203 - - 1547061 Kerala 7157 41005 - - - - 1424314 Madhya Pradesh - - 520 52 - - 1357467 Maharashtra 8475 6150 - - - - 2928797 Manipur - - - - - - 2866 Meghalaya - - - - - - 42880 Mizoram - - - - - - 8847 Nagaland - - - - - - 1774 Orissa 13129 75404 6318 734 - - 448348 Punjab - - - - - - 51174 Rajasthan - - 581151 303555 411 33 16762624 Sikkim - - - - - - - Tamil Nadu - - 3180 509 1855 3819 644225 Tripura - - - - - - 2734 Uttar Pradesh - - - - - - 12989506Uttranchal - - 101339 39341 - - - West Bengal - - - - - - 726904
Union Territory: A. & N. Islands - - - - - - 92803 Chandigarh - - - - - - 45 D.& N. Haveli - - - - - - - Daman & Diu - - - - - - 381 Delhi - - - - - - - Lakshadweep - - - - - - - Pondicherry - - - - - - 1624Bombay High - - - - - - -
value 28426164 thousand Rupees for Agate,BallClay,Calcite,Chalk,Clay(others)*Note: Minor minerals value for 2002-03 also includes value1793589 for 2003-04 also includes value 10912347 for 2004-05 also includes value 28426164 thousand Rupees for Agate,Ball Clay,Calcite,Chalk,Clay(others)
,Corundum,Diaspore,Dunite,Felsite,Flourite(graded),Flourite(conc.),Garnet (abrasive),Garnet Gem,Graphite(r.o.m),Jasper,Laterite,Limekankar,Limeshell,Ochre,Perlite,Pyrophyllite,Pyroxenite,Quartz,Quartzite,Silica Sand,Sand(others), Silver,Shale,Slate,Selenite,Sulphur,Wollastonite.
119
Source : Indian Bureau of Mines, Ministry of Mines
MINING
Table 8.2 - PRODUCTION OF MINERALS AND ORES BY SELECTED ITEMS-Concld. (Value: Rs.'000)
Sillimanite Steatite Varmiculite

0
10000
20000
30000
40000
50000
60000
70000
80000
1994-95 1996-97 1997-98 1998-99 1999-2000 2000-01 2001-02 2002-03 2003-04 2004-05
METALLIC MINERALS NON-METALLIC MINERALS
FUELS MINOR MINERALS
TABLE NUMBER 8.2VALUE OF MINERAL PRODUCTION
(Rs.Crore)

100
120
140
160
180
200
220
240
2000-01 2002-03 2003-04 2004-05
ALL MINERALS COAL PETROLEUM (CRUDE)
METALLIC MINERALS NON-METALLIC MINERALS
TABLE NUMBER 8.3
INDEX OF MINERAL PRODUCTION(QUANTUM INDEX)
(BASE:1993-94=100)