2. rail transport - ministry of statistics and programme...
TRANSCRIPT

77
2. Rail Transport
Delhi Metro

78
2.Rail Transport

79
2.Rail Transport
2. RAIL TRANSPORT
Concepts and Definitions
Panel Interlocking- (PI) is the system used in most medium-sized stations on Indian Railway. In this, the points and signals are worked by individual switches that control them.
Electronic Interlocking/ Electrically operated interlocking-In the more advanced electrical or electronic interlocking schemes, the points and signals are worked from one integrated mechanism in a signal cabin which features a display of the entire track layout with indications of sections that are occupied, free, set for reception or dispatch, etc. The interlocking is accomplished not by mechanical devices but by electrical circuitry -- relays and switches in older electrical or electropneumatic systems, and computerized circuits in the newer electronic systems.
Route Relay Interlocking
As an example, Old Delhi station has an RRI system from Siemens which allows selection from among 1122 possible routes. Central Railway (CR) has a large RRI system at Kurla which controls signals from Ghatkopar to Sion on the Main Line, at Lokmanya Tilak Terminus, and from Chembur to GTB Nagar on the Harbour Line. The first route-relay interlocking system was set up on WR at Churchgate station control tower in the 1950s.
(RRI) - is the system used in large and busy stations that have to handle high volumes of train movements. In this, an entire route through the station can be selected and all the associated points and signals along the route can be set at once by a switch for receiving, holding, blocking, or dispatching trains.
Signalling system- Set of signals, instruments and standards which regulate the railway traffic by means of automatic, manual, optical or sound signalling. For enhancing efficiency and safety in train operation, modern signaling plays a very vital role. Induction of Multi Aspect Color Light signaling (MACLS), Panel Interlocking (PI), Route Relay Interlocking (RRI), Electronic Interlocking (EI), Automatic Block Signaling , Block proving by Axle Counter etc. have resulted in enhancement of safety levels in train operations on IR
Automatic Block System (ABS)- Running system based on the electrical spacing by distance, which enables the automatic performance of the safety operations. The operation of the railway line signals take place without the intervention of operators and the exchange of acknowledgements for the subsequent dispatch of the trains takes place automatically between the relative equipment.
Capital-at-charge- Book value of the capital assets of Railways.

80
2.Rail Transport
Gross earnings- The true earnings in an accounting period whether actually realised or not.
Gross receipts- Earnings actually realised in an accounting period.
Net revenue- Gross traffic receipts minus total working expenses.
Operating ratio- Ratio of working expenses to gross earnings.
Working expenses- Expenditure on administration, operation, maintenance & repairs, contribution to Depreciation Reserve and Pension Funds.
Gross tonne kilometre- Gross tonnage comprising of payload and tare weight hauled by a train.
Tare (pronounced /tεər/) weight - sometimes called unladen weight, is the weight of an empty vehicle or container. By subtracting it from the gross weight (laden weight), the weight of the goods carried (the net weight) may be determined.
Net tonne kilometre- Payload of one tonne carried over one km.
Non-revenue traffic- Traffic conveyed free for working the Railways.
Passenger kilometre- A passenger transported over one km.
Revenue-earning traffic- Traffic which is paid for by the consignor or the consignee.
Route kilometre- The distance between two points on the railway irrespective of the number of lines connecting them, viz. Single line, double line, etc.
Running track kilometre- The length of all running tracks excluding tracks in sidings, yards and crossings.
Track kilometre- The length of all running tracks and tracks including tracks in sidings, yards and crossings.
Train kilometre- Movement of a train over one kilometre.
Vehicle/Wagon kilometre- Movement of a vehicle/wagon over one kilometre.
Number of staff- All employees paid directly by the Railway administration Gauge- Indian Railways uses four rail gauges: 1,676 mm (5 ft 6 in) Broad Gauge (BG) (Indian gauge), 1,000 mm (3 ft 3 3⁄8 in) Metre Gauge (MG) and two Narrow Gauges, 762 mm (2 ft 6 in) and 610 mm (2 ft) .

81
2.Rail Transport
Project Unigauge seeks to standardise the rail gauges in India by converting most of metre gauge tracks and narrow gauges tracks to broad gauge track. Some narrow gauge tracks on which heritage trains run in hilly regions (Simla, Darjeeling, Ooty, Kangra and Matheran) will not be converted. Delhi Metro Rail Corporation has constructed 1,435 mm (4 ft 8 1⁄2 in) Standard Gauge in Delhi and started running metro trains in Delhi city in 2010. Delhi Metro is a separate urban mass rapid transit system not owned by Indian Railways.

82
2.Rail Transport
83
2.Rail Transport
2. RAIL TRANSPORT
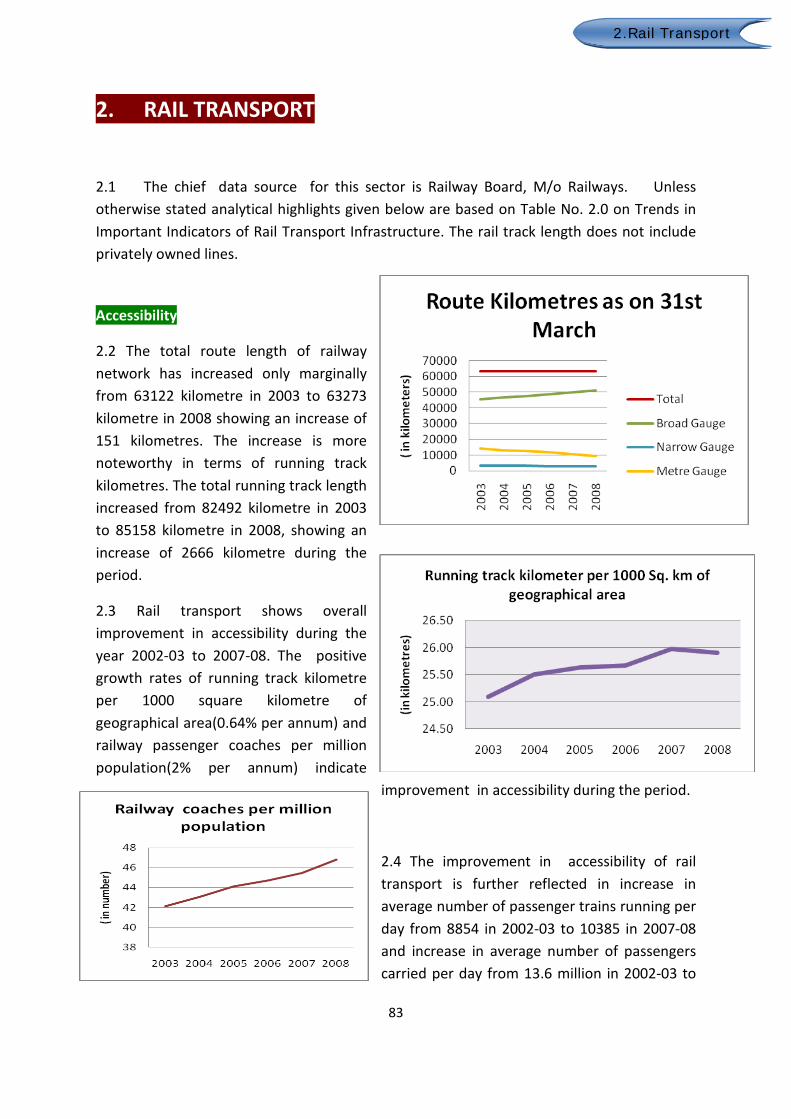
2.1 The chief data source for this sector is Railway Board, M/o Railways. Unless otherwise stated analytical highlights given below are based on Table No. 2.0 on Trends in Important Indicators of Rail Transport Infrastructure. The rail track length does not include privately owned lines. Accessibility
2.2 The total route length of railway network has increased only marginally from 63122 kilometre in 2003 to 63273 kilometre in 2008 showing an increase of 151 kilometres. The increase is more noteworthy in terms of running track kilometres. The total running track length increased from 82492 kilometre in 2003 to 85158 kilometre in 2008, showing an increase of 2666 kilometre during the period.
2.3 Rail transport shows overall improvement in accessibility during the year 2002-03 to 2007-08. The positive growth rates of running track kilometre per 1000 square kilometre of geographical area(0.64% per annum) and railway passenger coaches per million population(2% per annum) indicate
improvement in accessibility during the period.
2.4 The improvement in accessibility of rail transport is further reflected in increase in average number of passenger trains running per day from 8854 in 2002-03 to 10385 in 2007-08 and increase in average number of passengers carried per day from 13.6 million in 2002-03 to

84
2.Rail Transport
17.9 million in 2007-08.
Quality
2.5 Rail travel shows significant improvement in quality in terms of decreasing trend in number of
train accidents, reduction in number of deaths during train accidents, positive growth in electrification of track and gauge conversion from narrow gauge, metre gauge to broad gauge.
2.6 The number of persons killed in train accidents, decreased from 242 in 2003-04 to 191 in 2007-08 showing a negative growth rate of 6% per annum, indicating a reduction in severity of train accidents.
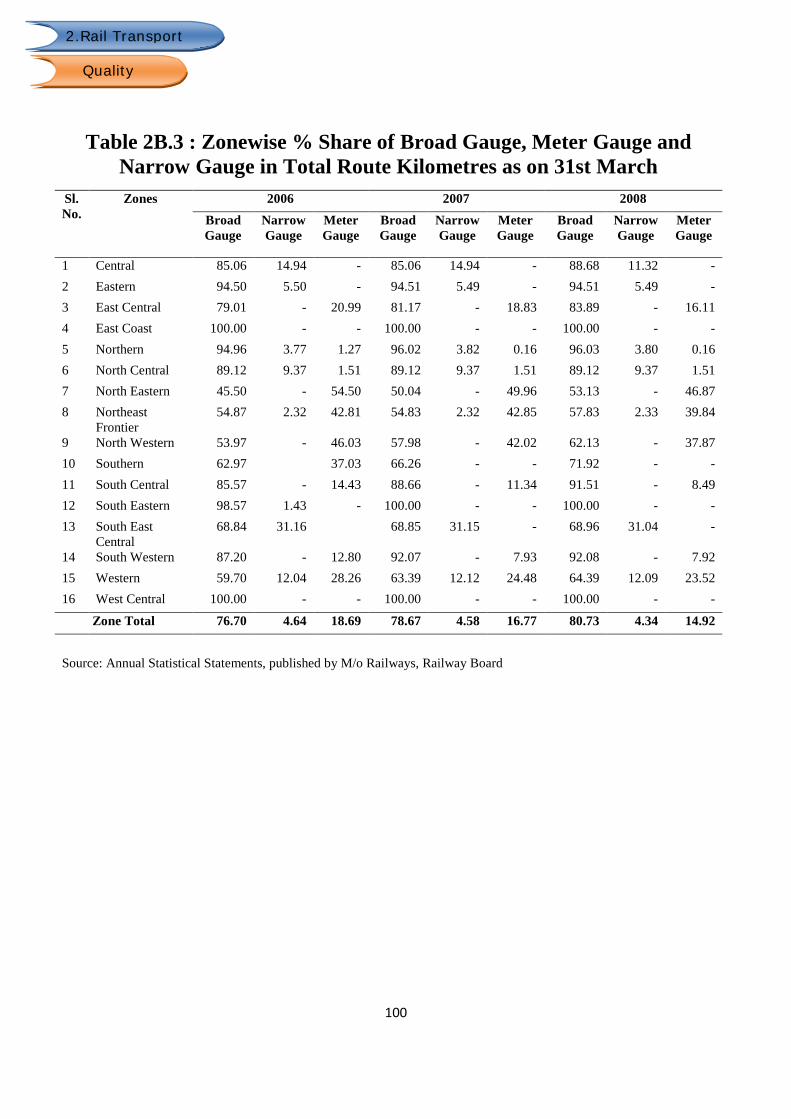
2.7 The percentage share of broad gauge route kilometres in total route kilometres increased from 72% in 2003 to 81% in 2008. In 2007-08, 1549 kilometre of Metre Gauge/Narrow Gauge track was converted to Broad Gauge.
Fiscal Cost
2.8 During 2004-2008 central budgetary support to the sector has grown significantly from `13888 crore to `30618 crore at a CAGR of 22 percent per annum.
2.9 Comparison of gross traffic receipts and total working expenses
shows improveme
nt in profitability of the Indian
Railway during the period. The gross traffic receipts increased from `42905 crore in 2004 to

85
2.Rail Transport
`71720 crore in 2008, while working expenses increased from `39482 crore to `54462 crore during the same period.
Utilisation
2.10 The positive growth rates in passenger kilometre and freight tonne kilometre performed per running track kilometre and per coach/ wagon unit of rolling stock show significant growth in utilisation of rail network and rolling stock.
2.11 Passenger kilometre performed per running track kilometre increased from 62 lakh in 2003 to 90 lakh in 2008. Freight tonne kilometre performed per running track kilometre increased from 43 lakh in 2003 to 61 lakh in 2008. This implies increased utilisation of the rail tracks.
Affordability
2.12 The average railway passenger fare increased only nominally from 24 paise per passenger per kilometre in 2002-03 to 26 paise in 2007-08. The average goods fare increased from 74 paise per tonne per kilometre in 2002-03 to 89 paise in 2007-08. But increases in average passenger fare at CAGR of 1.1% and average freight transport cost at CAGR of 3.7% are lower than inflation rate(Annex - A4) during the period; indicating that
prices in real terms for rail transport have become cheaper.

86
2.Rail Transport

87
2.Rail Transport
Table 2.0 : Trends in Important Indicators of Rail Transport Infrastructure
Sl. No.
Description 2003 2004 2005 2006 2007 2008 CAGR % ( Reference Date / Period
- As on 31st March for Stock Variables - Financial Year ending on 31st March for Flow Variables)
A ACCESS I Route Kilometres as on 31st March (in km) 1 Total 63122 63221 63465 63332 63327 63273 0.05 2 Broad Gauge 45622 46807 47749 48574 49819 51082 2.29 3 Narrow Gauge 3136 3124 3054 2924 2886 2749 -2.60 4 Metre Gauge 14364 13290 12662 11834 10622 9442 -8.05 5 Metro Railway, Kolkata - - - 16.45 16.45 16.45 0 II Running Track Kilometre as on 31st March (in km) 6 Total 82492 83859 84260 84370 85389 85158 0.64 7 Metro Railway, Kolkata (ETKM) Passenger - - - 34.25 34.25 34.25 0 Non-Passenger - - - 27.12 27.12 27.12 0 III Track Kilometre as on 31st March (in km) 8 Total 109221 108486 108804 109808 109996 111599 0.43 9 Metro Railway, Kolkata (ETKM) - - - 61.37 61.37 61.37 0 IV Rail Density 10 Route Kilometre Per 1000 km2 19.20 19.23 19.31 19.27 19.26 19.25 0.05 Per 1000 Population 0.059 0.059 0.058 0.057 0.056 0.055 -1.43 11 Running Track Kilometre Per 1000 km2 25.09 25.51 25.63 25.67 25.98 25.91 0.64 Per 1000 Population 0.078 0.078 0.077 0.076 0.076 0.074 -0.85

88
2.Rail Transport
Accessibility
Table 2.0 (contd.) : Trends in Important Indicators of Rail Transport Infrastructure
Sl. No.
Description 2003 2004 2005 2006 2007 2008 CAGR % ( Reference Date / Period
- As on 31st March for Stock Variables - Financial Year ending on 31st March for Flow Variables)
A ACCESS V Rolling Stock (in numbers) 12 Number of Locomotives Steam 52 45 44 44 43 44 -3.29 Diesel 4699 4769 4807 4793 4816 4843 0.61 Electric 2930 3004 3065 3188 3294 3443 3.28 Total 7681 7818 7916 8025 8153 8330 1.64 13 Railway Passenger Coaches( EMU,
Conventional, DMU/DHMU) 39853 40969 42713 44093 45359 47375 3.52
Passenger Carrying Capacity 3437654 3657433 3766230 3860452 4061230 4234000 4.26 14 Other Coaching Vehicles 4904 5519 5600 5612 5949 6180 4.73 15 Total railway wagons( in units) 214760 227752 222409 207983 207723 204034 -1.02 Population (in thousand) 1062388 1079117 1095722 1112186 1128521 1144734 1.50 16 Railway Coaches per Million
Population 42 43 44 45 45 47 2.12
VI Metro Railway, Kolkata 17 Motor Coaches (in number) Average authorised stock - - - 108 108 108 0 Average number in use daily - - - 72 72 84 8.01 18 Trailer Coaches (in number) Average authorised stock - - - 36 36 36 0 Average number in use daily - - - 24 26 28 8.01 19 Train Units Average authorised stock - - - 36 36 36 0 Average number in use daily - - - 24 26 28 8.01

89
2.Rail Transport
Table 2.0 (contd.) : Trends in Important Indicators of Rail Transport Infrastructure
Sl. No.
Description 2003 2004 2005 2006 2007 2008 CAGR % ( Reference Date / Period - As on 31st March for Stock Variables - Financial Year ending on 31st March for Flow Variables)
B Quality 20 Average Number of Passenger Trains Running per Day
(in number) 8854 9513 8516 8750 10213 10385 3.24
21 Average Number of Passengers Carried per Day (in Million)
13.6 14 14.7 15.7 17 17.9 5.65
22 Number of Stations (in number) 6906 7031 7146 6974 6909 7025 0.34 23 Number of Staff( in thousand) 1471.9 1441.5 1424.4 1412.4 1397.6 1394.5 -1.07 24 Average speed of goods train (km/hour) 24.7 23.3 23.8 25.8 24.9 25.4 0.56 25 Average speed of passenger train (km/hour) (Mail
/Express) 49 46.8 46.9 47.9 48.2 49.1 0.04
VII Track Electrification (%) as on 31st March 26 Route km 25.8 26.5 27.6 28.3 28.1 28.9 2.30 27 Running Track km# 36.34 36.48 38.79 39.75 39.38 40.75 2.32 28 Track km 36.04 38.64 39.86 40.81 40.73 42.38 3.30 VIII Accidents 29 Train Accidents (in number) 349 320 232 233 194 193 -11.17 30 Train Accidents per million train km£ 0.44 0.41 0.29 0.28 0.22 0.21 -13.75 IX Casualties 31 Total Number of Persons Killed - 242 221 315 208 191 -5.74 Injured - 466 303 627 402 406 -3.39
X Gaugewise % Share in Total Route Kilometre 32 Broad Gauge 72.3 74.0 75.2 76.7 78.7 80.7 2.24 33 Narrow Gauge 5.0 4.9 4.8 4.6 4.6 4.3 -2.65 34 Metre Gauge 22.8 21.0 20.0 18.7 16.8 14.9 -8.09 XI Gauge Conversion
35 Track km Converted from MG/NG to BG - - 779 744 1082 1549 25.75

90
2.Rail Transport
Accessibility
Table 2.0 (contd.) : Trends in Important Indicators of Rail Transport
Infrastructure Sl. No.
Description 2003 2004 2005 2006 2007 2008 CAGR % ( Reference Date / Period
- As on 31st March for Stock Variables - Financial Year ending on 31st March for Flow Variables)
C FISCAL COST 36 Gross Traffic Receipts (Rs. in crore) - 42904.94 47370.21 54491.38 62731.50 71720.06 13.71 37 Total Working Expenses (Rs. in crore) - 39482.21 42758.88 45573.53 49046.53 54462.17 8.37 38 Cost of Police and RPF personnel (Rs. in
crore) 782.76 758.38 829.04 970.76 933.36 1112.52 7.28
39 Budget Allocation (Rs. in crore) - 13888 15674.8 18975.8 25646.92 30618.11 21.85 40 Net Expenditure (Rs. in crore) - 13363.92 15371.81 18320.35 25002.08 28980.34 21.35 41 Passenger Revenue$( Rs. in crore) 12540.8 13259.8 14071.4 15080.76 17176.01 19783.25 9.55 42 Freight Revenue^(bulk commodities)(Rs. in
crore) 26231.45 27403.15 30489.23 35534.69 41073.21 46425.49 12.10
XII Metro Railway, Kolkata 43 Passenger Earnings (Rs. in crore) - - - 45.23 48.54 60.92 16.06 D UTILISATION 44 Passengers Carried (in Million) 4971 5112 5378 5725 6219 6524 5.59 45 Passenger Kilometres Carried (in Million) 515044 541208 575702 615614 694764 769956 8.37 46 Freight Carried*(in Million Tonnes) 518.7 557.4 602.1 666.5 727.75 793.89 8.89 47 Freight km Carried*(in Million Tonne km) 353194 381241 407398 439596 480993 521371 8.10 48 Engine hours pertaining to locomotives Steam - - 100 96 98 88 -4.17 Diesel - - 229086 229750 243911 245476 2.33 Electric - - 176645 176505 185565 200520 4.32

91
2.Rail Transport
Table 2.0 (contd.) : Trends in Important Indicators of Rail Transport Infrastructure
Sl. No.
Description 2003 2004 2005 2006 2007 2008 CAGR % ( Reference Date / Period
- As on 31st March for Stock Variables - Financial Year ending on 31st March for Flow Variables)
D UTILISATION 49 Passenger km per Running Track Kilometre (in
Million) 6.24 6.45 6.83 7.30 8.14 9.04 7.69
50 Freight Tonne km per Running Track Kilometre (in Million)
4.28 4.55 4.84 5.21 5.63 6.12 7.41
51 Passenger km Performed per Coach (in Million)
11.51 11.64 11.92 12.39 13.54 14.38 4.55
52 Freight Tonne km Performed per Wagon Unit (in Million)
1.64 1.67 1.83 2.11 2.32 2.56 9.21
XIII Metro Railway, Kolkata 53 Number of Passengers Originating / Carried (in
Million) - - - 107.87 114.85 120.62 5.74
54 Passenger Kilometres (in Million) - - - 998.03 1057.04 1114.05 5.65 E AFFORDABILITY 55 Average Rate per Passenger per Kilometre (in
paise) 24.3 24.5 24.4 24.5 24.7 25.7 1.08
56 Average Rate per Tonne per Kilometre (in paise)
74.3 71.9 74.8 80.8 85.4 89.0 3.70
# Includes track in yards, sidings, crossings at stations etc., * Revenue traffic only $ Excluding earnings by Metro Railway,
Kolkata
^ Excludes 'other goods earnings' such as wharfage,demurrage,etc. £ Excludes Metro and Konkan Railways
Source : 1.Material supplied by M/o Railways, Railway Board 2.Annual Statistical Statements, published by M/o Railways, Railway Board 3.Year Book, published by M/o Railways, Railway Board

92
2.Rail Transport
Accessibility
Table 2A.1: Statewise Route Kilometres as on 31st March (in Km.)
Sl. No.
States / UTs 2003 2004 2005 2006 2007 2008 CAGR %
1 Andhra Pradesh 5197.1 5195.8 5205.1 5185.1 5171.6 5170.4 -0.10 2 Arunachal Pradesh 1.3 1.3 1.3 1.3 1.3 1.3 0 3 Assam 2517.2 2517.2 2505.8 2284.3 2283.7 2283.7 -1.93 4 Bihar 3223.7 3377.1 3379.7 3330.4 3411.0 3406.5 1.11 5 Chhattisgarh 1180.3 1159.0 1159.0 1186.1 1185.5 1185.8 0.09 6 Goa 69.3 69.0 69.0 69.0 69.0 69.0 -0.09 7 Gujarat 5284.8 5282.8 5284.4 5282.9 5308.6 5328.2 0.16 8 Haryana 1554.5 1623.2 1596.9 1595.0 1540.4 1467.1 -1.15 9 Himachal Pradesh 268.7 269.0 285.0 285.0 285.0 285.0 1.19 10 Jammu & Kashmir 96.1 96.1 137.8 137.8 137.8 162.8 11.12 11 Jharkhand 1798.3 1943.1 1941.3 1954.8 1941.3 1965.2 1.79 12 Karnataka 2974.1 2979.9 2982.0 3002.3 3005.8 3005.4 0.21 13 Kerala 1050.2 1050.2 1050.2 1050.2 1050.2 1050.2 0 14 Madhya Pradesh 4824.7 4849.3 4905.2 4903.2 4883.9 4884.2 0.25 15 Maharashtra 5450.0 5496.7 5527.0 5528.0 5519.3 5535.8 0.31 16 Manipur 1.4 1.4 1.4 1.4 1.4 1.4 0 17 Meghalaya 0 0 0 0 0 0 - 18 Mizoram 1.5 1.5 1.5 1.5 1.5 1.5 0 19 Nagaland 12.9 12.9 12.9 12.9 12.9 12.9 0 20 Orissa 2323.6 2283.6 2279.7 2281.5 2246.9 2386.8 0.54 21 Punjab 2101.3 2097.7 2097.7 2133.4 2133.4 2133.4 0.30 22 Rajasthan 5899.8 5834.5 5837.7 5838.0 5911.1 5683.0 -0.75 23 Sikkim 0 0 0 0 0 0 - 24 Tamil Nadu 4184.3 4200.9 4170.9 4170.9 4121.1 4130.7 -0.26 25 Tripura 64.4 64.4 64.4 64.4 64.4 64.4 0 26 Uttar Pradesh 8798.8 8566.3 8545.5 8546.4 8574.8 8553.5 -0.56 27 Uttarakhand 344.9 344.9 344.9 344.9 344.9 344.9 0 28 West Bengal 3680.4 3706.1 3856.1 3910.7 3910.7 3950.8 1.43
State Total 62903.4 63023.8 63242.2 63101.1 63117.4 63063.8 0.05 Union Territories 1 Andaman & Nicobar 0 0 0 0 0 0 - 2 Chandigarh 7.7 7.7 7.7 15.7 15.7 15.7 15.19 3 Dadar & Nagar Haveli 0 0 0 0 0 0 - 4 Daman & Diu 0 0 0 0 0 0 - 5 Delhi 199.7 177.9 204.2 204.2 182.5 182.5 -1.78 6 Lakshadweep 0 0 0 0 0 0 - 7 Puducherry 11.1 11.1 11.1 11.1 11.1 11.1 0
UT Total 218.5 196.8 223.1 231.0 209.3 209.3 -0.86 India Total 63121.9 63220.5 63465.3 63332.1 63326.7 63273.1 0.05
Source: Material supplied by M/o Railways, Railway Board

93
2.Rail Transport
Accessibility
2.Rail Transport
Table 2A.2 : Statewise Route km per 1000 km2 as on 31st March
(in Km.) Sl. No.
States / UTs 2003 2004 2005 2006 2007 2008 CAGR %
1 Andhra Pradesh 18.90 18.89 18.92 18.85 18.80 18.80 -0.10 2 Arunachal Pradesh 0.02 0.02 0.02 0.02 0.02 0.02 0 3 Assam 32.09 32.09 31.95 29.12 29.11 29.11 -1.93 4 Bihar 34.24 35.86 35.89 35.37 36.22 36.18 1.11 5 Chhattisgarh 8.73 8.57 8.57 8.77 8.77 8.77 0.09 6 Goa 18.72 18.64 18.64 18.64 18.64 18.64 -0.09 7 Gujarat 26.96 26.95 26.96 26.95 27.08 27.18 0.16 8 Haryana 35.16 36.71 36.12 36.08 34.84 33.18 -1.15 9 Himachal Pradesh 4.83 4.83 5.12 5.12 5.12 5.12 1.19 10 Jammu & Kashmir 0.43 0.43 0.62 0.62 0.62 0.73 11.12 11 Jharkhand 22.56 24.38 24.35 24.52 24.35 24.65 1.79 12 Karnataka 15.51 15.54 15.55 15.65 15.67 15.67 0.21 13 Kerala 27.02 27.02 27.02 27.02 27.02 27.02 0 14 Madhya Pradesh 15.65 15.73 15.91 15.91 15.84 15.85 0.25 15 Maharashtra 17.71 17.86 17.96 17.96 17.94 17.99 0.31 16 Manipur 0.06 0.06 0.06 0.06 0.06 0.06 0 17 Meghalaya 0 0 0 0 0 0 - 18 Mizoram 0.07 0.07 0.07 0.07 0.07 0.07 0 19 Nagaland 0.78 0.78 0.78 0.78 0.78 0.78 0 20 Orissa 14.92 14.67 14.64 14.65 14.43 15.33 0.54 21 Punjab 41.72 41.65 41.65 42.36 42.36 42.36 0.30 22 Rajasthan 17.24 17.05 17.06 17.06 17.27 16.61 -0.75 23 Sikkim 0 0 0 0 0 0 - 24 Tamil Nadu 32.17 32.30 32.07 32.07 31.69 31.76 -0.26 25 Tripura 6.14 6.14 6.14 6.14 6.14 6.14 0 26 Uttar Pradesh 36.52 35.56 35.47 35.47 35.59 35.50 -0.56 27 Uttarakhand 6.45 6.45 6.45 6.45 6.45 6.45 0 28 West Bengal 41.47 41.76 43.45 44.06 44.06 44.51 1.43
State Total 19.20 19.24 19.30 19.26 19.26 19.25 0.05 Union Territories 1 Andaman &
Nicobar 0 0 0 0 0 0 -
2 Chandigarh 67.89 67.89 67.89 137.72 137.72 137.72 15.19 3 Dadar & Nagar
Haveli 0 0 0 0 0 0 -
4 Daman & Diu 0 0 0 0 0 0 - 5 Delhi 134.63 119.97 137.71 137.71 123.05 123.05 -1.78 6 Lakshadweep 0 0 0 0 0 0 - 7 Puducherry 23.17 23.17 23.17 23.17 23.17 23.17 0
UT Total 19.94 17.95 20.35 21.08 19.09 19.09 -0.86 India Total 19.20 19.23 19.31 19.27 19.26 19.25 0.05

94
2.Rail Transport
Quality
Table 2A.3 : Statewise Route km per 1000 Population as on 31st March
(in Km.) Sl. No.
States / UTs 2003 2004 2005 2006 2007 2008 CAGR %
1 Andhra Pradesh 0.067 0.066 0.065 0.064 0.063 0.063 -1.17 2 Arunachal Pradesh 0.001 0.001 0.001 0.001 0.001 0.001 -1.21 3 Assam 0.092 0.090 0.089 0.080 0.079 0.078 -3.27 4 Bihar 0.037 0.038 0.038 0.037 0.037 0.036 -0.39 5 Chhattisgarh 0.055 0.053 0.052 0.052 0.052 0.051 -1.43 6 Goa 0.050 0.049 0.048 0.046 0.045 0.043 -3.01 7 Gujarat 0.101 0.099 0.098 0.096 0.095 0.094 -1.37 8 Haryana 0.071 0.072 0.070 0.068 0.065 0.061 -2.98 9 Himachal Pradesh 0.043 0.043 0.045 0.044 0.044 0.043 0.05 10 Jammu & Kashmir 0.009 0.009 0.013 0.013 0.012 0.014 9.50 11 Jharkhand 0.064 0.068 0.067 0.067 0.065 0.065 0.22 12 Karnataka 0.055 0.054 0.054 0.053 0.053 0.052 -0.97 13 Kerala 0.032 0.032 0.032 0.032 0.031 0.031 -0.83 14 Madhya Pradesh 0.077 0.076 0.075 0.074 0.072 0.071 -1.55 15 Maharashtra 0.054 0.054 0.054 0.053 0.052 0.051 -1.21 16 Manipur 0.001 0.001 0.001 0.001 0.001 0.001 -1.22 17 Meghalaya 0 0 0 0 0 0 - 18 Mizoram 0.002 0.002 0.002 0.002 0.002 0.002 -1.23 19 Nagaland 0.006 0.006 0.006 0.006 0.006 0.006 -1.22 20 Orissa 0.062 0.060 0.059 0.059 0.057 0.060 -0.49 21 Punjab 0.084 0.083 0.082 0.082 0.081 0.080 -0.99 22 Rajasthan 0.100 0.097 0.095 0.094 0.093 0.088 -2.57 23 Sikkim 0 0 0 0 0 0 - 24 Tamil Nadu 0.066 0.066 0.065 0.064 0.063 0.062 -1.04 25 Tripura 0.020 0.019 0.019 0.019 0.019 0.018 -1.22 26 Uttar Pradesh 0.051 0.049 0.048 0.047 0.046 0.045 -2.44 27 Uttarakhand 0.039 0.039 0.038 0.037 0.037 0.036 -1.59 28 West Bengal 0.045 0.044 0.046 0.046 0.045 0.045 0.31
State Total 0.060 0.059 0.059 0.058 0.057 0.056 -1.39 Union Territories 1 Andaman & Nicobar 0 0 0 0 0 0 - 2 Chandigarh 0.008 0.008 0.007 0.014 0.014 0.013 9.61 3 Dadar & Nagar Haveli 0 0 0 0 0 0 - 4 Daman & Diu 0 0 0 0 0 0 - 5 Delhi 0.014 0.012 0.013 0.013 0.011 0.011 -4.55 6 Lakshadweep 0 0 0 0 0 0 - 7 Puducherry 0.011 0.011 0.011 0.010 0.010 0.009 -3.84
UT Total 0.012 0.011 0.012 0.012 0.011 0.010 -3.89 India Total 0.059 0.059 0.058 0.057 0.056 0.055 -1.43

95
2.Rail Transport
Accessibility
2.Rail Transport
Table 2A.4 : Statewise Route Kilometres - Broad Gauge (in Km.)
Sl. No.
States / UTs 2002-03 2003-04 2004-05 2005-06 2006-07 2007-08 CAGR %
1 Andhra Pradesh 4527.0 4651.6 4839.1 4856.1 4903.9 4985.7 1.95 2 Arunachal Pradesh 0 0 0 0 0 0 - 3 Assam 1227.7 1227.7 1227.7 1227.2 1226.6 1226.5 -0.02 4 Bihar 2148.8 2142.3 2145.3 2231.1 2376.0 2507.9 3.14 5 Chhattisgarh 1091.2 1070.1 1070.1 1096.9 1097.0 1097.3 0.11 6 Goa 69.3 69.0 69.0 69.0 69.0 69.0 -0.09 7 Gujarat 2497.4 2681.6 2775.0 3021.5 3100.0 3177.3 4.93 8 Haryana 1232.3 1302.0 1275.7 1275.2 1275.2 1274.6 0.68 9 Himachal Pradesh 23.3 23.2 39.2 39.2 39.2 39.2 10.97 10 Jammu & Kashmir 96.1 96.1 137.8 137.8 137.8 162.7 11.11 11 Jharkhand 1729.1 1873.9 1941.3 1954.8 1941.3 1965.1 2.59 12 Karnataka 2453.2 2508.0 2573.7 2604.0 2759.5 2759.4 2.38 13 Kerala 933.3 933.3 933.3 933.3 933.3 933.3 0 14 Madhya Pradesh 3616.9 3619.9 3675.8 3694.8 3829.9 3830.1 1.15 15 Maharashtra 4270.4 4299.2 4344.9 4365.8 4473.6 4707.2 1.97 16 Manipur 0 0 0 0 0 0 - 17 Meghalaya 0 0 0 0 0 0 - 18 Mizoram 0 0 0 0 0 0 - 19 Nagaland 11.13 11.13 11.13 11.13 11.13 11.10 -0.05 20 Orissa 2180.7 2192.8 2188.9 2244.1 2246.9 2386.8 1.82 21 Punjab 2089.6 2086.1 2086.1 2121.8 2121.8 2121.7 0.31 22 Rajasthan 3028.0 3334.6 3436.8 3550.7 3840.9 3885.4 5.11 23 Sikkim 0 0 0 0 0 0 - 24 Tamil Nadu 2071.0 2246.3 2310.4 2358.4 2496.9 2795.9 6.19 25 Tripura 0 0 0 0 0 0 - 26 Uttar Pradesh 6884.3 6797.5 6826.5 6836.4 6994.6 7082.2 0.57 27 Uttarakhand 283.8 283.8 283.8 283.8 283.8 283.7 0 28 West Bengal 2972.4 3181.6 3355.8 3451.8 3451.8 3570.1 3.73
State Total 45436.9 46631.6 47547.2 48364.8 49610.2 50872.2 2.29 Union Territories 1 Andaman & Nicobar 0 0 0 0 0 0 - 2 Chandigarh 7.7 7.7 7.7 15.7 15.7 15.7 15.19 3 Dadar & Nagar Haveli 0 0 0 0 0 0 - 4 Daman & Diu 0 0 0 0 0 0 - 5 Delhi 177.9 156.2 182.5 182.5 182.5 182.5 0.51 6 Lakshadweep 0 0 0 0 0 0 - 7 Puducherry 0 11.1 11.1 11.1 11.1 11.1 0
UT Total 185.7 175.0 201.3 209.3 209.3 209.3 2.42 India Total 45622.6 46806.6 47748.5 48574.1 49819.4 51081.5 2.29
Source : Material supplied by M/o Railways, Railway Board
96
2.Rail Transport
Quality
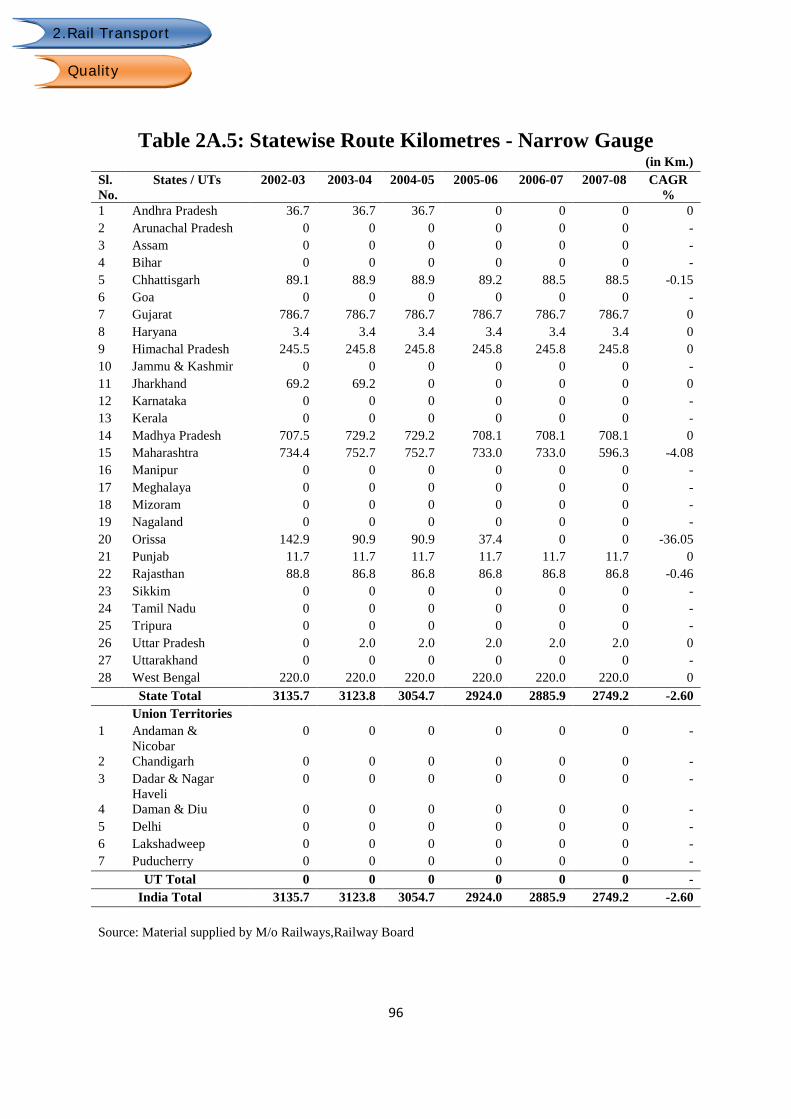
Table 2A.5: Statewise Route Kilometres - Narrow Gauge (in Km.)
Sl. No.
States / UTs 2002-03 2003-04 2004-05 2005-06 2006-07 2007-08 CAGR %
1 Andhra Pradesh 36.7 36.7 36.7 0 0 0 0 2 Arunachal Pradesh 0 0 0 0 0 0 - 3 Assam 0 0 0 0 0 0 - 4 Bihar 0 0 0 0 0 0 - 5 Chhattisgarh 89.1 88.9 88.9 89.2 88.5 88.5 -0.15 6 Goa 0 0 0 0 0 0 - 7 Gujarat 786.7 786.7 786.7 786.7 786.7 786.7 0 8 Haryana 3.4 3.4 3.4 3.4 3.4 3.4 0 9 Himachal Pradesh 245.5 245.8 245.8 245.8 245.8 245.8 0 10 Jammu & Kashmir 0 0 0 0 0 0 - 11 Jharkhand 69.2 69.2 0 0 0 0 0 12 Karnataka 0 0 0 0 0 0 - 13 Kerala 0 0 0 0 0 0 - 14 Madhya Pradesh 707.5 729.2 729.2 708.1 708.1 708.1 0 15 Maharashtra 734.4 752.7 752.7 733.0 733.0 596.3 -4.08 16 Manipur 0 0 0 0 0 0 - 17 Meghalaya 0 0 0 0 0 0 - 18 Mizoram 0 0 0 0 0 0 - 19 Nagaland 0 0 0 0 0 0 - 20 Orissa 142.9 90.9 90.9 37.4 0 0 -36.05 21 Punjab 11.7 11.7 11.7 11.7 11.7 11.7 0 22 Rajasthan 88.8 86.8 86.8 86.8 86.8 86.8 -0.46 23 Sikkim 0 0 0 0 0 0 - 24 Tamil Nadu 0 0 0 0 0 0 - 25 Tripura 0 0 0 0 0 0 - 26 Uttar Pradesh 0 2.0 2.0 2.0 2.0 2.0 0 27 Uttarakhand 0 0 0 0 0 0 - 28 West Bengal 220.0 220.0 220.0 220.0 220.0 220.0 0
State Total 3135.7 3123.8 3054.7 2924.0 2885.9 2749.2 -2.60 Union Territories 1 Andaman &
Nicobar 0 0 0 0 0 0 -
2 Chandigarh 0 0 0 0 0 0 - 3 Dadar & Nagar
Haveli 0 0 0 0 0 0 -
4 Daman & Diu 0 0 0 0 0 0 - 5 Delhi 0 0 0 0 0 0 - 6 Lakshadweep 0 0 0 0 0 0 - 7 Puducherry 0 0 0 0 0 0 -
UT Total 0 0 0 0 0 0 - India Total 3135.7 3123.8 3054.7 2924.0 2885.9 2749.2 -2.60
Source: Material supplied by M/o Railways,Railway Board

97
2.Rail Transport
Accessibility
2.Rail Transport
Table 2A.6 : Statewise Route Kilometres - Metre Gauge (in Km.)
Sl. No.
States / UTs 2002-03
2003-04 2004-05 2005-06 2006-07 2007-08
CAGR %
1 Andhra Pradesh 633.5 507.5 329.3 329.0 267.7 184.7 -21.85 2 Arunachal Pradesh 1.3 1.3 1.3 1.3 1.3 1.3 0 3 Assam 1289.5 1289.5 1278.1 1057.1 1057.1 1057.1 -3.90 4 Bihar 1074.9 1234.8 1234.4 1099.3 1035.0 898.5 -3.52 5 Chhattisgarh 0 0 0 0 0 0 - 6 Goa 0 0 0 0 0 0 - 7 Gujarat 2000.7 1814.5 1722.8 1474.8 1421.9 1364.2 -7.37 8 Haryana 318.8 317.9 317.9 316.4 261.8 189.1 -9.92 9 Himachal Pradesh 0 0 0 0 0 0 - 10 Jammu & Kashmir 0 0 0 0 0 0 - 11 Jharkhand 0 0 0 0 0 0 - 12 Karnataka 520.9 471.9 408.2 398.3 246.3 246.0 -13.93 13 Kerala 116.9 116.9 116.9 116.9 116.9 116.9 0 14 Madhya Pradesh 500.3 500.3 500.3 500.3 346.0 346.0 -7.11 15 Maharashtra 445.3 444.8 429.4 429.4 312.6 232.3 -12.20 16 Manipur 1.4 1.4 1.4 1.4 1.4 1.4 0 17 Meghalaya 0 0 0 0 0 0 - 18 Mizoram 1.5 1.5 1.5 1.5 1.5 1.5 0 19 Nagaland 1.7 1.7 1.7 1.7 1.7 1.7 0 20 Orissa 0 0 0 0 0 0 - 21 Punjab 0 0 0 0 0 0 - 22 Rajasthan 2783.0 2413.1 2314.1 2200.5 1983.5 1710.8 -9.27 23 Sikkim 0 0 0 0 0 0 - 24 Tamil Nadu 2113.3 1954.7 1860.5 1812.5 1624.2 1334.7 -8.78 25 Tripura 64.4 64.4 64.4 64.4 64.4 64.4 0 26 Uttar Pradesh 1914.5 1766.8 1717.0 1707.9 1578.2 1469.3 -5.16 27 Uttarakhand 61.2 61.2 61.2 61.2 61.2 61.2 0 28 West Bengal 488.0 304.4 280.2 238.9 238.9 160.6 -19.93
State Total 14330.9 13268.4 12640.3 11812.6 10621.4 9441.6 -8.01 Union Territories 1 Andaman &
Nicobar 0 0 0 0 0 0 -
2 Chandigarh 0 0 0 0 0 0 - 3 Dadar & Nagar
Haveli 0 0 0 0 0 0 -
4 Daman & Diu 0 0 0 0 0 0 - 5 Delhi 21.7 21.7 21.7 21.7 0 0 0 6 Lakshadweep 0 0 0 0 0 0 - 7 Puducherry 11.1 0 0 0 0 0 -100
UT Total 32.8 21.7 21.7 21.7 0 0 -12.85 India Total 14363.7 13290.1 12662.1 11834.3 10621.4 9441.6 -8.05
Source: Material supplied by M/o Railways, Railway Board
98
2.Rail Transport
Quality
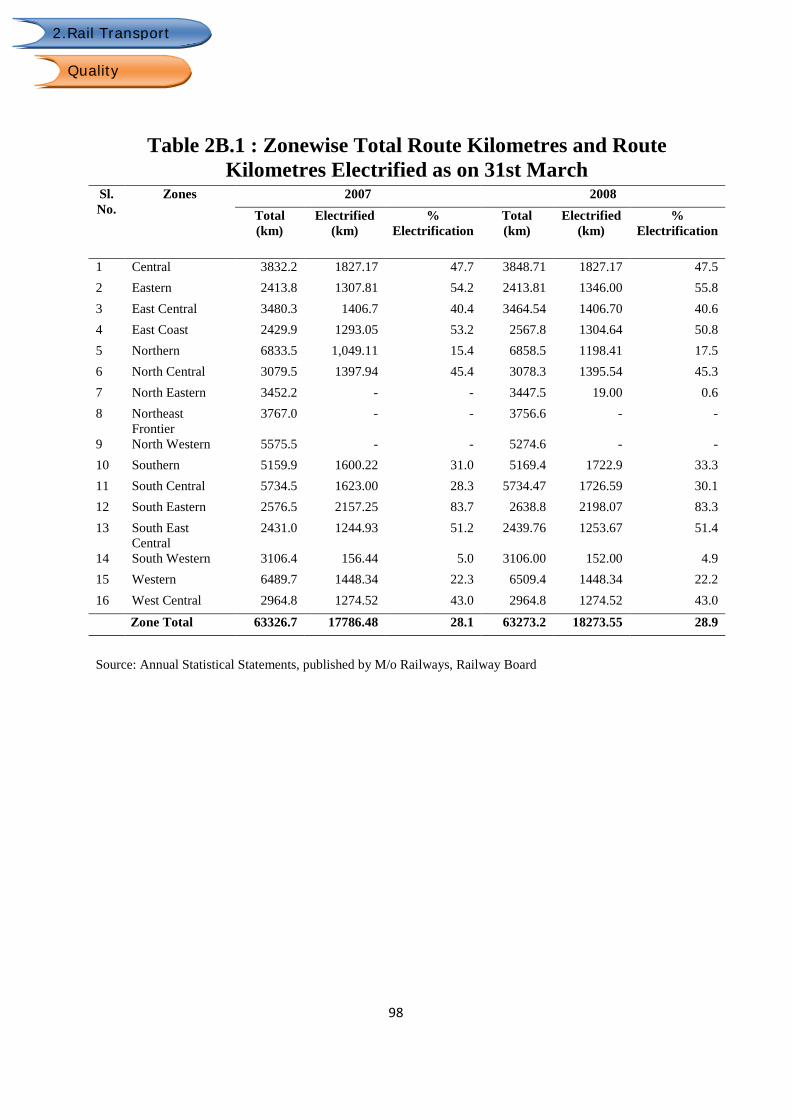
Table 2B.1 : Zonewise Total Route Kilometres and Route Kilometres Electrified as on 31st March
Sl. No.
Zones 2007 2008 Total (km)
Electrified (km)
% Electrification
Total (km)
Electrified (km)
% Electrification
1 Central 3832.2 1827.17 47.7 3848.71 1827.17 47.5 2 Eastern 2413.8 1307.81 54.2 2413.81 1346.00 55.8 3 East Central 3480.3 1406.7 40.4 3464.54 1406.70 40.6 4 East Coast 2429.9 1293.05 53.2 2567.8 1304.64 50.8 5 Northern 6833.5 1,049.11 15.4 6858.5 1198.41 17.5 6 North Central 3079.5 1397.94 45.4 3078.3 1395.54 45.3 7 North Eastern 3452.2 - - 3447.5 19.00 0.6 8 Northeast
Frontier 3767.0 - - 3756.6 - -
9 North Western 5575.5 - - 5274.6 - - 10 Southern 5159.9 1600.22 31.0 5169.4 1722.9 33.3 11 South Central 5734.5 1623.00 28.3 5734.47 1726.59 30.1 12 South Eastern 2576.5 2157.25 83.7 2638.8 2198.07 83.3 13 South East
Central 2431.0 1244.93 51.2 2439.76 1253.67 51.4
14 South Western 3106.4 156.44 5.0 3106.00 152.00 4.9 15 Western 6489.7 1448.34 22.3 6509.4 1448.34 22.2 16 West Central 2964.8 1274.52 43.0 2964.8 1274.52 43.0
Zone Total 63326.7 17786.48 28.1 63273.2 18273.55 28.9
Source: Annual Statistical Statements, published by M/o Railways, Railway Board
99
2.Rail Transport
Quality
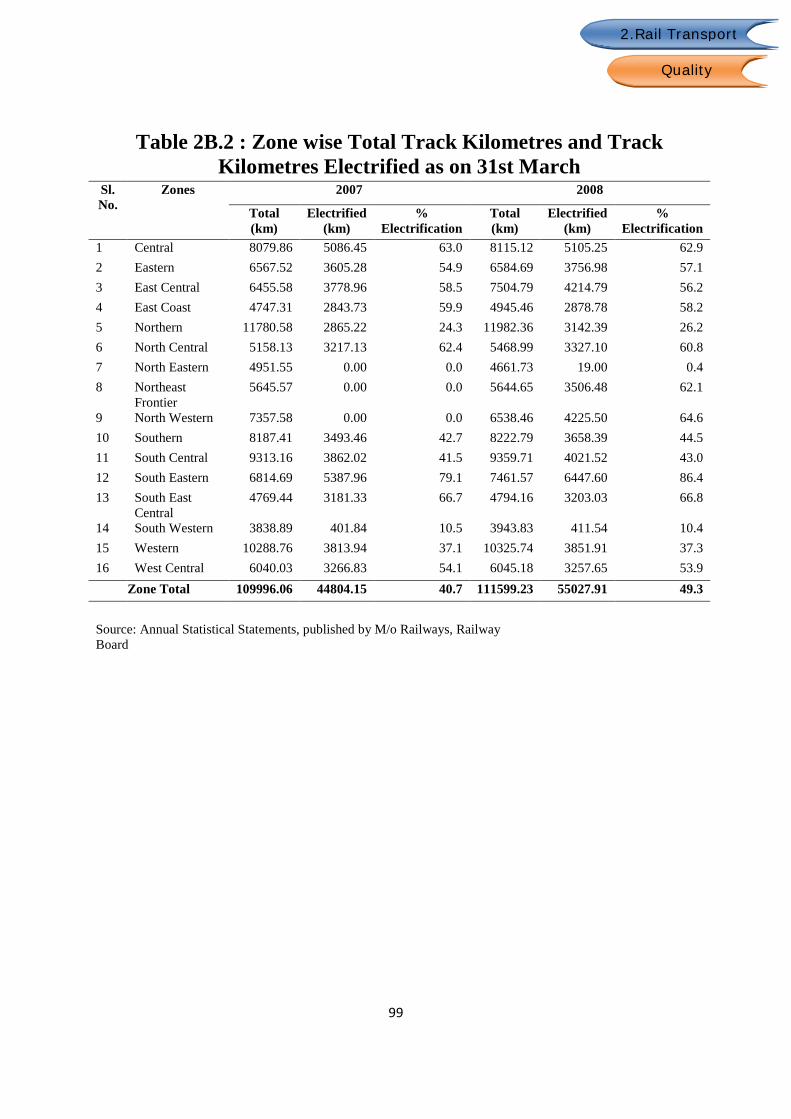
Table 2B.2 : Zone wise Total Track Kilometres and Track Kilometres Electrified as on 31st March
Sl. No.
Zones 2007 2008
Total (km)
Electrified (km)
% Electrification
Total (km)
Electrified (km)
% Electrification
1 Central 8079.86 5086.45 63.0 8115.12 5105.25 62.9 2 Eastern 6567.52 3605.28 54.9 6584.69 3756.98 57.1 3 East Central 6455.58 3778.96 58.5 7504.79 4214.79 56.2 4 East Coast 4747.31 2843.73 59.9 4945.46 2878.78 58.2 5 Northern 11780.58 2865.22 24.3 11982.36 3142.39 26.2 6 North Central 5158.13 3217.13 62.4 5468.99 3327.10 60.8 7 North Eastern 4951.55 0.00 0.0 4661.73 19.00 0.4 8 Northeast
Frontier 5645.57 0.00 0.0 5644.65 3506.48 62.1
9 North Western 7357.58 0.00 0.0 6538.46 4225.50 64.6 10 Southern 8187.41 3493.46 42.7 8222.79 3658.39 44.5 11 South Central 9313.16 3862.02 41.5 9359.71 4021.52 43.0 12 South Eastern 6814.69 5387.96 79.1 7461.57 6447.60 86.4 13 South East
Central 4769.44 3181.33 66.7 4794.16 3203.03 66.8
14 South Western 3838.89 401.84 10.5 3943.83 411.54 10.4 15 Western 10288.76 3813.94 37.1 10325.74 3851.91 37.3 16 West Central 6040.03 3266.83 54.1 6045.18 3257.65 53.9
Zone Total 109996.06 44804.15 40.7 111599.23 55027.91 49.3 Source: Annual Statistical Statements, published by M/o Railways, Railway Board
100
2.Rail Transport
Quality
Table 2B.3 : Zonewise % Share of Broad Gauge, Meter Gauge and Narrow Gauge in Total Route Kilometres as on 31st March
Sl. No.
Zones 2006 2007 2008 Broad Gauge
Narrow Gauge
Meter Gauge
Broad Gauge
Narrow Gauge
Meter Gauge
Broad Gauge
Narrow Gauge
Meter Gauge
1 Central 85.06 14.94 - 85.06 14.94 - 88.68 11.32 - 2 Eastern 94.50 5.50 - 94.51 5.49 - 94.51 5.49 - 3 East Central 79.01 - 20.99 81.17 - 18.83 83.89 - 16.11 4 East Coast 100.00 - - 100.00 - - 100.00 - - 5 Northern 94.96 3.77 1.27 96.02 3.82 0.16 96.03 3.80 0.16 6 North Central 89.12 9.37 1.51 89.12 9.37 1.51 89.12 9.37 1.51 7 North Eastern 45.50 - 54.50 50.04 - 49.96 53.13 - 46.87 8 Northeast
Frontier 54.87 2.32 42.81 54.83 2.32 42.85 57.83 2.33 39.84
9 North Western 53.97 - 46.03 57.98 - 42.02 62.13 - 37.87 10 Southern 62.97 37.03 66.26 - - 71.92 - - 11 South Central 85.57 - 14.43 88.66 - 11.34 91.51 - 8.49 12 South Eastern 98.57 1.43 - 100.00 - - 100.00 - - 13 South East
Central 68.84 31.16 68.85 31.15 - 68.96 31.04 -
14 South Western 87.20 - 12.80 92.07 - 7.93 92.08 - 7.92 15 Western 59.70 12.04 28.26 63.39 12.12 24.48 64.39 12.09 23.52 16 West Central 100.00 - - 100.00 - - 100.00 - -
Zone Total 76.70 4.64 18.69 78.67 4.58 16.77 80.73 4.34 14.92
Source: Annual Statistical Statements, published by M/o Railways, Railway Board

101
2.Rail Transport
Quality
Table 2B.4 : Train Accidents and Casualties during 2006-07 & 2007-08
Sl. No.
Zones Accidents per Million Train km
Casualties per Million Passengers carried Killed Injured
2006-07 2007-08 2006-07 2007-08 2006-07 2007-08 1 Central 0.13 0.06 - 0.001 0.016 0.003 2 Eastern 0.24 0.06 0.041 0.001 0.019 0.018 3 East Central 0.14 0.2 0 - - - 4 East Coast 0.34 0.42 0 0.052 - 0.706 5 Northern 0.36 0.23 0.002 0.002 0.019 0.02 6 North Central 0.15 0.16 - - 0.141 0.215 7 North Eastern 0.37 0.57 - 0.005 0.21 0.109 8 Northeast
Frontier 0.33 0.46 - 0.028 - 1.309
9 North Western 0.47 0.38 - - - 0.078 10 Southern 0.26 0.19 - 0.002 0.018 0.057 11 South Central 0.12 0.14 0.004 - 0.026 0.031 12 South Eastern 0.13 0.32 - - - 0.113 13 South East
Central 0.25 0.22 - - 0.07 0.011
14 South Western 0.52 0.61 - - - - 15 Western 0.17 0.14 - - 0.07 - 16 West Central 0.09 0.14 - - - -
Zone Total 0.22 0.21 0.0061 0.0014 0.0365 0.0376 Source: Annual Statistical Statements, published by M/o Railways, Railway Board

102
2.Rail Transport
Quality
Table 2B.5 : Signalling System and Telecom Installations as on 31st March Sl. No.
Signalling Installations 2003 2004 2005 2006 2007 2008 CAGR %
1 Panel Interlocking (No. of Stations) 2426 2692 2718 2911 3246 3462 7.37 2 Electronic Interlocking (No. of Stations) 247 259 203 219 159 229 -1.50 3 Route Relay Interlocking (No. of Stations) .. 197 203 219 221 223 3.15 4 LED Lit Signals (No. of Stations) .. .. .. .. 1308 1697 29.74 5 Data Loggers (No. of Stations) .. .. .. .. 2105 2650 25.89 6 Color light Signalling (No. of Stations) .. 3508 3820 4203 4424 4684 7.50 7 Last vehicles check by Axle Counters (No of Block Sections) .. .. .. .. 1045 1421 35.98 8 Track Circuiting (No. of Locations) 3606 3606 3095 3265 24499 27086 49.67 9 Automatic Block Signalling (Track km) .. 3009 3095 3265 3454 3672 5.10 10 Intermediate Block Signalling (No. of Block Sections) .. .. .. .. 164 188 14.63 11 Interlocked Level Crossing Gates (Nos.) .. 7006 7331 7781 8098 8413 4.68 12 Second Distance Signal (No. of Stations) 982 999 1015 1185 1022 1036 1.08 .. NA Sl. No.
Telecom Installations 2003 2004 2005 2006 2007 2008 CAGR %
1 Digital Electronic Exchanges (No. of lines) 231015 235565 274034 285292 294214 294214 4.96 2 No. of Control Sections provided with Dual Tone Multiple
Frequency (DTMF) control equipment 326 326 292 295 295 305 -1.32
3 Digital Microwave (7 GHz) (Route km) 6809 7093 7093 7093 7093 7093 0.82 4 Control communication through wireless (18 GHz) (Route km) 989 989 989 989 989 989 0 5 Mobile Train Radio Communication System (Route km) 1686 1686 1686 1686 1686 1686 0 6 Optical Fibre Cable communication (OFC) system for control
communication (Route km) 9138 16089 22423 25269 28124 29181 26.14
7 Public address system (No. of stations) 528 588 2520 2708 3081 3133 42.78 8 Train display boards (No. of stations) 344 363 809 925 1055 1055 25.12 10 Coach guidance system (No. of stations) .. .. 129 129 141 235 22.13
Source: 1. Material supplied by M/o Railways, Railway Board 2.Year Book, published by M/o Railways, Railway Board
103
2.Rail Transport
Quality
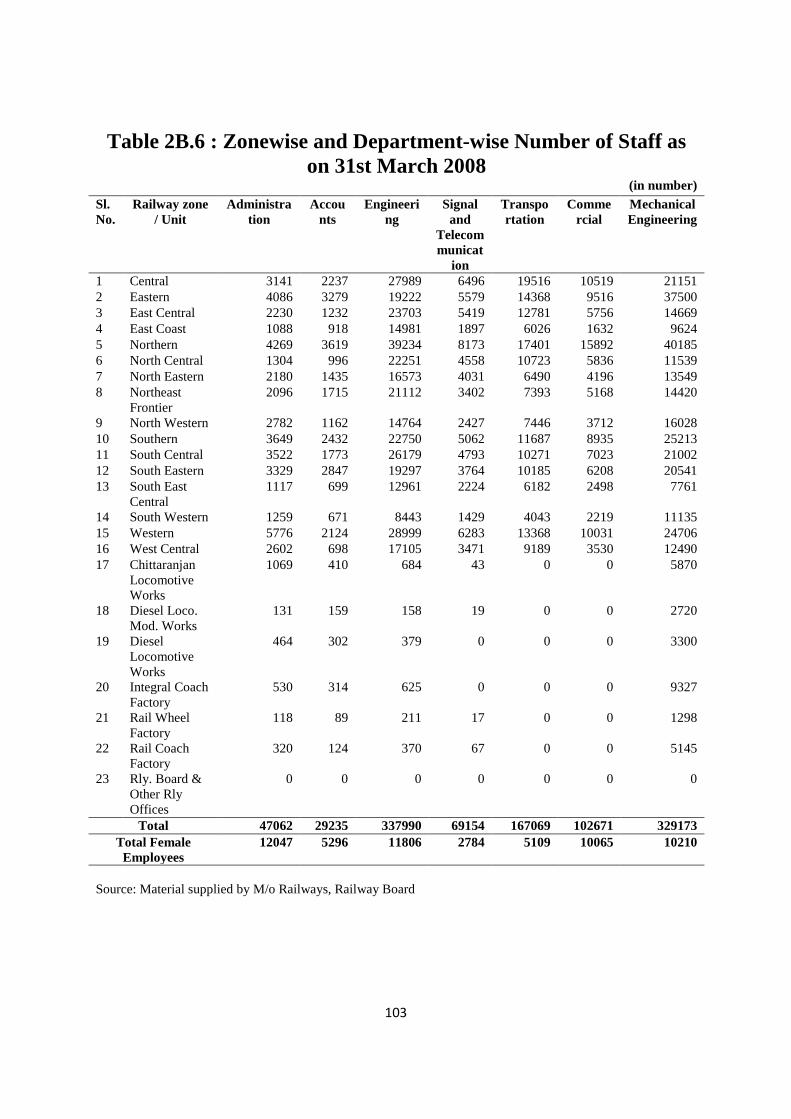
Table 2B.6 : Zonewise and Department-wise Number of Staff as on 31st March 2008
(in number) Sl. No.
Railway zone / Unit
Administration
Accounts
Engineering
Signal and
Telecommunicat
ion
Transportation
Commercial
Mechanical Engineering
1 Central 3141 2237 27989 6496 19516 10519 21151 2 Eastern 4086 3279 19222 5579 14368 9516 37500 3 East Central 2230 1232 23703 5419 12781 5756 14669 4 East Coast 1088 918 14981 1897 6026 1632 9624 5 Northern 4269 3619 39234 8173 17401 15892 40185 6 North Central 1304 996 22251 4558 10723 5836 11539 7 North Eastern 2180 1435 16573 4031 6490 4196 13549 8 Northeast
Frontier 2096 1715 21112 3402 7393 5168 14420
9 North Western 2782 1162 14764 2427 7446 3712 16028 10 Southern 3649 2432 22750 5062 11687 8935 25213 11 South Central 3522 1773 26179 4793 10271 7023 21002 12 South Eastern 3329 2847 19297 3764 10185 6208 20541 13 South East
Central 1117 699 12961 2224 6182 2498 7761
14 South Western 1259 671 8443 1429 4043 2219 11135 15 Western 5776 2124 28999 6283 13368 10031 24706 16 West Central 2602 698 17105 3471 9189 3530 12490 17 Chittaranjan
Locomotive Works
1069 410 684 43 0 0 5870
18 Diesel Loco. Mod. Works
131 159 158 19 0 0 2720
19 Diesel Locomotive Works
464 302 379 0 0 0 3300
20 Integral Coach Factory
530 314 625 0 0 0 9327
21 Rail Wheel Factory
118 89 211 17 0 0 1298
22 Rail Coach Factory
320 124 370 67 0 0 5145
23 Rly. Board & Other Rly Offices
0 0 0 0 0 0 0
Total 47062 29235 337990 69154 167069 102671 329173 Total Female
Employees 12047 5296 11806 2784 5109 10065 10210
Source: Material supplied by M/o Railways, Railway Board

104
2.Rail Transport
Quality
Table 2B.6 (contd.) : Zonewise and Department-wise number of Staff as on 31st March 2008
(in number) Sl. No.
Railway zone / Unit
Stores Electrical Medical Railway Protection
Force
Rly. Board
& Other
Rly Offices
Total Employees
Total Female
Employees
1 Central 2618 17500 3881 4348 0 119396 8704 2 Eastern 4122 20668 4639 7343 0 130322 4990 3 East Central 707 10157 3072 3396 0 83122 2854 4 East Coast 248 6083 1670 1948 0 46115 2136 5 Northern 3570 14578 4695 5405 0 157021 7595 6 North Central 726 10094 1795 2738 0 72560 1843 7 North
Eastern 1652 4636 2400 2681 0 59823 2335
8 Northeast Frontier
1828 4764 3923 4014 0 69835 3974
9 North Western
1250 4225 2034 2061 0 57891 2844
10 Southern 2381 14911 3591 4069 0 104680 10140 11 South Central 1601 9348 2990 3007 0 91509 7219 12 South
Eastern 2171 14015 3855 4241 0 90453 5547
13 South East Central
490 7018 1230 1475 0 43655 3154
14 South Western
538 2120 1137 1405 0 34399 1747
15 Western 2161 13094 3579 3515 0 113636 11548 16 West Central 119 5899 1462 1568 0 58133 2746 17 Chittaranjan
Locomotive Works
877 2966 548 399 0 12866 586
18 Diesel Loco. Mod. Works
262 168 92 66 0 3775 234
19 Diesel Locomotive Works
525 690 150 199 0 6009 331
20 Integral Coach Factory
529 1323 155 367 0 13170 1165
21 Rail Wheel Factory
220 311 85 54 0 2403 188
22 Rail Coach Factory
414 665 186 210 0 7501 339
23 Rly. Board & Other Rly Offices
0 0 0 0 16246 16246 493
Total 29009 165233 47169 54509 16246 1394520 82712 Total Female
Employees 3059 5047 15849 947 493 82712
Source: Material supplied by M/o Railways, Railway Board

105
2.Rail Transport
Quality
2.Rail Transport
Table 2B.7 : Zonewise Number of Stations (in numbers)
Sl. No. Zones Broad Gauge Narrow Gauge Meter Gauge
2006-07 2007-08 2006-07 2007-08 2006-07 2007-08
1 Central 414 467 45 61 - - 2 Eastern 419 422 12 14 - - 3 East Central 378 386 - - 94 86 4 East Coast 269 270 - - - - 5 Northern 794 793 42 42 - - 6 North Central 367 361 18 19 6 6 7 North Eastern 193 206 - - 157 144 8 Northeast Frontier 258 263 13 13 143 154 9 North Western 266 295 - - 202 179 10 Southern 447 476 - - 83 58 11 South Central 506 520 - - 49 34 12 South Eastern 321 321 - - - - 13 South East Central 181 180 41 42 - - 14 South Western 258 268 - - 11 7 15 Western 531 536 31 32 151 149 16 West Central 278 278 - - - -
Zone Total 5880 6042 202 223 896 817 Source: Annual Statistical Statements, published by M/o Railways, Railway Board

106
2.Rail Transport
Fiscal Cost
Table 2C.1 : Gaugewise and Zonewise Gross Revenue and Working Expenses for the Year 2007-08
(Rs. in crore) Sl. No.
Railway Gross Revenue Working Expenses Passenger
Revenue Freight
Revenue Other
Income Total
Broad Gauge 1 Central 2365.19 3318.27 469.83 6153.28 4629.09 2 Eastern 1055.31 1488.89 299.71 2843.90 4080.55 3 East Central 1034.38 3050.66 225.26 4310.30 3327.00 4 East Coast 469.17 4835.41 152.80 5457.37 2631.62 5 Northern 2520.52 3296.94 1132.44 6949.90 6335.52 6 North Central 1925.53 3970.42 126.51 6022.46 3151.87 7 North Eastern 505.00 660.54 82.92 1248.46 1176.88 8 Northeast Frontier 383.75 1149.27 627.08 2160.11 2228.00 9 North Western 632.96 1419.61 237.11 2289.67 1203.52 10 Southern 1781.12 1617.01 322.43 3720.55 3580.31 11 South Central 1795.79 4804.69 259.56 6860.05 4577.30 12 South Eastern 658.17 4489.41 296.79 5444.37 2931.50 13 South East Central 404.19 4194.31 127.38 4725.87 2060.87 14 South Western 622.72 1682.08 247.06 2551.87 1759.91 15 Western 2069.41 3304.72 459.44 5833.56 4199.99 16 West Central 1166.94 3053.58 129.81 4350.33 2885.79
Sub Total 19390.15 46335.80 5196.11 70922.06 50759.71 Metre Gauge 17 Central - - - - - 18 Eastern - - - - - 19 East Central 30.03 5.62 0 35.65 473.79 20 East Coast - - - - - 21 Northern - - - - 13.64 22 North Central 4.78 0 0.21 4.99 6.64 23 North Eastern 169.72 27.06 12.44 209.21 743.44 24 Northeast Frontier 51.15 51.05 91.31 193.51 320.53 25 North Western 38.48 4.15 1.45 44.08 871.52 26 Southern 24.74 0.60 26.14 51.49 382.86 27 South Central 7.08 0.01 0.76 7.85 23.17 28 South Eastern - - - - - 29 South East Central - - - - - 30 South Western 0.84 0.07 0 0.90 7.54 31 Western 44.77 1.14 28.95 74.86 318.49 32 West Central - - - - -
Sub Total 371.59 89.69 161.26 622.55 3161.62 Source: Annual Statistical Statements, published by M/o Railways, Railway Board
107
2.Rail Transport
Fiscal Cost
2.Rail Transport
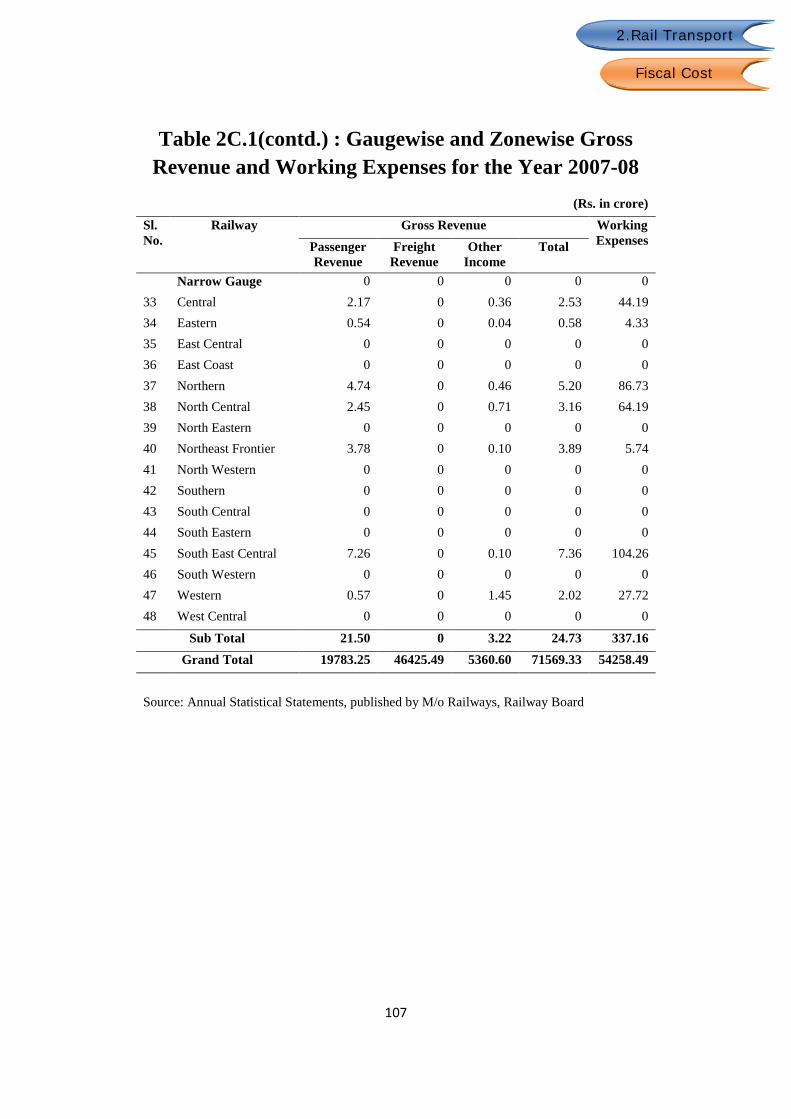
Table 2C.1(contd.) : Gaugewise and Zonewise Gross Revenue and Working Expenses for the Year 2007-08
(Rs. in crore) Sl. No.
Railway Gross Revenue Working Expenses Passenger
Revenue Freight
Revenue Other
Income Total
Narrow Gauge 0 0 0 0 0 33 Central 2.17 0 0.36 2.53 44.19 34 Eastern 0.54 0 0.04 0.58 4.33 35 East Central 0 0 0 0 0 36 East Coast 0 0 0 0 0 37 Northern 4.74 0 0.46 5.20 86.73 38 North Central 2.45 0 0.71 3.16 64.19 39 North Eastern 0 0 0 0 0 40 Northeast Frontier 3.78 0 0.10 3.89 5.74 41 North Western 0 0 0 0 0 42 Southern 0 0 0 0 0 43 South Central 0 0 0 0 0 44 South Eastern 0 0 0 0 0 45 South East Central 7.26 0 0.10 7.36 104.26 46 South Western 0 0 0 0 0 47 Western 0.57 0 1.45 2.02 27.72 48 West Central 0 0 0 0 0
Sub Total 21.50 0 3.22 24.73 337.16 Grand Total 19783.25 46425.49 5360.60 71569.33 54258.49
Source: Annual Statistical Statements, published by M/o Railways, Railway Board

108
2.Rail Transport
Fiscal Cost
Table 2C.2 : Gross Expenditure, Capital Outlay and Capital at Charge for the Year 2007-08
(Rs. in crore) Sl. No.
Railway Total Gross Expenditure
Capital Outlay
Total Capital-at-
charge Government Railways (Excl. Worked Lines and Purchased Rly.)
1 Central 4674.26 433.62 4621.11 2 Eastern 4083.78 109.89 2020.14 3 East Central 3824.31 535.06 6148.53 4 East Coast 2639.39 213.73 3232.75 5 Northern Commercial 6397.64 2102.74 14730.49 Strategic 34.85 0.01 82.97 6 North Central 3265.84 212.65 2811.70 7 North Eastern 1926.94 136.68 1439.35 8 Northeast Frontier Commercial 2033.07 1001.21 7322.42 Strategic 526.60 1.45 48.03 9 North Western Commercial 2008.63 143.01 1280.84 Strategic 65.99 309.44 10 Southern 3968.64 175.83 4333.30 11 South Central 4588.53 347.46 4022.37 12 South Eastern 2919.22 62.60 2079.81 13 South East Central 2173.87 39.70 1488.93 14 South Western 1779.03 369.06 2570.75 15 Western Commercial 4529.51 140.75 3499.61 Strategic 1.47 33.66 16 West Central 2873.35 46.99 1948.27
Total 54314.93 6072.43 64024.47 Production Units and Independent Projects
17 CLW .. 7.04 346.69 18 DLMW .. 11.41 240.38 19 DLW .. 264.54 700.65 20 ICF .. 78.61 387.01 21 RCF .. 110.45 783.21 22 RE .. 259.03 3814.21 23 Rail Wheel Factory .. 0.15 288.84
Total .. 731.23 6560.99 Metropolitan Transport Projects
24 MTP Mumbai .. .. .. 25 MTP Kolkata 147.24 150.72 2428.46 26 MTP Delhi .. .. 34.74 27 MTP Chennai .. 15.17 696.38
Total 147.24 165.89 3159.58 Zone Total 54462.17 6969.55 73745.04
Source: Annual Statistical Statements, published by M/o Railways, Railway Board

109
2.Rail Transport
Fiscal Cost
Table 2C.3 : Plan Head-wise Allocation and Expenditure
( Rs. in crore) Sl. No.
Plan Head 2005-06 2006-07 2007-08 Allocation( RE)
Actual Net Expenditure
% Utilization
Allocation( RE)
Actual Net Expenditure
% Utilization
Allocation( RE)
Actual Net Expenditure
% Utilization
1 New Lines (Construction) 1935.86 1990.98 102.85 2524.64 2488.44 98.57 2680.29 2667.49 99.52 2 Restoration of Dismantled Lines 16.01 13.3 83.07 10 10.72 107.20 30 35.69 118.97 3 Gauge Conversion 1234.21 1241.74 100.61 1901.85 2136.13 112.32 2770.52 3021.91 109.07 4 Doubling 674.69 687.21 101.86 1175.7 1201.72 102.21 1742.5 1670.48 95.87 5 Traffic Facilities-Yard Remodelling and
Others 413.58 372.14 89.98 595.54 547.76 91.98 914.48 826.23 90.35
6 Computerisation 185.22 111.6 60.25 272.28 196.11 72.03 281.87 118.23 41.94 7 Railway Research 25.15 6.54 26.00 40.05 32.6 81.40 21.74 19.8 91.08 8 Rolling Stock 5172.19 5006.92 96.80 6661.39 6339.9 95.17 8439.11 8129.17 96.33 9 Leased Assets-Payment of Capital
Component 1615.59 1615.59 100.00 1720.12 1720.12 100.00 1649.85 1677 101.65
10 Road Safety Works-Level Crossings 299.98 117.25 39.09 274.92 145.03 52.75 499.93 185.8 37.17 11 Road Safety Works-Road Over
Bridges/Under Bridges 410.83 144.99 35.29 435.86 214.91 49.31 550.67 347.55 63.11
12 Track Renewals 2890.03 3223.64 111.54 3418.39 3796.06 111.05 3367.38 3035.04 90.13 13 Bridge Works 483.3 409.33 84.69 512.32 469.39 91.62 660.74 457.36 69.22 14 S & T works 1164.13 1042.54 89.56 1345.35 1179.15 87.65 1550.94 1342.8 86.58 15 Electrification 68.96 73 105.86 223.04 241.25 108.16 453.41 463.57 102.24 16 Other Electric Works 184.05 159.74 86.79 23.481 211.24 899.62 276.57 245.3 88.69 17 Machinery & Plant 199.37 185.83 93.21 238.68 174.53 73.12 286.05 191.68 67.01 18 Workshops & Production Units 332.03 238.44 71.81 421.41 358.87 85.16 604.81 495.13 81.87 19 Staff Quarters 80.17 60.78 75.81 115.13 87.82 76.28 189.86 168.06 88.52 20 Amenities for Staff 96.83 91.99 95.00 145.38 127.56 87.74 215.09 183.31 85.22 21 Passenger Amenities 273.54 256.19 93.66 400.98 407.5 101.63 633.6 668.17 105.46 22 Investment in PSUs (Rail Vikas Nigam) 593.4 172.67 29.10 2028 1710 84.32 1473.4 1581.74 107.35 23 Other Specified Works 220.48 187.87 85.21 268.21 241.02 89.86 338.16 293.7 86.85 24 Stores Suspense, Manufacture Suspense
etc. 181.91 698.5 383.98 423.1 710.82 168.00 501.62 754.33 150.38
25 MTPs 224.29 211.57 94.33 259.77 253.43 97.56 485.82 400.8 82.50 Total 18975.80 18320.35 96.55 25646.92 25002.08 97.49 30618.41 28980.34 94.65
Source: Year Book, published by M/o Railways, Railway Board
110
2.Rail Transport
Utilisation
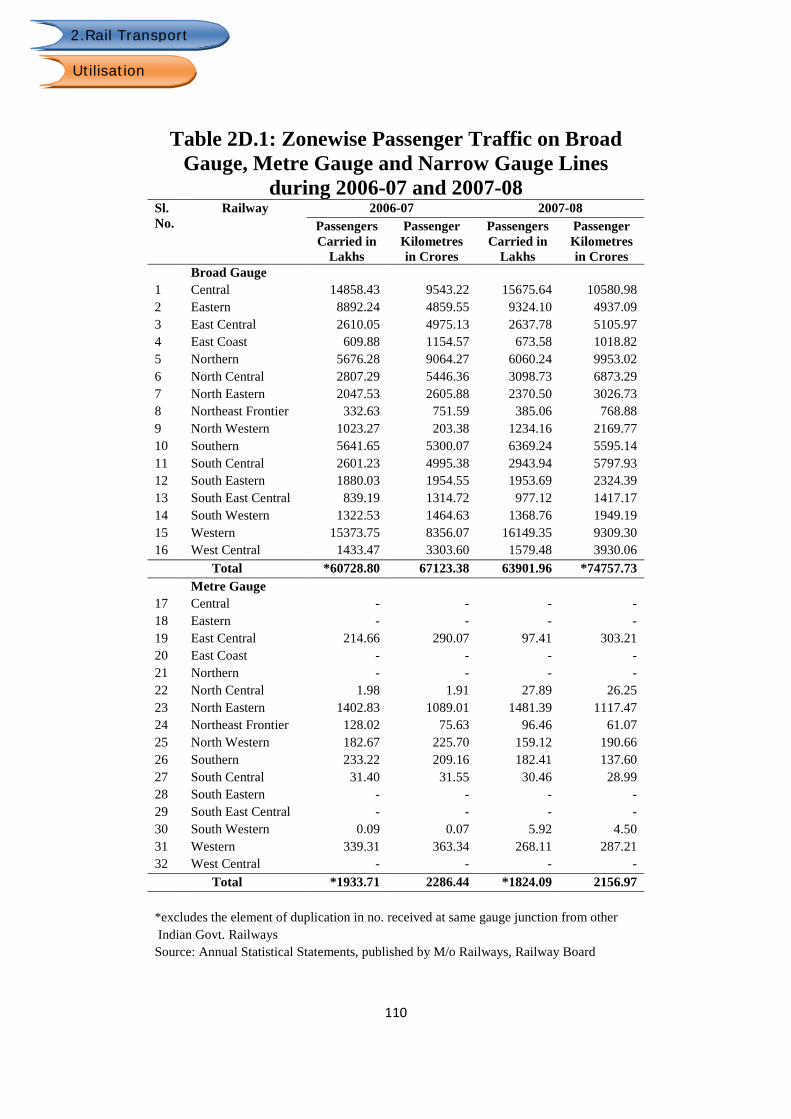
Table 2D.1: Zonewise Passenger Traffic on Broad Gauge, Metre Gauge and Narrow Gauge Lines
during 2006-07 and 2007-08 Sl. No.
Railway 2006-07 2007-08 Passengers Carried in
Lakhs
Passenger Kilometres in Crores
Passengers Carried in
Lakhs
Passenger Kilometres in Crores
Broad Gauge 1 Central 14858.43 9543.22 15675.64 10580.98 2 Eastern 8892.24 4859.55 9324.10 4937.09 3 East Central 2610.05 4975.13 2637.78 5105.97 4 East Coast 609.88 1154.57 673.58 1018.82 5 Northern 5676.28 9064.27 6060.24 9953.02 6 North Central 2807.29 5446.36 3098.73 6873.29 7 North Eastern 2047.53 2605.88 2370.50 3026.73 8 Northeast Frontier 332.63 751.59 385.06 768.88 9 North Western 1023.27 203.38 1234.16 2169.77 10 Southern 5641.65 5300.07 6369.24 5595.14 11 South Central 2601.23 4995.38 2943.94 5797.93 12 South Eastern 1880.03 1954.55 1953.69 2324.39 13 South East Central 839.19 1314.72 977.12 1417.17 14 South Western 1322.53 1464.63 1368.76 1949.19 15 Western 15373.75 8356.07 16149.35 9309.30 16 West Central 1433.47 3303.60 1579.48 3930.06
Total *60728.80 67123.38 63901.96 *74757.73 Metre Gauge 17 Central - - - - 18 Eastern - - - - 19 East Central 214.66 290.07 97.41 303.21 20 East Coast - - - - 21 Northern - - - - 22 North Central 1.98 1.91 27.89 26.25 23 North Eastern 1402.83 1089.01 1481.39 1117.47 24 Northeast Frontier 128.02 75.63 96.46 61.07 25 North Western 182.67 225.70 159.12 190.66 26 Southern 233.22 209.16 182.41 137.60 27 South Central 31.40 31.55 30.46 28.99 28 South Eastern - - - - 29 South East Central - - - - 30 South Western 0.09 0.07 5.92 4.50 31 Western 339.31 363.34 268.11 287.21 32 West Central - - - -
Total *1933.71 2286.44 *1824.09 2156.97 *excludes the element of duplication in no. received at same gauge junction from other Indian Govt. Railways Source: Annual Statistical Statements, published by M/o Railways, Railway Board

111
2.Rail Transport 2.Rail Transport
Utilisation
Table 2D.1(contd.): Zonewise Passenger Traffic on Broad Gauge, Metre Gauge and Narrow
Gauge Lines during 2006-07 and 2007-08 Sl. No.
Railway 2006-07 2007-08 Passengers Carried in
Lakhs
Passenger Kilometres in Crores
Passengers Carried in
Lakhs
Passenger Kilometres in Crores
Narrow Gauge 33 Central 20.45 8.08 23.89 8.60 34 Eastern 6.20 2.51 6.36 2.57 35 East Central - - - - 36 East Coast - - - - 37 Northern 38.22 23.10 39.61 23.73 38 North Central 0.65 0.22 30.69 10.75 39 North Eastern - - - - 40 Northeast
Frontier 0.57 0.46 0.40 0.25
41 North Western - - - - 42 Southern - - - - 43 South Central - - - - 44 South Eastern - - - - 45 South East
Central 82.08 29.22 87.74 32.09
46 South Western - - - - 47 Western 11.12 2.98 9.86 2.86 48 West Central - - - -
Total *159.27 66.58 *198.52 80.85 Zone Total *62188.81 69476.40 *65243.77 76995.56
*excludes the element of duplication in no. received at same gauge junction from other Indian Govt. Railways Source: Annual Statistical Statements, published by M/o Railways, Railway Board

112
2.Rail Transport
Utilisation
Table 2D.2: Zone wise Suburban and Non-suburban Passenger Traffic on Broad Gauge Lines during 2006-07 and 2007-08
( in crore numbers) Sl. No.
Railway Suburban Non-Suburban 2006-07 2007-08 2006-07 2007-08
Passengers Carried
Passenger Kilometres
Passengers Carried
Passenger Kilometres
Passengers Carried
Passenger Kilometres
Passengers Carried
Passenger Kilometres
1 Central 1279 38761.55 1337 40728.64 207 56670.62 231 65081.19 2 Eastern 761 29618.92 798 30091.79 128 18976.55 134 19279.10 3 Northern 3 46.87 3 47.26 565 90595.83 603 99482.91 4 Southern 291 6500.02 324 7312.39 273 46500.68 312 48639.02 5 South
Eastern 87 2905.49 87 3369.47 101 16640.00 109 19874.41
6 Western 1254 34064.45 1320 38292.69 283 49496.24 294 54800.33
Zone Total *3514 111897.30 *3689 119842.25 *2559 559336.52 *2701 627735.09 *excludes the element of duplication in no. received at same gauge junction from other Indian Govt. Railways Source: Annual Statistical Statements, published by M/o Railways, Railway Board

113
2.Rail Transport
Utilisation
2.Rail Transport
Utilisation
Table 2D.3 : Zonewise Freight Traffic on Broad Gauge, Metre Gauge and Narrow Gauge Lines
during 2006-07 and 2007-08 Sl. No.
Railway Total Freight Traffic (Revenue + Non Revenue) 2006-07 2007-08
Tonnes carried in thousands
Tonne km in lakhs
Tonnes carried in thousands
Tonne km in lakhs
Broad Gauge 1 Central 109403 378663 117100 388596 2 Eastern 86682 143636 91029 139894 3 East Central 123884 319111 133683 335676 4 East Coast 114335 409092 131635 474801 5 Northern 142437 397646 153050 411802 6 North Central 134826 576581 151272 603754 7 North Eastern 27454 93019 26669 92150 8 Northeast Frontier 16911 110958 23710 129222 9 North Western 37825 169233 37249 172170 10 Southern 36803 149639 67370 151335 11 South Central 127494 475677 136386 523189 12 South Eastern 144507 349930 172988 423727 13 South East Central 136374 369361 162647 442164 14 South Western 62205 136470 59761 147705 15 Western 85075 396626 90319 419790 16 West Central 107098 343772 164534 365491
Total 741528 4819415 801170 5221467 Metre Gauge 0 0 17 Central - 0 - 0 18 Eastern - 0 - 0 19 East Central 582 597 487 481 20 East Coast - 0 - 0 21 Northern - 0 - 0 22 North Central - 0 - 0 23 North Eastern 1580 2707 2729 4275 24 Northeast Frontier 1589 6994 2492 5086 25 North Western 843 2753 250 466 26 Southern 212 444 51 63 27 South Central 43 69 4 5 28 South Eastern - 0 - 0 29 South East Central - 0 - 0 30 South Western 1 0.05 3 2 31 Western 1162 1244 107 118 32 West Central - 0 - 0
Total 4169 14808 3931 10495 - Not Available Source: Annual Statistical Statements, published by M/o Railways, Railway Board
114
2.Rail Transport
Utilisation
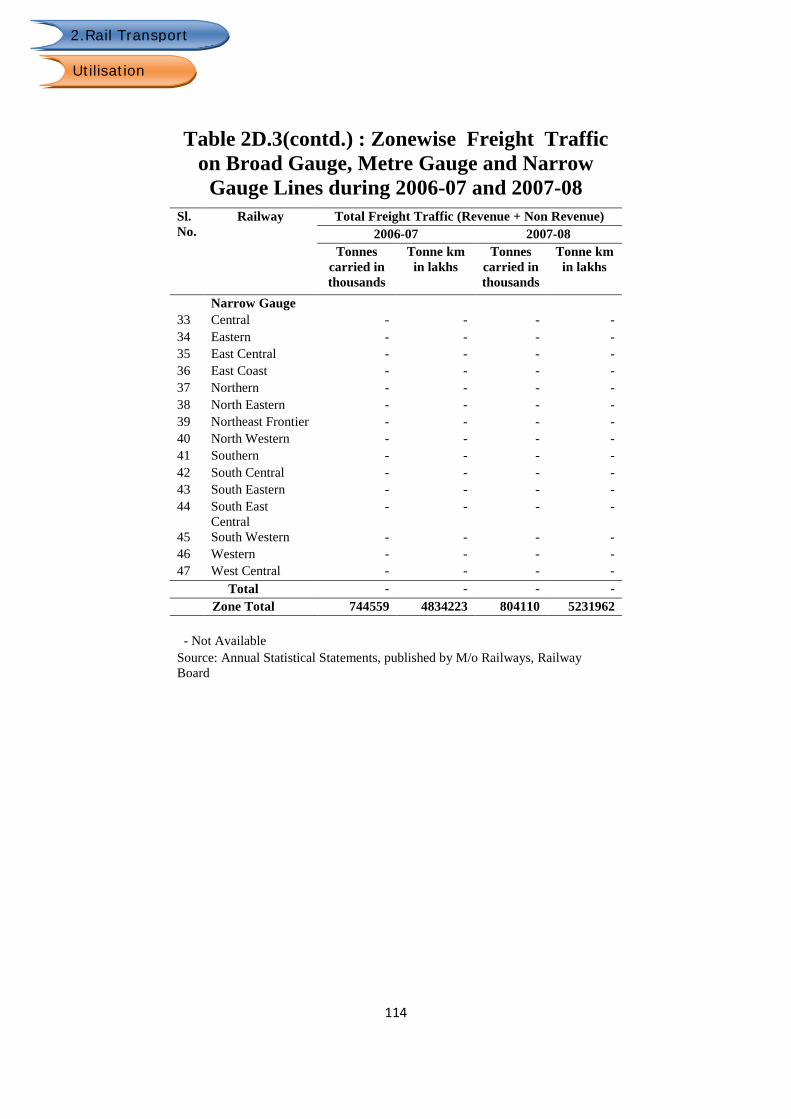
Table 2D.3(contd.) : Zonewise Freight Traffic on Broad Gauge, Metre Gauge and Narrow
Gauge Lines during 2006-07 and 2007-08 Sl. No.
Railway Total Freight Traffic (Revenue + Non Revenue) 2006-07 2007-08
Tonnes carried in thousands
Tonne km in lakhs
Tonnes carried in thousands
Tonne km in lakhs
Narrow Gauge 33 Central - - - - 34 Eastern - - - - 35 East Central - - - - 36 East Coast - - - - 37 Northern - - - - 38 North Eastern - - - - 39 Northeast Frontier - - - - 40 North Western - - - - 41 Southern - - - - 42 South Central - - - - 43 South Eastern - - - - 44 South East
Central - - - -
45 South Western - - - - 46 Western - - - - 47 West Central - - - -
Total - - - - Zone Total 744559 4834223 804110 5231962
- Not Available Source: Annual Statistical Statements, published by M/o Railways, Railway Board