explaining policy bandwagons with markov models · potential! explanations! for! this!unbalanced...
TRANSCRIPT

"Explaining Policy Bandwagons with Markov models"
Charlotte Jourdain1, Simon Hug and Frédéric Varone
ECPR Joint Sessions -‐ Salamanca -‐ 2014, April 1-‐15
Workshop "Methodological Challenges and Contradictory Results in the Study of Interest Groups"
Abstract: The distribution of lobbying activities across policy issues seems to be highly skewed: most
issues attract very little attention from interest groups ("interest niches"); vice versa, very few issues
attract much attention and lead to lobbying extravaganzas ("policy bandwagons"). What are the
potential explanations for this unbalanced pattern of interest groups mobilization? This paper
addresses this question by analyzing the bandwagons dynamics in four California policy-‐making
processes: regulation of stem cell research, construction of the high speed rail, promotion of
renewable energies and immigrants' access to higher education. It investigates interest groups
mobilization in all the institutional venues (i.e. parliamentary, administrative, judicial and direct
democracy) activated during a policy-‐making process. Using Markov transition models to grasp the
policy bandwagons dynamics, this empirical study shows that mobilization in a particular venue is
dependent on mobilization in preceding venues. Furthermore, these venues differ in terms of
mobilization and continued mobilization. While the direct democracy venue is much more likely to
bring IGs on the bandwagon, this venue is not quite as hospitable for continuing mobilization.
Jumping on the bandwagon (or remaining there) depends on advancement through the policy-‐
making process. While the probability of mobilization over time increases slowly, the likelihood of
staying on the bandwagon is higher both at the beginning and towards the end of the process. In
addition, these differences are especially marked in the administrative and legislative venues. Also,
we do not find any significant differences between business and occupational groups (i.e. sectional
IGs) on the one hand, and the remaining types of groups (i.e. cause IGs) on the other in terms of their
mobilization efforts. Finally, we find that following up on a direct democracy initiative increases the
likelihood of mobilization, provided the next venue is not the judicial system.
1 Ch. Jourdain and F. Varone acknowledge the financial support of the Swiss National Science Foundation (funding of project 100017_149689). F. Varone is also grateful to the Center for the Study of Law and Society (CSLS) at UC Berkeley where he was a visiting scholar in 2012-‐2013. (Corresponding author: [email protected]).
"Explaining Policy Bandwagons with Markov models"
1. Introduction
Frank Baumgartner & Beth Leech (2001) proposed the concept of “policy bandwagons” to capture
policy issues that become the "object of veritable lobbying extravaganzas" (Baumgartner & Leech
2001: 1200). These authors have analyzed more than 19'000 lobbying disclosure reports filed by
organized interests in 1996 at the US federal level. Each report declares the lobbying activities
undertaken by an interest group (IG) to influence a member of the Congress, his/her staff or a high-‐
level civil servant. The distribution of these lobbying activities across a random selection of 137 policy
issues shows that 5% of all policy issues attract more than 45% of all lobbyists' attention. In sharp
contrast to these "policy bandwagons" involving hundreds of lobbyists on Capitol Hill, 50% of all
policy issues do not mobilize more than 3% of all lobbying activities. IGs that are active in such
"interest niches" face almost no rival.
This remarkably skewed distribution of lobbying activities is also observable in other political
systems. For instance, Darren Halpin (2011) replicated the US study by mapping the mobilization of
IGs during 1'691 public consultations organized by the Scottish government from 1982 to 2007. The
180'000 responses filed by IGs to these official consultations about draft bills, regulations, national
transposition of European Union directives etc. are considered functional equivalents to the US
lobbying disclosure reports. The 1'691 consultation procedures correspond to the diverse policy
issues at stake. The distribution of responses to official consultations across policy issues has a similar
pattern to the imbalance previously identified by the US scholars: The 50% of issues with the lowest
mobilization levels accounts for about 5% of all responses, while the top 10% of issues generate
more than 40% of all consultation activities (Halpin 2011:201-‐211). Thus, in Scotland too, few policy
bandwagons co-‐exist with many "quiet corners".
This paper builds upon these findings and investigates the level of IGs mobilization in four
California policy-‐making processes. The first objective is to empirically measure IG mobilization levels
and to locate them, for each of the four policy issues, on a continuum ranging from "interest niches"
to "policy bandwagons". This study also aims at identifying the dynamics underlying the (more or less
extravagant) mobilization of IGs across policy sectors. In sharp contrast to the previous studies
focusing on IGs mobilization in one single institutional venue (i.e. the legislative venue in
Baumgartner & Leech 2001; the executive venue in Halpin 2011), the present investigation is more
encompassing. It considers simultaneously all institutional venues activated by IGs during an entire
policy-‐making process. To influence successive policy decisions, an IG can lobby the Parliament (law-‐
making) and/or the Executive (rule-‐making); it can also bring a case to a Judicial Court (litigation); or
it can launch a Popular Initiative, as the California political system provides for this direct-‐democracy
instrument. The first innovation of this paper is thus to grasp (potential) policy bandwagon dynamics
across the successive steps of a policy-‐making process. This study has a second value added to the
existing literature, as it gathers new empirical material through the comparative analysis of four
California case studies: the regulation of human embryonic stem cell research (STEM); the
construction of the California High Speed Rail running from Sacramento to San Diego (HSR); the
Renewable Portfolio Standards which are obligations on electricity retail sellers to include in their
portfolios a certain amount of electricity from renewable energy sources (RPS); and access to state-‐
funded financial aid for higher education to children who were brought to the United States illegally
before the age of 16 (IMMIG). Last but not least, the methodology applied to capture IGs
mobilization relies on Markov transition models and, to the best of our knowledge, is rather
uncommon within the IGs literature. The third contribution of this study is thus to offer a first step in
the direction of Jones and Baumgartner's (2005:142) recommendation to rely on Markov switching
models for grasping the consequences of attention cascades among policy actors, mimicry and other
self-‐reinforcing processes that eventually translate into the emergence of policy bandwagons.
The paper is structured as follows: Section 2 explains the theoretical framework and
expectations regarding policy bandwagon dynamics. The description of the four scrutinized cases
studies follows. Section 4 presents descriptive statistics as the first step to test the theoretical
hypotheses. The Markov transition models are then introduced and the results of the global model
are commented. After summarizing the main findings, the concluding section put them into
perspective.
2. Theoretical framework
If the skewed pattern of IGs mobilization is observable in different institutional venues, political
systems and time periods, what are the potential explanations of this phenomenon? Baumgartner
and Leech (2001) mention first the size and scope of the policy issue: "issues costing more money,
involving a greater departure from status quo, and affecting more people will attract more
attention"(2001: 1205). Second, the conflict expansion strategy (Schattschneider 1960) followed by
some interest groups is an alternative explanation. As some first-‐movers mobilize to put an issue
(high) on the agenda, the level of visibility of this policy issue increases and induces the followers to
enter the political debate. These late-‐comers monitor what other organized interests do, take cues

from the lobbying behavior of others and, eventually, imitate them. Mimicry and attention cascade
are by definition self-‐reinforcing processes, based on positive feedbacks, and translate into the
emergence of a policy bandwagon (2001: 1206; see also Jones & Baumgartner 2005:140-‐142).
While Baumgartner and Leech do not systematically test these two research hypotheses,
Halpin (2011) demonstrates that the size and scope hypothesis is inaccurate. The number of
invitations to answer a consultation, the level of government expenditures concerned by the issue
submitted to consultation, and the stage of this issue in the policy cycle (i.e. three indicators for the
scope and size of the issue) do not explain the response rates to the governmental consultations in
the Scottish context. Therefore, to understand bandwagons dynamics, Halpin (2011) further
differentiates the mimicking and attention cascade hypothesis. Concretely, he identifies four agents
who shape policy attention and potentially contribute to cascades. (1) Media can be cue givers, at
least for individuals and IGs that are not specialized in the policy issue at stake. (2) Keystone groups
(i.e. umbrella or peak groups, but also informal coalition of interest groups) may foster the attention
of organized interest towards an issue. However, it is worth noting that such keystone groups
potentially play two opposite roles: either they aggregate the lobbying activities of their
organizational members, act as a sponge and thus slow down or even hinder the policy bandwagons
chain-‐reaction; or, on the contrary, they stimulate the active mobilization of their members and, in
doing so, accelerate and amplify the cascade process. (3) Mass-‐members campaign groups can also
work as amplifiers by asking their individual members to send (amended) standard letters to policy
makers. Grassroots mobilization is one mechanism underlying the emergence of policy bandwagons.
(4) Finally, civil servants themselves may foster advocacy activities by interest groups, for instance
during the pre-‐parliamentary consultation or rule-‐making procedures. Promoting the feedbacks of
many organized interests is an appealing strategy to public servants in order to assess the practical
feasibility and political acceptability of their policy proposal. In addition, this also allows for reducing
the strong pressure, "clientelistic" relationships or even the capture of a public administration unit by
some powerful lobbies. While all these mechanisms seem plausible, Halpin (2011) unfortunately
does not test their respective empirical validity for the Scottish governmental consultations.
According to this very brief literature review, no strong and conclusive empirical evidence
exists about the hypotheses formulated so far. In addition, the theoretical expectations remain
rather vague. For instance, they are not calibrated at all to address the (potentially different)
dynamics of policy bandwagons in various institutional venues in which IGs mobilize. Facing such a
knowledge gap, this paper proposes three research hypotheses regarding the level of IGs
mobilization in different venues and, furthermore, explanatory factors for the emergence of policy
bandwagons dynamics.
The first expectation concerns the differentiated levels of bandwagons that should be
observed in alternative institutional venues. It reads as follows: the mobilization of interest groups
and the policy bandwagons dynamics are stronger in the direct democracy venue than in the
administrative and parliamentary venues and, finally, in the judicial venue (hypothesis 1).
Several arguments support this expectation. First, the four mechanisms defined by Halpin
(2011, see above) to explain policy bandwagons are not all at work in all venues, at least not to the
same extent. They are obviously less prevalent in the judicial venue, as the access to the courts is
strongly regulated by formal rules defining who has standing (“justiciability”) to be a
plaintiff/defendant, who can introduce an amicus brief, etc. The direct impacts of mass media or
members' campaign are thus probably limited in the judicial venue. By contrast, these factors are
absolutely decisive in the direct democratic venue. Media attention and demonstrative actions by
mass members IGs are at the very heart of every voting campaign. For what concerns the two other
venues, the access rules regarding rule-‐making procedure and parliamentary lobbying – i.e.
disclosure report – are apparently stricter than the conditions to be fulfilled for contributing
financially to a ballot campaign coalition. In one word, the mobilization of IGs is more or less strongly
constrained by formal rules depending upon the institutional venue.
A second argument is related to the initial resources (e.g. money, expertise, manpower, etc.)
necessary to fully engage in specific advocacy activities (Walker 1991, Heinz et al. 1993, Baumgartner
and Leech 1998 and 2001, Beyers 2008, etc.) It has been argued that the advocacy costs are lower for
lobbying than for litigation; this seems to hold true even for business groups (i.e. IGs with the
presumably highest resource endowment) that choose lobbying the Parliament or the
Government/Administration more frequently than litigation (Bouwen and McCown 2007). One could
thus expect that IGs display a higher level of mobilization in venues characterized by lower advocacy
costs. As a matter fact, it is quite easy to spend 500 US $ for a voting campaign, but more challenging
to hire a lobby firm to influence law-‐ or rule-‐making procedure and, even more costly to have either
an in-‐house counsel or to hire an attorney in order to become a party in a judicial suit or, at least, to
introduce an amicus brief.
In addition to this classical “resources count” argument, litigation is also frequently perceived
as the weapon of the weakest IGs according to the seminal "political disadvantage" theory (Cortner
1968: 287). Bringing a case to the court is a fall back option used only if the IG has no privileged
access to Congress, Governor or rule-‐making Agencies. Outsider IGs will engage in litigation if they
have no best alternative venue or when everything else has already failed. However, it is worth
noting that this argument has been recurrently invalidated by empirical studies, in various

institutional setting (e.g. Olson 1990; Hansford 2004; Binderkrantz 2005; Kriesi et al. 2007). Some of
these studies rather concluded that all IGs use the litigation strategy, not only the weakest one. In
any case, and even if this strategy is used by (potentially) all IGs, we do not expect to observe
bandwagons dynamics in the judicial venue as the formal access rules and advocacy costs represents
important barriers here.
Finally, while only few studies compare advocacy activities by IGs across several venues,
some interesting – but partial – results tend to support the first hypothesis proposed here. For
instance, a similar level of IGs mobilization and dynamic of policy bandwagon is expected in the
parliamentary and in the governmental/administrative venues: Boehmke et al. (2013) have recently
demonstrated that the level of IGs lobbying in one of these two venues is strongly related to its level
in the other venue. These authors came to this conclusion after having analyzed the lobbying reports
filled by IGs in the State of Minnesota and at US federal level. Their empirical findings are also
congruent with previous studies based on survey data (i.e. advocacy activities self-‐reported by
lobbyists and IG leaders) showing that the most important venues for IGs are the Legislature, the
Governor and Executive agencies, while the Courts tend to play a marginal role (Nownes and
Freeman 1998; McKay 2011).
The second expectation relates to the successive phases of the policy-‐making process (in
addition to the type of institutional venues activated, as addressed by the first hypothesis). It claims
that the mobilization of interest groups and the policy bandwagons dynamics are stronger towards
the end than at the beginning of the policy-‐making process (hypothesis 2).
A double logic of policy influence and membership (as proposed by Schmitter and Streeck
1999) characterizes the strategic behavior of IGs involved in a policy-‐making process. The
implementation of this dual strategy by IGs is the main rationale for the second hypothesis. On one
hand, if an IG mobilizes during the initial or early stages of the policy process and unfortunately
looses, then this IG will not "give up" the policy battle afterwards. On the contrary, the IG will
probably follow the issue across the different steps of the policy cycle (i.e. within the same venue or
across different venues, depending upon the evolution of the policy process itself), as long as it
cannot realize its preferred outcome. The same strategic behavior should also be observed if an IG
wins a first policy battle during the initial policy step: in order to concretize the substantive content
of the policy and, furthermore, to avoid a major policy change, the IG stays mobilized and acts as
repeat player.
For instance the winners of a direct democracy ballot (i.e. legislative or constitutional
initiative) want to avoid that their opponents "steal" their initiative through a judicial review process
(Gerber et al. 2001). As a matter of fact, the judicial review of voter-‐approved initiative is very high in
California (Miller 2009:104ff): Opponents challenged about 69% of all accepted initiatives and
(mainly state) courts invalidated about 38% of these initiatives from 1970 to 1990. Going one step
further, the joint application of the first and second hypotheses to the direct democracy and judicial
venues leads to the formulation of the following hypothesis: the mobilization of interest groups and
the policy bandwagons dynamics are stronger if the judicial venue follows directly the direct
democracy venue in the policy-‐making process (Hypothesis 2 bis).
The logic of policy influence is highly plausible -‐ for both losers and winners -‐ even if the
policy issue at stake moves from one institutional venue (e.g. law-‐making in Legislature) to another
venue (e.g. veto by Governor and then rule-‐making by Agencies). As a matter of fact, most IGs do not
specialize in one specific venue but use complementary strategies along the policy process,
alternating for instance cooperative and confrontational advocacy activities (Binderkrantz 2005).
On the other hand, the logic of membership is also a strong impetus for IGs to closely
monitor the entire policy-‐making process. To secure the survival, maintenance or reinforcement of
its own organization (e.g. membership, financial resources, reputation, etc.), an IG has to
demonstrate to its (potential) members that it is resilient warrior and repeat player (Olson 1990;
Solberg and Waltenburg 2006; Lowery 2007). Faced with competition for members, an IG has an
incentive to mobilize in all venues (in which opposing or competing IGs are mobilized too), or risk
loosing members and the ability to attract potential ones. This leads to a high mobilization of most
IGs, even if their advocacy activities have no real chance of success and are purely symbolic (Holyoke
2003). In addition, a third "logic of reputation" could also be a strong incentive for IGs to be active in
institutional venue with high media coverage (Berkhout 2013). All in all, once they enter the policy
battleground, IGs do not leave it easily and, as the number of IGs mobilized gradually cumulates
along the successive of stages policy cycle, then the logical consequence is that policy bandwagons
shall be rather observed towards the end of the policy process2.
The third hypothesis focuses neither on the type of institutional venue, nor on the stage of
the policy cycle, but on the type of Interest groups. It claims that sectional IGs mobilize more than
2 Note that the logic of policy influence applies to all types of IGs, but that the logic of membership applies to all IGs except business. For this category, the logic of membership applies to peak-‐level, sector-‐wide and technical associations but not to individual firms. It’s of course hard to say which of the two logics (influence or membership) has the strongest effect.

cause IGs over the whole policy process and thus contribute more to the dynamics of policy
bandwagons (hypothesis 3).
Using a categorization of IGs initially developed by Scholzman et al. (2008) and then adapted
by the Interarena (A. Binderkrantz, Aahrus) and Intereuro (J. Beyers, Antwerp) projects, the present
study distinguishes between business associations, occupational groups, unions, public interest
groups, identity groups, religious groups and institutional groups (i.e. public authorities as members).
These seven categories are then aggregated in two broader types of IGs: Business and occupational
interests are defined as "sectional IGs", while all other categories merge into the type "cause
groups". This aggregation (based on Stewart typology 1958; see also Klüver 2013, Klüver and Giger
2014) makes sense as sectional groups aim at represent the interest of a very specific segment of
society (i.e. business, professionals) and delivering private goods to their members, while cause
groups are open to anyone and fight for public goods (e.g. human rights, environmental protection,
etc.) or principle (i.e. union advocating for fair wages and safe working conditions). Furthermore, we
expect different behavior for these two types of IGs.
Sectional IGs are expected to be strongly mobilized and to significantly contribute to policy
bandwagons. This is due, first, to the goals they pursue, namely the provision of private benefits for
their own members. Examples from the case studies investigated here include research funding for
universities working on stem cells, new market share for the private firms constructing the High
Speed Rail, State support for the producers of renewable energies, etc. They face thus no major
problem of collective action. Second, most of these IGs are de facto peak associations or sector-‐wide
associations at least. In line with the argument developed by Halpin (2011), such keystone groups
should stimulate the active mobilization of their individual members and, thus, sustain the
mobilization cascade. Third, these IGs absolutely need to mobilize in order to promote a policy
change that will translate into material rewards for themselves. Baumgartner et al. (2009:113)
showed that there is generally a strong inertia towards the status quo (i.e. no stem cell research, no
high speed rail, no increase of renewable energies etc.) and that pro change IGs shall invest more
resource to overcome the bias in favor of the status quo. Finally, sectional groups are active in all
venues and, as suggested by Binderkranz et al (2012), benefit for the "cumulativity or spill-‐over
effect" between institutional venues. In Denmark, for instance, a small number of IGs (mainly
business groups) are de facto present in all venues and account for about two-‐third of all advocacy
activities. By opposition, cause groups are expected to mobilize less along the whole policy making
process, despite the fact that in some specific venue they can significantly contribute to sustain
policy bandwagons: this should be the case for mass member campaign groups in the direct
democracy venue (see also Halpin 2011).
To test these three hypotheses, four empirical cases are investigated and compared. The
next section introduces the issues at stake as well as the chronology of the policy-‐making process.
3. The four policy issues at stake
The present study is based on four cases studies concerning very different policy issues. This diversity
means that the IGs mobilized in the four policy-‐making processes are extremely diverse too.
However, in order to control for the hypothesis formulated by Baumgartner and Leech (2001:1205)
about the scope and size of a policy issue, the research design compares four cases that are all
characterized by a high public and political saliency, scope and size. As mentioned in the following
case descriptions3, each issue has important budgetary impacts and potentially affects many people
in California. In one word, the comparison focuses on completely different but equally important,
and thus comparable, California policies.
(1) Regulating Research on Stem Cells (STEM): In 2002, the California Legislature passed
Senate Bill (SB) 253 allowing research on human embryonic stem cells (hESC.) One year later, SB 771
established an anonymous registry of embryos for research purposes. California thus became a
haven for hESC research, but public funding was still unavailable. Robert Klein, board member of the
Juvenile Diabetes Research Foundation and father of a diabetic son, took control of Proposition 71,
which (1) makes conducting hESC research a state constitutional right, (2) allocates $3 billion over a
period of 10 year to hESC research, and (3) creates a public agency, the California Institute for
Regenerative Medicine (CIRM) and an Independent Citizen’s Oversight Committee (ICOC) to oversee
it. In 2004, California voters approved Proposition 71. In 2005, plaintiffs People's Advocate and
National Tax Limitation Foundation filed an action in Superior Court against the ICOC, arguing that
the disbursement of state funds by a private entity not under the exclusive control of the state
violates the California Constitution. Shortly after, plaintiff California Family Bioethics Council, LLC (the
Council) filed another complaint against CIRM, contending that Proposition 71 concealed the true
scope, meaning and costs of the initiative from the voters. These two actions were consolidated and
in 2006 the Court ruled that plaintiffs failed to show that Proposition 71 was unconstitutional. In
2007, the California Court of Appeal, confirmed once again that Proposition 71 did not violate the
Constitution and did not mislead the voters. In 2006, the Legislature passed SB 1260, which
indefinitely extends the duration of existing law4. Finally, the CIRM, endowed by Proposition 71, has
3 See the appendix 1 to 4 for a chronology of all policy decisions than were made in all institutional venues during the policy-‐making process of each case study.
4 i.e. S.B. 252 and 771, supposed to be repealed on January 1, 2007
launched several rule-‐making procedures about medical and ethical standards, and Intellectual
Property and Revenue-‐Sharing Requirements for Non-‐Profits and For-‐Profit Grantees.
(2) Non-‐resident aliens’ access to higher education (IMMIG): In 1999 the California
Legislature approves AB 1197, requiring that an alien precluded from establishing California
residency due to federal law be exempt from paying non-‐resident tuition when pursuing higher
education in California. Governor Davis vetoed AB 1197 in 2000, citing a revenue loss to the state of
over USD 63.7 millions. In 2001, AB 540 allows specific non-‐residents to meet state residency
requirements for the purposes of establishing higher education tuition level, if the student graduated
from a California high school, continues his/her education within one year after graduation, and signs
an affidavit that he/she has filed an application to legalize his/her immigration status. In 2005 SB 160
provides alien students eligible for in-‐state tuition with access to all available financial aid programs,
including public ones. But Gov. Schwarzenegger vetoed this bill in 2006, arguing that such legislation
would reduce the financial aid available to legal California residents.
In 2005, plaintiff Robert Martinez, represented by the University of Missouri Immigration
Reform Law Institute (amongst other counsels), challenged the constitutionality of AB 540, arguing
that it discriminates against U.S. citizens legally present in California, who must pay out-‐of-‐state
tuition. The Superior Court ruled in favor of defendants the Regents of the University of California et
al., upholding AB 540. But in 2008, the California Court of Appeals overturned this ruling, voiding the
law passed by AB 540. This decision was appealed and the California Supreme Court grants petition
for review in 2008. In 2010, the California Supreme Court reversed the judgment of the Court of
Appeals, finding that AB 540 did not violate federal immigration law. Opponents attempted to appeal
again, but the U.S. Supreme Court denied petition for certiorari in 20115.
In 2007 the Legislature passed SB 1, to allow eligibility for state-‐funded financial aid to high
school graduates who meet the non-‐resident in-‐state tuition requirements. However Gov.
Schwarzenegger vetoes the bill, citing budgetary concerns. In 2008, the Legislature enrolls SB 1301,
which requires that the state’s institutions of high education provide institutional financial aid to
students exempt from nonresident tuition. Gov. Schwarzenegger vetoed the bill for fiscal reasons. In
2010 SB 1460 would have expanded eligibility for state-‐administered financial aid to students exempt
from paying nonresident tuition. Gov. Schwarzenegger vetoes the bill. The Legislature follows with
5 In this and all other cases, we treat judicial petition for review as self-‐standing decisions. If the petition is denied, the lower court’s ruling stands.

SB 1460 and AB 14136 in 2010, both of which were vetoed again later that year. In 2011 AB 130
enacts the California DREAM Act. All students exempt from nonresident tuition pursuant to AB 540
shall be eligible to receive non-‐state funded scholarships. Subsequently AB 131 expands eligibility for
state-‐administered student financial aid programs to include AB 540 students. Governor Brown
signed these two bills into law the same year.
(3) The California High-‐Speed Rail (HSR): In 2002 the Legislature passes SB 1856, the Safe,
Reliable High-‐Speed Passenger Train Bond Act of the 21st century. Providing USD 9.95 billion in
general obligation authority, the Act was required to be submitted to California voters in the 2004
general election. In early 2004, SB 1160 delays the scheduled vote on the Bond Act to 2006. The
state’s structural budget deficit is cited as explanation. In 2006, AB 713 further delays the vote to
2008. That year, AB 3034 revises, updates and expands the Bond Act to be placed on the ballot, and
designates it as Proposition 1A. Voters approve it at the November 2008 general election.
In 2011, individuals and the County of Kings challenge the California High Speed Rail
Authority (CHSRA) in Superior Court. The court finds that the agency abused its discretion by
approving a funding plan that did not comply with the requirements of the law. In 2012 the City of
Palo Alto, the Community Coalition on High Speed Rail and the mid-‐peninsula residents for Civic
Sanity obtain from the court that the CHSRA rescind and set aside its determination certifying the
Environmental Impact Report and approval of the project for the Bay Area to Central Valley. During
these judicial proceedings, in 2012 the Legislature approves construction financing for an initial stage
of the project with SB 1029, including 4.5 billion in bonds previously approved by voters, which in
turn, freed up USD 3.2 billion in federal funding.
In 2013 the Court finds, in Town of Atherton, the Planning and Conservation League, the City
of Menlo Park, Transportation Solutions Defense and Education Fund, the California Bayrail Alliance
v. CHSRA, that the agency’s approval of the Bay Area to Central Valley project failed to comply with
requirements of California Environmental Quality Act for the Bay Area to Central Valley part of the
project. These last two cases were appealed together and parties are awaiting the Court’s decision as
of March 2014. Still in 2013, the County of Madera, Preserve our Heritage, Madera County Farm
Bureau, Merced County Farm Bureau, Chowchilla Water District and Valley Calf LLC, after preliminary
court proceedings, reach a binding settlement with the CHSRA. Finally, in 2013 the CHSRA brings
legal action against the County of Kings, Union Pacific Railroad, Howard Jarvis Taxpayers Association,
6 The language of SB 1460, which passed both chambers in 2010, was placed into AB 1413 to restore funding that was taken out by the Assembly Appropriations Committee. We therefore consider these two bills as a single decision, and their vetoes as a single veto. Letters requested or opposing vetoes support this choice.

and several other groups. The agency seeks validation of its authorizing the issuance of USD 8 billion
in bond. The Court denies the request and finds no evidence to support the plaintiff’s determination
that the issuance of bonds was necessary and desirable.
(4) Renewables Portfolio Standard (RPS): In 2002, the California Legislature adopts SB 1078,
which introduces the RPS scheme by requiring investor-‐owned utilities (IOUs) and private energy
service providers (ESPs) to increase their annual purchase of electricity from renewable resources by
at least 1% per year, so that 20% of their sales would come from renewables by 2017. In 2004 SB
1478 accelerates the 20% requirement to 2010, however Gov. Schwarzenegger vetoes the bill. The
same bill is reintroduced in 2006 with the passage of SB 107 and the 20% requirement by the end of
2010 makes the books. In 2007 the Legislature passes S.B. 1036 “recasts the renewables Portfolio
Standards” by implementing organizational changes.
In 2008 the voters defeat Proposition 7, which would have increased the target of
renewables to 40% in 2020 and 50% in 2025. Shortly following the vote, Gov. Schwarzenegger issues
an Executive Order7 expanding the RPS to 33% by 2020. In 2009 AB 64 and SB 14 are adopted by the
Legislature. Together these bills require that 33% of the IOUs and ESPs retail sales come from
renewable sources by 2002. However Gov. Schwarzenegger vetoes them both, arguing that they
impose too strict limits on in-‐California renewable energy production versus out-‐California imports.
Instead, the Governor issues another Executive Order5 directing the California Air Resources Board to
adopt regulations increasing RPS to 33% by 2020. Finally in 2011, the Legislature passes SBX1-‐2
which maintains the 33% by 2020 requirement but no longer requires that renewable energy come
from generation in California. On the other hand, it mandates RPS compliance on publically owned
utilities (POUs) for the first time.
This latest legislation (SBX 1-‐2) mandates the California Public Utilities Commission (CPUC) to
oversee IOUs and the California Energy Commission (CEC) oversees POUs. The CEC posts proposed
RPS regulations in the Notice Register in March 2013. The CPUC, which conducts unique, semi-‐
judicial, semi-‐legislative rule-‐making proceedings, conducts five rule-‐making proceedings to
implement and administer the RPS, to which dozens of groups participate.
7 Both Executive Orders are excluded from our analysis due to a lack of access to data.
4. Descriptive statistics
To address our first hypothesis about the level of IGs mobilizations and policy bandwagons dynamics
in the legislative, governmental/administrative, judicial and direct democracy venues, Table 1
recapitulates, for each case study, the number of binding decisions per venue, the absolute and
relative number of IGs mobilized to influence these decisions and, finally, the distribution of IGs
mobilization over venues.

Table 1: Institutional venues, binding decisions and IGs mobilization for each case study
Cases study
Legislature (bill enrolled)
Government and Administration (veto and rule-‐making)
Judiciary (court decision)
Direct democracy (popular vote on initiative)
Total for all venues of the policy-‐making process
Stem cell (STEM)
# binding decisions per venue 3 5 2 1 11
# IGs mobilized per venue 41 51 35 48 154
# IGs mobilized / # decisions 13.6 10.2 17.5 48 14
#I Gs mobilized in the venue / all IGs mobilized in case (in %)
26.6%
33.5%
22.7%
31%
100%
Immi-‐gration (IMMIG)
# binding decisions per venue 9 4* 5 0 18
# IGs mobilized per venue 162 85 119 n/a 298
# IGs mobilized / # decisions 18 21.3 23.8 n/a 16.6
#I Gs mobilized in the venue / all IGs mobilized in case (in %)
54.3%
28.5%
39.9%
n/a
100%
Renew-‐ables Port-‐folio
(RPS)
# binding decisions per venue 6 7** 0 1 14
# IGs mobilized per venue 252 227 n/a 7 400
# IGs mobilized / # decisions 42 32.4 n/a 7 28.6
#I Gs mobilized in the venue / all IGs mobilized in case (in %)
63%
56.8%
n/a
0.02%
100%
HSR # binding decisions per venue 5 0 4 1 10
# IGs mobilized per venue 106 n/a 42 71 203
# IGs mobilized / # decisions 21.2 n/a 10.5 71 20.3
#I Gs mobilized in the venue / all IGs mobilized in case (in %)
52.2.% n/a 20.7% 45% 100%
Note: the sum of the IGs mobilized in all venues does not correspond to the # of IGs mobilized for the whole case study (see last column) as one IGs may mobilize in more than one venue.
*There are 5 vetoes but one of them is excluded due to lack of access to data
**There are 9 administrative decisions, but 2 of them are excluded due to lack of access to data.
The data collected for the four policy issues under investigation lead to the following
observations. First, only the HSR case tends to support, at least partially, our first hypothesis: the
number of IGs mobilized per decision is 71 for the direct democracy venue, 21.2 for the legislative
venue and 10.5 for the judiciary venue. This decreasing ranking perfectly matches with our
expectation. However, the ranking across venues looks quite different as soon one focus on the
percentage of IGs mobilized in one venue in comparison to all IGs engaging in advocacy activities
over the entire policy process (i.e. 45% in direct democracy versus 52.2% in the legislative arena).
Second, most of the cases invalidate the ideas that policy bandwagons should be more frequent in
voting campaign than in other institutional venues. The opposite is true for the RPS case. Third, the
judiciary cannot always be qualified as interest niche. The contrary is observed in the IMMIG case:
the judicial venue displays the highest number of IGs mobilized per decision (23.8) within this policy
process. Fourth, and this is apparently also running against our hypothesis, the intensity of advocacy
activities is not identical in both the legislative and the governmental/administrative venues. Figures
from the STEM and IMMIG cases demonstrate it. All in all, no systematic pattern emerges from Table
1. The mobilization levels of IGs are apparently contingent upon each policy issue at stake or are
inherent to the chronology of the policy process for each case.
To follow this path, the succession of binding decisions (made within the same venue, or in
different venues) has to be scrutinized. For each case, Table 2 presents thus the mobilization of IGs
according the chronological order of the decisions punctuating the policy process. This diachronic
perspective allows testing the second hypothesis formulated in the theoretical framework.
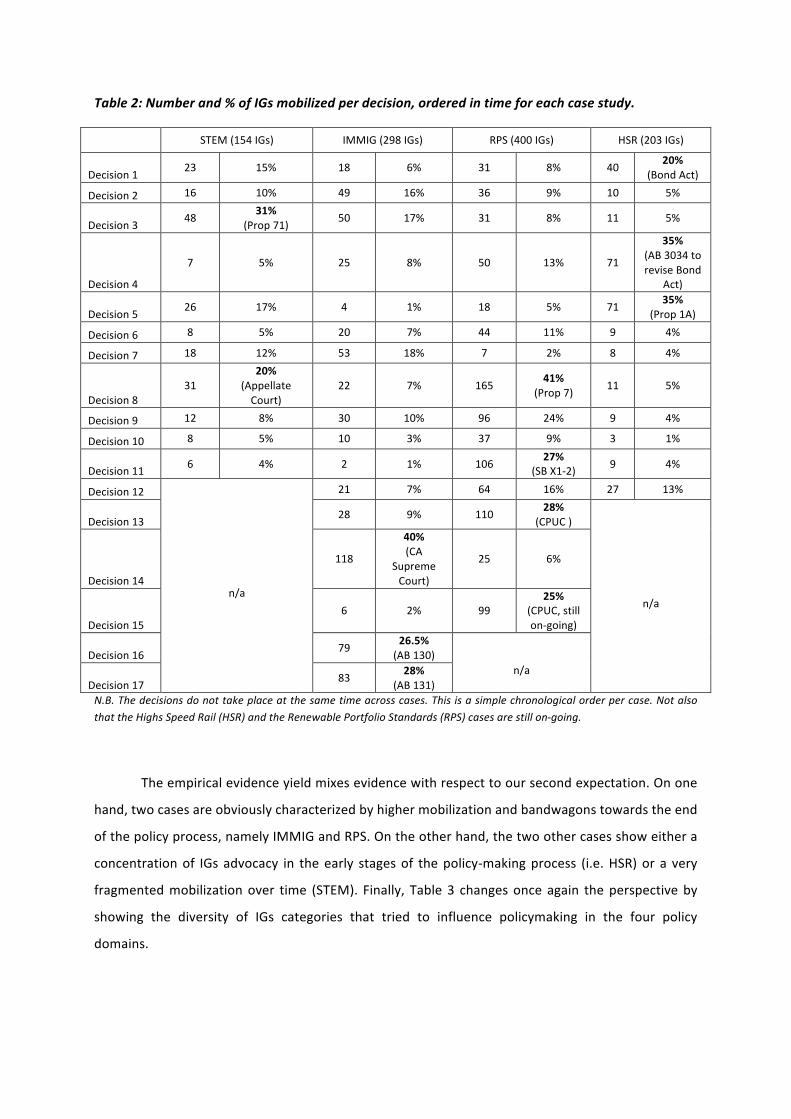
Table 2: Number and % of IGs mobilized per decision, ordered in time for each case study.
STEM (154 IGs) IMMIG (298 IGs) RPS (400 IGs) HSR (203 IGs)
Decision 1 23 15% 18 6% 31 8% 40 20% (Bond Act)
Decision 2 16 10% 49 16% 36 9% 10 5%
Decision 3 48 31% (Prop 71) 50 17% 31 8% 11 5%
Decision 4
7 5% 25 8% 50 13% 71
35% (AB 3034 to revise Bond
Act)
Decision 5 26 17% 4 1% 18 5% 71 35% (Prop 1A)
Decision 6 8 5% 20 7% 44 11% 9 4%
Decision 7 18 12% 53 18% 7 2% 8 4%
Decision 8 31
20% (Appellate Court)
22 7% 165 41% (Prop 7) 11 5%
Decision 9 12 8% 30 10% 96 24% 9 4%
Decision 10 8 5% 10 3% 37 9% 3 1%
Decision 11 6 4% 2 1% 106 27% (SB X1-‐2) 9 4%
Decision 12
n/a
21 7% 64 16% 27 13%
Decision 13 28 9% 110 28% (CPUC )
n/a
Decision 14
118
40% (CA
Supreme Court)
25 6%
Decision 15 6 2% 99
25% (CPUC, still on-‐going)
Decision 16 79 26.5% (AB 130)
n/a Decision 17 83 28%
(AB 131) N.B. The decisions do not take place at the same time across cases. This is a simple chronological order per case. Not also that the Highs Speed Rail (HSR) and the Renewable Portfolio Standards (RPS) cases are still on-‐going.
The empirical evidence yield mixes evidence with respect to our second expectation. On one
hand, two cases are obviously characterized by higher mobilization and bandwagons towards the end
of the policy process, namely IMMIG and RPS. On the other hand, the two other cases show either a
concentration of IGs advocacy in the early stages of the policy-‐making process (i.e. HSR) or a very
fragmented mobilization over time (STEM). Finally, Table 3 changes once again the perspective by
showing the diversity of IGs categories that tried to influence policymaking in the four policy
domains.
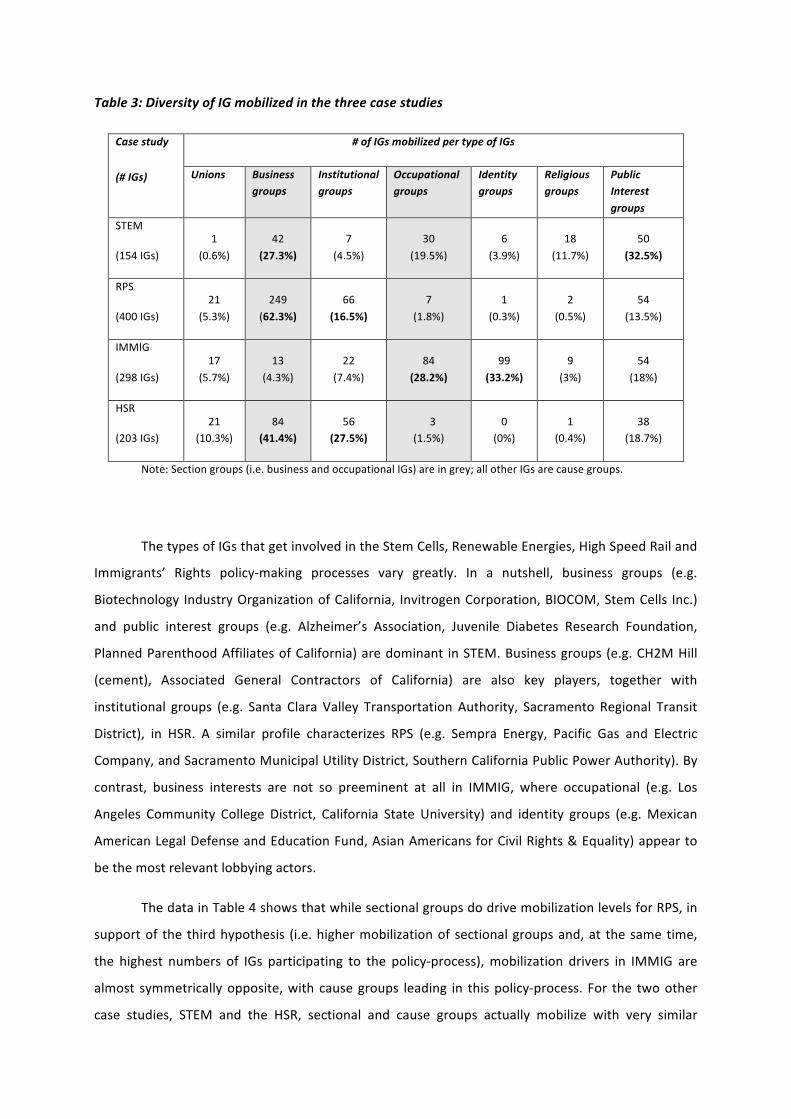
Table 3: Diversity of IG mobilized in the three case studies
Case study
(# IGs)
# of IGs mobilized per type of IGs
Unions Business groups
Institutional groups
Occupational groups
Identity groups
Religious groups
Public Interest groups
STEM
(154 IGs) 1
(0.6%) 42
(27.3%) 7
(4.5%) 30
(19.5%) 6
(3.9%) 18
(11.7%) 50
(32.5%)
RPS
(400 IGs) 21
(5.3%) 249
(62.3%) 66
(16.5%) 7
(1.8%) 1
(0.3%) 2
(0.5%) 54
(13.5%)
IMMIG
(298 IGs) 17
(5.7%) 13
(4.3%) 22
(7.4%) 84
(28.2%) 99
(33.2%) 9
(3%) 54
(18%)
HSR
(203 IGs) 21
(10.3%) 84
(41.4%) 56
(27.5%) 3
(1.5%) 0
(0%) 1
(0.4%) 38
(18.7%)
Note: Section groups (i.e. business and occupational IGs) are in grey; all other IGs are cause groups.
The types of IGs that get involved in the Stem Cells, Renewable Energies, High Speed Rail and
Immigrants’ Rights policy-‐making processes vary greatly. In a nutshell, business groups (e.g.
Biotechnology Industry Organization of California, Invitrogen Corporation, BIOCOM, Stem Cells Inc.)
and public interest groups (e.g. Alzheimer’s Association, Juvenile Diabetes Research Foundation,
Planned Parenthood Affiliates of California) are dominant in STEM. Business groups (e.g. CH2M Hill
(cement), Associated General Contractors of California) are also key players, together with
institutional groups (e.g. Santa Clara Valley Transportation Authority, Sacramento Regional Transit
District), in HSR. A similar profile characterizes RPS (e.g. Sempra Energy, Pacific Gas and Electric
Company, and Sacramento Municipal Utility District, Southern California Public Power Authority). By
contrast, business interests are not so preeminent at all in IMMIG, where occupational (e.g. Los
Angeles Community College District, California State University) and identity groups (e.g. Mexican
American Legal Defense and Education Fund, Asian Americans for Civil Rights & Equality) appear to
be the most relevant lobbying actors.
The data in Table 4 shows that while sectional groups do drive mobilization levels for RPS, in
support of the third hypothesis (i.e. higher mobilization of sectional groups and, at the same time,
the highest numbers of IGs participating to the policy-‐process), mobilization drivers in IMMIG are
almost symmetrically opposite, with cause groups leading in this policy-‐process. For the two other
case studies, STEM and the HSR, sectional and cause groups actually mobilize with very similar
intensity (See Appendix 5 & 8.) We thus cannot conclude that business and occupational groups drive
the bandwagon dynamics. Instead, our results only illustrate the importance of contextualizing any
analysis of mobilization levels.
If we take a closer look at the IG mobilization at the decision level (see Appendix 5 to 8),
cause groups drive the mobilization levels for 6 out of 11 decisions in STEM and in almost all the
decisions in IMMIG, RPS and HSR. Furthermore, after placing the decisions on a continuum from low
mobilization to high mobilization and examining sectional and cause groups relative to the total
number of groups on each decision, we see that cause groups drive high mobilization decisions for
IMMIG and the HSR, with the notable exception of the highest mobilized decision in the HSR,
Proposition 1A, where sectional groups dominate as suggested in our hypothesis rationale. On the
other hand, and as identified above, sectional groups lead in high mobilization decisions for RPS. No
clear pattern emerges in STEM, even in the highest mobilized direct democracy decision, where
sectional and cause groups are quasi-‐identically represented with 44% and 56% respectively (see
Appendix 5).

Table 4: Sectional versus Cause groups mobilized in RPS and IMMIG, as a % of total number of
groups on each decision.
RPS IMMIG
Venue Total # of IGs per decision:
Sectional IGs Cause IGs Venue Total # of IGs per decision
Sectional IGs Cause IGs
D 7 71% 29% J 2 100% 0% L 18 72% 28% J 4 100% 0% A 25 48% 52% J 6 50% 50% L 31 45% 55% J 10 50% 50% A 31 32% 68% L 18 22% 78% L 36 42% 58% L 20 30% 70% A 38 68% 32% L 21 48% 52% A 45 62% 38% L 22 41% 59% L 50 44% 56% A 25 68% 32% A 65 68% 32% J 28 50% 50% A 96 58% 42% A 30 43% 57% A 100 70% 30% L 49 37% 63% L 106 63% 37% L 50 40% 60% A 111 72% 28% A 53 42% 58% L 165 53% 47% L 79 38% 62%
Total # of IGs across case: 400
L 83 37% 63%
J 118 25% 75%
Total # of IGs across case: 298
5. Markov transition models
As the purpose of this paper is to explain why interest groups become active in a particular
venue and contribute to policy bandwagons, a dichotomous choice model is most appropriate to
evaluate the hypotheses. For each of the four policy processes we look at various venues followed
more or less in sequence, thus it is likely that having been active in one venue will make mobilization
in the next venue more probable. Consequently, past activation should positively influence activation
in the next venue. Such a hypothesis can easily be evaluated by considering a lagged dependent
variable in a logit or probit setup. However, when adding additional explanatory variables, the
question arises of whether a particular independent variable, for instance the number of venues
already “visited” by the policy-‐making process, will affect the probability of activation equally,
independent of whether an interest group has been active or not (for a detailed discussion of binary
time-‐series cross-‐section data and their analysis, see Beck, Katz & Tucker 1998). This equal effect is
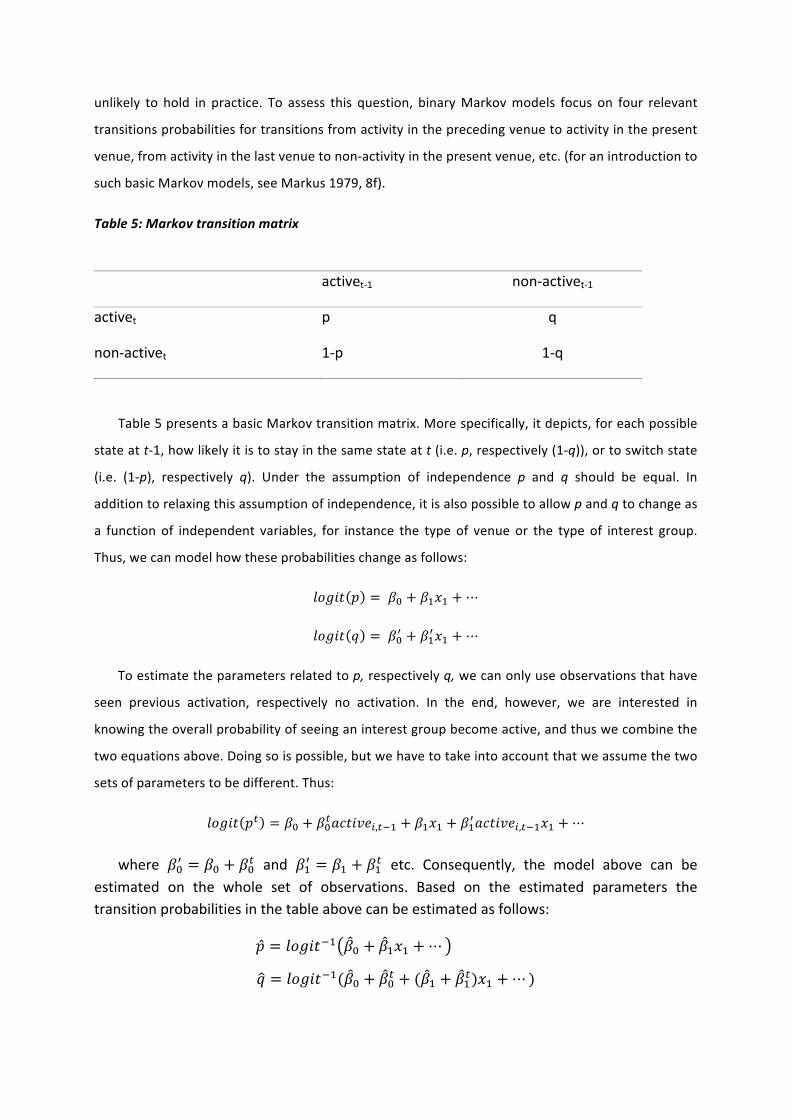
unlikely to hold in practice. To assess this question, binary Markov models focus on four relevant
transitions probabilities for transitions from activity in the preceding venue to activity in the present
venue, from activity in the last venue to non-‐activity in the present venue, etc. (for an introduction to
such basic Markov models, see Markus 1979, 8f).
Table 5: Markov transition matrix
activet-‐1 non-‐activet-‐1
activet p q
non-‐activet 1-‐p 1-‐q
Table 5 presents a basic Markov transition matrix. More specifically, it depicts, for each possible
state at t-‐1, how likely it is to stay in the same state at t (i.e. p, respectively (1-‐q)), or to switch state
(i.e. (1-‐p), respectively q). Under the assumption of independence p and q should be equal. In
addition to relaxing this assumption of independence, it is also possible to allow p and q to change as
a function of independent variables, for instance the type of venue or the type of interest group.
Thus, we can model how these probabilities change as follows:
𝑙𝑜𝑔𝑖𝑡 𝑝 = 𝛽! + 𝛽!𝑥! +⋯
𝑙𝑜𝑔𝑖𝑡 𝑞 = 𝛽!! + 𝛽!!𝑥! +⋯
To estimate the parameters related to p, respectively q, we can only use observations that have
seen previous activation, respectively no activation. In the end, however, we are interested in
knowing the overall probability of seeing an interest group become active, and thus we combine the
two equations above. Doing so is possible, but we have to take into account that we assume the two
sets of parameters to be different. Thus:
𝑙𝑜𝑔𝑖𝑡 𝑝! = 𝛽! + 𝛽!!𝑎𝑐𝑡𝑖𝑣𝑒!,!!! + 𝛽!𝑥! + 𝛽!!𝑎𝑐𝑡𝑖𝑣𝑒!,!!!𝑥! +⋯
where 𝛽!! = 𝛽! + 𝛽!! and 𝛽!! = 𝛽! + 𝛽!! etc. Consequently, the model above can be estimated on the whole set of observations. Based on the estimated parameters the transition probabilities in the table above can be estimated as follows:
𝑝 = 𝑙𝑜𝑔𝑖𝑡!! 𝛽! + 𝛽!𝑥! +⋯
𝑞 = 𝑙𝑜𝑔𝑖𝑡!!(𝛽! + 𝛽!! + (𝛽! + 𝛽!!)𝑥! +⋯ )
Such a model allows for testing the hypotheses stated above (for studies using such models in
varying empirical settings, see Przeworski & Vreeland 2000, Beck, Epstein, Jackman & O’Halloran
2001, Epstein, Bates, Goldstone, Kristensen & O’Halloran 2006, Powell & Mitchell 2007, Mitchell &
Powell 2011, Hug & Wegmann 2012, Wegmann 2012). Thus, in Table 6 we report the estimation
results of a series of Markov models with increasing complexity allowing us to test our hypotheses.8
Model 1 in Table 6 serves as a sort of baseline model, as it assumes that the probability of
mobilization is simply dependent on whether an IG was active in the preceding venue. The estimated
coefficients clearly suggest that having been active in the preceding venue increases the probability
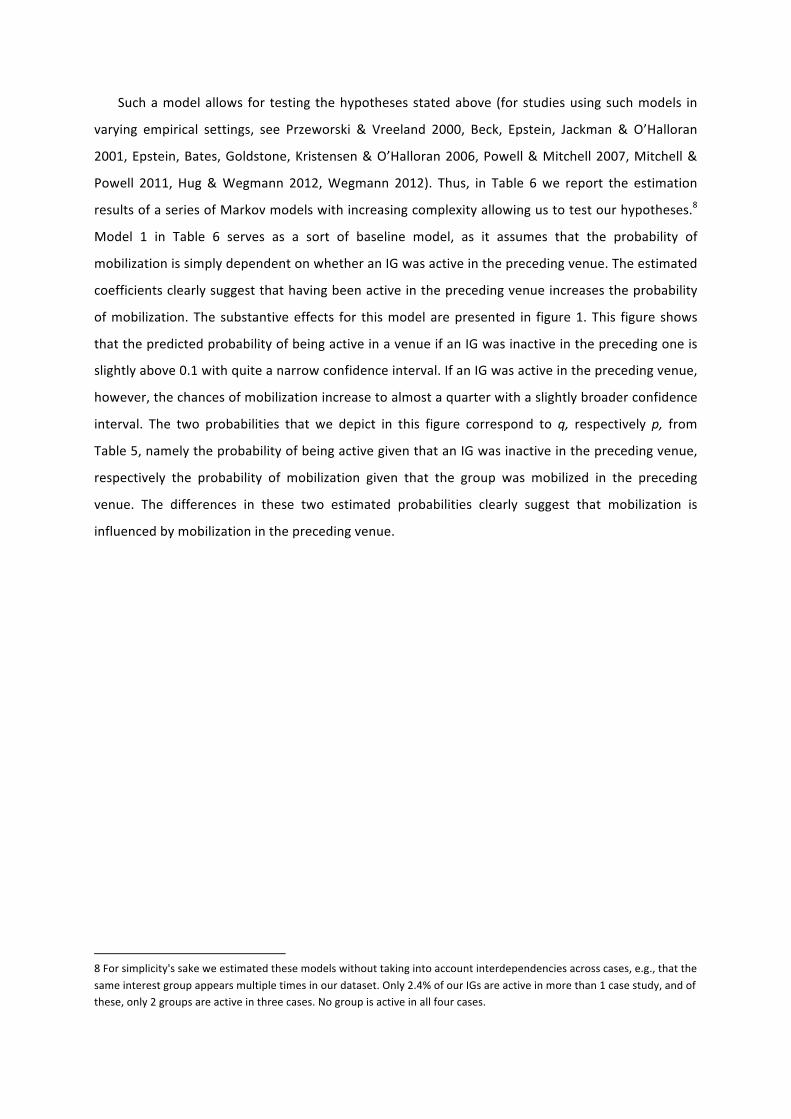
of mobilization. The substantive effects for this model are presented in figure 1. This figure shows
that the predicted probability of being active in a venue if an IG was inactive in the preceding one is
slightly above 0.1 with quite a narrow confidence interval. If an IG was active in the preceding venue,
however, the chances of mobilization increase to almost a quarter with a slightly broader confidence
interval. The two probabilities that we depict in this figure correspond to q, respectively p, from
Table 5, namely the probability of being active given that an IG was inactive in the preceding venue,
respectively the probability of mobilization given that the group was mobilized in the preceding
venue. The differences in these two estimated probabilities clearly suggest that mobilization is
influenced by mobilization in the preceding venue.
8 For simplicity's sake we estimated these models without taking into account interdependencies across cases, e.g., that the same interest group appears multiple times in our dataset. Only 2.4% of our IGs are active in more than 1 case study, and of these, only 2 groups are active in three cases. No group is active in all four cases.

Table 6: Results of Markov models
Model 1 Model 2 Model 3 Model 4 Model 5 Model 6 intercept -‐2.04 * -‐1.99 * -‐2.34 * -‐2.33 * -‐2.33 * -‐2.30 * (0.03) (0.05) (0.11) (0.11) (0.12) (0.14) active in preceding venue 0.97 * 1.00 * 1.66 * 1.65 * 1.63 * 1.57 * (0.06) (0.09) (0.24) (0.24) (0.25) (0.25) direct democracy venue 0.48 * 0.51 * 0.54 * 0.55 * 0.52 * (0.11) (0.11) (0.11) (0.11) (0.12) judiciary venue -‐0.39 * -‐0.42 * -‐0.34 * -‐0.35 * -‐0.26 * (0.08) (0.09) (0.09) (0.09) (0.10) legislative venue -‐0.02 0.02 0.05 0.04 0.09 (0.07) (0.07) (0.07) (0.07) (0.07) active in preceding venue × direct democracy
-‐1.47 * -‐1.39 * -‐1.44 * -‐1.42 * -‐1.35 *
(0.33) (0.33) (0.33) (0.34) (0.34) active in preceding venue × judiciary
-‐1.45 * -‐1.54 * -‐1.46 * -‐1.50 * -‐1.45 *
(0.25) (0.25) (0.28) (0.28) (0.28) active in preceding venue × legislative
0.50 * 0.37 * 0.34 * 0.32 * 0.38 *
(0.13) (0.14) (0.14) (0.14) (0.14) venue counter 0.07 * 0.06 * 0.06 * 0.05 (0.03) (0.03) (0.03) (0.03) venue counter2 -‐0.00 -‐0.00 -‐0.00 -‐0.00 (0.00) (0.00) (0.00) (0.00) venue counter × active in preceding venue
-‐0.23 * -‐0.21 * -‐0.22 * -‐0.22 * (0.06) (0.06) (0.06) (0.06)
venue counter × active in preceding venue
0.01 * 0.01 * 0.01 * 0.01 * (0.00) (0.00) (0.00) (0.00)
preceding venue: direct democracy 0.33 * 0.33 * 0.28 (0.15) (0.15) (0.15) active in preceding venue: direct democracy
-‐0.96 -‐0.96 -‐0.90 (1.09) (1.09) (1.09)
preceding venue: direct democracy × judiciary
-‐0.90 * -‐0.90 * -‐0.95 * (0.35) (0.35) (0.36)
active in preceding venue: direct democracy × judiciary
0.75 0.80 0.78 (1.31) (1.31) (1.31)
business group -‐0.02 -‐0.11 (0.06) (0.07) occupational group 0.04 0.12 (0.09) (0.09) active in preceding venue: business group
0.05 0.07 (0.14) (0.14)
active in preceding venue: occupational group
0.20 0.22 (0.19) (0.19)
policy: immigration -‐0.21 * (0.10) policy: renewables 0.09 (0.09) policy: stem cells 0.01 (0.11) N 14195 14195 14195 14195 14195 14195 AIC 10947.62 10736.12 10706.97 10704.63 10710.17 10701.53 BIC 11008.10 10978.06 11069.88 11188.51 11315.03 11397.11 logL -‐5465.81 -‐5336.06 -‐5305.48 -‐5288.31 -‐5275.09 -‐5258.77 Standard errors in parentheses * indicates significance at p<0.05
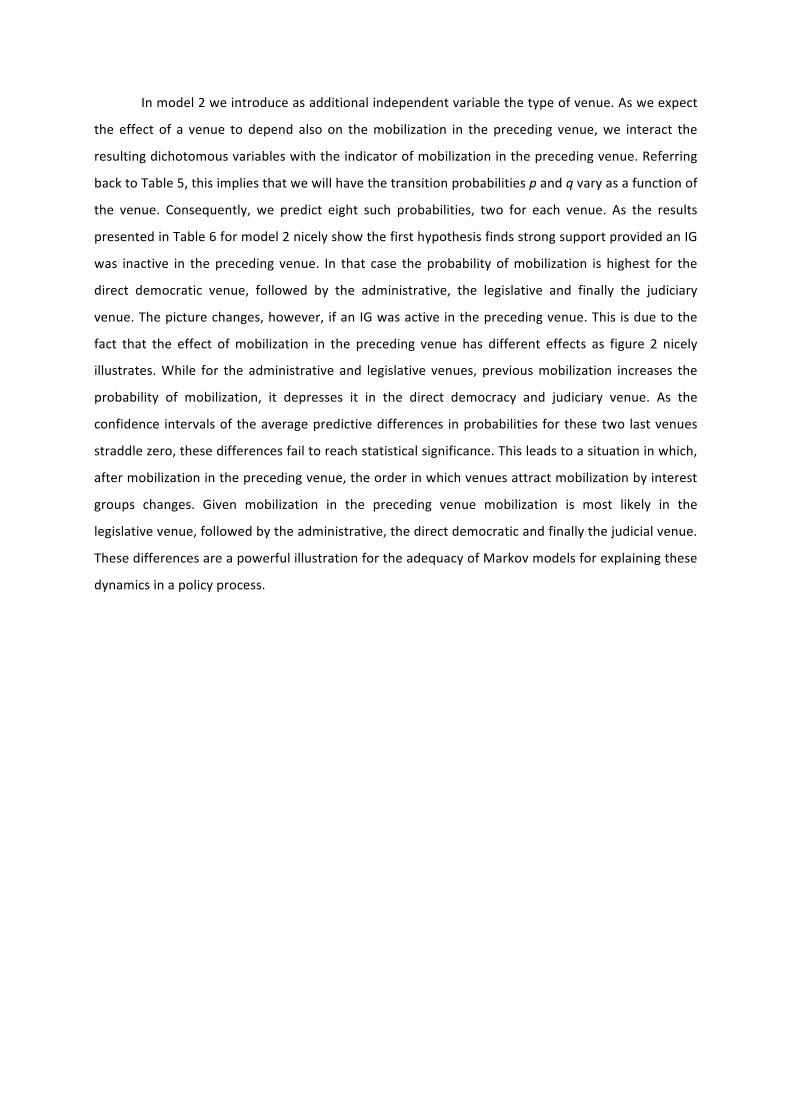
In model 2 we introduce as additional independent variable the type of venue. As we expect
the effect of a venue to depend also on the mobilization in the preceding venue, we interact the
resulting dichotomous variables with the indicator of mobilization in the preceding venue. Referring
back to Table 5, this implies that we will have the transition probabilities p and q vary as a function of
the venue. Consequently, we predict eight such probabilities, two for each venue. As the results
presented in Table 6 for model 2 nicely show the first hypothesis finds strong support provided an IG
was inactive in the preceding venue. In that case the probability of mobilization is highest for the
direct democratic venue, followed by the administrative, the legislative and finally the judiciary
venue. The picture changes, however, if an IG was active in the preceding venue. This is due to the
fact that the effect of mobilization in the preceding venue has different effects as figure 2 nicely
illustrates. While for the administrative and legislative venues, previous mobilization increases the
probability of mobilization, it depresses it in the direct democracy and judiciary venue. As the
confidence intervals of the average predictive differences in probabilities for these two last venues
straddle zero, these differences fail to reach statistical significance. This leads to a situation in which,
after mobilization in the preceding venue, the order in which venues attract mobilization by interest
groups changes. Given mobilization in the preceding venue mobilization is most likely in the
legislative venue, followed by the administrative, the direct democratic and finally the judicial venue.
These differences are a powerful illustration for the adequacy of Markov models for explaining these
dynamics in a policy process.
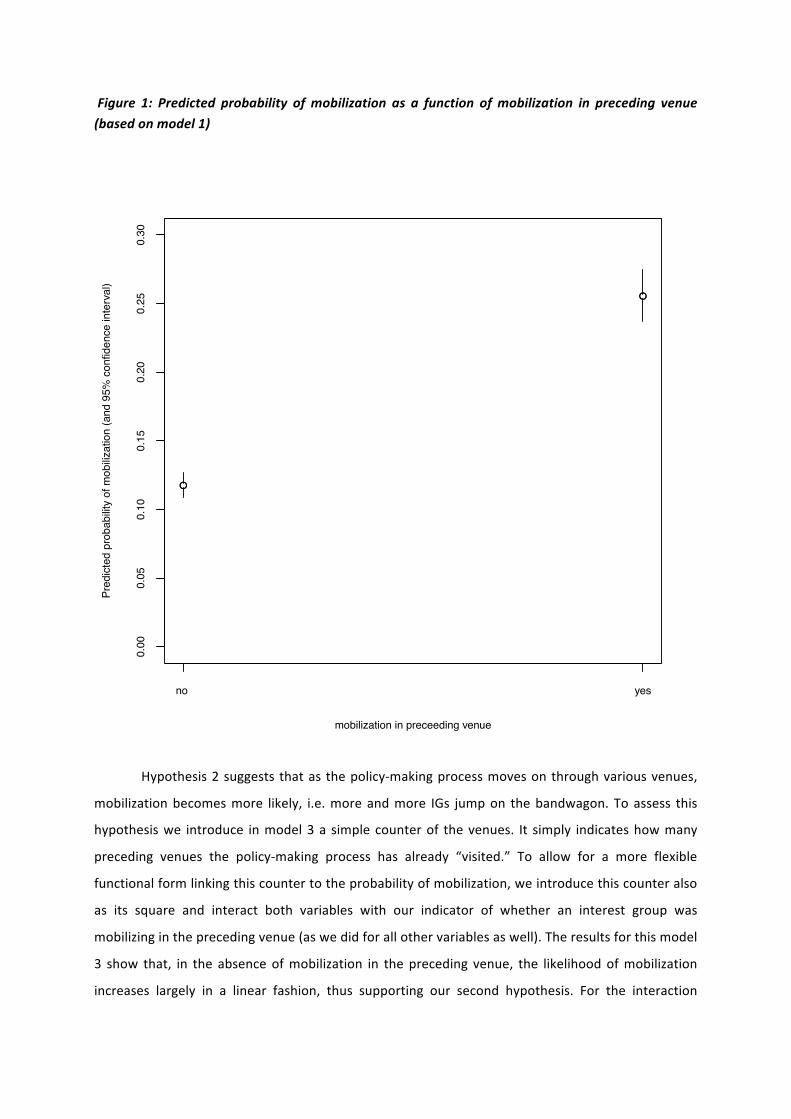
Figure 1: Predicted probability of mobilization as a function of mobilization in preceding venue (based on model 1)
Hypothesis 2 suggests that as the policy-‐making process moves on through various venues,
mobilization becomes more likely, i.e. more and more IGs jump on the bandwagon. To assess this
hypothesis we introduce in model 3 a simple counter of the venues. It simply indicates how many
preceding venues the policy-‐making process has already “visited.” To allow for a more flexible
functional form linking this counter to the probability of mobilization, we introduce this counter also
as its square and interact both variables with our indicator of whether an interest group was
mobilizing in the preceding venue (as we did for all other variables as well). The results for this model
3 show that, in the absence of mobilization in the preceding venue, the likelihood of mobilization
increases largely in a linear fashion, thus supporting our second hypothesis. For the interaction
●
●
0.00
0.05
0.10
0.15
0.20
0.25
0.30
mobilization in preceeding venue
Pred
icte
d pr
obab
ility
of m
obiliz
atio
n (a
nd 9
5% c
onfid
ence
inte
rval
)
●
●
no yes
terms, however, we find one negative and one positive coefficient. Thus, if mobilization has occurred
in the preceding venue, the effect of the venue counter appears to be curvilinear. We depict these
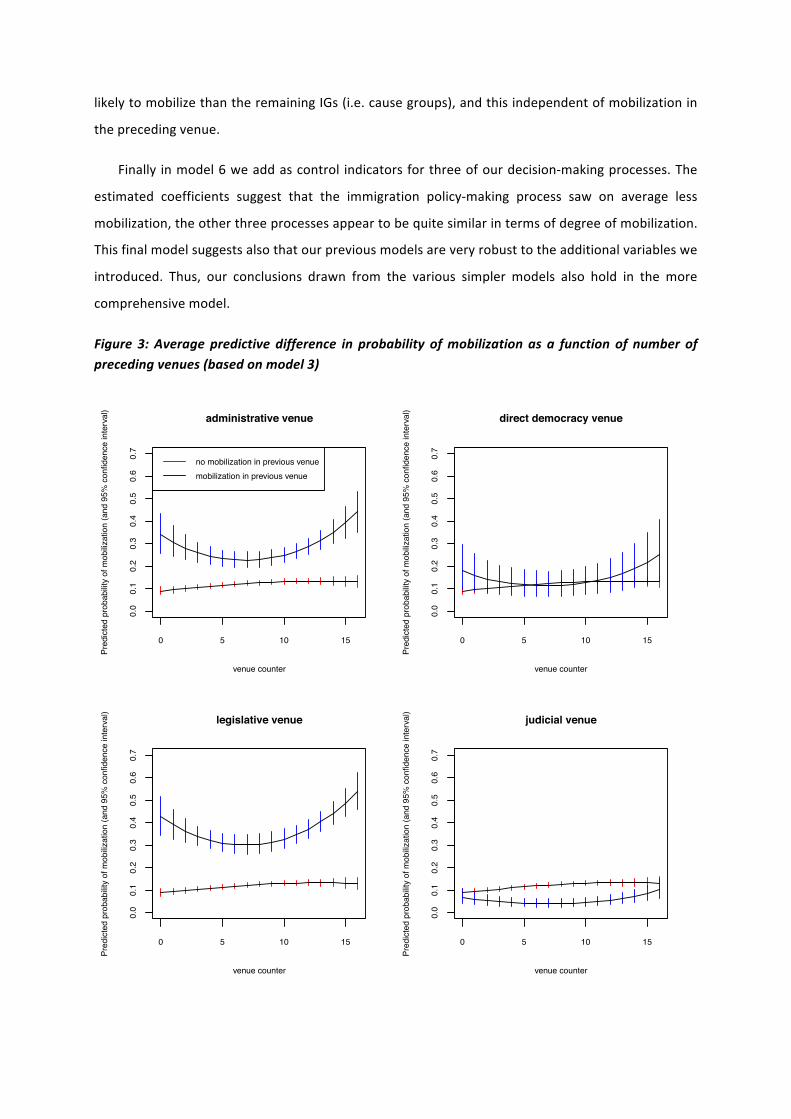
relationships in figure 3. Again we find quite considerable differences, also as a function of the
venue, highlighting again the usefulness of the Markov models. The four panels show that
independent of venue type, and in the absence of mobilization in the preceding venue, as the
process moves through the venues the likelihood of mobilization increases, but the changes are
marginal and from the first to the last venue (we used for all decision making process sixteen as a
maximum) not statistically different from each other. If we consider, however, how the venue
counter affects mobilization for those groups active in the preceding venue we find a marked
curvilinear relationship. More specifically, at the beginning of the process increasing the number of
venues decreases mobilization, but then mobilization picks up after half a dozen venues. These
curvilinear effects are strongest in the direct democracy venue and legislative one. In the former,
however, this curvilinear relationship is estimated with considerable uncertainty, making it largely
undistinguishable from the linear trend we found for interest groups without mobilization in the
preceding venue. This is not at all the case for the legislative venue where the two curves are clearly
distinct. Finally for the administrative and judicial venue mobilization in the preceding venue appears
in the middle of the process even to depress mobilization.

Figure 2: Average predictive difference in probability of mobilization due to mobilization in preceding venue (based on model 2)
In model 4 we introduce in addition information on whether the preceding venue was direct
democracy, and interact this variable with the judicial venue type and also preceding mobilization.
This allows us to assess hypothesis 2bis. The estimated coefficients suggest that following up on a
direct democracy venue actually increases the likelihood of mobilization, provided the current venue
is not the judicial one. If the venue is the judiciary, however, mobilization is less likely. This holds
independent of whether an IG was active in the preceding direct democratic venue or not. Thus,
hypothesis 2bis does not find support in our analyses.
Next in model 5 we add an indicator for business and occupational groups (indicators which are
again interacted with the indicator of mobilization in the preceding venue). Contrary to our third
hypothesis we find no evidence that these two types of IGs (i.e. sectional groups) are more or less
●
●
●
●
−0.1
0.0
0.1
0.2
0.3
venue
chan
ge in
pre
dict
ed p
roba
bilit
y du
e to
mob
ilizat
ion
in p
rece
edin
g ve
nue
●
●
●
●
administrative direct democracy judiciary legislative
likely to mobilize than the remaining IGs (i.e. cause groups), and this independent of mobilization in
the preceding venue.
Finally in model 6 we add as control indicators for three of our decision-‐making processes. The
estimated coefficients suggest that the immigration policy-‐making process saw on average less
mobilization, the other three processes appear to be quite similar in terms of degree of mobilization.
This final model suggests also that our previous models are very robust to the additional variables we
introduced. Thus, our conclusions drawn from the various simpler models also hold in the more
comprehensive model.
Figure 3: Average predictive difference in probability of mobilization as a function of number of preceding venues (based on model 3)
0 5 10 15
0.0
0.1
0.2
0.3
0.4
0.5
0.6
0.7
administrative venue
venue counter
Pred
icte
d pr
obab
ility
of m
obiliz
atio
n (a
nd 9
5% c
onfid
ence
inte
rval
)
no mobilization in previous venuemobilization in previous venue
0 5 10 15
0.0
0.1
0.2
0.3
0.4
0.5
0.6
0.7
direct democracy venue
venue counter
Pred
icte
d pr
obab
ility
of m
obiliz
atio
n (a
nd 9
5% c
onfid
ence
inte
rval
)
0 5 10 15
0.0
0.1
0.2
0.3
0.4
0.5
0.6
0.7
legislative venue
venue counter
Pred
icte
d pr
obab
ility
of m
obiliz
atio
n (a
nd 9
5% c
onfid
ence
inte
rval
)
0 5 10 15
0.0
0.1
0.2
0.3
0.4
0.5
0.6
0.7
judicial venue
venue counter
Pred
icte
d pr
obab
ility
of m
obiliz
atio
n (a
nd 9
5% c
onfid
ence
inte
rval
)
6. Conclusion
The aim of this paper was to identify potential explanations of differentiated mobilization of
interest groups and the dynamics of so-‐called policy bandwagons. The analyses of the mobilization of
IGs in four policy-‐making processes in California have shown that policy bandwagons are more
complex phenomena than commonly assumed. Using as rather basic empirical strategy the Markov
transition models, this paper shows that mobilization in a particular venue is dependent on
mobilization in preceding venues. We were also able to show that the various types of venues differ
in terms of mobilization and continued mobilization. While the direct democracy venue is much more
likely to bring IGs on the bandwagon, this venue is not quite as hospitable for continuing
mobilization.
We also could demonstrate that jumping on the bandwagon (or remaining there) depends on
the advancement through the policy-‐making process. While in all four policy processes considered
we could identify slow increases in the probability of mobilization over time, we also found that the
likelihood of staying on the bandwagon is smaller in the middle of a process, while being higher both
at the beginning and towards the end of the process. In addition, these differences are especially
marked in the administrative and legislative venues, but much more muted in the two remaining
venues.
Empirical support for our other hypotheses is much more limited. Despite Gerber et al.'s
(2001) claim we find no strong continuing mobilization in the judicial venue if the latter follows a
direct democracy one. Similarly, once we consider a whole host of explanatory variables, we do no
longer find any significant differences between business and occupational groups (i.e. sectional IGs)
on the one hand, and the remaining types of groups (i.e. cause IGs) on the other in terms of their
mobilization effort.
Clearly these analyses leave considerable room for improvement. First of all, we assessed
only the simplest hypotheses and did not explore in detail the more intricate interdependencies
linked to the hierarchical nature of our dataset. Second, we have not taken into account two
important elements of relevance for policy bandwagons, namely the success in the preceding venue
and the intensity of the mobilization. Taking the former element into account would render the
analyses more complex but also more insightful. The second element would require a more
complicated empirical strategy. More specifically, and going in the direction of Jones and
Baumgartner's (2005:142) suggestion, one might consider interest groups as transitioning in and out
of mobilization, and during their mobilization the degree of their involvement (e.g., monetary
contributions, etc.) could be modeled in a time series framework (for such models, see Cai, 1994 and

Park, 2009). Proceeding like this would allow for much more detailed insights into the (bandwagon)
dynamics of policy-‐making processes.
Bibliography
Baumgartner, F. & B. Leech (1998). Basic Interests: The Importance of Groups in Politics and in
Political Science. Princeton, NJ: Princeton University Press.
Baumgartner, Frank and Beth Leech (2001). Interest Niches and Policy Bandwagons: Patterns of
Interest groups Involvement in National Politics, The Journal of Politics 63 (4):1191-‐1213.
Baumgartner, Frank et al. (2009). Lobbying and Policy Change. Who wins, Who Loses and Why.
Chicago: Chicago University Press.
Beck, Nathaniel, David Epstein, Simon Jackman & Sharyn O’Halloran (2001) Alternative Models of
Dynamics in Binary Time-‐Series-‐Cross-‐Section Models: The Example of State Failure. Paper Prepared
for delivery at the 2001 Annual Meeting of the Society for Political Methodology, Emory University
Atlanta.
Beck, Nathaniel, Jonathan Katz & Richard Tucker. 1998. “Taking Time Seriously: Time-‐Series-‐Cross-‐
Section Analysis with a Binary Dependent Variable.” American Journal of Political Science 42(4):1260–
1288.
Berkhout, Joostr (2013). Why interest organizations do what they do: Assessing the explanatory
potential of “exchange” approaches. Interest groups and Advocacy 2(2):227-‐250.
Binderkrantz, Anne S. (2005). Interest groups strategies: navigating between privileged access and
strategies of pressure, Political studies 53:694-‐715.
Binderkrantz, Anne S. et al. (2012). Assessing political arenas. Interest group access to the
administration, parliament and media (unpublished manuscript?).
Beyers, J. (2008). Policy issues, organisational format and the political strategies of interest
organisations. West European Politics 31 (6): 1188-‐1211.
Boehmke, Frederick & Sean Gailmard, John Wiggs Patty (2013). Business as usual: Interest groups
access and representation across policy-‐making venues. Journal of Public Policy, 2013 33(1): 3-‐33.
Bouwen, Pieter & Margaret McCown (2007). Lobbying versus litigation: Political and Legal strategies
of Interest Representation in the European Union, Journal of European Public Policy, 14(3): 422-‐443.
Cai, Jun (1994). A Markov Model of Switching-‐Regime ARCH. Journal of Business & Economic
Statistics 12(3):309–316.

Cortner, Richard C (1968). Strategies and Tactics of Litigants in Constitutional Cases. Journal of Public
Law 17:287-‐307.
Epstein, David L., Robert Bates, Jack Goldstone, Ida Kristensen & Sharyn O’Halloran (2006).
Democratic Transitions. American Journal of Political Science 50(3):551–569.
Gelman, Andrew & Jennifer Hill. 2007. Data Analysis Using Regression and Multilevel/Hierarchical
Models. New York: Cambridge University Press.
Gerber, Elisabeth & Arthur Lupia, Mathew D. McCubbins, D. Roderik Kiewiet (2001). Stealing the
initiative. How State government responds to direct democracy. Upper Saddle River, NJ: Prentice-‐Hall.
Halpin, Darren (2011). Explaining Policy Bandwagons: Organized Interest Mobilization and Cascades
of Attention, Governance: An International Journal of Policy, Administration, and Institutions 24 (2):
205-‐230.
Hanmer, Michael J. & K.Ozan Kalkan. 2013. Behind the Curve: Clarifying the Best Approach to
Calculating Predicted Probabilities and Marginal Effects from Limited Dependent Variable Models.
American Journal of Political Science 57(1):263–277.
Hansford, Thomas G (2004). Lobbying strategies, venue selection, and organized interest
involvement at the U.S. Supreme Court, American Politics Research 32 (2): 170-‐197.
Heinz, John P. et al. (1993). The Hollow Core: Private Interests in National Policy Making. Cambridge,
MA: Harvard University Press.
Holyoke, Thomas T. (2003). Choosing Battlegrounds: Interest Groups Lobbying across Multiple
Venues, Political Research Quarterly 56(3):325-‐336.
Hug, Simon & Simone Wegmann. 2012. Complying with human rights. Paper prepared for
presentation at the Annual Meeting of the Midwest Political Science Association, Chicago, April 12 -‐
15, 2012.
Imai, Kosuke, Gary King & Olivia Lau. 2007. “Zelig: Everyone’s Statistical Software.”
http://GKing.harvard.edu/zelig.
Jones, Bryan and Frank Baumgartner (2005). The politics of attention. How government prioritizes
problems, Chicago: Chicago University Press.
Klüver, Heike (2013). Lobbying in the European Union: Interest Groups, lobbying coalitions and policy
change. Oxford: Oxford University Press
Klüver, Heike & Nathalie Giger (2014). Voting against constituents? How lobbying affect
representation. Paper presented at the Symposium "Disenchanted Swiss Democracy", Zurich, 23-‐24
January 2014.
Kriesi, H. et al (2007). Going public in the European Union. Action repertoires of Western European
Collective Political Actors, Comparative Political Studies 40(1):48-‐73.
Lowery, David (2007). Why do organized interests lobby? A multi-‐goal, multi-‐context theory of
lobbying. Polity 39 (1): 29-‐54.
McKay, Amy M. (2011), The decision to lobby bureaucrats. Public Choice 147:123-‐138.
Markus, Gregory B. 1979. Analyzing Panel Data. Beverly Hills: Sage Publications.
Miller, Kenneth (2009). Direct Democracy and the Courts. New York: Cambridge University Press.
Mitchell, Sara McLaughlin & Emilia Justyna Powell. 2011. Domestic law goes global: Legal traditions
and international courts. Cambridge: Cambridge University Press.
Nownes, Anthony J. & Patricia Freeman (1998). Interest group activity in the States, The Journal of
Politics 60 (1):86-‐112.
Olson, S. (1990). Interest-‐group litigation in Federal district Court: Beyond the Political Disadvantage
Theory, The Journal of Politics, 52 (3): 854-‐882.
Park, Jong Hee. 2009. Joint Modeling of Dynamic and Cross-‐Sectional Heterogeneity: Introducing
Hidden Markov Panel Models. Department of Political Science University of Chicago.
Powell, Emilia Justyna & Sara McLaughlin Mitchell. 2007. “The International Court of Justice and the
World’s Three Legal Systems.” Journal of Politics 69(2):397–415.
Przeworski, Adam & James R. Vreeland. (2000). The Effect of IMF Programs on Economic Growth.”
Journal of Development Economics 62(2):385–421.
Schattschneider, E.E. (1960). The Semi-‐Sovereign People, New York: Holt, Reinhart & Winston.
Schmitter, Philippe C. & Streeck, Wolfgang (1999). The Organization of Business Interests: Studying
the Associative Action of Business in Advanced Industrial Societies. Koeln: Max-‐Planck-‐Institut fuer
Gesellschaftsforschung Discussion Paper 99/1.
Scholzman, Kay .L. (2008). Who sings in the heavenly chorus? Political inequality and the pressure
system. Paper presented at the APSA 2008, Boston MA.

Solberg, Rorie Spill & Eric N. Waltenburg (2006). Why do IG engage the judiciary? Policy wishes and
structural needs, Social science quarterly 87(3):558-‐57.
Stewart, John David (1958). British Pressure Groups: Their role in relation to the House of Commons.
Oxford: Clarendon Press.
Walker, Jack L (1991). Mobilizing Interest Groups in America: Patrons, Professions, and Social
Movements. Ann Arbor, MI: University of Michigan Press.
Wegmann, Simone. 2012. Regional Human Rights Systems. A Comparative Analysis. Geneva: Geneva
Laboratory of Political Science.
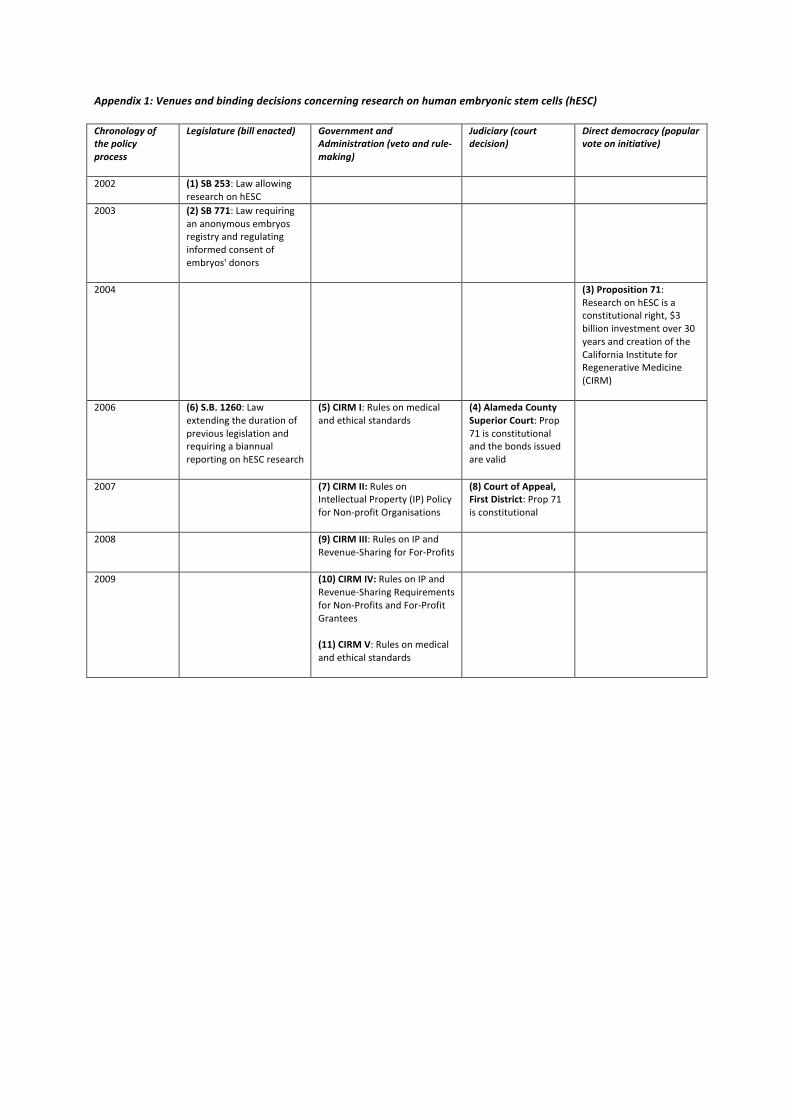
Appendix 1: Venues and binding decisions concerning research on human embryonic stem cells (hESC)
Chronology of the policy process
Legislature (bill enacted) Government and Administration (veto and rule-‐making)
Judiciary (court decision)
Direct democracy (popular vote on initiative)
2002 (1) SB 253: Law allowing research on hESC
2003 (2) SB 771: Law requiring an anonymous embryos registry and regulating informed consent of embryos' donors
2004 (3) Proposition 71: Research on hESC is a constitutional right, $3 billion investment over 30 years and creation of the California Institute for Regenerative Medicine (CIRM)
2006 (6) S.B. 1260: Law extending the duration of previous legislation and requiring a biannual reporting on hESC research
(5) CIRM I: Rules on medical and ethical standards
(4) Alameda County Superior Court: Prop 71 is constitutional and the bonds issued are valid
2007 (7) CIRM II: Rules on Intellectual Property (IP) Policy for Non-‐profit Organisations
(8) Court of Appeal, First District: Prop 71 is constitutional
2008 (9) CIRM III: Rules on IP and Revenue-‐Sharing for For-‐Profits
2009 (10) CIRM IV: Rules on IP and Revenue-‐Sharing Requirements for Non-‐Profits and For-‐Profit Grantees
(11) CIRM V: Rules on medical and ethical standards
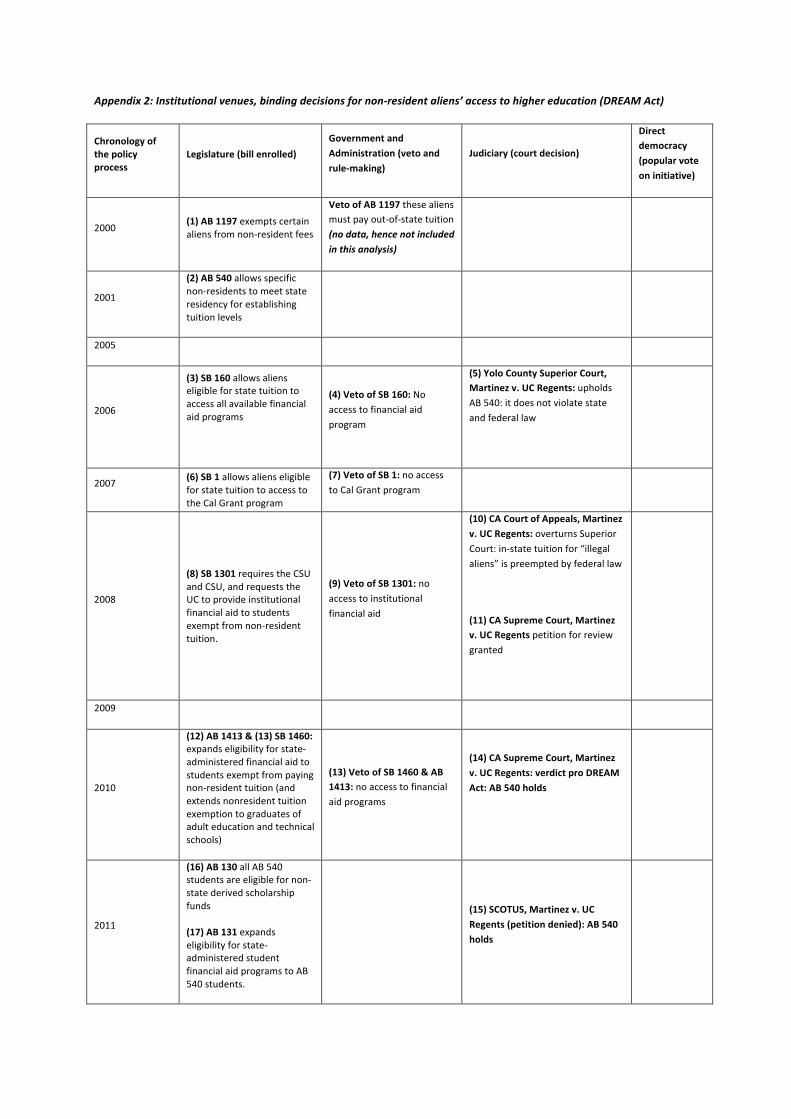
Appendix 2: Institutional venues, binding decisions for non-‐resident aliens’ access to higher education (DREAM Act)
Chronology of the policy process
Legislature (bill enrolled) Government and Administration (veto and rule-‐making)
Judiciary (court decision)
Direct democracy (popular vote on initiative)
2000 (1) AB 1197 exempts certain aliens from non-‐resident fees
Veto of AB 1197 these aliens must pay out-‐of-‐state tuition (no data, hence not included in this analysis)
2001
(2) AB 540 allows specific non-‐residents to meet state residency for establishing tuition levels
2005
2006
(3) SB 160 allows aliens eligible for state tuition to access all available financial aid programs
(4) Veto of SB 160: No access to financial aid program
(5) Yolo County Superior Court, Martinez v. UC Regents: upholds AB 540: it does not violate state and federal law
2007 (6) SB 1 allows aliens eligible for state tuition to access to the Cal Grant program
(7) Veto of SB 1: no access to Cal Grant program
2008
(8) SB 1301 requires the CSU and CSU, and requests the UC to provide institutional financial aid to students exempt from non-‐resident tuition.
(9) Veto of SB 1301: no access to institutional financial aid
(10) CA Court of Appeals, Martinez v. UC Regents: overturns Superior Court: in-‐state tuition for “illegal aliens” is preempted by federal law
(11) CA Supreme Court, Martinez v. UC Regents petition for review granted
2009
2010
(12) AB 1413 & (13) SB 1460: expands eligibility for state-‐administered financial aid to students exempt from paying non-‐resident tuition (and extends nonresident tuition exemption to graduates of adult education and technical schools)
(13) Veto of SB 1460 & AB 1413: no access to financial aid programs
(14) CA Supreme Court, Martinez v. UC Regents: verdict pro DREAM Act: AB 540 holds
2011
(16) AB 130 all AB 540 students are eligible for non-‐state derived scholarship funds
(17) AB 131 expands eligibility for state-‐administered student financial aid programs to AB 540 students.
(15) SCOTUS, Martinez v. UC Regents (petition denied): AB 540 holds

Appendix 3: Institutional venues and binding decisions for the California High Speed Rail (HSR)
Chronology of the policy process
Legislature (bill enrolled)
Government and Administration (veto and rule-‐making)
Judiciary (court decision) Direct democracy (popular vote on initiative)
2002 (1) SB 1856 creates the bond Act to provide $9.95 billion in bonds
2004 (2) SB 1169 delays the vote
2005
2008 (3) AB 713 delays the vote
(4) AB 3034 revises, updates and expands the Bond Act
(5) Prop 1A: legislature –referred voting on the issuance of the $9 billions of bonds: approved
2010
2011
2012 (7) SB 1029 approves construction financing for initial stage
(6) Superior Court 679 CHSRA must correct the defects identified in the Court’s ruling prior to reconsidering the Environmental Impact Report and approval of the project
(8) Superior Court 165: different groups settle with the CHSRA
2013 (9) Superior Court 002: CHSRA must correct the defects identified in the Court’s ruling prior to reconsidering the Environmental Impact Report and approval of the project
(10) Superior Court 919: The CHSRA abused its discretion, the identification of the sources of all funds and the certification of environmental clearance did not comply with Prop 1A
(11) Superior Court 689: CHRSA seeks a validation of its actions, but no evidence that it was necessary and desirable to authorize the issuance of bonds
(12) Appellate Court 877: Cases 002 & 679 were appealed together, ruling is pending (as of March 2014)
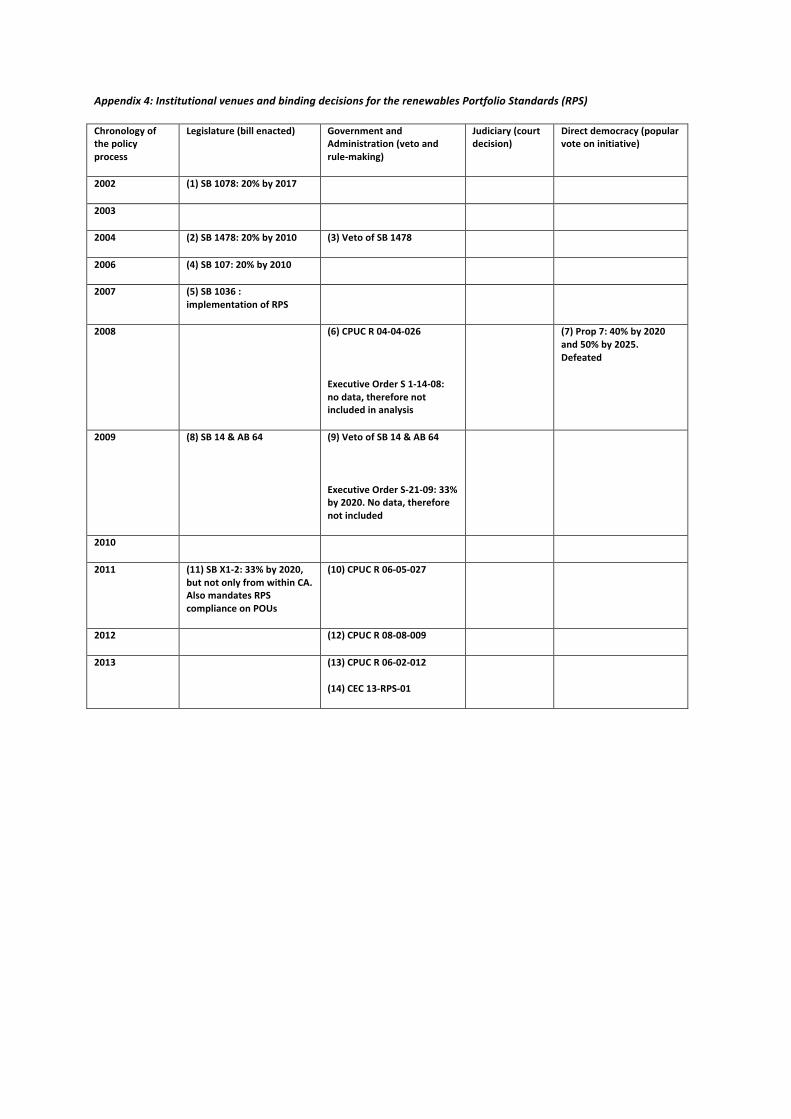
Appendix 4: Institutional venues and binding decisions for the renewables Portfolio Standards (RPS)
Chronology of the policy process
Legislature (bill enacted) Government and Administration (veto and rule-‐making)
Judiciary (court decision)
Direct democracy (popular vote on initiative)
2002 (1) SB 1078: 20% by 2017
2003
2004 (2) SB 1478: 20% by 2010 (3) Veto of SB 1478
2006 (4) SB 107: 20% by 2010
2007 (5) SB 1036 : implementation of RPS
2008 (6) CPUC R 04-‐04-‐026
Executive Order S 1-‐14-‐08: no data, therefore not included in analysis
(7) Prop 7: 40% by 2020 and 50% by 2025. Defeated
2009 (8) SB 14 & AB 64 (9) Veto of SB 14 & AB 64
Executive Order S-‐21-‐09: 33% by 2020. No data, therefore not included
2010
2011 (11) SB X1-‐2: 33% by 2020, but not only from within CA. Also mandates RPS compliance on POUs
(10) CPUC R 06-‐05-‐027
2012 (12) CPUC R 08-‐08-‐009
2013 (13) CPUC R 06-‐02-‐012
(14) CEC 13-‐RPS-‐01

Appendix 5: Sectional versus Cause groups mobilized in Stem Cells, as a % of total number of groups on each decision, and organized along a continuum of low-‐ to high-‐mobilization decisions
Venue Decision # Decision Sectional Cause Total # of groups on
each decision
A Decision 11 CIRM V 67% 33% 6
J Decision 4 Superior Court 14% 86% 7
L Decision 6 SB 1260 25% 75% 8
A Decision 10 CIRM IV 88% 13% 8
A Decision 9 CIRM III 75% 25% 12
L Decision 2 SB 771 6% 94% 16
A Decision 7 CIRM II 78% 22% 18
L Decision 1 SB 253 26% 74% 23
A Decision 5 CIRM I 73% 27% 26
J Decision 8 Appellate Court 35% 65% 31
D Decision 3 Prop 71 44% 56% 48
Total # of groups in the policy-‐process: 154
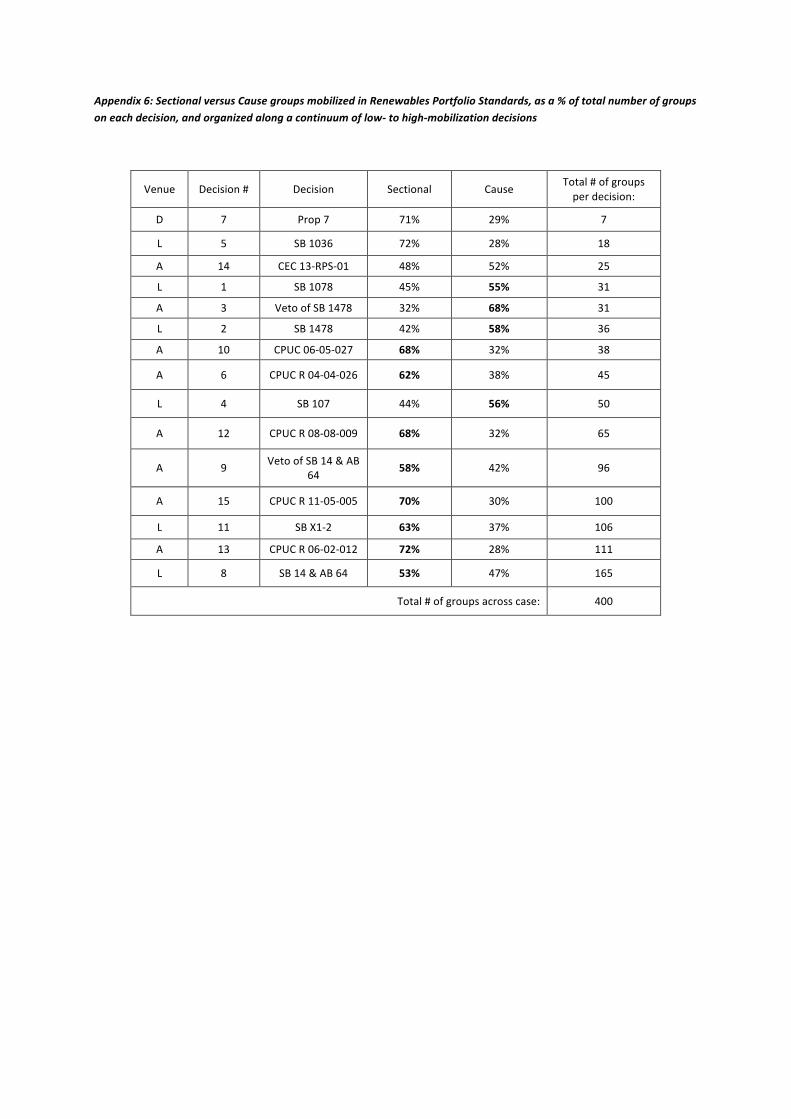
Appendix 6: Sectional versus Cause groups mobilized in Renewables Portfolio Standards, as a % of total number of groups on each decision, and organized along a continuum of low-‐ to high-‐mobilization decisions
Venue Decision # Decision Sectional Cause Total # of groups per decision:
D 7 Prop 7 71% 29% 7
L 5 SB 1036 72% 28% 18
A 14 CEC 13-‐RPS-‐01 48% 52% 25
L 1 SB 1078 45% 55% 31
A 3 Veto of SB 1478 32% 68% 31
L 2 SB 1478 42% 58% 36
A 10 CPUC 06-‐05-‐027 68% 32% 38
A 6 CPUC R 04-‐04-‐026 62% 38% 45
L 4 SB 107 44% 56% 50
A 12 CPUC R 08-‐08-‐009 68% 32% 65
A 9 Veto of SB 14 & AB 64 58% 42% 96
A 15 CPUC R 11-‐05-‐005 70% 30% 100
L 11 SB X1-‐2 63% 37% 106
A 13 CPUC R 06-‐02-‐012 72% 28% 111
L 8 SB 14 & AB 64 53% 47% 165
Total # of groups across case: 400
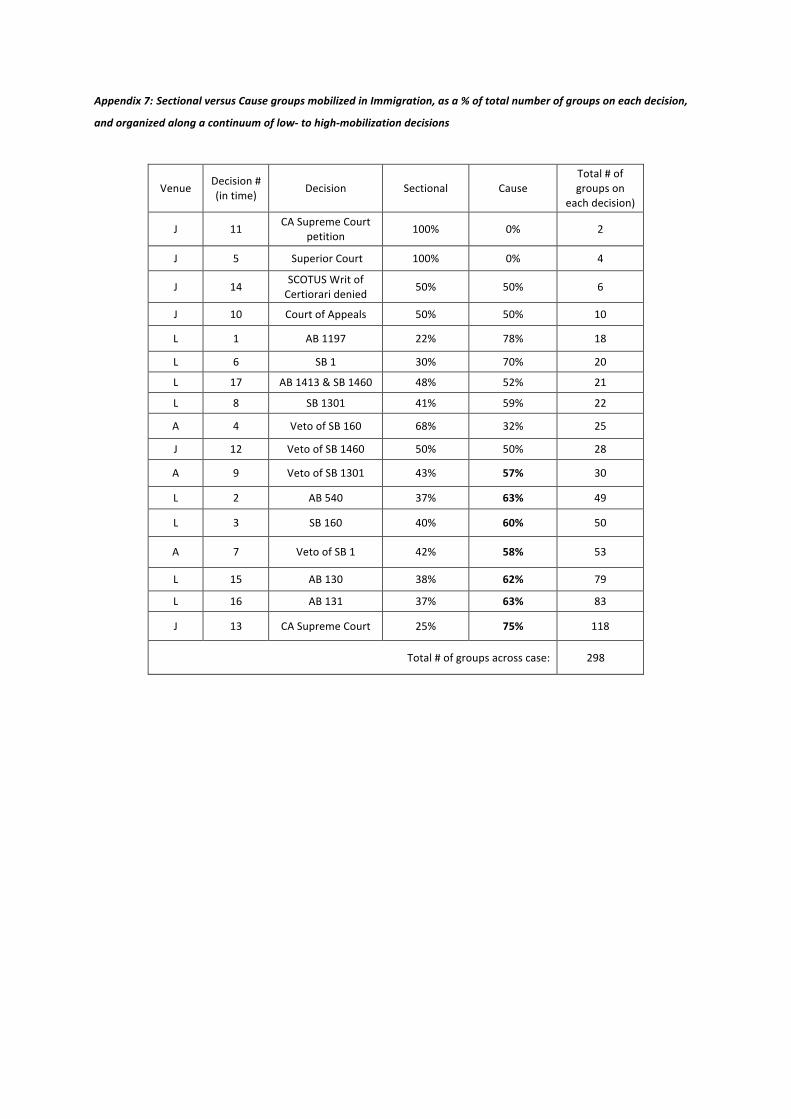
Appendix 7: Sectional versus Cause groups mobilized in Immigration, as a % of total number of groups on each decision,
and organized along a continuum of low-‐ to high-‐mobilization decisions
Venue Decision # (in time) Decision Sectional Cause
Total # of groups on
each decision)
J 11 CA Supreme Court petition 100% 0% 2
J 5 Superior Court 100% 0% 4
J 14 SCOTUS Writ of Certiorari denied 50% 50% 6
J 10 Court of Appeals 50% 50% 10
L 1 AB 1197 22% 78% 18
L 6 SB 1 30% 70% 20
L 17 AB 1413 & SB 1460 48% 52% 21
L 8 SB 1301 41% 59% 22
A 4 Veto of SB 160 68% 32% 25
J 12 Veto of SB 1460 50% 50% 28
A 9 Veto of SB 1301 43% 57% 30
L 2 AB 540 37% 63% 49
L 3 SB 160 40% 60% 50
A 7 Veto of SB 1 42% 58% 53
L 15 AB 130 38% 62% 79
L 16 AB 131 37% 63% 83
J 13 CA Supreme Court 25% 75% 118
Total # of groups across case: 298
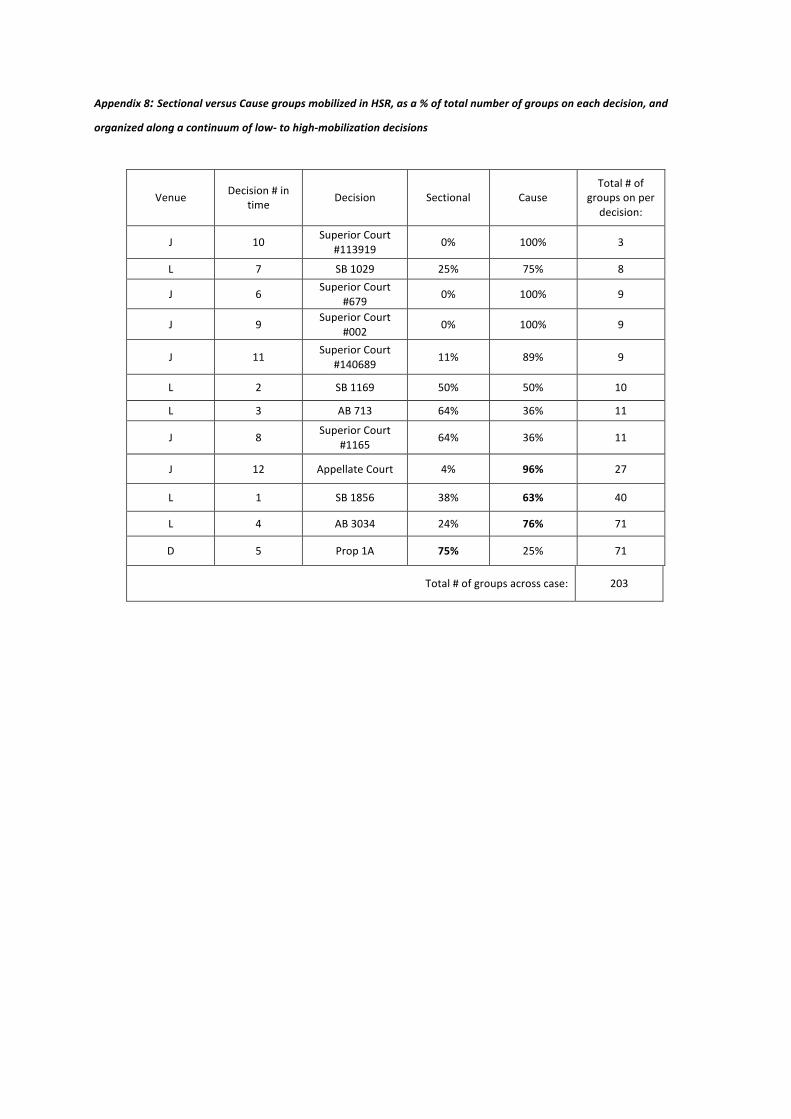
Appendix 8: Sectional versus Cause groups mobilized in HSR, as a % of total number of groups on each decision, and
organized along a continuum of low-‐ to high-‐mobilization decisions
Venue Decision # in time Decision Sectional Cause
Total # of groups on per
decision:
J 10 Superior Court #113919 0% 100% 3
L 7 SB 1029 25% 75% 8
J 6 Superior Court #679 0% 100% 9
J 9 Superior Court #002 0% 100% 9
J 11 Superior Court #140689 11% 89% 9
L 2 SB 1169 50% 50% 10
L 3 AB 713 64% 36% 11
J 8 Superior Court #1165 64% 36% 11
J 12 Appellate Court 4% 96% 27
L 1 SB 1856 38% 63% 40
L 4 AB 3034 24% 76% 71
D 5 Prop 1A 75% 25% 71
Total # of groups across case: 203