examining micrornas as regulators of hepatic lipid ...€¦ · examining micrornas as regulators of...
TRANSCRIPT

Examining microRNAs as regulators of hepatic lipid homeostasis
and hepatitis C virus replication
Ragunath Singaravelu
A thesis submitted to the
Faculty of Graduate and Postdoctoral Studies
in partial fulfillment of the requirements for the
Ph.D. degree in Microbiology and Immunology
Department of Biochemistry, Microbiology & Immunology
Faculty of Medicine
University of Ottawa
© Ragunath Singaravelu, Ottawa, Canada, 2016

ii
Abstract
Hepatitis C virus (HCV) infection is a leading cause of liver transplantation and
hepatocellular carcinoma worldwide. HCV, like all obligate parasites, relies on host
pathways to facilitate its pathogenesis. In particular, the virus possesses an intimate link
with hepatic lipid metabolism, promoting a lipid-rich cellular environment conducive to
HCV propagation. Clinically, these metabolic perturbations manifest as steatosis in over
50% of patients. The majority of research to-date examining how the virus co-opts hepatic
lipid pathways has been focused on coding genes and their protein products.
MicroRNAs (miRNAs) are post-transcriptional regulators of gene expression, which
have been implicated in virtually every cellular process. Through interactions with partially
complementary mRNAs, each individual miRNA has the capacity to repress the expression
of hundreds of genes and induce significant regulatory effects. Herein, we demonstrate that
hepatic miRNAs, including miR-7, miR-27a/b, miR-130b, and miR-185, act as crucial
regulatory molecules to the maintenance of hepatic lipid homeostasis. These miRNAs
cooperate to regulate fatty acid and cholesterol metabolism. HCV modulates the expression
of a subset of these miRNAs (miR-27a/b, miR-130b, and miR-185) to promote
hepatocellular lipid accumulation and the HCV life cycle. There appears to be a broad viral
requirement for lipids, and the mammalian innate immune response strategically targets host
metabolic pathways to restrict virus’ access to key lipid species. We demonstrate that 25-
hydroxycholesterol, a broadly anti-viral oxysterol produced as part of the innate anti-viral
response, activates miR-185 expression in the liver to deplete virus infected cells of lipids.
HCV appears to actively counteract this anti-viral response by suppressing miR-185

iii
expression. Collectively, our results highlight the role of microRNAs in hepatic lipid
metabolism and the immunometabolic response to viral infection.

iv
Acknowledgments
Firstly, I would like to thank my supervisor Dr. John Pezacki for the constant support he has
provided me throughout my academic endeavours. John has provided me with countless
opportunities to foster my creativity and develop as a scientist – not to mention the countless
letters of reference letters. He also gave me the freedom to pursue my own independent
ideas, which was most invaluable in my evolution as a scientist. I cannot thank him enough
for his ongoing mentorship.
Thanks to University of Ottawa, National Research Council of Canada, the National
CIHR Research Training Program in Hepatitis (NCRTP-HepC), Ontario Graduate
Scholarship program, and NSERC for funding and training support.
I would like to extend my gratitude to several people who have contributed to my
completion of graduate studies. To all the members of the Pezacki lab, both past and present,
thanks for collaborations and support provided through my graduate career. Specifically, the
technical (and emotional) support from Yanouchka Rouleau, Jenny Cheng, and Shifawn
O’Hara was instrumental in my academic success. Collaborations and conversations with
Rodney Lyn, Neda Nasheri, and David Blais helped me make significant advancements in
my research. I’ve also had the pleasure of training and working with several young
promising scientists, including Matthew Goodmurphy, Julie Delcorde, Prashanth Srinivasan,
Geneviève Desrochers, and Curtis Quan. I wish you all the best in your future careers. To
the rest of the lab, thanks for making my stay at the Pezacki lab an awesome one – especially
Marc Legault, Matthew Lafreniere, Douglas Mackenzie, Dana Danielson, and Megan
Powdrill.

v
Also, I am grateful to my scientific collaborators, who performed numerous
experiments crucial to our manuscripts. The labs of Drs. Rodney Russell, D. Lorne Tyrrell,
Katey Rayner, and Tom Hobman performed crucial experiments. I would especially like to
thank Drs. Tyrrell and Hobman for hosting me at University of Alberta to push my research
forward, as well as Christian Luebbert, Andrew Ridsdale, and Brandon Smith for technical
help with my microarray and microscopy work.
I would also like to thank the professors who have been part of my Thesis Advisory
Committee members, Drs. Martin Holcik, Earl Brown, Zemin Yao, Ilya Ioschikhes, as well
as Dr. Rayner. All of you have provided invaluable insight and direction to my projects.
I’d like to thank my family and friends. My parents and my brother provided me
with support and a framework that has been the foundation for all of my achievements. I
can’t thank my mother enough for her selflessness, which has played a major role in my
academic successes. To my friends outside the lab, Tom Jaroszewski, Steven Robinson,
Brandon Wilkie, David MacNamee, Andre Richards, and Nick Brisson, thanks for helping
me cut loose.
I’d also like to thank Denzel Washington’s character in the film Training Day,
Alonzo Harris, for reminding me that “it’s not what you know, it’s what you can prove.”
This quote holds true in the lab as well as it did in the morally corrupt streets of Los Angeles.
Lastly, and most importantly, to my wife, Alison Reiche, thank you for being my
sounding board and constant source of support, patience, love, and understanding throughout
my graduate studies. Your encouragement has always been one of the main drivers of my
perseverance, and I couldn’t have gotten to this point without you.

vi
Table of Contents
Abstract .................................................................................................................................... ii
Acknowledgments .................................................................................................................... iv
Table of Contents ..................................................................................................................... vi
List of Abbreviations ................................................................................................................ xi
List of Figures ...................................................................................................................... xvii
List of Tables .......................................................................................................................... xix
Chapter 1 – General introduction .............................................................................................. 1
Preface ................................................................................................................................... 2
MicroRNAs and the non-coding transcriptome .................................................................... 3
Hepatitis C virus (HCV) ........................................................................................................ 7
HCV cell culture and animal models ................................................................................... 10
HCV replicons and cell culture grown virus ................................................................... 10
Animal models ................................................................................................................. 13
HCV and hepatic lipid metabolism ..................................................................................... 15
Lipid metabolism and HCV entry .................................................................................... 16
Lipid metabolism and HCV replication ........................................................................... 18
Lipid droplet accumulation and HCV assembly .............................................................. 23
HCV and SREBP signaling ............................................................................................. 25
VLDL pathway and HCV assembly/secretion ................................................................. 28
Viruses: broad requirement for lipid microenvironments ................................................... 29
HCV and microRNAs .......................................................................................................... 30
HCV and miR-122 paradigm: an unconventional interaction ......................................... 30
HCV RNA’s direct interaction with other human miRNAs ............................................ 31
Host miRNAs and HCV-associated host pathways ......................................................... 31
Rationale .............................................................................................................................. 32
Statement of Objectives ................................................................................................... 33
Chapter 2 – Hepatitis C virus induced up-regulation of microRNA-27: a novel mechanism
for hepatic steatosis. ................................................................................................................ 34
Preface ................................................................................................................................. 35
Abstract ................................................................................................................................ 36

vii
Introduction ......................................................................................................................... 37
Materials and methods ......................................................................................................... 38
Reagents ........................................................................................................................... 38
CARS microscopy Imaging ............................................................................................. 38
Immunofluorescence and Oil Red O Staining ................................................................. 39
Results ................................................................................................................................. 39
HCV infection induces miR-27 expression ..................................................................... 39
miR-27 regulates hepatic lipid homeostasis .................................................................... 42
Peroxisome proliferator-activated receptor (PPAR)-α agonism reverses miR-27-induced
lipid accumulation ............................................................................................................ 44
miR-27 regulates the HCV lifecycle ................................................................................ 46
HCV infection in vivo activates miR-27 expression ........................................................ 48
Discussion ............................................................................................................................ 50
Acknowledgments ............................................................................................................... 55
Chapter 3 – MicroRNAs regulate the immunometabolic response to viral infection in the
liver ......................................................................................................................................... 57
Preface ................................................................................................................................. 58
Abstract ................................................................................................................................ 59
Introduction ......................................................................................................................... 60
Results ................................................................................................................................. 61
Identifying miRNAs relevant to immunometabolism ..................................................... 61
miR-185 and miR-130b regulate hepatic lipid metabolism ............................................. 66
25-HC–induced miRNAs regulate HCV life cycle .......................................................... 66
HCV infection in vivo represses miR-185 expression ..................................................... 70
miR-185 regulates virus-induced lipid microenvironments ............................................ 72
Discussion ............................................................................................................................ 75
Materials and methods ......................................................................................................... 76
Materials .......................................................................................................................... 76
Cell culture and transfections .......................................................................................... 77
HCV infection .................................................................................................................. 78
HCV infectivity assay ...................................................................................................... 78
viii
DENV infection and titer determination .......................................................................... 79
VSV infection and titer determination ............................................................................. 79
SCID/Alb-uPA mice experiments ................................................................................... 80
CARS microscopy ........................................................................................................... 80
Triglyceride assay ............................................................................................................ 80
Small molecule–mediated annotation of microRNA targets (SMART) .......................... 81
miRNA microarray analysis ............................................................................................ 81
mRNA microarray analysis ............................................................................................. 82
Quantitative PCR ............................................................................................................. 82
Immunoblot analysis ........................................................................................................ 83
3′ UTR luciferase reporter analysis.................................................................................. 84
Electron microscopy ........................................................................................................ 85
Immunofluorescence and Oil Red O staining .................................................................. 85
Fatty acid methyl ester (FAME) analysis ........................................................................ 85
HPLC total lipid analysis ................................................................................................. 86
Statistical analysis ............................................................................................................ 87
Data availability ............................................................................................................... 87
Accession codes ............................................................................................................... 87
Acknowledgments ............................................................................................................... 87
Chapter 4 – MicroRNA-7 mediates cross-talk between metabolic signaling pathways in the
liver ......................................................................................................................................... 89
Preface ................................................................................................................................. 90
Abstract ................................................................................................................................ 91
Introduction ......................................................................................................................... 92
Results ................................................................................................................................. 94
PPAR-α signaling regulates miR-7 expression ................................................................ 94
miR-7 stimulates SREBP1 signaling ............................................................................... 96
miR-7 promotes hepatocellular lipid accumulation ......................................................... 99
miR-7 modulates expression of lipid metabolism-associated genes ............................. 102
Discussion .......................................................................................................................... 103
Materials and methods ....................................................................................................... 107

ix
Materials ........................................................................................................................ 107
Cell culture and transfections ........................................................................................ 108
HCV infection ................................................................................................................ 108
miRNA microarray analysis .......................................................................................... 108
CARS microscopy ......................................................................................................... 109
Triglyceride assay .......................................................................................................... 110
mRNA microarray analysis ........................................................................................... 110
Quantitative RT-PCR ..................................................................................................... 110
Statistical analysis .......................................................................................................... 111
Acknowledgments ............................................................................................................. 111
Chapter 5 – General discussion and future directions ........................................................... 112
Elucidation of novel miRNA/mRNA networks regulating hepatic metabolism ............... 113
Role of miRNAs in HCV’s hijacking of hepatic metabolism ........................................... 114
miR-27a/b ...................................................................................................................... 114
miR-185 ......................................................................................................................... 116
miR-130b ....................................................................................................................... 117
miR-7 ............................................................................................................................. 117
miRNAs and HCV-associated steatosis ......................................................................... 118
Systematic approaches to identify miRNAs regulating virus-associated pathways .......... 119
miR-185 and 25-HC mediated innate anti-viral response ................................................. 122
General conclusions ........................................................................................................... 123
References ............................................................................................................................. 125
Contribution of Collaborators ............................................................................................... 152
Appendices ............................................................................................................................ 153
Supplemental information for Chapter 2 ........................................................................... 154
Supplemental materials and methods ............................................................................ 154
Supplemental figures and tables .................................................................................... 161
Supplemental information for Chapter 3 ........................................................................... 173
Supplemental figures and tables .................................................................................... 173
Supplemental information for Chapter 4 ........................................................................... 196
Supplemental figures and tables .................................................................................... 196

x
Rights and Permissions ......................................................................................................... 201
Curriculum Vitae ................................................................................................................... 202

xi
List of Abbreviations
19-HC 19-hydroxycholesterol
25-HC 25-hydroxycholesterol
ADRP adipocyte differentiation-related protein
AGPAT3 1-acyl-sn-glycerol-3-phosphate acyltransferase 3
Alb albumin
AMPK 5' adenosine monophosphate-activated protein kinase
ANGPTL3 angiopoietin-like protein 3
APO apolipoprotein
ATGL adipose triglyceride lipase
CARS coherent anti-Stokes Raman scattering
CBP cAMP response element-binding protein (CREB) binding protein
ceRNA competing endogenous RNAs
CD81 Cluster of Differentiation 81
cDNA complementary DNA
CFP cyan fluorescent protein
CH25H cholesterol-25-hydroxylase
CIDE cell death inducing DFF45-like effector
CK-18 cytoskeletal keratin 18
CPT1A carnitine palmitoyltransferase 1A
DAA direct-acting anti-virals
DAPI 4',6-diamidino-2-phenylindole
DGAT1 diacylglycerol acyltransferase 1
DNA deoxyribonucleic acid
DENV dengue virus

xii
DGCR8 DiGeorge critical region 8
DMEM Dulbecco’s modified Eagle medium
DMSO dimethyl sulfoxide
DMV double membrane vesicles
dsRNA double stranded RNA
DTT 1,4-dithiothreitol
EM electron microscopy
EMCV encephalomyocarditis virus
ERLIN2 ER lipid raft associated 2
FADS1 fatty acid desaturase 1
FAME fatty acid methyl ester
FAPP four-adaptor phosphate protein
FBL2 F box protein FBL2
FBS fetal bovine serum
FCS fetal calf serum
FDR false discovery rate
FFU focus forming units
F/SGR full/subgenomic replicon
G3P glycerol-3-phosphate
GSEA gene set enrichment analysis
GTP guanosine triphosphate
HBV hepatitis B virus
HBx HBV protein X
HCC hepatocellular carcinoma
HCV hepatitis C virus

xiii
HDL high-density lipoprotein
HEPES 4-(2-hydroxyethyl)-1-piperazineethanesulfonic acid
HPLC high-performance liquid chromatography
IDE insulin degrading enzyme
IFN interferon
IKK-α IκK kinase-α
IL1B interleukin 1B
INSIG insulin induced gene
IRES internal ribosome entry site
JFH1 Japanese fulminant hepatitis
LD lipid droplets
LDLR low-density lipoprotein receptor
LRP1 LDLR related protein 1
LVP lipo-viro-particle
LXR liver X receptor
miR microRNA
miRNAs microRNAs
MOI multiplicity of infection
MTTP microsomal triglyceride transfer protein
mRNA messenger RNA
LNA locked nucleic acids
LPL lipoprotein lipase
MTT 3-[4,5-dimethylthiazol-2-yl]-2,5-diphenyltetrazolium bromide
MW membranous web
nAb neutralizing antibody

xiv
ncRNA non-coding RNA
NCEH1 neutral cholesterol ester hydrolase 1
NEAA non-essential amino acids
NF-κB nuclear factor kappa-light-chain-enhancer of activated B cells
NLRP3 NOD-like receptor family, pyrin domain containing 3
NPC1L1 Niemann-Pick C1-like 1
NR1H2 nuclear receptor subfamily 1 group H member 2
NS non-structural
nt(s) nucleotide(s)
OA oleic acid
ORF open reading frame
OSBP oxysterol binding protein
PAGE polyacrylamide gel electrophoresis
PBS phosphate buffer saline
PCSK5 proprotein convertase subtilisin/kexin type 5
PH pleckstrin homology
PI phosphoinositide
PI3K phosphoinositide-3-kinase
PI4KA phosphatidylinositol 4-kinase III
PI4P phosphoinositide-4-phosphate
PNPLA3 patatin-like phospholipase family 3 protein
PPAR peroxisome proliferator activated receptor
PRKAA1 protein kinase, AMP-activated, alpha 1 catalytic subunit
PTP1D protein tyrosine phosphatase 1D
PUFA polyunsaturated fatty acids

xv
qRT-PCR quantitative real-time polymerase chain reaction
Rdrp RNA-dependent RNA polymerase
RIG-I retinoic acid-inducible gene I
RNA ribonucleic acid
RNU6B RNA, U6 Small Nuclear 2
ROS reactive oxygen species
RT room temperature or reverse transcription
RXR retinoid X receptor
S1P site 1 protease
S2P site 2 protease
SCARB1 scavenger receptor class B member 1
SCAP SREBP cleavage activating protein
SCD stearoyl CoA desaturase
SCID severe combined immunodeficiency
SDS sodium
siRNA silencing RNA
SMART small molecule-mediated annotation of microRNA targets
SNP single nucleotide polymorphism
SPT serine palmitoyltransferase
SREBP sterol response element binding protein
SSC sodium-saline citrate
STING stimulator of interferon genes
TBE Tris/borate/ETA
TG triglyceride
TIP47 tail interacting protein of 47 kDa

xvi
uPa urokinase plasminogen activator
UTR untranslated region
VLDL very-low-density-lipoprotein
VLDLR VLDL receptor
VSV vesicular stomatitis virus
XPO5 exportin 5

xvii
List of Figures
Figure 1.1. Overview of microRNA biogenesis and potential interplay with HCV infection. . 5
Figure 1.2. Overview of hepatitis C virus life cycle. ................................................................ 9
Figure 1.3. Summary of negative feedback loop regulating SREBP signaling. ..................... 26
Figure 2.1. HCV expression activates miR-27 expression in vitro. ........................................ 40
Figure 2.2. miR-27 regulates hepatic lipid homeostasis. ........................................................ 43
Figure 2.3. PPAR-α agonism reverses miR-27b-induced lipid accumulation. ....................... 45
Figure 2.4. miR-27b overexpression inhibits genotype 1b HCV RNA replication. ............... 47
Figure 2.5. HCV infection enhances miR-27 expression in vivo. ........................................... 49
Figure 2.6. Proposed model by which HCV-induced miR-27 overexpression promotes
steatosis. .................................................................................................................................. 52
Figure 3.1. 25-HC and HCV oppositely regulate miRNA expression. ................................... 62
Figure 3.2. 25-HC–stimulated miRNAs inhibit HCV life cycle. ............................................ 65
Figure 3.3. 25-HC–stimulated miRNAs regulate hepatic lipid metabolism. .......................... 67
Figure 3.4. HCV infection in vivo disrupts hepatic lipid metabolism. .................................... 71
Figure 3.5. miR-185 inhibits HCV replication through regulation of lipid microenvironments.
................................................................................................................................................. 73
Figure 4.1. PPAR-α antagonism and 25-HC treatment modulate miR-7 expression. ............ 95
Figure 4.2 miR-7 promotes cellular lipid accumulation. ...................................................... 100
Figure 4.3 miR-7 regulates genes associated with PPAR signaling and hepatic lipid
metabolism. ........................................................................................................................... 101
Figure 4.4 Proposed model of miR-7’s role in cross-talk between PPAR, SREBP, and LXR
signaling pathways. ............................................................................................................... 106
Figure 5.1. HCV-modulated miRNAs’ influence on HCV-host interactions in lipid pathways.
............................................................................................................................................... 115
Figure S2.1. miR-27 isoforms and conservation of sequence. .............................................. 161
Figure S2.2. Overexpression of HCV viral proteins yields increases in expression of both
miR-27 isoforms. ................................................................................................................... 162
Figure S2.3. HCV core and NS4B activate miR-27 activity in a PI3K pathway-dependent
manner. .................................................................................................................................. 163
Figure S2.4. Validation of miRNA mimic and inhibitor activity. ........................................ 164
Figure S2.5. miR-27 overexpression induces lipid accumulation in Huh7.5 cells. .............. 165

xviii
Figure S2.6. Cytotoxicity of miR-27b mimic and inhibitor transfections. ........................... 166
Figure S2.7. miR-27b regulates key genes involved in triglyceride homeostasis. ............... 167
Figure S2.8. PPAR-α antagonism in Huh7 cells induces lipid accumulation. ...................... 168
Figure S2.9. miR-27-mediated repression of RXR-α expression is insufficient to induce lipid
accumulation. ........................................................................................................................ 169
Figure S2.10. miR-27b inhibition decreases extracellular JFH-1T HCV infectivity............. 170
Figure S2.11. HCV infection of SCID-beige/Alb-uPa mice. ................................................ 171
Figure S3.1. 25-hydroxycholesterol (25-HC) inhibits HCV replication. .............................. 173
Figure S3.2. 25-hydroxycholesterol (25-HC) inhibits Dengue virus infectivity. ................. 174
Figure S3.3. Overview of general application of SMART technique towards identification of
pathways regulated by miRNAs modulated by pathogens or in disease states. .................... 175
Figure S3.4. Functional analysis of the role of 25-HC regulated miRNAs in HCV replication.
............................................................................................................................................... 176
Figure S3.5. HCV represses miR-185 expression. ................................................................ 177
Figure S3.6. 25-HC–stimulated miRNAs inhibit HCV infection. ........................................ 178
Figure S3.7. 25-HC–stimulated miRNAs regulate hepatic lipid metabolism. ...................... 179
Figure S3.8. 25-HC–stimulated miRNAs directly regulate SCD1, AGPAT3, SREBP2, and
LDLR. ................................................................................................................................... 180
Figure S3.9. Conservation of miRNA recognition elements in direct targets of 25-HC–
stimulated miRNAs. .............................................................................................................. 181
Figure S3.10. miR-185 overexpression activates miR-130b expression. ............................. 182
Figure S3.11. Inhibition of glycerol-3-phosphate pathway for triglyceride biosynthesis
impairs HCV replication. ...................................................................................................... 183
Figure S3.12. Gene expression analysis in miR-185 mimic transfected hepatocytes. .......... 184
Figure S3.13. HCV infection in vivo perturbs hepatic lipid homeostasis. ............................ 185
Figure S3.14. Effect of oleic acid and lipid mixture on 25-HC induced miRNAs’ anti-viral
effect. ..................................................................................................................................... 186
Figure S3.15. miR-185 inhibits DENV and VSV infectivity. ............................................... 187
Figure S3.16. 25-HC induced miR-185 expression regulates immunometabolic response. . 188
Figure S3.17. miR-185 regulates macrophage lipid metabolism. ......................................... 189
Figure S4.1. Gene expression analysis in miR-7 transfected mimic Huh7.5 cells. .............. 196
Figure S4.2. Conservation of miRNA recognition elements in direct targets of miR-7. ...... 197

xix
List of Tables
Table 4.1. Human miRNAs differentially expressed in HCV infected Huh7.5 cells treated
with PPAR-α antagonist. ......................................................................................................... 97
Table 4.2. Human miRNAs modulated by both PPAR-α antagonist and 25-HC ................... 98
Table S2.1. List of oligonucleotides. .................................................................................... 172
Table S3.1. Summary of HCV modulated miRNAs. ............................................................ 190
Table S3.2. Summary of 25-HC modulated human miRNAs.. ............................................. 191
Table S3.3. Gene ontology analysis of 25-HC modulated miRNAs’ experimentally validated
targets .................................................................................................................................... 192
Table S3.4. Gene ontology analysis classifying genes repressed by >1.5 fold in miR-185
mimic transfected Huh7.5 cells by biological process .......................................................... 193
Table S3.5. Gene ontology analysis classifying genes repressed by >1.5 fold in miR-185
mimic transfected Huh7.5 cells by molecular function. ....................................................... 194
Table S3.6. List of oligonucleotides used in this study. ........................................................ 195
Table S4.1. Gene ontology analysis classifying genes activated by >1.5 fold in miR-7 mimic
transfected Huh7.5 cells by biological process. .................................................................... 198
Table S4.2. Summary of GSEA results with FDR < 0.05 – KEGG pathways enriched in miR-
7 transfected cells. ................................................................................................................. 199
Table S4.3. List of oligonucleotides used in this study. ........................................................ 200

1
Chapter 1 – General introduction
2
Preface
The following chapter serves as a broad introduction to microRNA regulation of hepatic lipid
metabolism and hepatitis C virus pathogenesis. Portions of the introduction, including
figures, have been adapted from two previously published review articles (R. Singaravelu,
R.S. Russell, D.L. Tyrrell, J.P. Pezacki. “Hepatitis C virus and microRNAs: miRed in a host
of possibilities” Curr. Opin. Virol. and R. Singaravelu, P. Srinivasan, J.P. Pezacki. “Armand-
Frappier Outstanding Student Award – The emerging role of 25-hydroxycholesterol in innate
immunity” Can J. Microbiol.), with permission from both of the publishers of both these
journals – refer to Rights and Permissions. As first and co-corresponding author, I made
significant intellectual contributions to writing these reviews.

3
One of the major research focuses of the Pezacki lab is characterizing host-virus interactions
regulating cellular metabolism. This includes understanding how the virus modulates host
metabolism to facilitate its propagation as well how the host’s immune response regulates
metabolic pathways to combat viral infection. In order to achieve these research goals, our
lab employs a systems biology approach, including studies utilizing activity-based protein
profiling (Blais et al., 2012), non-linear microscopy (Pezacki et al., 2011), and genomics (Su
et al., 2002). My thesis work aimed to shed light on the role of non-coding RNAs in the
metabolic interplay between host and virus.
MicroRNAs and the non-coding transcriptome
Over the past two decades, the importance of non-coding RNAs’ contribution to gene
regulatory networks has risen to the forefront of systems biology. Recent work has revealed
that over 75% of the human genome is transcribed (Djebali et al., 2012); however, as only
2% of the genome encodes for protein, the majority of human DNA encodes transcripts
lacking coding-potential. This non-coding transcriptome can be crudely separated into long
(> 200 nt) and small (< 200 nt) non-coding RNAs (ncRNAs) based on the length of the
species. While we are only beginning to understand the role of long ncRNAs in gene
regulation, our knowledge of the three major classes of small RNAs (microRNAs, silencing
RNAs, and Piwi-interacting RNAs) is comparatively advanced (Carthew and Sontheimer,
2009; Malone and Hannon, 2009).
MicroRNAs (miRNAs) are a family of ~21-24 nt small RNAs which post-
transcriptionally regulate gene expression. The primary transcripts for miRNAs (pri-
miRNAs) are transcribed by RNA polymerase II or III, and the canonical pathway of
microRNA processing comprises of two successive endonucleolytic cleavages (Bartel, 2009;

4
Carthew and Sontheimer, 2009). The first processing step involves the microprocessor
complex, consisting of the RNase III enzyme Drosha and DiGeorge critical region 8
(DGCR8), which cleaves the pri-miRNAs into miRNA precursor stem loops (pre-miRNAs).
The pre-miRNAs are then shuttled to the cytoplasm by the Exportin 5 (XPO5)-Ran-GTP
complex, and subsequently processed by another RNase III enzyme, Dicer, into the mature
miRNA duplex. A single guide strand of the miRNA duplex is incorporated into the RNA
induced silencing complex (RISC) for targeting of complementary mRNAs. This interaction
of the miRNA with the mRNA induces mRNA decay and translation repression – thereby
decreasing overall protein output (Huntzinger and Izaurralde, 2011). This model of miRNA
biogenesis and function is summarized in Figure 1.1.
Canonical miRNA-mRNA interactions comprise of Watson-Crick pairing at mRNA
sequences exhibiting complementary to the miRNA’s seed sequence (nts 2-7 from the 5’ end
of the miRNA) (Agarwal et al., 2015). This partial pairing between the miRNA and its
mRNA target generally occurs with the 3’UTR of the target mRNA (Gu et al., 2009).
Through this conventional mechanism, each mammalian miRNA is predicted to regulate
hundreds of different transcripts (Agarwal et al., 2015). Recent work has suggested other
non-canonical modes of interaction between miRNAs exist, including interactions mediated
through pairing with the center and 3’ end of the miRNA (Shin et al., 2010) as well as seed
site interactions bearing a nucleotide mismatch at the seed site (Chi et al., 2012); however,
biologically relevant instances of these non-conventional modes of interaction appear to be
rare (Agarwal et al., 2015). It is through these mechanisms that over half of protein coding
mRNA transcripts are predicted to be regulated by miRNAs (Friedman et al., 2009).
In order to predict miRNA function, it is important to characterize the mRNA targets
that comprise its regulome. Several computational tools have been developed for predicting

5
Figure 1.1. Overview of miRNA biogenesis and potential interplay with HCV infection.
Human miRNAs are generally transcribed by RNA polymerase II or III. In the canonical
pathway, this primary miRNA transcript is first processed in the nucleus by the endonuclease
Drosha into a stem loop precursor, which is exported to the cytoplasm by the Exportin 5
(XPO5)/RanGTP complex. In the cytosol, another endonuclease, Dicer, catalyzes the final
processing step to the mature miRNA duplex. Alternatively, the HCV RNA genome or its
dsRNA intermediate can serve as a substrate for Dicer to produce virus-derived miRNA
duplexes. Processed host and viral small RNA duplexes associate with the RNA induced
silencing complex, containing Ago2 and GW182, to inhibit complementary target genes’
expression. Reprinted from Current Opinion in Virology (2014), Vol. 7, Singaravelu,
Russell, Tyrrell & Pezacki, Hepatitis C virus and microRNAs: miRed in a host of
possibilities, pp. 1-10, with permission from Elsevier.

6
miRNA targets, and these algorithms consider several different criteria, including sequence
conservation of binding sites across species and thermodynamics (Friedman et al., 2009).
Generally, these predictions are limited to canonical sites. Another significant limitation of
these computational approaches is their inability to make contextual considerations for a
specific cell type. While a miRNA may have a conserved binding site in the 3’UTR of a
potential target, the levels of competing endogenous RNAs (ceRNAs) with bindings sites for
the same miRNA may dampen that miRNA’s regulatory effects on the target (Salmena et al.,
2011). Additionally, RNA binding proteins may bind and mask putative binding sites
(Szostak and Gebauer, 2013). Another important consideration is the relative expression
levels in the model of interest, as certain targets and miRNAs may not be expressed at
physiologically relevant levels. Lastly, each algorithm can predict over 1000 putative
mRNA targets for each miRNA, making it difficult to tease out the relevant functional
targets in a given system. For these reasons, it remains quite challenging to ascribe
biological function to miRNAs. Chapters 3 and 4 describe the use of small molecule
modulators to identify miRNAs regulating specific host pathways.
MicroRNAs have been implicated in the regulation of a diverse range of biological
processes, including cellular differentiation (Ivey and Srivastava, 2010) and metabolism
(Moore et al., 2011; Rottiers and Näär, 2012). Given the broad physiological importance of
miRNAs, it is not surprising that disease states are linked with dysregulated miRNA profiles.
The relevance of miRNAs in disease development was first established in oncogenesis
(Gregory and Shiekhattar, 2005). Subsequently, miRNAs were determined to have an
impact on the etiologies of several diseases, ranging from metabolic disorders (Moore et al.,
2011; Rottiers and Näär, 2012) to viral infections (Sarnow et al., 2006), including hepatitis C

7
virus (Randall et al., 2007; Singaravelu et al., 2014b). The miRNAs downregulated during
disease development are candidates for miRNA replacement therapy; whereas those
miRNAs whose expression is upregulated in disease states are potential targets for miRNA
sequestration-based therapy. To-date, both miRNA sequestration-based and replacement-
based therapies have entered into clinical trials (Agostini and Knight, 2014; Janssen et al.,
2013) – demonstrating the therapeutic potential of targeting miRNAs. This is especially true
in the setting of liver, where different avenues for effective delivery of nucleic acid-based
therapies have been established (Wittrup and Lieberman, 2015).
Hepatitis C virus (HCV)
Hepatitis C virus (HCV) is one of the universal leading causes of hepatocellular carcinoma
(HCC) and liver transplantations (Lavanchy, 2011). Approximately, 170 million people
worldwide are afflicted with the virus. Of those acutely infected, 80% progress to persistent
infections, which can result in chronic liver diseases, such as cirrhosis and HCC (Hoofnagle,
2002). Furthermore, in patients undergoing hepatic transplantation with detectable virus
levels, recurrent infection of the allograft is universal (Charlton et al., 2004). To date, there
is no effective vaccine; however, cocktails of direct-acting anti-virals (DAAs) show promise
as effective therapeutics that can cure chronic HCV infection (Pawlotsky et al., 2015).
HCV is a positive sense RNA virus of the genus Hepacivirus and family Flaviviridae.
The virus possesses a narrow host range and tissue tropism – with only humans,
chimpanzees, rheusus macaques, and tree shrews being the only known animals whose
hepatocytes support the entire HCV life cycle (Scull et al., 2015 ; Vercauteren et al., 2014).
Its genome spans 9.6 kilobases and encodes for a ~3000 amino acid polyprotein precursor,
which is processed into three structural (core, E1, and E2) and seven non-structural (NS)

8
proteins (p7, NS2-5B) by host and viral proteases (Lindenbach and Rice, 2005). The highly
structured viral genome contains 5’ and 3’ untranslated regions (UTRs) with the 5’UTR
bearing an internal ribosome entry site (IRES) (Lindenbach and Rice, 2005; Mauger et al.,
2015). The virus is highly heterogeneous, being classified into 7 major genotypes, each
differing by over 30% in nucleotide sequence (Simmonds et al., 2005; Smith et al., 2014). In
early drug development, this heterogeneity resulted in difficulty designing effective pan-
genotypic treatment strategies, but the use of a DAA-based drug cocktail targeting NS5B
RNA dependent RNA polymerase (RdRp), the NS5A protein, and NS3/4A protease
simultaneously have revolutionized HCV treatment options and produced infection cure rates
above 90% (Myers et al., 2015).
A simplified model of the HCV life cycle is presented in Figure 1.2. Briefly, the
enveloped virus, which is associated with lipids and apolipoproteins as a “lipo-viro-particle”
(LVP) (André et al., 2002), adsorbs to cell surfaces via lipoprotein receptors and
glycosaminoglycans (GAG) (Douam et al., 2015). This is followed by coordinated
interactions with several host entry factors, including CD81 (Pileri et al., 1998), scavenger
receptor class B member 1 (SCARB1) (Scarselli et al., 2002), occludin (Ploss et al., 2009),
and claudin 1 (Evans et al., 2007). These interactions ultimately leads to virion
internalization via clathrin-mediated endocytosis (Douam et al., 2015). The envelope
proteins E1 and E2 mediate pH-dependent membrane fusion between the viral and
endosomal membrane, which allows for the release of the HCV RNA genome into the
cytoplasm of the host cell. The genome serves as a template for RNA replication as well as
translation of the viral polyprotein precursor, which is cleaved by both host and viral
proteases into structural and NS proteins (Lindenbach and Rice, 2005). Replication occurs

9
Figure 1.2. Overview of hepatitis C virus life cycle. A simplified model of the HCV viral
life cycle is presented. The HCV virion, associated with lipids and apolipoproteins, attaches
to the hepatocyte cell surface via via lipid absorption receptors and glycosaminoglycans,
followed by coordinated interactions with several host entry factors. These interactions
ultimately leads to virion internalization. After membrane fusion and uncoating, the viral
genome is released into the cytoplasm of the host cell. The genome serves as a template for
RNA replication as well as translation of the viral proteins. Replication is though to occur in
a lipid-droplet associated ER-derived membranous web, which includes double membrane
vesicles. HCV virions are assembled and secreted similar to very-low-density lipoprotein
particles. Figure adapted from Canadian Journal of Microbiology, Singaravelu, Srinivasan &
Pezacki, Armand-Frappier Outstanding Student Award — The emerging role of 25-
hydroxycholesterol in innate immunity (2015), 61(8): 521-530, with permission from
Canadian Science Publishing.

10
on virus-induced membranous structures, which are associated with lipid droplets (Paul et
al., 2014). HCV RNAs are packaged into viral particles and exit the cell via co-opting of the
very-low-density lipoprotein (VLDL) assembly, maturation, and secretory pathways
(Lindenbach and Rice, 2013).
HCV cell culture and animal models
After the identification of HCV as the causative agent of non-A, non-B viral hepatitis in
1989 (Choo et al., 1989), the immediate research examining its virology was hampered by
the inability to achieve efficient viral replication and produce infectious particles in cell
culture (Lohmann and Bartenschlager, 2014). The eventual establishment of robust cell
culture models was instrumental in attaining our current understanding of the virus and the
development of effective drugs (Lohmann and Bartenschlager, 2014). This in vitro work has
been complemented by in vivo studies performed in the limited number of small animal
models available to HCV researchers (Vercauteren et al., 2015).
HCV replicons and cell culture grown virus
The initial attempts to culture HCV in immortalized cell lines and primary hepatocytes
suffered from low levels of viral replication (Lohmann and Bartenschlager, 2014). One of
the first major milestones in HCV cell culture model development was the construction of an
autonomously replicating HCV RNA (or replicons) derived from a genotype 1b consensus
isolate (Con1) (Lohmann et al., 1999). Many different replicons have been developed since
including bicistronic constructs with the HCV IRES driving expression of neomycin (G418)
resistance, and an encephalomyocarditis virus (EMCV) IRES driving expression of the HCV
proteins. The construct was flanked by the 5’ UTR and 3’ UTR of the Con1 isolate, and
replicated at levels which enabled facile detection of HCV RNA levels. The G418 resistance

11
was used to drive selection of cells expressing the HCV replicons (SGR), and this selection
was only successfully performed in Huh7 hepatoma cells. The replicons encoded either the
full length polyprotein or only the non-structural proteins of HCV, which were shown to be
sufficient to form the HCV replication complex (Blight et al., 2000; Lohmann et al., 1999).
In fact, p7 and NS2 were also shown to be dispensable for HCV replication (Blight et al.,
2000; Lohmann et al., 1999). Huh7 hepatoma cells stably replicating either the HCV full-
length genomic replicon (FGR) or HCV subgenomic replicon (SGR) represent the first
robust model to study HCV replication. Cell-culture adaptive mutations were subsequently
identified in the viral genome replicating stably in Huh7 clones; these mutations served to
enhance the level of replication (Blight et al., 2000; Lohmann et al., 1999).
Subsequent work identified Huh7-derived cell lines with increased permissiveness to
HCV replication. Treatment of replicon cells with interferon-α “cured” the cells of HCV, but
also resulted in adapted Huh7 clones which support HCV replication at higher level, such as
Huh7.5 (Blight et al., 2002) and Huh7-Lunet (Friebe et al., 2005) cells. In the case of
Huh7.5 cells, this more favourable cellular environment for viral replication was attributed,
at least in part, to a mutation in the cytosolic dsRNA sensor RIG-I, which resulted in a muted
innate anti-viral response (Sumpter et al., 2005).
Inoculation of clinical isolates of HCV in Huh7 cells did not result in productive
infections (Catanese and Dorner, 2015). While replicon models enabled studies on the
molecular virology of HCV replication, the identified replication enhancing mutations in the
HCV genome, which facilitated the high level of replication in Huh7 cells, impaired virion
production (Pietschmann et al., 2009). Therefore, the Con1 isolate-derived HCV replicons
were not a suitable model for propagating HCV in vitro and studying the HCV infectious
cycle. A major breakthrough for studying the complete HCV life cycle was the

12
characterization of a hepatitis C virus isolate from a Japanese fulminant hepatitis (JFH)
patient (Kato et al., 2001). A subgenomic replicon derived from the isolated HCV genotype
2a JFH1 isolate was able to replicate without common replication enhancing mutations (Kato
et al., 2003). Subsequent work characterized the JFH1 strain as the first clinical isolate to
recapitulate the entire HCV life cycle in Huh7 cells (Wakita et al., 2005).
In the absence of cell culture adaptive mutations, the JFH1 strain secreted virus at
low efficiency (102-103 focus forming units per mL). To increase virus fitness and titer
levels, two different strategies have been employed. Firstly, the JFH1 strain has been serially
passaged by several groups to identify titer-enhancing mutations (Zhong et al., 2006). In my
thesis work, we utilized a JFH1 strain with three mutations (JFH-AM1 or JFH-1T) that
confers increased viral production (Russell et al., 2008). The mutations, localized in the E2
and p7 coding regions of the viral genome, were identified using a serial passaging strategy
with the wildtype JFH1 strain. The cell-culture adapted JFH-1T strain produced 3-4 logs
more virus than wildtype JFH1. The second strategy employed to increase viral titer levels is
the creation of chimeras between JFH1 and another genotype 2a strain, such as J6
(Lindenbach et al., 2005). Overall, the revolutionary discovery of the JFH1 strain and its
subsequent derivatives enabled HCV researchers to examine the molecular virology of the
entire HCV life cycle in cell culture.
Aside from the genotype 2a JFH1 strain, there have been limited reports of clinical
isolates from other HCV genotypes producing robust levels of infection in cell culture. This
represented an obstacle in the study of other HCV genotypes. Intergenotypic chimeras
between the JFH1 strain and isolates from other genotypes were capable of productive
infections (Pietschmann et al., 2006). These chimeras combined the core to NS2 coding
region of an isolate from any of the 7 major genotypes with the NS3 to NS5B coding region

13
of JFH1, enabling the construction of viral particles bearing the structural proteins of other
genotypes. The reasons for JFH1 strain’s unique capacity to propagate in vitro remained
obscure, until recent work demonstrated that, in general, the membrane-associated HCV
replication complex is highly sensitive to lipid peroxidation (Yamane et al., 2014). HCV
infection induces significant oxidative stress, and this limits HCV infection by inducing
membrane damage which disrupts the HCV replicase complex. The JFH1 strain displays an
atypical resistance to lipid peroxidation, which severely restricts HCV replication efficiency
of other HCV genotypes in Huh7 cells (Yamane et al., 2014). Subsequent work revealed that
the incorporation of the human host factor SEC14L2 into hepatoma cells enabled pan-
genotypic HCV replication in cell culture (Saeed et al., 2015). SEC14L2 expression
enhanced vitamin E-mediated protection against oxidative stress, and lipid peroxidation;
thereby enabling in vitro replication of any HCV isolate. Collectively, these recent findings
should enable HCV researchers to universally study all genotypes of HCV with the same
rigour that has been applied to the HCV genotype 2a JFH1 strain.
Animal models
The first animal model used for hepatitis C research was chimpanzees. Initial studies
revealed that serum from non-A, non-B hepatitis patients could be utilized to inoculate
chimpanzees and recapitulate the entire viral life cycle (Alter et al., 1978; Tabor et al., 1978).
Similar experiments were later performed using in vitro transcripts of cDNA clones of HCV
genomes to successfully inoculate chimpanzees (Kolykhalov et al., 1997; Yanagi et al.,
1997). However, the use of chimpanzees as an animal model has diminished significantly
due to ethical considerations as well as high costs. Non-primates have also been examined
for HCV permissiveness with limited success (Abe et al., 1993). Tree shrews have been
successfully inoculated with HCV and can develop low-level HCV viremia and chronic

14
hepatitis (Amako et al., 2010). In general, HCV’s narrow host tropism has limited the
development of practical small animal models.
Significant efforts have been undertaken to develop more practical mouse models for
studying HCV virology. In general, two strategies have been undertaken to “humanize”
mice and render them permissive to the entire HCV life cycle. One involves
xenotransplantation of human hepatocytes in mice (Mercer et al., 2001); while the other
relies on transgenic expression of essential human factors for the HCV life cycle
(Vercauteren et al., 2014).
With regards to HCV studies, xenotransplantations of human hepatocytes were first
performed in severe combined immunodeficiency (SCID) mice homozygous for a
plasminogen activator transgene expressed under the control of a liver-specific albumin
promoter (Alb-uPa) to generate chimeric human livers (Mercer et al., 2001). Expression of
Alb-uPa results in hypofibrinogenemia and liver-specific cytotoxicity, and conveys an
environment conducive to repopulation with HCV-permissive human hepatocytes (Mercer et
al., 2001; Sandgren et al., 1991). These immunodeficient mice were successfully infected
with clinical and cell culture-derived HCV isolates, and provided the first practical murine
model for in vivo HCV research (Lindenbach et al., 2006; Mercer et al., 2001). Subsequent
studies have utilized similar xenotransplantation-based strategies to develop a similar HCV
murine model (Bissig et al., 2010), as well as HCV-permissive simianized mice (Scull et al.,
2015). However, the impaired adaptive immunity of these xenograft-based models has
restricted the utility in examining HCV-associated advanced liver disease. This limitation
has been overcome by the utilization of hematopoietic stem cells in a humanized mouse
model (Washburn et al., 2011). This strategy has enabled the development of HCV-

15
permissive mice with reconstituted human immune system that are capable of developing
advanced liver disease (Washburn et al., 2011).
The use of genetic approaches for mice “humanization” enables circumvention of the
technical challenges associated with the xenotransplantation models. Both transient and
stable expression of essential human factors in mice has been shown to allow for
recapitulation of the entire HCV cell cycle in vivo (Dorner et al., 2013). Dorner et al.
demonstrated that adenoviral delivery of essential human entry factors enables HCV entry in
fully immunocompetent mice (Dorner et al., 2011). A follow-up study developed a
transgenic murine model for these human factors using mice with an impaired anti-viral
response (Dorner et al., 2011). The latter model was able to support persistent HCV
infection. The development of these transient and stable genetic approaches has provided
HCV researchers with alternative, more accessible avenues to test HCV vaccine efficacy and
explore other aspects of HCV immunobiology in vivo in practical small animal models.
HCV and hepatic lipid metabolism
Due to the limited size of its genome, HCV, like other obligate parasites, relies heavily on
host pathways to facilitate its pathogenesis. Generally, the virus promotes a lipid-rich
intracellular environment to facilitate its lifecycle (Alvisi et al., 2011). This hepatocellular
lipid accumulation is mediated by the virus through activated expression of lipid anabolic
genes and inhibition of genes associated with lipid catabolism and export (Syed et al., 2010).
These metabolic perturbations manifest clinically as hepatic steatosis, in over 50% of HCV-
infected patients, with HCV genotype 3a infection being linked with severe steatosis
(Rubbia-Brandt et al., 2000). In addition, the virus is known to disrupt insulin signaling and
glucose metabolism, and infection has been linked to an increased prevalence of hepatic
16
insulin resistance and diabetes (Negro, 2011). However, it remains unclear whether insulin
resistance is a direct result of HCV infection or an indirect result of HCV-associated
advanced liver disease (Cusi, 2014). Virtually every step of the HCV life cycle relies on an
aspect of hepatic metabolism (Alvisi et al., 2011). This intimate link with lipid metabolism
seems to be one of the key co-determinants resulting in the narrow tissue tropism of HCV.
Lipid metabolism and HCV entry
HCV entry into a new hepatocyte is mediated by two distinct mechanisms: “cell-free” entry
and “cell-to-cell” transmission. Cell-free entry comprises of blood-borne virus entering
hepatocytes, whereas cell-to-cell transmission occurs more directly between hepatocytes via
tight junctions and is often characterized as being neutralizing antibody (nAb)-resistant
(Brimacombe et al., 2011). Aspects of both HCV entry mechanisms have implicated various
host factors with functional roles in hepatic lipid metabolism.
The HCV virion itself resembles low-density lipoprotein particles, exhibiting
physical association with apolipoproteins and lipids (Bartenschlager et al., 2011). In infected
chimpanzees and humans, circulating viral particles exhibit a heterogenous density (André et
al., 2002; Bradley et al., 1991); however, the lower density HCV particles appear to possess
increased infectivity (Bradley et al., 1991; Lindenbach et al., 2006). While both cell culture-
derived and in vivo produced virions possess an association to the apolipoproteins, ApoC1
and ApoE, patient serum-derived LVPs (André et al., 2002) display enhanced association
with ApoB (Bartenschlager et al., 2011). The viral particles derived from cell culture are
generally of higher density and lack association to ApoB; this is attributed to deficiencies in
the very low-density lipoprotein assembly and lipidation pathways in the HCV permissive,
Huh7-derived human hepatoma cell lines (Meex et al., 2011). Lipidation and apolipoprotein
association of the virion is postulated to aid the virus in the evading antibody-mediated

17
neutralization. Recent work has demonstrated that in vitro siRNA knockdown of ApoE
increased the susceptibility of cell culture-derived virions to nAbs isolated from the serum of
patients with chronic HCV infection (Fauvelle et al., 2016). This was attributed to increased
exposure of envelope protein E2 epitopes to nAbs (Fauvelle et al., 2016).
A subset of the HCV entry coreceptors have known functional association to hepatic
lipid metabolism, including SCARB1 (Calattini et al., 2015; Dao Thi et al., 2012), low-
density lipoprotein receptor (LDLR) (Monazahian et al., 1999), Niemann-Pick C1-like 1
(NPC1L1) (Sainz et al., 2012), and VLDL receptor (VLDLR) (Ujino et al., 2016). SCARB1
is a scavenger receptor that mediates uptake of high-density lipoproteins (HDL) (Shen et al.,
2014). In HCV infection, SCARB1 seems to play multiple roles, including directly
interacting with E2, as well as mediating crucial post-attachment events via its lipid transfer
function (Calattini et al., 2015; Dao Thi et al., 2012). LDLR and VLDLR are lipoprotein
absorption receptors (Go and Mani, 2012), while NPC1L1 is a cholesterol uptake receptor
(Lin et al., 2011). Several studies have implicated LDLR as a co-receptor for HCV entry
(Germi et al., 2002; Monazahian et al., 1999; Prentoe et al., 2014), with a role in mediating
an early stage of entry (Prentoe et al., 2014), possibly cellular attachment of the virus (Germi
et al., 2002). Similarly, NPC1L1 has been implicated in entry at a stage prior to virion-cell
membrane fusion, via a mechanism dependent on the cholesterol content in the virion (Sainz
et al., 2012). Recent work has also proposed a role for VLDLR-mediated endocytosis in
HCV entry (Ujino et al., 2016). The importance of lipoprotein receptors in HCV entry is
further highlighted by the capacity of VLDL and LDL particles to outcompete LVP for entry
into target cells (André et al., 2002; Tao et al., 2015; Westhaus et al., 2013).
In addition to mediating nAb evasion, virion-associated apolipoproteins appear to
facilitate key interactions with entry co-receptors. ApoE enables entry by mediating

18
interactions with LDLR and heparan sulfate (Jiang et al., 2012; Owen et al., 2009).
Similarly, virion-associated ApoB interacts with SCARB1 (Maillard et al., 2006), and
ApoC1 interacts with heparan sulfate proteoglycans (Meunier et al., 2008) and E2 (Dreux et
al., 2007) to facilitate infection. Collectively, these studies illustrate an important role for
lipid absorption receptors and apolipoproteins in cell-free entry.
Cell-to-cell transmission appears to be a key mechanism by which viruses can evade
neutralizing antibodies (Timpe et al., 2008); however, the mechanism by which this occurs
remains poorly understood. ApoE, NPC1L1, and SCARB1 have all been suggested to play
prominent roles in cell-to-cell spread (Barretto et al., 2014; Brimacombe et al., 2011; Gondar
et al., 2015), although it appears that HCV can adapt to lose its dependence on SCARB1 for
cell-to-cell transmission (Catanese et al., 2013), and there are conflicting reports on the
necessity of ApoE (Barretto et al., 2014). Regardless, inhibition of host factors implicated in
both cell-free and cell-to-cell modes of HCV entry, such as ApoE, SCARB1 and NPC1L1,
has the potential of eliciting a dual pronged anti-viral effect.
Lipid metabolism and HCV replication
Similar to other positive-sense RNA viruses, the HCV replication complex occurs in
membranous structures, which serve to increase the local effective concentration of viral and
host factors required for viral replication and protect the viral genome from host defenses
(Miller and Krijnse-Locker, 2008). Specifically, HCV utilizes host endoplasmic reticulum
(ER)-derived membranes, often referred to as a membranous web, to house its replication
complex (Ferraris et al., 2010; Paul et al., 2013). Such remodeling of cellular membranes
requires significant alterations to host metabolism. Consistent with this, transcriptomics
analysis of gene expression in chimpanzees infected with HCV revealed significant
alterations in the levels of host genes involved in lipid metabolism (Su et al., 2002). The
19
gene expression profiling study revealed viral infection down-regulated peroxisome
proliferator activated receptor-α (PPAR-α) expression and activated the expression of genes
associated with the sterol response element binding protein (SREBP) signaling (Su et al.,
2002). Disruption of hepatocellular metabolism during HCV infection is confirmed by
metabolomic profiling studies revealing alterations in cholesterol, fatty acid, sphingolipid,
and phospholipid metabolism (Diamond et al., 2010; Rodgers et al., 2012; Roe et al., 2011).
Several studies have demonstrated that small molecule inhibition of either cholesterol or
fatty acid biosynthesis elicits anti-viral effects against HCV replication in vitro (Kapadia and
Chisari, 2005; Owens et al., 2010; Singaravelu et al., 2015a; Su et al., 2002). Given the
importance of cellular lipids in replication, two independent studies have argued the
prominent role of LDLR in the HCV life cycle is promoting a lipid-rich cellular
environment, via serum uptake of lipids into HCV-infected hepatocytes, to facilitate
replication (Albecka et al., 2012; Syed et al., 2014). Overall, these studies highlight an
important role for hepatic lipid metabolism in HCV replication.
Phosphoinositides (PIs) are a class of phosphatidylglycerides, which play an
important role in coordination cellular dynamics through recruitment of proteins to cellular
membranes (Viaud et al., 2015). PIs represent 10-15% of membrane phospholipids, and the
inositol ring is readily phosphorylated by various PI kinases at the 3, 4, and 5 position to
produce different phosphorylated forms of PI (Viaud et al., 2015). Changes in membranes’
PI signature can have drastic effects on intracellular trafficking and membrane dynamics
(Viaud et al., 2015). The various PIs interact directly with proteins via different domains,
including the pleckstrin homology (PH) domain. Several RNA viruses alter PI signaling in
host cells to facilitate their replication (Delang et al., 2012), including HCV and
picornaviruses. HCV NS5A is a viral protein which, to-date, has no characterized intrinsic

20
enzymatic function and exerts its function through interactions with viral and host factors
(Ross-Thriepland and Harris, 2015). NS5A recruits phosphatidylinositol 4-kinase III α
(PI4KA) to HCV-induced membranous structures and stimulates its activity to increase
phosphoinositide-4-phosphate (PI4P) production (Reiss et al., 2011). This results in an
increase in intracellular PI4P levels at the viral replication complex, which is essential for the
integrity of the HCV membranous web (Reiss et al., 2011) and viral replication (Berger et
al., 2011). There also appears to be a genotype-specific dependence of HCV replication on
PI4KB (Borawski et al., 2009; Hsu et al., 2010; Sherratt et al., 2014). However, the pro-viral
function of this PI4P enrichment remained unclear until a link was established between the
roles of PI4P and cholesterol in HCV replication.
It is well-established that intracellular cholesterol plays a crucial role in HCV
replication, as inhibition of cholesterol synthesis resulted in disruption of the HCV replicase
(Sagan et al., 2006; Su et al., 2002; Ye et al., 2003). Subsequent electron microscopy (EM)
analysis of isolated HCV-induced DMVs, the proposed sites of HCV replication, revealed an
enrichment in cholesterol (Paul et al., 2013). β-methyl cyclodextrin-mediated cholesterol
depletion of HCV infected cells via resulted in smaller DMVs, which correlated with
decreased HCV RNA abundance (Paul et al., 2013). Recent work elucidated the mechanism
by which HCV mediates cholesterol enrichment of its replication complex. The HCV-
induced enrichment of PI4P in viral replication compartments serves to recruit the oxysterol
binding protein (OSBP), via its PH domain, to the viral replication complex (Wang et al.,
2014a). OSBP shuttles cholesterol to HCV-induced membranous structures, in a PI4P-
dependent manner (Wang et al., 2014a). The dependence of HCV replication on cholesterol
biosynthesis also derives from the virus’ reliance on geranylgeranylation of the host factor
FBL2 (Wang et al., 2005). The importance of protein prenylation in HCV replication was

21
first realized when it was demonstrated that inhibition of HCV RNA replication could be
rescued via the addition of geranylgeraniol, a downstream product of cholesterol (Kapadia
and Chisari, 2005; Wang et al., 2005). Geranylgeranylated FBL2 was found to colocalize
with NS5A, and this interaction was crucial for HCV replication (Wang et al., 2005).
However, the function of this protein in HCV replication remains unclear. Overall, HCV
replication’s dependence on cholesterol biosynthesis stems from the replicase’s requirement
for a cholesterol enriched scaffold HCV’s requirement and protein prenylation of a host
factor.
Similarly, HCV replication appears to have a dependence on sphingolipid
biosynthesis. This was first revealed when a chemical screen identified an inhibitor of serine
palmitoyltransferase (SPT), an enzyme catalyzing the first step in sphingolipid biosynthesis,
as a potent inhibitor of HCV genotype 1b replication (Sakamoto et al., 2005). The study also
revealed NS5B possesses a sphingolipid binding motif, which was crucial to the localization
of non-structural proteins to lipid rafts. Subsequent work demonstrated the SPT inhibitor
treatment showed anti-viral effects in vivo, in a humanized mouse model infected with a
HCV genotype 1b isolate (Umehara et al., 2006). However, sphingolipids’ influence on
HCV replication seems to be genotype specific, as replication of the JFH1 replicon
(genotype 2a) was insensitive to SPT inhibition (Weng et al., 2010). Glycosphingolipids
have also recently been implicated in HCV RNA synthesis (Khan et al., 2014). The PI4P-
enriched HCV-induced membranous structures recruit four-adaptor phosphate protein
(FAPP) via its PH domain. FAPP is a PI4P effector protein which shuttles
glycosphingolipids to the HCV replication complex (Khan et al., 2014). This viral
requirement for glycosphingolipids is consistent with the observed upregulation of
lactosylceramide levels during HCV replication (Khan et al., 2014).

22
In addition to cholesterol and sphingolipid metabolites, fatty acids also have the
capacity to influence HCV replication. The effect of fatty acids on HCV is dependent on
their degree of unsaturation. Small molecule inhibition of acetyl CoA carboxylase (Kapadia
and Chisari, 2005; Owens et al., 2010; Singaravelu et al., 2015a), which catalyzes the rate
limiting step of fatty acid biosynthesis, and fatty acid synthase (Kapadia and Chisari, 2005;
Nasheri et al., 2013; Owens et al., 2010; Su et al., 2002), which catalyzes elongation of fatty
acids, results in inhibition of HCV replication. Similarly, our lab has previously
demonstrated that inhibition of stearoyl CoA desaturase (SCD) represses HCV replication
(Lyn et al., 2014). SCD catalyzes desaturation of palmitic acid and stearic acid to
palmitoleic acid and oleic acid, and these monounsaturated fatty acids are critical to the
integrity of HCV replication complexes (Lyn et al., 2014). On the other hand, several studies
have shown that polyunsaturated fatty acids (PUFAs) inhibit HCV replication (Huang et al.,
2007a; Kapadia and Chisari, 2005). The anti-viral activity of PUFAs is linked to their
reactivity with reactive oxygen species (ROS) generated during HCV replication (Huang et
al., 2007a). Lipid peroxidation of PUFAs creates reactive carbonyls which inhibit
replication, and this effect can be reversed through addition of lipid-soluble antioxidants
(Huang et al., 2007a). Collectively, these studies illustrate that the degree of unsaturation
dictates the effect of individual fatty acid species in in HCV replication.
As HCV relies on cellular membranes for replication, it is not surprising that viral
replication is dependent on the cellular availability of lipids that comprise key constituents in
membranes, such as sphingolipids, fatty acids, and sterols. The role of each of these lipid
species to the formation of the replication complex isn’t yet completely understood.
Chapters 2 and 3 aim to characterize miRNAs which regulate hepatic fatty acid and
cholesterol metabolism and evaluate their influence on HCV replication.

23
Lipid droplet accumulation and HCV assembly
Lipid droplets (LDs) are dynamic organelles that act as storage units of neutral lipids,
including cholesterol esters and triglycerides. Most cells, in the presence of excess neutral
lipids, have the capacity to form LDs; however, in humans, adipocytes and hepatocytes, the
major sites of lipogenesis, have basal levels of LDs (Walther and Farese, 2012). It is
becoming apparent that dysregulation of cellular lipid droplet abundance correlates with
disease states (Krahmer et al., 2013). In the context of viral infection, HCV, dengue virus,
rotaviruses, and reoviruses utilize these neutral lipid stores to facilitate some aspect of their
viral life cycles (Herker and Ott, 2012).
HCV utilizes cellular lipid droplets as a platform for viral assembly (Filipe and
McLauchlan, 2015). Two HCV proteins, NS5A and core, are known to localize to LDs
although NS5A is also known to interact with the ER (Barba et al., 1997; Hinson and
Cresswell, 2009; Moradpour et al., 1996). The recruitment of core and NS5A to LDs is
facilitated by diacylglycerol acyltransferase 1 (DGAT1), an enzyme which catalyzes the
synthesis of triglycerides (Camus et al., 2013; Herker et al., 2010). Disrupting the
association of HCV core and NS5A to lipid droplets significantly inhibits virion production
(Boulant et al., 2007; Herker et al., 2010; Hinson and Cresswell, 2009; Menzel et al., 2012).
HCV infection induces hepatocellular accumulation of LDs in the perinuclear region of
infected cells (Miyanari et al., 2007), in close proximity to replication complexes to support
viral genome packaging. This clustering of LDs to the perinuclear region is mediated, in
part, by the association of core protein to LDs, and likely involves displacement of adipocyte
differentiation-related protein (ADRP) off the surface of LDs (Boulant et al., 2008). HCV
also hijacks Rab18 and TIP47 to promote apposition between LD membranes and HCV
replication complexes (Salloum et al., 2013; Vogt et al., 2013). NS5A binds to TIP47 and

24
the active form of the GTPase Rab18, two LD-associating proteins, and these interactions
with NS5A appear to promote physical interactions between HCV replication complexes and
LDs, independent of core (Salloum et al., 2013; Vogt et al., 2013). It is thought that the
enrichment of LDs in HCV-induced membranous structures not only brings the site of
replication in proximity with the site of assembly, but also, may allow HCV replication
complexes to draw on LDs as a source of energy and membrane lipids (Vogt et al., 2013).
Lastly, the importance of LDs to HCV assembly is emphasized by studies illustrating that
drugs which reverse HCV induced LD accumulation, including inhibitors of cholesterol ester
and triglyceride synthesis, elicit potent inhibitory effects on virion production (Liefhebber et
al., 2014; Syed and Siddiqui, 2011).
HCV mediates hepatic LD accumulation via a multitude of mechanisms. The HCV
core protein plays a central role in HCV’s induction of LD aggregation, as expression of core
alone in transgenic mice is sufficient for the development of hepatic steatosis (Moriya et al.,
1997). Core’s steatotic effect appears to stem from inhibition of lipolysis and triglyceride
hydrolysis, which is dependent on the protein’s localization to lipid droplets (Harris et al.,
2011). Recent work elucidated that this is mediated through inhibiting the activity of adipose
triglyceride lipase (ATGL), an enzyme which catalyzes the first step in triglyceride
hydrolysis (Camus et al., 2014). Expression of HCV core from genotype 3a, which is
associated with severe steatosis (Abid et al., 2005), results in the appearance of large lipid
droplets, and this has been linked to the down-regulation of phosphatase and tensin homolog
deleted on chromosome 10 (PTEN) (Clément et al., 2011). HCV infection also alters lipid
homeostasis through modulation of PPAR-α, liver X receptor (LXR), and SREBP signaling,
three pathways which coordinate sterol and fatty acid metabolism (Jeon and Osborne, 2012;
Michalik et al., 2006; Osborne, 2000; Wahli and Michalik, 2012). HCV suppresses the

25
expression of PPAR-α, a transcription factor which regulates genes associated with fatty acid
catabolism (Cheng et al., 2005; Dharancy et al., 2005, De Gottardi, 2006 #265; Wu et al.,
2011). HCV also activates hepatic lipogenesis through increased LXR and SREBP
signaling (Garcia-Mediavilla et al., 2012; Syed et al., 2010). Enhancement of LXR signaling
appears to be mediated by core and NS5A (Garcia-Mediavilla et al., 2012); while HCV
appears to have evolved several mechanisms to activate SREBP signaling.
HCV and SREBP signaling
The SREBP family of transcription factors are master regulators of lipid biosynthesis (Jeon
and Osborne, 2012). There are three isoforms of SREBPs: SREBP1A, SREBP1C, and
SREBP2. SREBP1C is the most highly expressed isoform in the liver, and regulates the
expression of genes associated with fatty acid biosynthesis (Jeon and Osborne, 2012).
SREBP2 regulates the expression of genes associated with cholesterol biosynthesis, while
SREBP1A has the capacity to regulate both SREBP1- and SREBP2-regulated genes (Jeon
and Osborne, 2012). There exists a well-established negative feedback mechanism
regulating SREBP signaling, summarized in Figure 1.3 (Brown and Goldstein, 1999). The
SREBP cleavage activating protein (SCAP) binds newly translated SREBPs at the ER. In a
sterol replete intracellular environment, this SCAP/SREBP complex is transported to the
Golgi, where SREBP is sequentially cleaved by site-1 protease (S1P) and site-2 protease
(S2P) into its mature transcription factor form. In a lipid-rich environment, cholesterol
induces a conformational change in SCAP, which causes binding to INSIGs (Adams et al.,
2004). INSIGs serve to anchor the SREBP/SCAP complex in the ER and prevent maturation
of the transcription factor.
HCV has evolved a multitude of mechanisms for activation of SREBP signaling to

26
Figure 1.3. Summary of negative feedback loop regulating SREBP signaling. (a)-(b) In
low sterol and oxysterol conditions, the sterol regulatory element-binding proteins (SREBP)
and SREBP cleavage activating protein (SREBP–SCAP) complex is transported to the Golgi,
where SREBP is cleaved into its mature transcription factor from by 2 proteases (S1P and
S2P). (c) This mature form translocates to the nucleus, where it regulates genes associated
with lipid metabolism. SRE, sterol regulatory element; TG, triglyceride; FA, fatty acid. (d)
In sterol- and oxysterol-rich conditions, cholesterol binds to SCAP, or certain oxysterols bind
to INSIG, inducing conformational changes that promote binding between SCAP and INSIG,
retaining the SREBP–SCAP complex at the endoplasmic reticulum (ER), preventing SREBP
activation. Figure adapted from Canadian Journal of Microbiology, Singaravelu, Srinivasan
& Pezacki, Armand-Frappier Outstanding Student Award — The emerging role of 25-
hydroxycholesterol in innate immunity (2015), 61(8): 521-530, with permission from
Canadian Science Publishing.

27
promote hepatic lipogenesis (Su et al., 2002). HCV infection appears to activate proteolytic
processing of SREBPs via induction of oxidative stress in a phosphatidylinositol 3-kinase
(PI3K)-Akt pathway dependent manner (Waris et al., 2007). Interestingly, HCV core, NS2,
NS4B, and NS5A can each individually stimulate SREBP maturation or transcription (Oem
et al., 2008; Park et al., 2009; Waris et al., 2007; Xiang et al., 2010). Recently, two novel
mechanisms have been proposed for HCV’s stimulation of SREBP signaling that involve co-
opting components of innate immune pathways (Li et al., 2013a; McRae et al., 2015). HCV
infection activates the NLRP3 inflammasome, which mediates the production of caspases
and pro-inflammatory cytokines for the downstream immune response to infection (Chen and
Ichinohe, 2015). HCV-induced activation of the NLRP3 appears to stimulate SREBP
maturation through caspase 1-mediated degradation of INSIG proteins (McRae et al., 2015).
An independent study demonstrated that HCV hijacks IκB kinase-α (IKK-α), a kinase known
to activate intrinsic innate immunity through regulation of NF-κB signaling, to activate
SREBP-mediated lipogenesis (Li et al., 2013a). The authors demonstrated that a DExD/H
helicase, DDX3X, interacts with the HCV 3’UTR and activates nuclear translocation of
IKK-α (Li et al., 2013a). Within the nucleus, IKK-α phosphorylates and activates
CBP/p300, a known stimulator of SREBP transcriptional activity (Li et al., 2013a). HCV
relies on SREBP signaling for intracellular lipid droplet accumulation as knockdown of
SREBP expression (Li et al., 2013a) or inhibition of SREBP processing enzymes (Olmstead
et al., 2012) resulted in decreased neutral lipid accumulation and impaired viral assembly.
The viral evolution of multiple mechanisms to stimulate the same pathway suggests SREBP
signaling plays a crucial role in the HCV life cycle.

28
VLDL pathway and HCV assembly/secretion
While all the details of HCV assembly aren’t clear, one of the first key steps is the
interaction of NS5A and core at cytosolic lipid droplets (Masaki et al., 2008). This
eventually lead to assembly of a nucleocapsid via recruitment of envelope proteins and
budding in to the ER (Lindenbach and Rice, 2013). As the virion travels through the
secretory pathway, it matures and becomes lipidated through essential interactions with
lipoprotein pathways, which results in HCV virion’s low buoyant density (André et al., 2002;
Gastaminza et al., 2008). It appears that, similar to VLDL synthesis, high density viral
particles are synthesized in the ER, and maturation into low-density viral particles occurs
during migration of the particle through the secretory pathway (Gastaminza et al., 2008).
Inhibition of the microsomal triglyceride transfer protein (MTTP), which transports
triglycerides into ApoB lipoproteins and lumenal LDs (Hooper et al., 2015), impairs viral
secretion (Gastaminza et al., 2008; Huang et al., 2007b) – suggesting MTTP may similarly
play a role in HCV virion lipidation. RNA interference studies revealed that ApoE, and not
ApoB, was critical for viral particle production in cell culture (Jiang and Luo, 2009), and this
was supported by observations that ApoE co-migrated with HCV core in the secretory
pathway – with poor co-localization with ApoB (Coller et al., 2012). However, as these
studies were all performed in cell culture models, it remains to be seen whether ApoB plays
an important role in HCV particle secretion in vivo, in the presence of proper ApoB
lipidation. Overall, these studies demonstrate HCV co-opts the VLDL pathway for assembly
and secretion of its virion.

29
Viruses: broad requirement for lipid microenvironments
This viral requirement for lipids isn’t specific to HCV; there appears to be a broad viral
dependence on lipids to facilitate their life cycles. This is consistent with inhibition of host
lipid metabolism being effective in impairing the pathogenesis of several classes of viruses
(Munger et al., 2008; Petersen et al., 2014). As previously discussed, several positive sense
viruses and poxviruses mediate significant membrane remodelling to facilitate replication
(Miller and Krijnse-Locker, 2008). Similar to HCV, these alterations necessitate diversion of
host metabolic pathways. For example, similar to HCV, several members of the
Picornaviridae family hijack OSBP via PI4 kinases to mediate cholesterol enrichment of
membranous structues housing their replication complexes (Dorobantu et al., 2015; Roulin et
al., 2014). Other viruses require specific lipid microdomains in cellular membranes as well
as the viral envelope to facilitate entry as well as release of progeny virion (Heaton and
Randall, 2011). HCV’s intimate link with lipid metabolism makes the virus an excellent
model for understanding how viruses’ perturb host metabolism to facilitate viral
proliferation. Characterization of novel host factors regulating HCV’s hijacking of hepatic
lipid pathways to facilitate replication could have broad relevance to positive sense RNA
viruses.
Given the broad viral dependence on lipid pathways, it’s not surprising that
significant metabolic reprogramming occurs as part of the broad anti-viral response
(Schoggins and Randall, 2013). One of the most striking examples of this was the discovery
that anti-viral interferon signaling induces the production of 25-hydroxycholesterol, an
oxysterol which represses cholesterol biosynthesis (Blanc et al., 2011). Similarly, the
expression of LDLR related protein 1 (LRP1) and interferon-inducible transmembrane 3

30
(IFITM3) is activated during viral infections, and regulate intracellular cholesterol
homeostasis to mediate their anti-viral effects (Amini-Bavil-Olyaee et al., 2013; Gudleski-
O'Regan et al., 2012). These examples illustrate the human immune response actively re-
orchestrates cellular metabolism to combat viral infection.
HCV and microRNAs
miRNAs have the potential to influence viral pathogenesis through several mechanisms.
Viral genomes can encode for miRNAs, as demonstrated for the herpesvirus family (Cullen,
2011). With regard to HCV, to-date, there has yet to be a study reporting functional virus-
derived miRNAs; however, sequencing analysis of HCV infected cells and HCV replicon
containing cells revealed the presence HCV RNA-derived small RNAs (Parameswaran et al.,
2010). Host miRNAs can influence the viral lifecycle either through the regulation of key
host pathways or through direct interaction with viral genomes (refer to Figure 1.1). In the
case of HCV, human miRNAs have been shown to influence the virus through direct
interactions (Wilson and Sagan, 2014) and through regulation of host pathways critical to the
HCV life cycle and disease progression (Singaravelu et al., 2014b).
HCV and miR-122 paradigm: an unconventional interaction
HCV predominantly infects human hepatocytes, and this tissue tropism is partially
determined by its dependence on a liver abundant miRNA, miR-122. The 5’ end of the HCV
RNA genome participates in unique interactions with miR-122 (Jopling et al., 2008; Jopling
et al., 2005; Machlin et al., 2011), at two 5’UTR binding sites, which are sequentially
conserved across all genotypes. The initial studies demonstrated a dependence of HCV RNA
abundance on this unconventional interaction (Jopling et al., 2005). Subsequent studies have
described pro-viral roles for HCV’s subversion of miR-122 in HCV translation (Henke et al.,

31
2008; Jangra et al., 2010), as well as protecting HCV RNA from endogenous
exoribonucleases (Li et al., 2013b; Sedano and Sarnow, 2014). This has resulted in the
development of a lock-nucleic acid oligonucleotide for miR-122 sequestration-based therapy
against HCV, which proceeded to Phase II in clinical trials (Janssen et al., 2013). HCV
exhibits a dependence on components of the miRNA biogenesis pathway (Randall et al.,
2007; Wilson et al., 2011; Zhang et al., 2012), which is generally attributed to the virus’
reliance on mature miR-122 expression. Interestingly, HCV RNA’s sequestration of miR-
122 has been linked to dysregulation of host transcripts, resulting from allevation of miR-122
regulation of its endogenous targets (Israelow et al., 2014; Luna et al., 2015).
HCV RNA’s direct interaction with other human miRNAs
Aside from miR-122, the remaining reports of miRNAs interacting directly with the HCV
RNA genome describe the traditional repressive mode of miRNA regulation. Interferon
signaling was reported to activate the expression of a subset of miRNAs (miR-196, miR-296,
miR-351, miR-431, and miR-448), which directly interact with the HCV RNA and repressed
HCV replication (Pedersen et al., 2007). Separate studies also elucidated miR-199a-3p and
let-7f as human anti-viral miRNAs with conserved binding sites in HCV genome (Cheng et
al., 2012; Murakami et al., 2009).
Host miRNAs and HCV-associated host pathways
HCV-induced modulation of miRNAs regulating host gene networks either required for viral
proliferation or associated with host anti-viral response have the potential to influence HCV
life cycle and disease progression. Several miRNA profiling studies have demonstrated
dysregulation of the host miRNA expression during HCV infection, both in vitro (Banaudha
et al., 2011; Ishida et al., 2011; Zhang et al., 2013) and in vivo (Bandyopadhyay et al., 2011;
Peng et al., 2009). In general, characterizing the miRNAs which regulate virus-associated

32
host pathways from the miRNA signature of viral infection remains a challenge. Pre-
existing miRNA levels in HCV-infected patients may represent a crucial factor in
determining the host’s susceptibility to chronic infection and accelerated disease progression.
Recent work has elucidated miRNAs as molecular determinants of HCV associated advanced
liver disease (Singaravelu et al., 2014b).
My thesis work sought to identify miRNAs contributing to both HCV’s hijacking of
hepatic lipid metabolism and the development of HCV-associated steatosis. While several
hepatic microRNAs have been identified as regulators of hepatic lipid metabolism (Moore et
al., 2011; Rottiers and Näär, 2012), and linked to the development of fatty liver disease
(Sobolewski et al., 2015), no HCV-modulated miRNAs have been linked to the virus’
alterations of cellular lipid homeostasis or HCV-associated steatosis.
Rationale
As modulation of hepatic lipid synthesis and storage, as well as lipoprotein entry, lipidation,
or secretion can elicit anti-viral effects against HCV, the identification of hepatic miRNAs
which concertedly regulate multiple aspects of hepatic lipid metabolism have the potential to
regulate the HCV life cycle. HCV displays an intimate reliance on hepatic lipid metabolism
to facilitate its viral life cycle, so we hypothesize that a subset of the modulations induced in
the human miRNA milieu during HCV infection result from either the virus’ efforts to co-opt
hepatic lipid pathways to fulfill its lipid and energy requirements or the host response’s
attempts to restore metabolic homeostasis. Such miRNAs may be important molecular
determinants of the development of HCV-associated steatosis. Given the general viral
requirement of lipid pathways and the metabolic reprogramming that occurs as part of the
33
broad anti-viral response, miRNAs regulating HCV’s hijacking of hepatic lipid metabolism
have the potential to influence other viruses.
Statement of Objectives
The goal of my thesis work was to identify novel miRNA-mRNA regulatory modules with
functional roles in hepatic lipid metabolism (Chapters 2-4). Furthermore, in Chapters 2
and 3, we specifically sought to characterize miRNAs, with regulatory roles in hepatic lipid
metabolism, which influence the HCV life cycle and the immunometabolic response to viral
infection.

34
Chapter 2 – Hepatitis C virus induced up-
regulation of microRNA-27: a novel
mechanism for hepatic steatosis.

35
Preface
This chapter consists of data previously published in the Hepatology article (59 (1): 98-109,
2014) entitled “Hepatitis C virus induced up-regulation of microRNA-27: a novel
mechanism for hepatic steatosis” (PMID: 23897856). It is reproduced in this thesis with
permission from the publisher – refer to Rights and Permissions. The article was authored
by R. Singaravelu, R. Chen, R.K. Lyn, D.M. Jones, S. O’Hara, Y. Rouleau, J. Cheng, P.
Srinivasan, N. Nasheri, R.S. Russell, D.L. Tyrrell, and J.P. Pezacki. The individual
contributions of each author are detailed below:
I performed the majority of all cell culture and sample preparation, qRT-PCR
experiments, and dual luciferase assays. J.P. Pezacki and I conceived all research ideas and
formulated the experimental plan. I wrote the first draft of the manuscript. Manuscript
editing was performed by all authors. R. Chen prepared mice samples for miRNA
expression analysis and performed immunofluorescence of mice liver cross-sections. P.
Srinivasan provided technical assistance with luciferase assays. S. O’Hara, N. Nasheri, and
Y. Rouleau provided technical assistance with qRT-PCR experiments, cholesterol assays,
and Western blot analysis. J. Cheng cloned 3’UTR luciferase constructs used in this study.
R.K. Lyn performed CARS microscopy imaging and analysis. D.M. Jones prepared virus
infected samples for miRNA expression analysis. R.S. Russell and D.L. Tyrrell are the
principal investigators for the collaborating labs.

36
Abstract
MicroRNAs (miRNAs) are small RNAs that post-transcriptionally regulate gene expression.
Their aberrant expression is commonly linked with disease states, including hepatitis C virus
(HCV) infection. Herein, we demonstrate that HCV replication induces the expression of
miR-27 in cell culture and in vivo HCV infectious models. Overexpression of the HCV
proteins core and NS4B independently activates miR-27 expression. Furthermore, we
establish that miR-27 overexpression in hepatocytes results in larger and more abundant lipid
droplets, as observed by coherent anti-Stokes Raman scattering (CARS) microscopy. This
hepatic lipid droplet accumulation coincides with miR-27b’s repression of peroxisome
proliferator-activated receptor (PPAR)-α and angiopoietin-like protein 3 (ANGPTL3),
known regulators of triglyceride homeostasis. We further demonstrate that treatment with a
PPAR-α agonist, bezafibrate, is able to reverse the miR-27b induced lipid accumulation in
Huh7 cells. This miR-27b-mediated repression of PPAR-α signaling represents a novel
mechanism of HCV-induced hepatic steatosis. This link was further demonstrated in vivo
through the correlation between miR-27b expression levels and hepatic lipid accumulation in
HCV-infected SCID-beige/Alb-uPa mice. Conclusion: Collectively, our results highlight
HCV’s up-regulation of miR-27 expression as a novel mechanism contributing to the
development of hepatic steatosis.
37
Introduction
Hepatitis C virus (HCV) is a positive sense RNA virus from the Flaviviridae family
(Moradpour et al., 2007) that currently infects approx. 2.35% of the global population
(Lavanchy, 2011). HCV encodes three structural proteins (core, E1, and E2) and seven non-
structural proteins (p7, NS2, NS3, NS4A, NS4B, NS5A, and NS5B), and relies on host
pathways to facilitate its lifecycle (Lindenbach and Rice, 2005). HCV-associated host
factors include both coding and non-coding genes, such as microRNAs (miRNAs), which are
small RNAs, ~20-25 nucleotides in length, which post-transcriptionally regulate virtually
every cellular pathway (Bartel, 2009). Unlike silencing RNAs that target individual genes,
miRNAs can regulate many targets thereby exerting greater regulatory control. Several
viruses modulate the host miRNAs for their pathogenesis (Sarnow et al., 2006). HCV
displays interactions with components of the RNA silencing pathway (Hoffmann et al., 2012;
Randall et al., 2007; Wilson et al., 2011), and direct interactions with a liver abundant
miRNA, miR-122 (Machlin et al., 2011; Sarnow et al., 2006). Hepatic miRNAs can
influence HCV either through direct interactions with the viral genome or regulation of
HCV-associated host pathways (Hoffmann et al., 2012).
MicroRNA-27 (miR-27) represents a liver abundant miRNA (Barad et al., 2004),
whose role in HCV pathogenesis is poorly understood. miR-27 regulates lipid metabolism in
adipocytes and macrophages, and is implicated in atherosclerosis (Chen et al., 2012).
Furthermore, miR-27 is deregulated in liver metabolic disorders (Alisi et al., 2011; Her et al.,
2011; Vickers et al., 2013), suggesting it plays a role in hepatic lipid metabolism, a critical
host pathway hijacked by HCV to facilitate its lifecycle and pathogenesis. (Herker and Ott,
2011; Pezacki et al., 2010) HCV-induced modulations of lipid metabolism include the

38
induction of increased cellular triglyceride and cholesterol storage to facilitate viral
replication (Herker and Ott, 2011; Kapadia and Chisari, 2005; Pezacki et al., 2010).
Furthermore, both cholesterol (Sainz et al., 2012) and lipoprotein (Germi et al., 2002;
Scarselli et al., 2002) receptors have been implicated as HCV entry factors. Viral particle
assembly and secretion also utilize components of the very-low density lipoprotein (VLDL)
pathway (Huang et al., 2007b). Given this intimate link between HCV and hepatic
metabolism, we have examined the role of miR-27 in HCV pathogenesis and, herein,
establish its role in HCV-induced hepatic steatosis.
Materials and methods
Reagents
The pFK-I389luc/NS3-3′/5.1 plasmid containing the HCV subgenomic replicon (genotype
1b isolate Con1, Genbank Accession # AJ242654) and the NS5B active site mutant replicon
were kind gifts from Dr. Ralf Bartenschlager (Institute of Hygiene, University of Heidelberg,
Heidelberg, Germany). The Huh7.5 cell line stably expressing the full-length HCV genotype
1b replicon with a S2204I adaptive mutation in NS5A (Huh7.5-FGR) was a kind gift from
Dr. Charles M. Rice (Rockefeller University, New York, USA) and Apath LLC (St. Louis,
MO, USA).
CARS microscopy Imaging
Imaged cells were washed twice with PBS, followed by a 15 min incubation at room
temperature with fixing solution (4% formaldehyde, 4% sucrose, 1 mL). The fixed cells were
washed twice with PBS for 3 min and then stored at 4 °C in PBS prior to imaging. The
imaging and subsequent quantitative voxel analysis of TG content was performed as

39
previously described (Lyn et al., 2009; Pezacki et al., 2011). Lipid droplet (LD)
sizing/counting was performed using ImageJ.
Immunofluorescence and Oil Red O Staining
Liver frozen sections (at 4um thickness) were fixed in 4% freshly made paraformaldehyde
for 30 min, followed by 5 min PBS rinse to remove excess paraformaldehyde. Fixed slides
were then permeabilized in PBS containing 0.5% Triton X-100 for 10 min and blocked in
PBS with 10% normal goat serum for 1 hour. 1/100 diluted primary rabbit monoclonal
antibody specifically recognizing human Cytokeratin 18 (CK-18) (Abcam, Cambridge, MA)
was applied to the liver sections and incubated at 4°C overnight. The next day, liver sections
were incubated in secondary antibody cocktail, including Alexa Fluor 488-conjugated goat
anti-rabbit and DAPI, for 1 hour at dark. After 3 washes of PBS, slides were immersed in Oil
Red O working solution (freshly prepared in 30% triethyl-phosphate) (Sagan et al., 2006),
for 30 min dark, followed by 3 rinses with distilled water. Finally, slides were rinsed dark for
10 min, air dried, mounted with prolong gold mounting medium (Invitrogen) and coverslips.
Samples were examined under Leica TCS SP5 confocal microscope. Oil Red O staining of
lipids was visualized at far-red wavelength: 633 (ex) and 647 (em). Images were processed
using LAS AF Lite software.
Results
HCV infection induces miR-27 expression
Two isoforms of miR-27, miR-27a and 27b, are encoded by separate gene loci and differ by
one nucleotide. (Figures 2.1a and S2.1). We examined whether HCV modulates the
expression of either miR-27 isoform. Huh7.5 cells were transfected with subgenomic

40
Figure 2.1. HCV expression activates miR-27 expression in vitro. (a) Diagram depicting
sequences of miR-27 isoforms "a" and "b." The one nucleotide difference in sequences
(highlighted in red and blue) is conserved across species (Figure S2.1). (b) Schematic shows
the HCV replicon construct used in this study. (c) Huh7.5 cells were transfected with either
the wildtype (SGR) or NS5B mutant (SGR ΔNS5B) HCV subgenomic replicon. RNA was
isolated, and the relative levels of miR-27 isoform expression were measured by qRT-PCR.
Relative expression of miR-27a and miR-27b compared to mock transfection is shown (n =
3). (d)-(e) Huh7.5 cells were infected with JFH-1T and RNA was isolated 72 hours post-
infection. qRT-PCR was used to measure relative levels of miR-27a and miR-27b expression
compared to mock infection (n = 3). (f) Activity of luciferase reporters fused to 3’-UTR
bearing two miR-27b binding sites (mutant or wildtype) in Huh7 cells transfected with
individual HCV proteins or CFP (control) (n = 3). Error bars in C-F represent the standard
error of the mean. (*P < 0.05)

41
replicon (HCV-SGR) from the Con1 isolate (genotype 1b; Figure 2.1b). Relative miR-27
expression was analyzed by quantitative reverse-transcription polymerase chain reaction
(qRT-PCR). HCV-SGR induced a 2-fold up-regulation of miR-27a expression and 5-fold up-
regulation in miR-27b expression (Figure 2.1c). Transfection of replication-deficient HCV-
SGR ΔNS5B maintained a 2-fold up-regulation of miR-27a (Figure 2.1c); however, miR-27b
levels did not increase (Figure 2.1c). These observations indicate that viral replication is
required for miR-27b up-regulation but HCV translation is sufficient to activate miR-27a
expression.
Next we examined miR-27 expression during HCV infection. We performed qRT-
PCR analysis on Huh7.5 cells infected with JFH-1T, a cell-culture adapted high-titer strain of
JFH-1 (genotype 2a) (Russell et al., 2008). Up-regulation of both miR-27a (2.6-fold; Figure
2.1d) and miR-27b levels (1.2-fold; Figure 2.1e) was observed. These results confirm that
HCV infection induces miR-27 expression, and this induction is conserved across HCV
genotypes.
To probe the molecular mechanism by which HCV regulates miR-27, we used a miR-
27 sensor plasmid containing a dual-luciferase reporter bearing two fully complementary
miR-27b binding sites in the 3′-untranslated region (UTR) of the Renilla luciferase gene.
Since miR-27a and miR-27b differ by only one nucleotide, both isoforms regulate luciferase
activity. Huh7 cells were cotransfected with HCV proteins and the miR-27 sensor plasmid.
HCV core and NS4B expression independently induced a decrease in luciferase signal
relative to the controls (Figure 2.1f). This down-regulation was reversed upon mutation of
the miR-27 binding sites, demonstrating miR-27-specific activity. qRT-PCR confirmed that
both core and NS4B overexpression resulted in increased miR-27a/b levels (Figure S2.2).

42
miR-27b expression can be activated in a PI3K pathway-dependent manner (Jin et al.,
2013). Since both NS4B and core have previously been shown to activate SREBP by way of
the PI3K/Akt pathway (Jackel-Cram et al., 2010; Park et al., 2009), we hypothesized that
these proteins may regulate miR-27b expression similarly. Huh7 cells were cotransfected
with NS4B and core and miR-27 sensor plasmid and then treated with a PI3K inhibitor,
LY294002. The results showed LY294002 impaired HCV proteins' ability to induce miR-27-
mediated gene silencing (Figure S2.3), suggesting that HCV activates miR-27 expression in
a PI3K-dependent fashion.
miR-27 regulates hepatic lipid homeostasis
We next examined whether miR-27 plays a regulatory role for lipid metabolism in Huh7
cells by transfecting with control or miR-27 mimics and inhibitors and measuring the effects.
The activity of miR-27b mimics and inhibitors was confirmed using the sensor plasmid
(Figure S2.4). We used coherent anti-Stokes Raman scattering (CARS) microscopy, a
modern multiphoton imaging method, to image miR-27's influence on hepatic lipid content
in a highly effective manner (Pezacki et al., 2011). CARS has been used extensively for
label-free imaging and quantification of hepatic lipid content in biological systems, thereby
avoiding perturbations and artifacts that can be introduced by added dyes and staining
protocols (Lyn et al., 2009; Pezacki et al., 2011). Transfection of miR-27a and miR-27b
mimics in Huh7 cells induced an increase in both the size and abundance of LDs (Figure
2.2a-c). The average LD diameter increased from 540 ± 10 nm to 600 ± 10 nm (n > 1,900
LDs; P < 0.01) during miR-27b overexpression. Similar results were observed in Huh7.5
cells (Figure S2.5). To exclude the possibility that miR-27 mimics resulted in cytotoxicity,
we performed 3-[4,5-dimethylthiazol-2-yl]-2,5-diphenyl-tetrazolium bromide (MTT) assays
on miR-27 mimic- transfected Huh7 cells, and no significant changes in cell viability were

43
Figure 2.2. miR-27 regulates hepatic lipid homeostasis. Huh7 cells were transfected with
20 nM miR-27a, miR-27b, or control mimics and inhibitors. Cells were fixed 48 hours post-
transfection. (a) Representative CARS images of mimic transfected cells are shown. Scale
bars = 10 μm. The results of voxel analysis are shown in (b)-(c) as percentage cellular lipid
volume. Voxel analysis is representative of n ≥ 75 cells from two biological replicates. Error
bars represent the standard error of the mean.

44
observed (Figure S2.6a).
Peroxisome proliferator-activated receptor (PPAR)-α agonism reverses miR-27-
induced lipid accumulation
Next we sought to identify the relevant endogenous targets of miR-27 that might induce lipid
accumulation. We examined messenger RNA (mRNA) levels using qRT-PCR to confirm
that they are miR-27 targets. Huh7 cells were transfected with miR-27b or control mimics,
and qRT-PCR revealed an inverse correlation between miR-27b activity and the mRNA
levels of PPAR-α and angiopoietin-like protein 3 (ANGPTL3) (Figure S2.7a), consistent
with previous reports (Kida et al., 2011; Vickers et al., 2013). Both of these genes have
conserved miR-27 binding sites (Figure S2.7b), and have known links to triglyceride
homeostasis (Kida et al., 2011).
PPAR-α is a key nuclear receptor that transcriptionally activates genes associated
with fatty acid oxidation (Schoonjans et al., 1996). Consistent with previous findings linking
PPAR-α inhibition with steatosis, small molecule-based antagonism of PPAR-α signaling in
Huh7 cells can induce triglyceride (TG) accumulation (Figure S2.8) (Lyn et al., 2009). If
miR-27's induction of hepatic lipid storage relied on inhibition of PPAR-α signaling and the
resulting triglyceride accumulation, activating the PPAR-α pathway should reverse the
effect. Treatment with a small molecule PPAR-α agonist, bezafibrate (Lyn et al., 2009), was
sufficient to reverse miR-27-induced lipid accumulation to levels observed in control cells,
confirming this hypothesis (Figure 2.3). Overall, these observations suggest that miR-27
overexpression induces triglyceride accumulation through repression of PPAR-α expression.
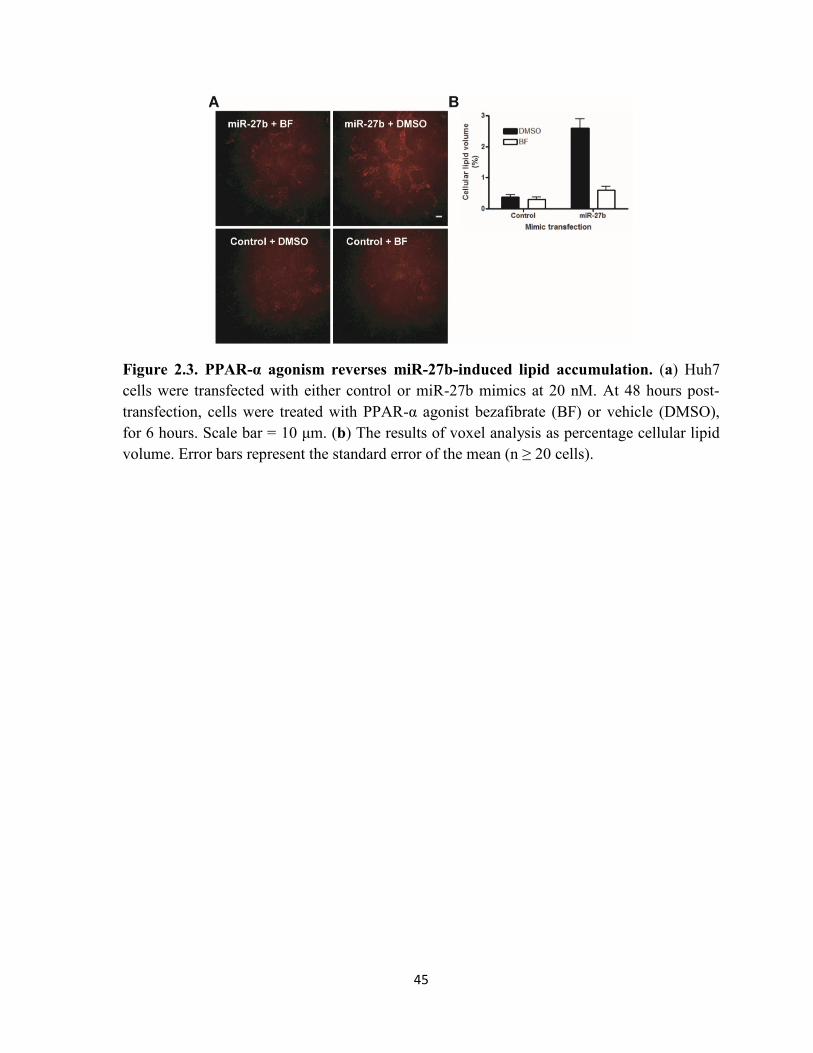
45
Figure 2.3. PPAR-α agonism reverses miR-27b-induced lipid accumulation. (a) Huh7
cells were transfected with either control or miR-27b mimics at 20 nM. At 48 hours post-
transfection, cells were treated with PPAR-α agonist bezafibrate (BF) or vehicle (DMSO),
for 6 hours. Scale bar = 10 μm. (b) The results of voxel analysis as percentage cellular lipid
volume. Error bars represent the standard error of the mean (n ≥ 20 cells).

46
miR-27 regulates the HCV lifecycle
Our previous work showed that PPAR-α antagonism is effective at inhibiting HCV
replication (Lyn et al., 2009). To examine if miR-27 has a similar effect, we overexpressed
miR-27b in Huh7.5 cells stably expressing the HCV full length replicon (Figure 2.4a).
Interestingly, ectopic miR-27b expression resulted in a 3-fold down-regulation of HCV RNA
(Figure 2.4b). A similar down-regulation was observed in HCV NS3 and NS5A proteins by
western blot (Figure 2.4c). No cytotoxicity was observed during miR-27b overexpression
(Figure S2.6b). Triglyceride assays revealed that miR-27 overexpression also induced an
accumulation of cellular triglyceride in the Huh7.5-FGR cells (Figure 2.4d), consistent with
our observations in Huh7 cells (Figure 2.2). This down-regulation in HCV expression
correlated with decreased mRNA levels of PPAR-α and ANGPTL3 (Figure 4e). Our results
confirm that miR-27 overexpression inhibits HCV replication.
Interestingly, we also observed down-regulation of retinoid X receptor alpha (RXR-
α), a previously reported target of miR-27 (Figure S2.9a-b) (Ji et al., 2009). This protein
interacts with several nuclear receptors, including PPAR-α, to regulate liver lipid
biosynthesis. Therefore, we examined the functional relevance of miR-27-mediated
repression of RXR-α expression on HCV replication and lipid metabolism. We performed
CARS imaging on Huh7 cells treated with an RXR-α antagonist, UVI-3003, which inhibits
the RXR-α's interactions with all other nuclear receptors (Nahoum et al., 2007). Huh7 cells
treated with this drug displayed no change in hepatic lipid content (Figure S2.9c).
Additionally, RXR-α antagonism in Huh7.5-FGR cells produced no changes in HCV levels.
We were also interested in how miR-27's regulation of PPAR-α signaling would
affect viral infectivity. Previous work suggested that increased PPAR-α expression blocks
assembly of HCV infectious particles (Goldwasser et al., 2011). Huh7.5 cells were
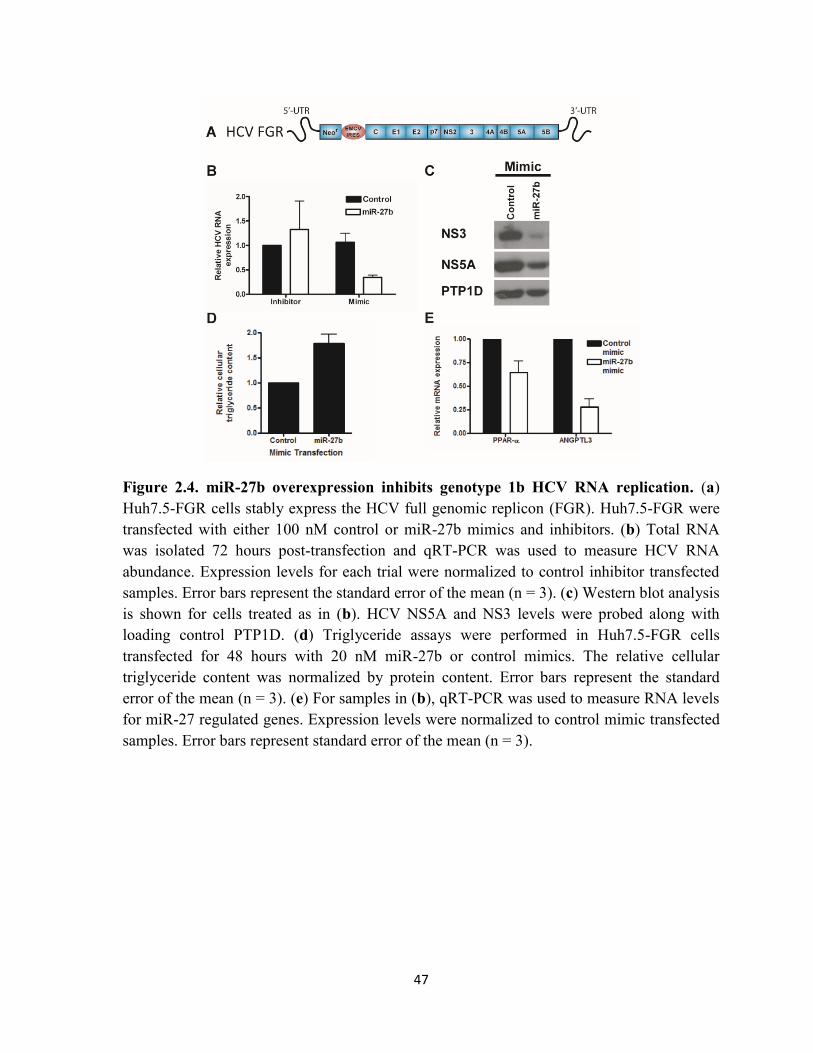
47
Figure 2.4. miR-27b overexpression inhibits genotype 1b HCV RNA replication. (a)
Huh7.5-FGR cells stably express the HCV full genomic replicon (FGR). Huh7.5-FGR were
transfected with either 100 nM control or miR-27b mimics and inhibitors. (b) Total RNA
was isolated 72 hours post-transfection and qRT-PCR was used to measure HCV RNA
abundance. Expression levels for each trial were normalized to control inhibitor transfected
samples. Error bars represent the standard error of the mean (n = 3). (c) Western blot analysis
is shown for cells treated as in (b). HCV NS5A and NS3 levels were probed along with
loading control PTP1D. (d) Triglyceride assays were performed in Huh7.5-FGR cells
transfected for 48 hours with 20 nM miR-27b or control mimics. The relative cellular
triglyceride content was normalized by protein content. Error bars represent the standard
error of the mean (n = 3). (e) For samples in (b), qRT-PCR was used to measure RNA levels
for miR-27 regulated genes. Expression levels were normalized to control mimic transfected
samples. Error bars represent standard error of the mean (n = 3).

48
cotransfected with JFH-1T RNA and miR-27b mimics and inhibitors, and intracellular HCV
RNA levels were measured by qRT-PCR. Neither the miR-27 mimic nor the miR-27
inhibitor had any effect on JFH-1T replication (Figure S2.10), suggesting that miR-27b
overexpression has a genotype-specific effect on HCV replication. On the other hand, miR-
27b inhibition resulted in a very modest decrease in secretion of infectious HCV, while miR-
27b overexpression had no effect on secreted virus' infectivity, consistent with PPAR-α's
previously reported anti-viral role in HCV secretion (Goldwasser et al., 2011). Independent
of miR-27's effects on the viral lifecycle, its conserved induction across HCV genotypes
manifests globally as a contributor to hepatic steatosis and thus to HCV-associated liver
disease.
HCV infection in vivo activates miR-27 expression
We continued our evaluation of miR-27 expression in a small animal model of acute HCV
infection, using the humanized SCID-beige/Alb-uPa mouse model (Mercer et al., 2001). We
infected the chimeric mice with genotype 1a and 2b clinical isolates of HCV (Figure S2.11).
qRT-PCR analysis of miR-27b levels revealed a 2.9-fold up-regulation in miR-27b levels 7
weeks post-infection (Figure 2.5a). This increase was conserved across both HCV genotypes
examined. There was also a 2.0-fold increase in miR-27a levels (Figure 2.5b). Oil Red O
staining of lipids in the chimeric liver's human hepatocytes revealed a correlation between
cellular lipid levels and miR-27 expression in mice (Figure 2.5c), and provides further
support for our CARS microscopy results in cell culture experiments. Collectively, our in
vivo data confirm that HCV infection induces expression of miR-27, and is consistent with
miR-27's role as a key molecular determinant of hepatic steatosis.

49
Figure 2.5. HCV infection enhances miR-27 expression in vivo. SCID-beige/Alb-uPa
mice were infected with clinical isolates of HCV genotypes 1a (●) and 2a (▲). Total RNA
was isolated from mice 0 days, 21 days, and 7 weeks post infection, and qRT-PCR was used
to measure the relative expression of miR-27b (a) and miR-27a (b). Expression levels for
each trial were normalized to the average for mock-infected mice. Results are displayed in a
vertical scatter plot with the average expression denoted by a horizontal line. (c) Oil Red O
staining of lipid content in mice liver cross sections are shown (red). Human cytoskeletal
keratin 18 (CK-18) immunostaining was used as marker of human hepatocytes (green).
Nuclear DNA was stained with DAPI (blue). Images were acquired with a confocal
microscope. Scale bars represent 10 μm. Representative images are shown from three mice.
For each mice, at least three ROIs were analyzed.

50
Discussion
Endogenous miRNAs post-transcriptionally regulate virtually every cellular process (Bartel,
2009), so it is not surprising that viruses modulate the host miRNA milieu in different ways
to facilitate pathogenesis (Sarnow et al., 2006). Herein, we have shown that a liver-abundant
miRNA, miR-27, is robustly induced by HCV in both in vitro and in vivo models (Figures
2.1 and 2.5), and this modulation is conserved across at least two genotypes (Figures 2.1, 2.2,
and 2.5). HCV-induced expression of miR-27b requires replication of the virus while viral
translation is sufficient to activate miR-27a expression (Figure 2.1c-d), suggesting these
isoforms are modulated by HCV through different mechanisms.
In order to understand HCV's induction of miR-27, we studied its effects on
hepatocytes. Overexpression of either isoform of miR-27 causes an accumulation of hepatic
lipid content in the presence or absence of HCV (Figures 2.2 and 2.5). The correlation
between miR-27 expression and cellular lipid content was also observed in HCV-infected
SCID-beige/Alb-uPa mice (Figure 2.5c). This represents, to the best of our knowledge, the
first report visualizing HCV-induced hepatic lipid accumulation in SCID-beige/Alb-uPa
mice, highlighting the model's utility for studying HCV-associated steatosis. Together, these
data demonstrate that the up-regulation of miR-27 by HCV contributes to increased lipid
accumulation and larger LDs.
Accumulation of hepatic LDs correlates with increased expression of miR-27 whose
predicted target genes are associated with lipid metabolism (PPAR-α and ANGPTL3)
(Figure S2.4a). Targetscan predicts that PPAR-α mRNA possesses two miR-27 binding sites
in its 3′-UTR, the region generally targeted by microRNAs (Figure S2.7). Previous work
suggested that miR-27b regulates PPAR-α largely at the translational level (Kida et al.,

51
2011). Our results suggest a direct interaction between miR-27b and PPAR-α mRNA;
however, Kida et al. were not able to confirm a functional interaction in their predicted miR-
27 binding sites of PPAR-α (Kida et al., 2011). Our observation of decreased PPAR-α
mRNA during miR-27b overexpression strongly suggests a miR-27-induced effect at the
mRNA level as well, and may reflect differences in cells, in transfection efficiency, and in
potency of mimics. ANGPTL3 harbors a poorly conserved miR-27 binding site in the 3′-
UTR and a highly conserved open reading frame (ORF) site predicted to be functional, as it
is preceded by rare codons (Figure S2.7) (Vickers et al., 2013). These rare codons can cause
ribosomal pausing and allow stable interactions between miR-27 and the binding site (Gu et
al., 2009). Our results suggest that miR-27b regulates ANGPTL3 at the RNA level,
consistent with previous results (Vickers et al., 2013).
PPAR-α heterodimerizes with RXR-α to transcriptionally activate genes associated
with fatty acid β-oxidation (Schoonjans et al., 1996). Our data shows that HCV inhibits the
PPAR-α pathway through enhancement of miR-27-mediated repression of PPAR-α
expression that also leads to TG accumulation. PPAR-α expression is known to be
dysregulated during HCV infection (Wu et al., 2011). PPAR-α antagonism leads to hepatic
lipid accumulation (Lyn et al., 2009). miR-27's induction of lipid accumulation was also
reversed by the PPAR-α agonist bezafibrate (Figure 2.3). Therefore, HCV-induced
expression of miR-27 represents a novel mechanism by which the virus inhibits PPAR-α
signaling and promotes steatosis (Figure 2.6).
Overexpression of individual viral proteins revealed that both core and NS4B
independently activate miR-27a and miR-27b expression (Figures 2.1f and S2.2). Both of
these viral proteins have previously been reported to promote lipogenesis (Nasheri et al.,
2013). In the case of HCV core, its expression has previously been shown to down-regulate

52
Figure 2.6. Proposed model by which HCV-induced miR-27 overexpression promotes
steatosis. HCV infection induces miR-27 overexpression, which results in down-regulation
of miR-27 mRNA targets: ANGPTL3 and PPAR-α. PPAR-α transcriptionally activate genes
associated with fatty acid β-oxidation. Antagonism of PPAR-α signalling results in
increased cellular triglyceride content. As well, decreased ANGPTL3 levels would result in
increased activity of LPL in vivo, a key enzyme in fatty acid uptake from lipoproteins. This
mechanism could also account for further accumulation of triglycerides in vivo.

53
PPAR-α expression (Dharancy et al., 2005). Separate studies demonstrated that HCV
core (Jackel-Cram et al., 2010) and NS4B (Park et al., 2009) promote SREBP activity
through the PI3K pathway. Our results suggest that the viral proteins also use the PI3K
pathway for activation of miR-27 expression to induce steatosis (Figure S2.3). Furthermore,
these results are consistent with a model of steatosis where HCV core modulates PPAR-α
expression through up-regulation of miR-27 expression.
The observed repression of ANGPTL3 (Figure S2.4a) may be another mechanism by
which HCV-induced miR-27 expression promotes triglyceride accumulation in vivo. A
previous study suggested that miR-27b inhibits ANGPTL3 expression in response to
dyslipidemia to prevent lipid accumulation in circulation (Vickers et al., 2013). This is due
to its role as an inhibitor of lipoprotein lipase (LPL), a key enzyme in free fatty acid uptake
(Mattijssen and Kersten, 2012). Decreased ANGPTL3 levels would lead to increased LPL
activity and fatty acid uptake into hepatocytes, highlighting an additional mechanism
contributing to miR-27's role in HCV-induced steatosis in patients.
Our results also suggest that miR-27 levels can influence the HCV viral lifecycle. At
the level of replication, miR-27b appears to play an anti-viral role against HCV genotype 1b
replication (Figure 2.4). As miR-27 is not predicted to have conserved binding sites in the
HCV genome (Hsu et al., 2007), inhibition of HCV replication is most likely dependent on
miR-27's regulation of host gene expression. HCV genotype 2a appears less susceptible to
miR-27-mediated inhibition (Figure S2.10), consistent with previous observations of
sequence-dependent variation in HCV resistance against metabolic inhibitors (Nishimura et
al., 2009). Our previous work demonstrated that PPAR-α antagonism is capable of inhibiting
genotype 1b HCV replication by inducing hepatic lipid accumulation and blocking the
biosynthesis of new lipids required for protein lipidation (Lyn et al., 2009). This disrupts the

54
HCV-induced cellular lipid environment required for efficient HCV replication (Lyn et al.,
2009). Here we propose an analogous model where miR-27 acts like an endogenous PPAR-
α antagonist, resulting in disruption of HCV replication complexes (Figure 2.6). An
additional anti-viral mechanism in vivo for miR-27 may lie in its regulation of ANGPTL3.
Due to LPL's proposed inhibitory role against HCV entry (Shimizu et al., 2010), miR-27
may have an additional anti-viral effect at the level of entry by decreasing the level of
ANGPTL3-mediated inhibition of LPL.
While this article was under review, a study was published reporting activation of
miR-27a expression by HCV (Shirasaki et al., 2013). Shirasaki et al. focused their study on
miR-27a and showed that it similarly regulates lipid metabolism genes, including PPAR-α,
and also observed a correlation between miR-27a expression and severity of steatosis in
patients, consistent with our findings (Shirasaki et al., 2013). The authors also elegantly
demonstrate that ABCA1 is a target of miR-27a, influencing both the viral lifecycle and lipid
metabolism. Both studies observed modest influences of miR-27 on viral infectivity (less
than one log changes). Moreover, while both studies observed a similar correlation between
cellular lipid content and miR-27a expression, Shirasaki et al. suggest miR-27a
overexpression results in decreased LD formation, contrary to our observations (Figure
2.2d). This apparent discrepancy may be attributed to Shirasaki et al. examining the effect of
miR-27a expression in Huh7.5 cells either expressing HCV or supplemented with oleic acid
where the cell's metabolic state is shifted (Shirasaki et al., 2013). Our data across different
cell lines and in HCV infected SCID-beige/Alb-uPa mice using different high-resolution
imaging techniques clearly show that miR-27a and miR-27b up-regulate hepatic LD
biogenesis and contribute to hepatic steatosis.

55
It is interesting to consider the multiple mechanisms evolved by the virus to
manipulate host lipid homeostasis. These independent mechanisms likely arose out of
necessity for the virus to use different cellular components during its lifecycle, such as
modified endoplasmic reticulum (ER) membranes, LDs, and the VLDL pathway (Herker and
Ott, 2011; Pezacki et al., 2010). In some cases, these effects appear contradictory, but likely
arose from competing evolutionary pressures. The overall degree of synergy between these
independent mechanisms may be instrumental, at the clinical level, to determining patient
susceptibility to HCV-induced steatosis. Future work should examine whether miR-27 is a
predictive biomarker of steatosis in vivo, as this would be in line with previous studies
reporting a correlation between lower PPAR-α levels and HCV-associated steatosis (Yasui et
al., 2009).
In summary, we have shown that HCV activates miR-27 expression, and this is
conserved across genotypes. Expression of both isoforms of miR-27, miR-27a and miR-27b,
are activated by HCV infection, and these miRNAs can independently induce lipid droplet
biogenesis and accumulation. Our data suggest that HCV-induced miR-27 expression, and
the resultant down-regulation of PPAR-α and ANGPTL3, represent a novel mechanism by
which the virus induces steatosis.
Acknowledgments
R.S. thanks the NSERC for funding in the form of a Vanier Scholarship. R.S., N.N.,
and R.C. thank the NCRTP-HepC for additional training and support. P.S. thanks NSERC
for an Undergraduate Student Research Award. R.K.L. thanks OGS for a graduate

56
scholarship. We thank Dr. A. Stolow and Dr. A. Ridsdale for their assistance and useful
discussion regarding CARS microscopy.

57
Chapter 3 – MicroRNAs regulate the
immunometabolic response to viral
infection in the liver

58
Preface
This chapter consists of data previously published in the Nature Chemical Biology (11, 988–
993, 2015) article entitled “MicroRNAs regulate the immunometabolic response in the liver”
(PMID: 26479438). It is reproduced in this thesis with permission from the publisher – refer
to Rights and Permissions. The article was authored by R. Singaravelu, S. O’Hara, D.M.
Jones, R. Chen, N.G. Taylor, P. Srinivasan, C. Quan, D.G. Roy, R.H. Steenbergen, A.
Kumar, R.K. Lyn, D. Özcelik, Y. Rouleau, M.A. Nguyen, K.J. Rayner, T.C. Hobman, D.L.
Tyrrell, R.S. Russell, J.P. Pezacki. The individual contributions of each author are detailed
below:
I performed miRNA microarray hybridizations, scanning, and analysis, mRNA
microarray analysis, as well as the majority of all RNA isolations, qRT-PCR experiments,
cell culture and sample preparation, and dual luciferase assays. J.P. Pezacki and I conceived
the ideas and formulated the experimental plan. I wrote the first draft of the manuscript.
Manuscript editing was performed by all authors. R. Chen prepared mice samples for
miRNA expression, fatty acid, and lipid analysis, and also performed immunofluorescence of
mice liver cross-sections. P. Srinivasan, S. O’Hara, D. Özcelik, and Y. Rouleau provided
technical assistance with triglyceride assays, qRT-PCR, and Western blot analysis. R.K. Lyn
and I performed EM and CARS imaging and analysis. R.H. Steenbergen, D.G. Roy, and A.
Kumar prepared viral stocks. A. Kumar and I performed plaque assays. D.M. Jones
prepared JFH-1T infected samples for miRNA and mRNA expression analysis. M.A.
Nguyen prepared macrophage samples for mRNA expression analysis. T.C. Hobman, R.S.
Russell, D.L. Tyrrell, and K.J. Rayner were the principal investigators for the collaborating
labs.

59
Abstract
Immune regulation of cellular metabolism can be responsible for successful responses to
invading pathogens. Viruses alter their hosts' cellular metabolism to facilitate infection.
Conversely, the innate anti-viral responses of mammalian cells target these metabolic
pathways to restrict viral propagation. We identified miR-130b and miR-185 as hepatic
microRNAs (miRNAs) whose expression is stimulated by 25-hydroxycholesterol (25-HC),
an anti-viral oxysterol secreted by interferon-stimulated macrophages and dendritic cells,
during hepatitis C virus (HCV) infection. However, 25-HC only directly stimulated miR-185
expression, whereas HCV regulated miR-130b expression. Independently, miR-130b and
miR-185 inhibited HCV infection. In particular, miR-185 significantly restricted host
metabolic pathways crucial to the HCV life cycle. Interestingly, HCV infection decreased
miR-185 and miR-130b levels to promote lipid accumulation and counteract 25-HC's anti-
viral effect. Furthermore, miR-185 can inhibit other viruses through the regulation of
immunometabolic pathways. These data establish these microRNAs as a key link between
innate defenses and metabolism in the liver.

60
Introduction
Viruses alter host cellular metabolism in order to meet the material and energy demands of
their life cycles. Several viruses induce specific lipid microenvironments to facilitate
different stages of their life cycles, including entry (Teissier and Pécheur, 2007), replication
(Chukkapalli et al., 2012; Miller and Krijnse-Locker, 2008) and assembly (Saka and
Valdivia, 2012). Metabolic pathways subverted by viruses for their propagation represent
strategic targets for host innate defenses against viral infection, yet only few examples of
such regulatory links have been reported (Schoggins and Randall, 2013).
Recent work has shown that cholesterol-25-hydroxylase (CH25H) shows interferon
(IFN)-stimulated expression and catalyzes the synthesis of a broadly anti-viral lipid effector,
25-hydroxycholesterol (25-HC) (Blanc et al., 2013; Liu et al., 2013; Pezacki et al., 2009).
Both macrophages and dendritic cells secrete 25-HC in response to IFN stimulation (Park
and Scott, 2010). 25-HC's anti-viral activity against several classes of viruses has been
linked to inhibition of virus cell-membrane fusion (Blanc et al., 2013). However, 25-HC has
membrane-independent effects due to its enantioselective anti-viral activity through
alterations of cellular signaling pathways (Blanc et al., 2013; Liu et al., 2013).
MicroRNAs (miRNAs) have emerged as critical post-transcriptional regulators of
gene expression (Carthew and Sontheimer, 2009), acting by binding to the 3′ UTRs of
mammalian mRNAs to induce translational repression and/or mRNA destabilization.
Through this mechanism, miRNAs are predicted to regulate over 60% of transcripts
(Friedman et al., 2009) and to influence diverse processes, including metabolism (Rottiers
and Näär, 2012). Herein we identified a 25-HC–induced miRNA, miR-185, that regulates the
anti-viral metabolic response to HCV infection in the liver. We demonstrated that miR-185 is

61
an important regulator of the HCV life cycle through its effects on cellular lipid
microenvironments crucial to the virus. HCV counteracted 25-HC's anti-viral effects through
inhibition of miR-185 and miR-130b expression. These findings highlight the importance of
miRNAs in controlling the metabolic state of an infected cell as well as the
immunometabolic response to viral infection in the liver.
Results
Identifying miRNAs relevant to immunometabolism
25-HC broadly inhibits viruses (Blanc et al., 2013; Liu et al., 2013) including the positive
sense RNA viruses, hepatitis C virus (HCV; Figure S3.1) and dengue virus (DENV) (Figure
S3.2). In HCV-infected patients, both CH25H expression in the liver and 25-HC levels in the
serum are elevated (Wu et al., 2010). Therefore, secretion of 25-HC by liver-resident
macrophages and dendritic cells is likely to play an important role in the hepatic innate anti-
viral response to HCV infection. 25-HC acts intracellularly as an inhibitor of sterol response
element–binding protein (SREBP) processing (Adams et al., 2004; Radhakrishnan et al.,
2007) and agonist of liver X receptor (LXR)-α signaling (Goldstein et al., 2006; Janowski et
al., 1996), two pathways that regulate hepatic metabolism and the HCV life cycle (Pezacki et
al., 2009; Su et al., 2002; Zeng et al., 2012). Conversely, 19-HC, an oxysterol that is unable
to inhibit the SREBP pathway (Radhakrishnan et al., 2007), did not mediate any anti-viral
effect against HCV (Figure 3.1a). This demonstrated that 25-HC's inhibition of HCV is
linked to modulations in metabolic gene-regulatory networks.
We employed an miRNA profiling strategy termed small molecule–mediated
annotation of miRNA targets (SMART) to identify miRNAs stimulated by 25-HC that

62
Figure 3.1. 25-HC and HCV oppositely regulate miRNA expression. (a) Quantitative
real-time PCR (qRT-PCR) of relative intracellular HCV RNA levels in Huh7.5-FGR cells
treated with 5 μM 19-hydroxycholesterol (19-HC), 25-HC or vehicle (methanol) for 72 h (n
= 3). Chemical structures of 19-HC and 25-HC are shown at right. (b) Overview of SMART
methodology applied to identifying miRNAs regulating HCV's hijacking of lipid
metabolism. Summary of results is presented in Venn diagram. (c) Heat map depicting
expression fold changes in eight miRNAs from microarray experiments that were
differentially expressed by more than 1.5-fold during both JFH-1T HCV infection and 5 μM
25-HC treatment (P < 0.05). Values were normalized to average of mock-infected or vehicle
(methanol)-treated cells, respectively. (d,e) qRT-PCR analysis of the relative miR-185 and
miR-130b expression of Huh7.5-FGR (d) and Huh7.5 cells (e) cultured in serum-free
medium and treated with 25-HC or vehicle for 72 h (n = 3). Data represent mean values ±
s.e.m. Unpaired two-tailed t-test was used to evaluate statistical significance. (*P ≤ 0.05)

63
mediate immunometabolic changes in gene expression (refer to Materials and Methods,
Figures 3.1b and S3.3). Huh7.5 hepatoma cells were infected with a high-titer HCV strain
(JFH-1T; genotype 2a) (Russell et al., 2008) to determine the differential expression of host
miRNAs relevant to HCV. Profiling revealed 185 differentially expressed miRNAs (Figure
3.1b; Table S3.1; P < 0.05). In parallel, we conducted miRNA profiling on JFH-1T–infected
cells exposed to 5 μM 25-HC (EC90), which resulted in differential expression of 29
miRNAs (Table S3.2; P < 0.05). This 25-HC concentration, in the low micromolar range, is
similar to the levels secreted by IFN-stimulated macrophages (Pezacki et al., 2009).
Pathway analysis of the 25-HC–regulated miRNAs confirmed an enrichment for miRNAs
regulating lipid metabolism pathways (Table S3.3) (Vlachos et al., 2012). The overlap of
differentially expressed miRNAs during both HCV infection and 25-HC treatment produced
eight miRNA candidates (Figure 3.1c). Inhibition of miR-130b and miR-185 in cells
expressing the HCV full-length genomic replicon (FGR; genotype 1b) stimulated HCV
replication (Figure S3.4a). Conversely, inhibition of the other 25-HC–modulated miRNAs
produced no significant effect on HCV RNA abundance (Figure S3.4b), consistent with these
miRNAs' low level of expression. Of the 25-HC–modulated miRNAs, only three were
previously detected in complex with Argonaute in Huh7.5 cells—miR-130b, miR-185, and
let-7f (Luna et al., 2015)—consistent with our findings that the other miRNAs are not
expressed at physiologically relevant levels. Furthermore, miR-185 and miR-130 have
previously reported associations with hepatocellular carcinoma (Qadir et al., 2014) and
steatosis (Xiao et al., 2014), respectively, two sequelae associated with HCV. Therefore, for
subsequent analyses, we focused on the roles of miR-130b and miR-185.
The effects of JFH-1T infection in Huh7.5 cells on miR-130b and miR-185
expression were validated by quantitative PCR (qPCR; Figure S3.5). 25-HC's stimulatory

64
effect on the expression of both miRNAs was reproduced in Huh7.5-FGR cells (Figure 3.1d).
We also observed miR-185 activation in 25-HC–treated naive Huh7.5 cells; however, 25-HC
treatment did not stimulate miR-130b expression in naive Huh7.5 cells, suggesting that 25-
HC's activation of miR-130b expression in HCV-infected cells is an indirect consequence of
25-HC's inhibition of HCV infection (Figure 3.1e). Collectively, these data demonstrated that
25-HC and HCV regulate the expression of miR-185 in opposite fashions.
We next examined the influence of miR-185 and miR-130b on HCV. Overexpression
of miR-130b or miR-185, via a synthetic mimic, in Huh7.5 cells infected with JFH-1T
resulted in a >75% decrease in intracellular HCV RNA levels (Figure 3.2a). Parallel
inhibition of viral RNA levels was observed in cells infected with JFH-1 virion produced in
human serum–supplemented culture (JFH-HS), which possess more physiological
characteristics (Steenbergen et al., 2013) (Figure 3.6a). We observed similar anti-viral effects
in Huh7.5-FGR cells at both the viral RNA and the protein levels (Figure 3.2b-c).
Conversely, miR-185 inhibition resulted in an ~1.5-fold increase in HCV RNA levels in
Huh7.5 cells infected with JFH-HS (Figure 3.6b). Interestingly, inhibition of both miR-130b
and miR-185 in Huh7.5-FGR cells produced a synergistic proviral effect (Figure S3.4a),
suggesting these miRNAs regulate HCV through different mechanisms. Together, these
results demonstrated that miR-185 and miR-130b are anti-viral miRNAs and that their
activity is conserved across two HCV genotypes. Furthermore, this confirmed that HCV-
induced downregulation of miR-185 and miR-130b promotes viral pathogenesis.

65
Figure 3.2. 25-HC–stimulated miRNAs inhibit HCV life cycle. (a)-(b) qRT-PCR analysis
of relative intracellular HCV RNA levels in JFH-1T-infected Huh7.5 cells (a) or Huh7.5-
FGR cells (b) transfected with control mimic, miR-185 mimic or miR-130b mimic. Values
shown are normalized relative to control mimic–transfected cells (n = 3 for each group). Data
represent mean values ± s.e.m. Unpaired two-tailed t-test was used to evaluate statistical
significance. (*P < 0.05) (c) Western blot analysis of relative HCV protein levels (NS5A) in
Huh7.5-FGR cells transfected with control, miR-185 or miR-130b mimics. Image is
representative of three independent experiments. PTP1D serves as a loading control. For the
trial shown, relative HCV NS5A protein levels normalized to control were quantified using
ImageJ.

66
miR-185 and miR-130b regulate hepatic lipid metabolism
HCV relies intimately on lipid pathways to facilitate viral entry, replication, assembly
and secretion (Alvisi et al., 2011; Pezacki et al., 2010). The virus stimulates SREBP and
LXR signaling to perturb hepatic lipid homeostasis (Garcia-Mediavilla et al., 2012; Waris et
al., 2007). Because 25-HC modulates these same pathways, we hypothesized that the 25-
HC–regulated miRNAs, miR-130b and miR-185, were influencing the HCV life cycle
through regulation of cellular lipid microenvironments. Coherent anti-Stokes Raman
scattering (CARS) microscopy was used to analyze the influence of the miRNAs on cellular
lipid content (Pezacki et al., 2011). Inhibition of endogenous miR-130b and miR-185
resulted in increased abundance of hepatocellular lipid droplets (Figure 3.3a). As well,
overexpression of miR-185 decreased cellular triglyceride levels (Figure 3.3b). This
suggested that HCV-induced downregulation of miR-130b and miR-185 expression is a
novel contributing mechanism to HCV-induced steatosis. Collectively, these results were
consistent with inhibitory roles for miR-185 in cholesterol biosynthesis (Wang et al., 2013;
Yang et al., 2014) and for the miR-130 family in hepatic fatty acid synthesis (Xiao et al.,
2014) and adipocyte lipid storage (Pan et al., 2014).
25-HC–induced miRNAs regulate HCV life cycle
Next, we sought to identify the targets of miR-130b and miR-185 that were contributing to
the miRNAs' anti-viral effect. Neither miR-130b nor miR-185 have conserved binding sites
in the HCV RNA genome (Hsu et al., 2007), and thus their effects must occur through the
regulation of human transcripts. Over 2,000 different mRNA targets are predicted to possess
binding sites for each miRNA, according to the TargetScan prediction tool (Friedman et al.,
2009). We conducted stringent filtering of predicted targets for those having an association
with metabolic pathways. We then examined the expression levels of these genes in Huh7.5-

67
Figure 3.3. 25-HC–stimulated miRNAs regulate hepatic lipid metabolism. (a)
Representative CARS microscopy images of intracellular lipid droplets (LDs) in control
inhibitor, Huh7.5 cells transfected with control inhibitor (n = 18 cells), miR-130b inhibitor (n
= 32 cells) or miR-185 inhibitor (n = 32 cells). Scale bar, 10 μm. Quantitative analysis of
relative cellular LD content is shown in bar graph (right). Values were normalized relative to
the average LD content in mock-transfected cells. (b) Relative cellular triglyceride (TG)
content in control and miR-185 mimic transfected Huh7.5 cells assessed by TG assays. (c)
Relative mRNA expression level of miR-185 and miR-130b targets in control, miR-130b and
miR-185 mimic transfected Huh7.5-FGR cells (n ≥ 3). (d) Western blot analysis of miR-185
target protein expression in Huh7.5-FGR cells transfected with control or miR-185 mimic.
Both precursor (P) and mature (M) forms of SREBP2 are shown. Band corresponding to the
processed form of LDLR is shown. Image is representative of three independent
experiments. β-tubulin served as a loading control. Relative miRNA target protein levels to
control were quantified using ImageJ. Data represent mean values ± s.e.m. Unpaired two-
tailed t-test was used to evaluate statistical significance. (*P ≤ 0.05.)

68
FGR cells. miR-185 overexpression resulted in decreased mRNA expression of predicted
target genes whose products have roles in fatty acid and triglyceride biosynthesis (AGPAT3),
lipid uptake (SCARB1, LDLR), cholesterol biosynthesis (SREBP2) and fatty acid
desaturation (FADS1, SCD1) (Figure 3.3c). miR-185 overexpression also repressed the
expression of the lipogenic transcription factors PPARγ and SREBP1. Parallel decreases at
the protein level were also observed (Figures 3.3d), and similar decreases in target mRNA
levels were observed in miR-185 mimic–transfected Huh7.5 cells infected with JFH-HS and
JFH-1T (Figure S3.7a-b). miR-130b overexpression independently repressed the expression
of LDLR, FADS1 and PPARγ (Figures 3.3c and S3.7c). Furthermore, cells transfected with
50 nM of miR-130b mimic and 50 nM of miR-185 mimic exhibited a repressive effect on
LDLR expression that was comparable to that of 100 nM of each miRNA mimic
independently (Figure S3.7d). This suggested that 25-HC's induction of miR-130b and miR-
185 expression in cells replicating HCV RNA cooperates to inhibit LDLR expression.
Collectively, these results demonstrated that 25-HC–induced miRNAs significantly regulate
hepatic lipid metabolism.
Validation of predicted targets of the miRNAs was also performed using luciferase
reporter assays. miR-185 repressed the 3′ UTR activity of AGPAT3, LDLR, SCD1 and
SREBP2. This inhibition was alleviated through mutation of the predicted miR-185 binding
sites (Figures S3.8a–d and S3.9a–d), confirming the direct interaction of miR-185 with the 3′
UTR of these genes. SCARB1 was also previously validated as being directly regulated by
miR-185 (Wang et al., 2013). Similarly, miR-130b was also found to directly regulate
LDLR (Figures S3.8e and S3.9e) and was previously validated as a direct regulator of
PPARγ (Pan et al., 2014).

69
We also investigated the influence of miR-130b and miR-185 on each other's
expression. miR-130b overexpression yielded an increase in miR-185 levels, whereas miR-
185 overexpression had no significant influence on miR-130b abundance (Figure S3.10).
This suggests that activation of miR-185 expression contributes to miR-130b's inhibitory
effects against HCV (Figure 3.2) and PPARγ, LDLR, and FADS1 expression (Figures 3.3c
and S3.7c).
Several of the direct targets of miR-185 are known to encode proteins critical for
different stages of HCV infection, including SCD1 (replication) (Lyn et al., 2014), SCARB1
(entry and cell-to-cell transmission) (Catanese et al., 2013; Régeard et al., 2008), SREBP2
(replication and assembly) (Li et al., 2013a; Pezacki et al., 2009) and LDLR (entry and
replication) (Monazahian et al., 1999; Syed et al., 2014). The roles of the products of other
predicted targets (AGPAT3 and FADS1) in the context of HCV infection are unknown.
AGPAT3 is a key enzyme catalyzing intermediate steps in the synthesis of triglycerides from
glycerol-3-phosphate (G3P) (Takeuchi and Reue, 2009). Silencing of AGPAT3 in Huh7.5-
FGR resulted in reduced HCV protein levels (Figures S3.11a). Also, the expression levels of
AGPAT3 and LPIN1, another key enzyme in the G3P pathway, were increased in HCV-
infected SCID/Alb-uPa mice with humanized livers (Figure S3.11b-c). This suggests that
HCV activates the G3P pathway for increased triglyceride biosynthesis. Collectively, our
results suggest miR-185’s inhibition of HCV occurs through direct targeting of genes
involved in lipid metabolism.
To gain a more comprehensive understanding of miR-185’s effects on hepatic
metabolism, we performed gene expression profiling in Huh7.5s cells transfected with miR-
185 mimics. In order to classify biological processes regulated by miR-185, we performed
gene ontology analysis on genes repressed by more than 1.5-fold. The list of statistically

70
significant changes in mRNA transcripts showed overrepresentation for genes involved in
cholesterol, acylglycerol, and triglyceride biosynthetic and metabolic processes (Table S3.4).
In addition, O-acyltransferase activity was the top molecular function overrepresented in the
miR-185 repressed genes (Figure S3.12, Table S3.5). These data further validated the
SMART approach as a facile means to identifying miRNAs regulating virus-associated host
cellular pathways. Overall, the gene expression profiling data further confirmed the major
role of miR-185 in the regulation of hepatic lipid homeostasis and the immunometabolic
response to infection.
HCV infection in vivo represses miR-185 expression
We investigated HCV-mediated suppression of the expression of these miRNAs during acute
HCV infection of mice with chimeric human livers (Figure 3.4a; Figure S3.13a). We infected
SCID/Alb-uPa mice with hepatic xenografts (Mercer et al., 2001) with HCV clinical isolates
and analyzed hepatic miR-185 and miR-130b expression. Over 50% reduction of miR-185
expression was observed in vivo 21 d after infection, and this repression was maintained for
up to 7 weeks after infection (P < 0.05), consistent with our observations in vitro. Similar
results were seen for miR-130b (Figure S3.13b). Oil Red O staining of lipids in mouse liver
cross-section revealed an increase in cellular lipid content 7 weeks after HCV infection
(Figure 3.4b), consistent with previous work (Singaravelu et al., 2014a). Fatty acid and lipid
analysis of HCV-infected mouse livers revealed increases in palmitoleic acid and cholesterol
ester levels relative to uninfected mice (Figure S3.13c-d), consistent with HCV's alleviation
of miR-185’s repressive effect on unsaturated fatty acid and cholesterol biosynthesis. These
results demonstrate that HCV-mediated repression of miR-185 expression correlates with
altered hepatic lipid metabolism in vivo.

71
Figure 3.4. HCV infection in vivo disrupts hepatic lipid metabolism. (a) qRT-PCR
analysis of relative miR-185 expression levels in SCID/Alb-uPA mice livers 7 weeks post-
infection with clinical isolates of HCV genotype 1a (n ≥ 5). Values shown are normalized
relative to average expression in mock infected mice. Data represent mean values ± s.e.m.
Unpaired two-tailed t-test was used to evaluate statistical significance. *P ≤ 0.05. (b) Oil Red
O staining of lipid content in mock- and HCV-infected SCID/Alb-uPa mice liver cross-
sections are shown (red). Human cytoskeletal keratin 18 (CK-18) immunostaining marks
human hepatocytes (green), while DAPI staining was used to mark nuclear DNA (blue).
Images were acquired with a confocal microscope. Scale bars, 10 μm.

72
miR-185 regulates virus-induced lipid microenvironments
Similarly to that of other positive-sense RNA viruses, HCV replication complex formation
occurs on specialized membranes. The integrity of the HCV-induced membranous web
(MW) is dependent on cholesterol (Paul et al., 2013; Sagan et al., 2006) and unsaturated fatty
acids (Lyn et al., 2014). Because miR-185 repressed the biosynthesis of both lipid species
through inhibition of SREBP2 and SCD1 expression, we performed electron microscopy
(EM) imaging of Huh7.5-FGR cells transfected with miR-185 mimic to determine the
miRNA's influence on the MW structure (Figure S3.5a). Ectopic miR-185 expression
inhibited HCV MW formation, as exemplified by decreased double membrane vesicles
(DMVs), which are the proposed scaffold for HCV replication complexes (Paul et al., 2013);
this was consistent with the effects of small-molecule inhibition of SCD1 (Lyn et al., 2014).
Supplementation of miR-185 transfected Huh7.5-FGR cells with a lipid mixture of fatty
acids and cholesterol completely abolished miR-185’s anti-viral effect against HCV, without
rescuing miR-185 target gene expression (Figure 3.5b). Conversely, oleic acid alone was
insufficient to completely rescue miR-185’s anti-viral activity (Figure S3.14a). The rescue
of HCV levels through addition of lipids was consistent with miR-185’s anti-viral effects
occurring indirectly through post-transcriptional regulation of metabolic pathways. Our
ultrastructural analysis confirmed that miR-185 disrupts lipid microenvironments crucial to
the formation of the HCV replication complex.
miR-130b's anti-viral effects were not rescued by lipid supplementation (Figure
S3.14b), suggesting the miRNA may mediate its anti-viral effect through the regulation of
other metabolic pathways not related to lipid homeostasis. In fact, we observed increased
IFN-β expression in HCV-infected cells transfected with miR-130b mimic (Figure S3.14c),
suggesting that the miRNA has a role in the innate immune response, consistent with the

73
Figure 3.5. miR-185 inhibits HCV replication through regulation of lipid
microenvironments. (a) Representative electron microscopy (EM) micrographs images of
100 nM control mimic– or miR-185 mimic–transfected Huh7.5-FGR cells (n = 2). (b)
Relative HCV RNA and miR-185 target mRNA levels in Huh7.5-FGR cells transfected with
100 nM control (Con miR) or miR-185 mimics in the presence or absence of lipid mixture
(LM) (n = 3). Abundance values for each gene were normalized to the values for their
respective control mimic. (c) Western blot analysis of miR-185 target protein expression in
Huh7.5 cells transfected with control or miR-185 mimic 72 h post-transfection (left) or
treated with 5 μM 25-HC or vehicle (methanol) for 24 h. Mature form of SREBP2 and band
corresponding to the processed form of LDLR are shown. β-tubulin serves as a loading
control. Image is representative of three independent experiments. Relative miRNA target
protein levels compared to control were quantified using ImageJ. (d) qRT-PCR analysis of
relative intracellular VSV and SCD1 RNA levels in VSV-infected HepG2 cells transfected
with 50 nM control and miR-185 mimic (n = 3). Data represent mean values ± s.e.m.
Unpaired two-tailed t-test was used to evaluate statistical significance. *P < 0.05.

74
previously reported role of miR-130a in IFN signaling (Li et al., 2014). However, we cannot
exclude the possibility that miR-130b's regulation of lipid metabolism has an effect on other
stages of the HCV life cycle, such as assembly, a stage known to be dependent on hepatocyte
lipid status (Alvisi et al., 2011; Pezacki et al., 2010).
Several viruses share a dependence on unsaturated fatty acids (Lee and Ahlquist,
2003) and cholesterol (Chukkapalli et al., 2012) for their propagation. Because 25-HC–
induced miR-185 expression results in repression of these metabolic pathways, it is likely
that these miRNAs play a role in macrophage- and dendritic cell–mediated anti-viral
immunity (Blanc et al., 2013; Liu et al., 2013; Pezacki et al., 2009). In fact, the inhibitory
activity of miR-185 on the target genes SCD1, SCARB1 and SREBP2 was comparable in
magnitude to that of 25-HC, indicating that activation of miR-185 expression bolsters 25-
HC's anti-viral effects (Figure 3.5c). We also observed inhibitory effects of miR-185 against
infections by DENV (Figure S15a), and vesicular stomatitis virus (VSV), a negative-sense
RNA virus from the family Rhabdoviridae (Figures 3.5d and S3.15b). This suggested that
miR-185’s regulation of host metabolism contributes to the broad anti-viral response in the
liver (Figure S3.16).
Interestingly, we observed a similar miR-185 regulatory network in THP-1
macrophages (Figure S3.17a). However, miR-185 appeared to have negligible effects on
macrophage lipid content (Figure S3.17b), in contrast to its effects on hepatocytes. Since
similar gene regulation is observed in both cell types, miR-185 was affecting related
pathways in both cell types. Thus, miR-185 likely influences viruses' ability to hijack
metabolic pathways in THP-1 cells and mediate 25-HC's autocrine anti-viral effects in
macrophages (Blanc et al., 2013; Liu et al., 2013).

75
Discussion
25-HC is secreted by macrophages and dendritic cells in response to activation of the
IFN signaling pathway (Park and Scott, 2010). Although several studies have illustrated 25-
HC's broad anti-viral effects against several classes of viruses (Blanc et al., 2013; Civra et
al., 2014; Liu et al., 2013), its mechanism of action in the context of immunometabolic
responses to infection is not well understood. Recent work has demonstrated that the
oxysterol possesses membrane-independent anti-viral properties (Blanc et al., 2013; Pezacki
et al., 2009). Interferon signaling has previously been shown to activate the expression of
multiple miRNAs, which repress HCV infection through direct targeting of the viral genome
(Pedersen et al., 2007). Our work here demonstrates a similar mechanism being activated by
25-HC. However, as opposed to directly targeting HCV RNA, 25-HC activates the
expression of miRNAs that repress host pathways critical to viral infection and thereby
produces an anti-viral effect.
25-HC–induced miRNAs represent a newly characterized arm of the innate immune
response. 25-HC–activated miR-185 expression serves to repress cellular lipid uptake, lipid
biosynthesis and fatty acid desaturation. Given the general viral requirements for these
metabolic pathways (Chukkapalli et al., 2012; Lee and Ahlquist, 2003), 25-HC–induced
miRNAs promote a broadly anti-viral lipid microenvironment. HCV relies intimately on
altered lipid pathways to facilitate viral entry, replication, assembly and secretion (Alvisi et
al., 2011). The hepatotropic virus promotes hepatocellular lipid accumulation, which
manifests clinically as hepatic steatosis, a sequela found in over 50% of HCV-infected
patients (Bassendine et al., 2012). Our work highlighted downregulation of miR-185 and
miR-130b levels as a novel mechanism of HCV-induced lipid accumulation that also serves
76
to reverse the immunometabolic response to infection by the innate immune system.
Furthermore, viral suppression of 25-HC–induced miRNAs should promote the expression of
host factors critical to the HCV life cycle (SREBP2, SCD1, LDLR, AGPAT3 and SCARB1).
HCV-induced downregulation of miR-185 expression represents a novel mechanism of
innate immune evasion as the virus attempts to counteract the antiviral effects of the
interferon-regulated oxysterol.
Overall, our work demonstrated that 25-HC activates the expression of the anti-viral
microRNA miR-185, which act as a metabolic rheostat within infected hepatocytes. Through
its effects on cellular lipid pathways, miR-185 reinforces 25-HC's anti-viral activity, which
also involves regulation of the sterol pathway and direct effects on membranes (Blanc et al.,
2013; Pezacki et al., 2009). This was evidenced by the miR-185 alone having significant
effects on metabolism and membrane microenvironments. As CH25H expression is
increased in the liver of HCV-infected patients (Wu et al., 2010), 25-HC–induced miRNAs
must play an important role in hepatic innate immunity. Conversely, the downregulation of
these miRNAs during HCV infection indicates that the virus actively counteracts this host
defense. Thus, both miR-130b and miR-185 are anti-viral hepatocellular factors that regulate
immunometabolism in the infected liver.
Materials and methods
Materials
The Huh7, Huh7.5, and Huh7.5 cell line stably expressing the full length HCV genotype 1b
replicon with a S2204I adaptive mutation in NS5A (Huh7.5-FGR) were a kind gift from
C.M. Rice (Rockefeller University) and Apath (Blight et al., 2000). All siRNAs transfections

77
were performed with siGENOME SMARTpool siRNAs (Dharmacon), or a negative control
siRNA (Ambion, Austin, TX). All mirVana miRNA mimics and inhibitors, including control
mimics and inhibitors, were purchased from Ambion. pFK-DVs plasmid containing DENV-2
16681 strain (Fischl and Bartenschlager, 2013) was a kind gift from R. Bartenschlager
(University of Heidelberg). 25-Hydroxycholesterol (≥98%) and 19-hydroxycholesterol
(≥98%) were purchased from Cayman Chemical Company. HepG2 and Hek293 cell lines
were purchased from ATCC.
Cell culture and transfections
Adherent Huh7.5 and Huh7 cells were cultured in Dulbecco's Modified Eagle Medium
(DMEM; Life Technologies) supplemented with 100 nM nonessential amino acids (NEAA;
Gibco), 50 U/mL penicillin, 50 mg/mL streptomycin, and 10% fetal bovine serum (FBS;
PAA Laboratories). Huh7.5-FGR cells were cultured in Huh7.5 medium supplemented with
250 μg/ml G418 Geneticin (Gibco). Hek293 cells were cultured in modified eagle medium
(MEM) supplemented with 100 nM NEAA, 50 U/mL penicillin, 50 mg/mL streptomycin,
and 10% FBS. HepG2 cells were cultured in Hek293 medium supplemented with 1% sodium
pyruvate (Gibco). Transfections were done using Lipofectamine 2000 (Life Technologies)
for DNA constructs and Lipofectamine RNAiMax (Life Technologies) for siRNAs, miRNA
mimics and inhibitors (Ambion). All transfections were performed following the
manufacturers' protocols. For rescue experiments, 50 μL of lipid mixture (Sigma, L0288) or
BSA conjugated oleic acid (Sigma, O3008) were added per 1 mL medium (at the indicated
time points). Where indicated, cells were incubated in serum free medium (DMEM with 100
nM NEAA only). Unless otherwise indicated, all 25-HC treatments were performed at a
concentration of 5 μM. THP-1 monocytic cells were cultured in RPMI-1640 medium
supplemented with 1% penicillin and streptomycin, 1% sodium pyruvate, 10% FBS, 40 nM

78
β-mercaptoethanol, 1% HEPES, and 1% L-glutamine. Monocytes were cultured in medium
supplemented with 100 nM phorbol-12-myristate-13-acetate for macrophage differentiation
prior to transfections. All cell lines were tested for mycoplasma contamination.
HCV infection
JFH-1T strain harbors 3 amino acid changes that enhance infectious virus production and
was derived from the cell culture–adapted JFH-1 strain JFH-AM1, as previously described
(Russell et al., 2008). JFH-HS virion were produced by Huh7.5 cells cultured in human
serum containing medium and collected 25 days post-electroporation, as previously
described25. The JFH-HS virion possess more physiologically relevant characteristics,
including higher specific infectivity, lower density, and increased association with
apolipoprotein B25. Twenty-four hours prior to infection, Huh-7.5 cells were seeded into 6-
well plates. On the following day, cells were cultured with medium containing infectious
HCV particles (MOI = 0.1 for JFH-1T or MOI = 0.3 for JFH-HS) for 4 hours before the
medium was removed and replaced with fresh medium. For drug treatments, infected cells
were treated 48 hours post-infection with methanol (vehicle) or varying concentrations of 25-
hydroxycholesterol. Twenty-four hours post drug treatment (72 hours post infection), cells
were lysed with TriZol (Invitrogen) for RNA isolation. For examining miRNA's anti-viral
effects, Huh-7.5 cells were transfected with 100 nM miRNA mimics/inhibitors (control,
miR-130b, or miR-185). Twenty four hours post-transfection, cells were infected with HCV
(JFH-1T or JFH-HS). 72 hours post-transfection, cell supernatants were removed and used
for infectious titer determination, and cells were lysed with TriZol for RNA isolation.
HCV infectivity assay
Infectious supernatants of HCV infected cells were filtered through a Millex-HV 45-μm
filter (Millipore) before being serially diluted in 10-fold in medium. For HCV infectivity

79
assays, 100 μL of each dilution was then used to infect Huh-7.5 cells seeded (at 5×10⁴ per
well) onto 8-well chamber slides (Lab-Tek) for 4 hours. Following incubation, the infectious
medium was removed and replaced with fresh medium. Seventy-two hours post infection,
cells were fixed and stained with HCV core monoclonal B2 antibody (1:200; Anogen; MO-
I40015B), followed by secondary Alexa Fluor 488–conjugated goat anti-mouse (1:500;
Thermo Fisher Scientific; A-11029). Viral titers are expressed as the number of focus-
forming units (FFU) per ml of supernatant.
DENV infection and titer determination
To generate the DENV-2 virion stock used in this study, capped genomic RNA produced by
in vitro transcription was electroporated into BHK21 cells to produce seed virus stock, which
was subsequently amplified in Vero cells. For 25-HC treatments, Huh-7.5 cells were seeded
into 6-well plates. On the following day, cells were treated with 5 μM 25-HC or methanol
(vehicle). Twenty-four hours post-treatment, cells were cultured with medium containing
infectious DENV particles (MOI = 5). Four hours post infection, medium was replaced with
25-HC-containing medium. Similarly for miRNA mimic transfected cells, cells were seed
and transfected 24 hours later. 48 hours post-transfection, infections were performed. For all
experiments, 48 hours post-infection, cell supernatants were harvested and titers were
determined by plaque assays on Vero cells (Kumar et al., 2013).
VSV infection and titer determination
VSV virion stock from the AV3 strain was generated as previously described (Stojdl et al.,
2003). For infections, HepG2 cells were reverse transfected in 6-well plates with 50 nM
miRNA mimics using Lipofectamine RNAiMax, as per the manufacturer's protocols.
Seventy-two hours post-transfection, cells were cultured with medium containing infectious
VSV particles (MOI = 3). Supernatants and total cellular RNA was harvested 24 hours post-

80
transfection. Titers were analyzed via plaque assays on Vero cells and intracellular VSV
RNA levels were analyzed via qPCR.
SCID/Alb-uPA mice experiments
All mice were housed and maintained under specific pathogen–free conditions according to
Canadian Council on Animal Care guidelines. SCID-beige/Alb-uPa mice were transplanted
with human primary hepatocytes as described previously (Singaravelu et al., 2014a).
Cryopreserved human primary hepatocytes were purchased from CellDirect Inc, USA or
BioreclamationIVT. Each lot number represents a distinct donor individual. In this study,
three lots of cells were used: Hu8063, Hu8085 and FLO. Characterization of human
hepatocyte repopulation levels, viral infections, tissue dissections, and HCV virological
measurements were performed as previously described (Singaravelu et al., 2014a). Two
clinical isolates of virus were used in this study: HCV genotype 1a and genotype 2b. No
randomization or blinding was used in mice studies. Gender was not a consideration in the
selection of mice for these studies. All mice were generally infected at 8 weeks.
CARS microscopy
Cells were seeded in 4.2 cm2 Lab-Tek Chambers Slide System (NUNC). Prior to imaging,
cells were washed twice with phosphate-buffered saline (PBS) and then incubated for 15 min
at room temperature with fixing solution (4% formaldehyde, 4% sucrose). The fixed cells
were washed twice with PBS for 3 minutes and then stored at 4 °C in PBS prior to imaging.
The imaging and subsequent quantitative voxel analysis of lipid droplet content was
performed using ImageJ (NIH), as previously described (Singaravelu et al., 2014a).
Triglyceride assay
Triglyceride (TG) concentrations were analyzed directly by spectrophotometric analyses,
using the TG quantification kit (BioVision) according to the manufacturer's instructions. TG

81
levels were normalized by total protein levels in lysates, which were quantified with the DC
protein assay (Bio-Rad).
Small molecule–mediated annotation of microRNA targets (SMART)
Traditional miRNA profiling studies have proven instrumental in identifying biomarkers of
infection; however, these studies typically provide no clear indication of the functional
impact and pathological relevance of differentially expressed miRNAs on viral infection.
The SMART strategy is a more systematic approach for identifying pro- and anti-viral
miRNAs, which influence the virus through modulation of host pathways. While the function
of specific miRNAs on viral pathogenesis is lacking, host pathways associated with viral
infection are generally well-studied. We used small molecules targeting these virus-
associated host pathways in order to annotate miRNAs regulating the virus-host interactions.
A general scheme is illustrated in Figure S3.3. Generally, the technique consists of two
differential miRNA profiling experiments. First, the traditional experiment is carried out to
identify the miRNA signature of viral infection (comparing healthy vs. infected cells).
Secondly, differential miRNA profiling is performed between infected cells treated with a
drug targeting a host-associated pathway or the vehicle for the drug (control). The latter
experiment produces miRNA candidates hypothesized to regulate the virus-associated host
pathway of interest. The overlap between these candidates and the miRNA signature of viral
infection represent miRNAs modulated by the virus to potentially hijack the specific host
pathway.
miRNA microarray analysis
Total RNA isolations were performed using the mirVana miRNA isolation kit as per the
manufacturer's instructions (Ambion, TX). RNA integrity was verified via electrophoresis
with a 0.8% agarose gel. Total RNA (3 μg) was labeled using the Oyster-550 based Flashtag

82
RNA labeling kit (Genisphere). The miRCURY LNA microRNA Array probe sets (Exiqon)
were spotted, as previously described (Liu et al., 2014a), onto epoxysilane coated Nexterion
slide E (Schott). Hybridizations were performed using a Slidebooster SB400 hybridization
station (Advalytix) at 56 °C overnight. Slides were then washed sequentially with two 2 min
washes in 0.2% SDS 2× sodium-saline citrate (SSC) buffer at 60 °C, one 5 sec wash in 1×
SSC at room temperature (RT), one 2 min wash in 1× SSC, followed by a final 2 min wash
in 0.1× SSC at RT. Slides were centrifuged at 1,000 RPM for 4 minutes to dry and then
scanned on a GenePix 4200A Scanner (Molecular Devices). Data extraction and image
analysis were performed using GenePix Pro Software (Molecular Devices). Replicate spots
from the same array were averaged. Missing spots or high background portions of arrays
were flagged manually and omitted from downstream analysis. Quantile normalization was
performed using the preprocessCore library of the Bioconductor package in the R
environment. Microarrays for each condition was performed in at least triplicate from 2 or 3
biological replicates, each performed as 1 or 2 technical replicates.
mRNA microarray analysis
Using RNeasy kit (Qiagen), total RNA was isolated from Huh7.5 cells transfected with 100
nM of control or miR-185 mimic, 72 hours post-transfection. Expression profiling was
performed using Affymetrix Human Gene ST.2.0 arrays in duplicate. Data was normalized
and analyzed using the Affymetrix Expression Console and Transcriptome Analysis Console,
as per the manufacturer's protocols. Gene ontology analysis was performed using the
ToppGene Suite (Chen et al., 2009).
Quantitative PCR
RNA isolation from hepatocytes was performed using TriZol (Invitrogen) as per the
manufacturer's protocol. RNA integrity was confirmed by electrophoresis on 0.8% agarose

83
gel in 1× TBE (Ambion). For mRNA and HCV RNA levels, 250–500 ng of total RNA was
reverse transcribed using the Superscript II RT kit (Invitrogen) as per the manufacturer's
protocols. Quantitative PCR (qPCR) was subsequently performed on an iCycler (Bio-Rad)
using iQ SYBR Green Supermix (Bio-Rad), as per manufacturer's protocol. Primer
sequences are listed in Table S3.6. Relative miRNA levels were quantified using the Taqman
miRNA Assay (Applied Biosystems), with 10 ng of total RNA used for reverse transcription
using the TaqMan MicroRNA Reverse Transcription Kit (Applied Biosystems). Each qPCR
sample included 1× Universal Taqman PCR Master Mix, 0.2 mM TaqMan probes
againstRNU6B, miR-130b, miR-185, miR-128, or let-7f, 1.5 mM forward primer, and the
universal reverse primer. The 2− ΔΔCt method was used to calculate relative fold changes in
expression relative to mock or control treated samples, with RNU6B or 18S rRNA levels
being used for normalization.
Immunoblot analysis
After transfections or drug treatments, cells were washed twice with PBS and lysed with an
SDS lysis buffer consisting of 50 mM Tris-HCl (pH 6.8), 2% SDS, and 10% glycerol. A
protease inhibitor cocktail mix (Roche Diagnostics) was added to each extract. The protein
concentration of each sample was quantified using the DC Protein Assay (Bio-Rad)
according to the manufacturer's protocol. Prior to loading, 10% v/v of DTT and bromophenol
blue (1:1) were added to each sample, and 40–60 μg/well was loaded onto a SDS–PAGE gel
(10% resolving, 4% stacking gel). The resolved proteins were transferred to a Hybond-P
PVDF membrane (Amersham Biosciences). The membrane was probed using a mouse anti-
NS5A (1:3,000 dilution; Virogen, 256-A), mouse anti-NS3 (1:3,000; Virostat, 1878), mouse
anti-SCD1 (1:4,000; Abcam, ab19862) rabbit anti-AGPAT3 (1:200, Santa Cruz
Biotechnology, sc-83190), rabbit anti-SCARB1 (1:5,000; Novus Biologicals, NB400-104),

84
mouse anti-SREBP2 (1:200; BD Pharmingen, 557037), rabbit anti-serum 3143 against
LDLR (1:1,000; kind gift from T. Lagace, University of Ottawa), rabbit anti-β-tubulin
(1:2,000, Santa Cruz Biotechnology, sc-9104), or mouse anti-PTP1D (1:10,000; BD
Transduction Laboratories, 610621) primary antibodies followed by a secondary (HRP)-
conjugated goat anti-mouse or donkey anti-rabbit IgG antibody (Jackson ImmunoResearch
Laboratories, Inc.). Protein bands were visualized by Western Lightning Western Blot
Chemiluminescence reagents (GE Healthcare) according to the manufacturer's protocol. β-
tubulin and PTP1D levels were used as loading controls.
3′ UTR luciferase reporter analysis
miR-185 and miR-130b binding sites were mutated in the dual luciferase reporters bearing
the 3′ UTRs of LDLR, SREBP2, and SCD1 (Genecopoeia), using the QuikChange Lightning
kit (Stratagene), according to the manufacturer's protocol, using the primers listed in Table
S6 according to the manufacturer's protocol. Due to the long length of the AGPAT3 and
SCD1 3′ UTRs, two luciferase reporter constructs were obtained containing segments of the
3′ UTR. For SCD1, construct A spanned nts 1–1916 containing sites 1–4 and construct B
spanned nts 1818–3898 containing sites 4–5. For AGPAT3, construct A spanned nts 1–2427
containing sites 1–2, and construct B consisted of nts 2309–5082 containing sites 3. Hek293
cells were seeded in 24-well plates, and transfected with the wild-type and mutant 3′ UTR
dual luciferase reporter constructs. Twenty four hours post-transfection, the cells were
transfected with miR-185, miR-130b, or control mimics. 48 hours post-mimic transfection,
cells were lysed in 1× passive lysis buffer (Promega) and dual luciferase assays were
performed as previously described (Dyer et al., 2000).

85
Electron microscopy
Huh7.5-FGR cells were transfected with either control or miR-185 mimics. Seventy-two
hours post-transfection, cells were pelleted and fixed in 2.5% glutaraldehyde in sodium
cacodylate buffer (Electron Microscopy Sciences). Samples were subsequently washed in 0.1
M cacodylate washing buffer. Samples were post-fixed in 1% osmium tetroxide and 1.5%
potassium ferrocyanide, dehydrated in ascending acetone concentrations (30% to 100%) and
embedded in Epon. Ultra-thin sections were cut on a Leica EM UC6 ultramicrotome.
Sections were then stained with 1% lead citrate. Digital images were taken using a JEOL
1230 TEM adapted with a 2,000 × 2,000 pixel bottom mount CCD digital camera and AMT
software.
Immunofluorescence and Oil Red O staining
Liver sections were prepared, stained, and imaged as previously described43. Briefly, fixed
liver sections were permeabilized with PBS containing 0.5% Triton X-100 for 10 min and
blocked in PBS with 10% goat serum for 1 h. Slides were then stained with rabbit anti-
Cytokeratin 18 (CK-18) (Abcam, 1:100 dilution, ab32118) at 4 °C overnight, followed by
Alexa Fluor 488–conjugated goat anti-rabbit and DAPI, for 1 hour in the dark. After 3
washes of PBC, slides were stained with Oil Red O working solution for 30 min, and rinsed
with 3 washes of distilled water. Finally, slides were rinsed in the dark for 10 minutes, air
dried, and mounted with prolong gold mounting medium (Life Technologies). Samples were
examined with a Leica TCSSP5 confocal microscope. Images were processed using LAS AF
Lite software.
Fatty acid methyl ester (FAME) analysis
Levels of fatty acid species was determined by FAME analysis using gas chromatography
(GC). The GC was performed on an Agilent 6890 instrument equipped with autosampler and

86
flame-ionization detector. Briefly, mouse liver samples were assayed for protein content
using BCA protein assay (Thermo Scientific). One milligram of lysate was then extracted in
the presence of C17:0 fatty acid internal standard using a modification of a previously
described method (Folch et al., 1957). The lipid-containing phase was removed, dried under
a stream of nitrogen, and methyl esters of fatty acids produced by incubation in 6% sulfuric
acid in MeOH for 2 hours at 80 degrees. The solution was neutralized by addition of 50%
ammonium hydroxide and the fatty acid methyl esters (FAMEs) extracted with hexane,
followed by passage of the extract through anhydrous sodium sulfate to remove traces of
water. The extract was dried under a stream of nitrogen and resuspended in hexane for
injection into the GC.
HPLC total lipid analysis
High-performance liquid chromatography (HPLC) was performed on an Agilent 1100
instrument equipped with quaternary pump and Alltech ELSD2000 Evaporative Light-
Scattering Detector using a modified version of a previously described protocol (Graeve and
Janssen, 2009). Briefly, cell homogenate was assayed for protein content using the method of
(Thermo Scientific), and homogenate equivalent to 1 mg protein was extracted in the
presence of 50 μg dipalmitoyl-phosphatidyldimethylethanolamine internal standard using a
modification of a previously described method58. The lipid-containing phase was removed,
dried under a stream of nitrogen and resuspended in 100 μL chloroform:isooctane (1:1), and
5 μL of this injected onto the column. Lipids were separated using a three-solvent gradient
on an Onyx monolithic silica normal-phase column (Phenomenex).

87
Statistical analysis
Unless otherwise indicated, data is presented as the mean of replicates. Error bars represent
the standard error of the mean. Statistical significance was evaluated using unpaired two-
tailed Student's t-test.
Data availability
All microarray data have been deposited to the NCBI Gene Expression Omnibus under the
accession numbers GSE73163, GSE73164 and GSE73165.
Accession codes
NCBI Gene Expression Omnibus: GSE73163, GSE73164 and GSE73165.
Acknowledgments
We thank A. Ridsdale and the National Research Council of Canada (NRC) coherent anti-
Stokes Raman spectroscopy (CARS) facility along with Z. Jakubek and the NRC
measurement science and standards (MSS) imaging facility for technical assistance. mRNA
microarray profiling was performed by the Centre for Applied Genomics, The Hospital for
Sick Children, Toronto, Ontario, Canada. Lipid profiling was performed by A. Moses and
the Lipid Analysis Core Service, University of Alberta, Edmonton, Alberta, Canada. We also
would like to thank E. Riklow for assistance with Dengue virus experiments. This study was
supported by funding from Natural Sciences and Engineering Research Council (NSERC) of
Canada grant (298496 to J.P.P.) and Canadian Institutes of Health Research (CIHR) grants
(136807, 232063 to J.P.P., R.S.R. and D.L.T.; 130365 to K.J.R.; 28637 to T.C.H.). R.S.,
D.M.J., R.C. and N.G.T. would like to thank the National CIHR Research Training Program
in Hepatitis C (NCRTP-HepC) for training and funding. R.S. was supported by a Vanier

88
Canadian Graduate scholarship. D.G.R. was supported by a CIHR graduate scholarship. D.Ö.
was supported by a post-doctoral fellowship from the CIHR. A.K. was supported by
NSERC–Collaborative Research and Training Experience (CREATE) and Alberta
Innovates–Health Solutions postdoctoral fellowships. T.C.H. was supported by a Tier 1
Canada Research Chair.
89
Chapter 4 – MicroRNA-7 mediates cross-
talk between metabolic signaling pathways
in the liver

90
Preface
This chapter consists of data submitted to Chemistry and Biology for publication as a
research article entitled “MicroRNA-7 mediates cross-talk between metabolic signaling
pathways in the liver” (Manuscript number: CELL-CHEMICAL-BIOLOGY-D-16-00020).
The article was authored by R. Singaravelu, C. Quan, M.H. Powdrill, P. Srinivasan, R.K.
Lyn, D.M. Jones, R.S. Russell, J.P. Pezacki. The individual contributions of each author are
detailed below:
I performed miRNA microarray hybridizations, scanning, and analysis, mRNA
microarray analysis, as well as the majority of all RNA isolations, qRT-PCR experiments,
cell culture and sample preparation, and dual luciferase assays. J.P. Pezacki and I conceived
all research ideas and formulated the experimental plan. I wrote the first draft of the
manuscript. Manuscript editing was performed by all authors. P. Srinivasan, S. C. Quan,
and M.H. Powdrill provided technical assistance with qRT-PCR. R.K. Lyn and I performed
CARS imaging and analysis. D.M. Jones prepared JFH-1T infected samples for miRNA and
mRNA expression analysis. R.S. Russell and J.P. Pezacki were senior contributing authors.

91
Abstract
MicroRNAs have emerged as critical regulators of cellular metabolism. In order to
characterize miRNAs crucial to maintenance of hepatic lipid homeostasis, we examined the
overlap between the miRNA signatures associated with inhibition of peroxisome proliferator
activated receptor-α (PPAR-α) signaling, a pathway regulating fatty acid metabolism, and the
miRNA signatures associated with 25-hydroxycholesterol, an oxysterol regulator of sterol
regulatory element binding protein (SREBP) and liver X receptor (LXR) signaling. Using
this strategy, we identified microRNA-7 as a PPAR-α regulated miRNA, which activates
SREBP1 signaling and promotes hepatocellular lipid accumulation. This is mediated by
suppression of negative regulators of SREBP1 signaling: AMPKα1 and ERLIN2.
MicroRNA-7 also regulated genes associated with PPAR signaling and sterol metabolism,
including liver X receptor β (LXR-β), a transcriptional regulator of sterol synthesis, efflux,
and excretion. Collectively, our findings highlight microRNA-7 as a novel mediator of
cross-talk between PPAR, SREBP, and LXR signaling pathways in the liver.

92
Introduction
The human liver plays a central role in the systemic metabolism (Rui, 2014). Proper
regulation of gene networks in the liver is integral to the maintenance of energy homeostasis
(Rui, 2014). Several transcription factors have been established as key regulators of lipid
and lipoprotein metabolism in the liver, including sterol response element binding proteins
(SREBPs), liver X receptors (LXRs), and peroxisome proliferator activated receptors
(PPARs) (Jeon and Osborne, 2012; Michalik et al., 2006; Osborne, 2000; Wahli and
Michalik, 2012). PPARs are a family of nuclear hormone receptors which function as
transcription factors for genes associated with lipid metabolism and inflammation (Wahli and
Michalik, 2012). PPAR-α is the most highly expressed PPAR isoform in the liver, and
regulates fatty acid catabolism and lipid export (Michalik et al., 2006). Similarly, SREBP1C
is the most highly expressed SREBP isoform in the adult liver and regulates genes associated
with triglyceride and fatty acid biosynthesis (Jeon and Osborne, 2012; Osborne, 2000). Two
isoforms of LXR exist (α and β), and both regulate sterol synthesis, efflux and excretion in
the liver (Zelcer and Tontonoz, 2006). As these transcription factors exert profound effects
on overlapping aspects of hepatic metabolism, significant cross-talk is required between
these signaling pathways to coordinate lipid homeostasis.
There have been several studies examining the interplay between these signaling
pathways (Boergesen et al., 2012; Ducheix et al., 2013; Fernández-Alvarez et al., 2011;
Tomohiro et al., 2003a; Tomohiro et al., 2003b); however, the majority have focused on
coding genes and have reported several different mechanisms of cross-talk between these
transcription factors. It is well established that LXRs and PPARs heterodimerize with a
common partner, retinoid X receptor (RXR), to mediate their transcriptional effects
93
(Tomohiro et al., 2003a; Tomohiro et al., 2003b). Additionally, LXRs are known to directly
transcriptionally activate SREBP1C expression (Repa et al., 2000). Therefore, PPARs and
LXRs compete for RXR binding to activate their respective signaling pathways, and
specifically PPAR-α overexpression interferes with LXR-mediated activation of SREBP1
expression (Tomohiro et al., 2003a; Tomohiro et al., 2003b). These studies suggest
competition between the LXR and PPAR signaling pathways. However, an independent
study reported that PPAR-α and LXR share genomic binding sites (Boergesen et al., 2012).
In fact, it was demonstrated that PPAR- α can bind the LXR response element in the
promoter of SREBP1C to mediate transcriptional activation (Fernández-Alvarez et al., 2011).
Collectively, these results point to complex interplay between PPAR-α, LXR, and SREBP
signaling. Characterization of non-coding RNAs that are co-regulated by these metabolic
pathways could help explain the underlying complexities of this cross-talk.
Recent work has illustrated that microRNAs (miRNAs) act as an important regulatory
layer in the control of hepatic metabolism (Rottiers and Näär, 2012). These 21-24 nucleotide
small non-coding RNAs repress gene expression post-transcriptionally through partial
pairing with mRNAs, yielding a combination of translational repression and mRNA
destabilization (Pasquinelli, 2012). The importance of miRNAs in metabolic controls is
supported by observations of aberrant hepatic miRNA profiles in metabolic disorders,
including diabetes/insulin resistance (Fu et al., 2015; Kurtz et al., 2014; Xiao et al., 2014),
obesity (Kornfeld et al., 2013), non-alcoholic fatty liver disease (Loyer et al., 2015), and
hepatitis C virus (HCV)-associated steatosis (Shirasaki et al., 2013; Singaravelu et al., 2014a;
Singaravelu et al., 2015b). In the current study, we sought to characterize miRNAs regulating
PPAR, LXR, and SREBP signaling in an effort to gain insight into the molecular
mechanisms of cross-talk between these metabolic pathways. We report a novel role for a

94
PPAR-α regulated miRNA, miRNA-7 (miR-7), in the regulation of SREBP1 signaling. miR-
7 stimulates the activity of SREBP1, a master regulator of fatty acid and triglyceride
biosynthesis. We demonstrate that miR-7-dependent activation of triglyceride synthesis and
lipid storage is mediated through inhibition of ERLIN2 and AMPK, two negative regulators
of SREBP1 signaling, as well as through downregulation of LXR-β expression.
Furthermore, genome-wide expression profiling reveals that miR-7 modulates the expression
of several genes associated with cholesterol and fatty acid metabolic processes. Collectively,
our work highlights miR-7 as a novel mediator of cross-talk between the PPAR-α, LXR-β,
and SREBP1 signaling pathways.
Results
PPAR-α signaling regulates miR-7 expression
Chronic HCV infection is associated with a high prevalence of hepatic steatosis. The
development of steatosis is linked to the virus’ perturbations of SREBP (Jackel-Cram et al.,
2010; Li et al., 2013a; Waris et al., 2007), LXR (Garcia-Mediavilla et al., 2012), and PPAR
signaling (Dharancy et al., 2005); hence we utilized HCV infection as a model in which to
examine the influence of miRNAs on hepatic lipid homeostasis. In order to identify
miRNAs regulating cross-talk between metabolic signaling pathways, we performed miRNA
microarray profiling on HCV-infected Huh7.5 hepatoma cells treated with a PPAR
antagonist (2-chloro-5-nitro-N-(pyridyl)benzamide) (Lyn et al., 2009; Rakic et al., 2006)
(Figure 4.1a). We compared this miRNA signature to a list of miRNA candidates regulated
by 25-hydroxycholesterol (25-HC), an inhibitor of SREBP maturation and agonist of the
LXR pathway (Singaravelu et al., 2015c), in HCV infected Huh7.5 cells (Figure 4.1a-b). We

95
Figure 4.1. PPAR-α antagonism and 25-HC treatment modulate miR-7 expression. (a)
Molecular structure of 25-hydroxycholesterol and PPAR-α antagonist (2-chloro-5-nitro-N-
(pyridyl)benzamide) used in this study. (b) Overview of miRNA profiling strategy applied to
identify miRNAs regulating cross-talk between metabolic signaling pathways. (c) Huh7.5
cells were treated with 10 μM GW6471 for 24 h. qRT-PCR was performed to measure
relative miR-7 expression (n = 4). (*P ≤ 0.05)

96
hypothesized that miRNAs regulated by both PPAR- α and 25-HC were likely to play
regulatory roles in multiple signaling pathways.
Twelve miRNAs are differentially expressed during PPAR-α antagonist treatment
(Table 4.1). Of the four miRNAs differentially expressed during both 25-HC and PPAR-α
antagonism (Table 4.2), miR-7-5p (miR-7) was selected for further study, as previous work
has shown that miR-7 expression is regulated by HNF4α, a liver enriched transcription factor
(Ning et al., 2014), suggesting it plays a physiological role in the liver. The microarray data
revealed repression of miR-7 expression by both small molecule treatments (Table 4.2). To
confirm PPAR-α regulation of miR-7 expression, we treated Huh7.5 cells with GW6471, a
potent PPAR-α antagonist (Xu et al., 2002). qRT-PCR analysis reveals a 40% decrease in
miR-7 levels (Figure 4.1c), validating our microarray result. These results confirm that
PPAR-α signaling regulates mature miR-7 abundance.
miR-7 stimulates SREBP1 signaling
Since miR-7 expression levels are responsive to fatty acid levels in mouse myoblasts (Li et
al., 2011b), and the microRNA has previously been implicated in insulin signaling (Horsham
et al., 2015), we hypothesized that miR-7 regulates hepatic metabolism. In order to gain
comprehensive insight into miR-7’s role in metabolic pathways, we performed gene
expression profiling of Huh7.5 cells transfected with miR-7 synthetic mimics. Bioinformatic
analysis was performed to identify potential transcription factors with binding sites enriched
in the promoters of miR-7 activated genes. Interestingly, only SREBP1 binding sites were
overrepresented in the promoters of genes upregulated greater than 1.5-fold during miR-7
overexpression (P < 1 × 10⁻⁴) (Chen et al., 2009). These results suggest that miR-7 activates
SREBP1 signaling. SREBP1C is considered a master transcriptional regulator of fatty acid
and triglyceride (TG) synthesis (Osborne, 2000). We, therefore, predicted that miR-7-

97
Table 4.1. Human miRNAs differentially expressed in HCV infected Huh7.5 cells
treated with PPAR-α antagonist
miRNA* P value Fold
Change
hsa-miR-1244 1E-2 -2.78
hsa-miR-1255b-5p 1E-3 -6.67
hsa-miR-1304-5p 4E-2 -2.94
hsa-miR-183-5p 1E-3 -2.22
hsa-miR-302b-3p 3E-2 1.76
hsa-miR-509-5p 3E-2 -4.00
hsa-miR-516a-5p 4E-2 -2.00
hsa-miR-620 2E-2 -1.92
hsa-miR-647 5E-2 -3.23
hsa-miR-7-5p 2E-2 -6.25
hsa-miR-7-2-3p 5E-3 -2.86
hsa-miR-920 3E-2 -2.70
*Table includes miRNAs modulated at least 1.5-fold following 25 µM BA treatment of JFH-
1T infected Huh7.5 cells (P < 0.05).

98
Table 4.2. Human miRNAs modulated by both PPAR-α antagonist and 25-HC
miRNA* 25-HC-induced
differential miRNA
expression
PPAR-α antagonist-
induced differential
miRNA expression
hsa-miR-1244
-3.62
-2.78
hsa-miR-509-5p -9.35 -4.00
hsa-miR-647 -1.59 -3.23
hsa-miR-7-5p -4.93 -6.25
*Table includes miRNAs modulated at least 1.5 fold during both 25 µM BA treatment and 5
μM 25-HC treatment of JFH-1T infected Huh7.5 cells (P<0.05).

99
mediated activation of SREBP1 signaling should result in increased triglyceride levels. As
anticipated, overexpression of miRNA-7 in Huh7.5 cells resulted in cellular triglyceride
accumulation as measured by triglyceride assays, consistent with SREBP1 signaling
activation (Figure 4.2a).
miR-7 promotes hepatocellular lipid accumulation
We subsequently utilized coherent anti-Stokes Raman scattering (CARS) microscopy to
perform label-free analysis of miR-7’s influence on hepatocellular lipid droplet (LD) content
in Huh7 cells (Nan et al., 2006; Pezacki et al., 2011). Our CARS analysis revealed miR-7
promoted cellular LD accumulation (Figure 4.2b-c), and an increase in the average diameter
of visualized LDs from 600 ± 10 nm to 650 ± 10 nm (n > 9,700 LDs; P < 0.05), consistent
with the observed increase in cellular triglyceride levels (Figure 4.2a). As LD proteins have
been implicated in the pathophysiology of hepatic steatosis (Carr and Ahima, 2015), we
postulated that the miR-7 mediated changes in LD morphology of Huh7.5 cells may, in part,
result from changes in LD-associated proteome. We examined the genes which were
differentially expressing during miR-7 overexpression for LD localized proteins. The cell
death inducing DFF45-like effector (CIDE) family of proteins are a family of LD-associated
proteins which regulate LD clustering and fusion (Li et al., 2007; Singaravelu et al., 2013),.
The microarray data revealed an increase in the expression of two members of the CIDE
family, CIDEB and CIDEC (Figure S4.1). We validated miR-7 mediated stimulation of
CIDEB and CIDEC expression in Huh7.5 cells via qRT-PCR (Figure 4.3a). Both CIDEB
and CIDEC are known to induce LD clustering and fusion (Li et al., 2007; Singaravelu et al.,
2013; Xu et al., 2012), and increased CIDEC expression is correlated with steatosis (Langhi
and Baldán, 2015; Xu et al., 2015). Therefore miR-7-mediated activation of CIDEB and
CIDEC expression likely contributes to the observed accumulation of larger LDs.

100
Figure 4.2 miR-7 promotes cellular lipid accumulation. (a) Relative cellular triglyceride
(TG) content in control and miR-185 mimic transfected Huh7.5 cells assessed by TG assays
(b) Representative CARS microscopy images of intracellular lipid droplets (LDs) in control
and miR-7 mimic transfected Huh7 cells. Cells were fixed 48 hours post-transfection. Scale
bar represents 10 µm. (c) Quantitative analysis of relative total cellular LD content (n > 30
cells) is shown. Data represents mean values ± s.e.m. Unpaired two-tailed t-test was used to
evaluate statistical significance. (*P ≤ 0.05; **P ≤ 0.01; ***P ≤ 0.001)

101
Figure 4.3 miR-7 regulates genes associated with PPAR signaling and hepatic lipid
metabolism. Relative mRNA expression level of (a) CIDEB and CIDEC, (b) miR-7
predicted targets, and (c) PPAR pathway-associated genes in miR-7 and control mimic
transfected Huh7.5 cells (n 4). Data represents mean values s.e.m. Unpaired two-tailed t-
test was used to evaluate statistical significance. (*P ≤ 0.05; **P ≤ 0.01; ***P ≤ 0.001)

102
miR-7 modulates expression of lipid metabolism-associated genes
Next we sought to identify direct targets of miR-7, which could explain the increased
SREBP1 maturation and hepatocellular lipid accumulation. We examined the overlap
between miR-7 predicted targets from Targetscan (Agarwal et al., 2015) and targets
repressed by miR-7 by at least 1.5-fold. We then examined this list of 683 genes for negative
regulators of SREBP1 signaling. Among the target candidates are two known inhibitors of
SREBP maturation, PRKAA1, which encodes the α1 catalytic subunit of AMPK, and
ERLIN2 (Huber et al., 2013; Li et al., 2011a) (Figures S4.1 and S4.2). qRT-PCR confirmed
that miR-7 overexpression downregulates PRKAA1 expression (Figure 4.3b). AMPK
phosphorylates SREBP1c, inhibiting its maturation and translocation to the nucleus (Li et al.,
2011a), while ERLIN2 promotes retention of SREBP1 at the endoplasmic reticulum,
preventing the proteolysis required for its activation (Huber et al., 2013). Therefore, miR-7
repression of AMPKα1 and ERLIN2 expression contributes to miR-7 stimulated SREBP1
signaling.
Using the Panther classification system (Mi et al., 2013), we further examined the list
of repressed miR-7 putative targets to identify additional genes with a functional association
to metabolism. This analysis produced NR1H2, APOA2, PCSK5, IDE, and NCEH1 as
additional repressed miR-7 targets of interest (Figures S4.1 and S4.2). qRT-PCR validated
miR-7-mediated decrease of NR1H2, APOA2, IDE, and NCEH1 mRNA levels by greater
than 50% (Figure 4.3b). NR1H2 encodes LXR-β, suggesting that PPAR-α activation of
miR-7 expression contributes to suppression of LXR-β signaling. These results demonstrate
that miR-7 mediates concerted regulation of several genes with functional associations to
hepatic metabolism.

103
In order to further classify biological processes activated by miR-7, we performed
gene ontology analysis on genes upregulated by more than 1.5 fold in miR-7 transfected
Huh7.5 cells. The list of statistically significant activated mRNA transcripts shows an
overrepresentation of genes involved in lipid catabolism and sterol metabolism (Table S4.1).
Gene set enrichment analysis (GSEA) was also performed on the miR-7 and control mimic
transfected Huh7.5 gene expression profiles to identify additional pathways modulated by
miR-7. Interestingly, the top pathways enriched in genes positively correlated with miR-7
expression included PPAR signaling (Table S4.2). qRT-PCR analysis reveals a modest
increase in PPAR-α expression levels (Figure 4.3c). Furthermore, we observe significant
increases in the expression of known PPAR-α targets, including ACSL5 (Colin et al., 2013)
(Figure 3C) and CIDEC (Figure 3A) (Langhi and Baldán, 2015). Taken together, these
results suggest that miR-7 forms a positive feed-forward loop with PPAR-α to regulate lipid
catabolism.
Discussion
To date, several miRNAs have been shown to play regulatory roles in different aspects of
hepatic lipid metabolism (Moore et al., 2011; Rottiers and Näär, 2012). As post-
transcriptional regulators of gene expression, miRNAs add a level of functional complexity
to classical regulatory gene networks. In this study, we sought to identify miRNAs
regulating the cross-talk between important metabolic signaling pathways in the liver. By
applying small molecule modulators of three important transcription factors (PPAR, LXR,
and SREBP) in conjunction with miRNA profiling, we were able to uncover a novel role for
miR-7 as a PPAR-α regulated miRNA that inhibits LXR-β and activates SREBP1 signaling.

104
Our work re-emphasizes the utility of small molecules for identifying miRNAs regulating
specific host pathways (Singaravelu et al., 2015b).
The observed miRNA signature for PPAR-α antagonism included other miRNAs with
known links to lipid metabolism, including miR-183 and miR-302b (Table 4.1). miR-183 is
transcribed as part of as a conserved polycistronic cluster of microRNAs (Dambal et al.,
2015), which includes miR-182 and miR-96. Interestingly, previous work demonstrated that
expression of miRNAs derived from this cluster were regulated by PPAR signaling (John et
al., 2012; Shah et al., 2007), consistent with our profiling results (Table 4.1). miR-183 has
been implicated in SREBP activation (Jeon et al., 2013) and insulin signaling (Motiño et al.,
2015). miR-302 has been shown to regulate cholesterol efflux (Meiler et al., 2015).
Collectively, these data suggest that the PPAR-α miRNA regulome plays an important role in
regulating hepatic metabolism.
miR-7 is evolutionarily conserved across bilateral species (Prochnik et al., 2007),
suggesting it plays an important functional role. Previous work examining miR-7 function in
the liver ascribed the miRNA a role in tumor suppression (Fang et al., 2012). Our miRNA
profiling demonstrated that both 25-HC, a LXR agonist and inhibitor of SREBP signaling,
and PPAR-α antagonist treatment down-regulated miR-7 expression levels (Figure 4.1c;
Table 4.1). Regulation by two different metabolic inhibitors highlighted a potential role for
the miRNA in hepatic lipid pathways. qRT-PCR analysis validated mature miR-7 as a
PPAR-α-regulated miRNA; however, in humans, miR-7 expression derives from three
separate loci in the genome (MIR7-1, MIR7-2, and MIR7-3). Our miRNA microarray data
also demonstrates a downregulation in miR-7-2-3p levels (Table 4.1). Since miR-7-5p and
miR-7-2-3p can derive from the same miRNA precursor, our data suggests MIR7-2 is the
genomic locus at which PPAR-α regulation is occurring.

105
Our results point to a lipogenic role for miR-7 in the liver as miR-7 overexpression
results in cellular LD and triglyceride accumulation (Figure 4.2a-c). This steatotic
phenotype is consistent with the observed miR-7-induced gene expression profile as
inhibition of AMPK and ERLIN2 promotes lipid accumulation (Huber et al., 2013; Shi et al.,
2010) and SREBP1 signaling (Huber et al., 2013; Li et al., 2011a). In addition to negative
regulation of SREBP1, ERLIN2 mediates degradation of HMGCR, an enzyme catalyzing the
rate limiting step of cholesterol biosynthesis (Jo et al., 2011), while AMPK acts as a central
metabolic sensor, which upon activation, generally promotes catabolic processes and inhibits
anabolic processes (Long and Zierath, 2006). Furthermore, we also observed upregulation of
CIDEC, whose expression correlates with hepatic steatosis (Langhi and Baldán, 2015; Xu et
al., 2015) (Figure 4.3a). Overall, our results suggest that the lipogenic function of miR-7
results from the cooperative effect of directly inhibiting multiple metabolism-associated
genes.
Our study also revealed miR-7 acts as a novel mediator of cross-talk between the
PPAR-α, LXR-β, and SREBP1 signaling pathways (Figure 4.4). PPAR-α and LXR compete
for RXR binding to mediate their transcriptional effects (Gearing et al., 1993; Willy et al.,
1995). As PPAR-α mediated activation of miR-7 expression represses LXR-β expression,
increased miR-7 levels should promote PPAR-α signaling by decreasing the LXR-mediated
competition for RXR binding (Tomohiro et al., 2003a; Tomohiro et al., 2003b). Therefore,
our proposed PPAR-α-miR-7-LXR-β signaling axis can account for miR-7’s stimulatory
effect on PPAR signaling (Figures 4.3c and 4.4). Furthermore, LXR transcriptionally
activates SREBP1 expression (Repa et al., 2000), so PPAR-α mediated suppression of LXR
signalling (Figure 4.3b) should result in decreased SREBP signalling. However, our work
suggests that PPAR-α rheostats its inhibitory effect on the SREBP1 pathway by promoting

106
Figure 4.4 Proposed model of miR-7’s role in cross-talk between PPAR, SREBP, and
LXR signaling pathways. PPAR-α positively regulates miR-7 expression. miR-7 represses
the expression of putative targets, LXR-β, ERLIN2, and PRKAA1 (AMPKα1). PPAR-α
competes with LXR-β for binding to RXR to mediate its transcriptional effects. PPAR-α-
mediated activation of miR-7 expression further suppresses LXR signaling, through direct
targeting of LXR-β. While PPAR-α inhibits LXR-mediated SREBP1 transcriptional
activation, stimulating miR-7 expression appears to rheostat this effect through suppression
of negative regulators of SREBP1 activity (ERLIN2 and AMPKα1).
107
miR-7-mediated stimulation of SREBP1 maturation. miR-7-mediated repression of APOA2
and IDE (Figure 4.3b) also points to potential roles for the miRNA in high-density
lipoprotein (HDL) biogenesis and hormone secretion.
APOA2 encodes apolipoprotein II-A, which is the second most abundant protein on
HDLs (Tailleux et al., 2002), suggesting that miR-7-mediated regulation of APOA2
expression could impact HDL biogenesis. Previous work has highlighted an important role
for miR-7 in glucose-stimulated insulin secretion from the pancreas (Latreille et al., 2014).
IDE, or insulin degrading enzyme, encodes an enzyme responsible for catabolism of
glucagon, amylin, and insulin (Maianti et al., 2014; Tang, 2016). Thus our work suggests
miR-7 induced repression of IDE expression could also contribute to miR-7’s regulatory
effects on hormones secreted from the pancreas.
In summary, our data suggest a functional role for miR-7 in hepatic lipid homeostasis
at the intersection of PPAR, SREBP, and LXR signaling pathways. This PPAR-α-regulated
miRNA regulates SREBP1 signaling, hepatocellular lipid accumulation, and cholesterol
metabolism through the concerted regulation of ERLIN2, AMPKα1, and LXR-β. This
evolutionarily conserved miRNA plays a lipogenic role in the liver, and our study opens new
avenues for exploration of miR-7’s regulatory effects in metabolism in the context of other
tissues and systemic energy homeostasis.
Materials and methods
Materials
The Huh7.5 cell line was a kind gift from Dr. Charles M. Rice (Rockefeller University, New
York, NY) and Apath (St. Louis, MO) (Blight et al., 2002). All mirVana miRNA mimics

108
and inhibitors, along with controls, were purchased from Ambion (Austin, TX). 2-chloro-5-
nitro-N-(pyridyl)benzamide (BA; >98%) was purchased from Cayman Chemical Company
(Ann Arbor, MI, USA). GW6471 (>98%) was obtained from Sigma-Aldrich.
Cell culture and transfections
Adherent Huh7.5 and Huh7 cells were cultured in Dulbecco's Modified Eagle Medium
(DMEM; Invitrogen, Burlington, ON) supplemented with 100 nM nonessential amino acids
(NEAA; Gibco, Burlington ,ON), 50 U/mL penicillin, 50 mg/mL streptomycin, and 10%
fetal bovine serum (FBS; PAA Laboratories, Etobicoke, ON). Transfections were performed
using Lipofectamine RNAiMax (Life Technologies, Carlsbad, CA) for miRNA mimics and
inhibitors (Ambion). Transfections were performed according to the manufacturer’s
protocol. GW6471 and DMSO (vehicle) treatments were performed for 24 h.
HCV infection
JFH-1T strain possesses 3 amino acid changes that enhance infectious virus production and
was derived from the cell culture-adapted JFH-1 strain JFH-AM1 (Russell et al., 2008).
Twenty four hours prior to infection, Huh-7.5 cells were seeded into 6-well plates. On the
following day, cells were inoculated with infectious HCV particles (MOI = 0.1) for 4 h
before the medium was removed and replaced with fresh media. For BA treatments, infected
cells were treated 48 h post-infection with methanol (vehicle) or varying concentrations of
BA. Twenty four hours post drug treatment (72 hours post infection), cell supernatants were
removed and used for infectious HCV titer determination, and cells were lysed with TriZol
(Life Technologies) for RNA isolation.
miRNA microarray analysis
Total RNA isolations were performed using the mirVana miRNA isolation kit according to
the manufacturer’s instructions (Ambion, TX). RNA integrity was verified by 0.8% agarose

109
gel electrophoresis. Total RNA (3 μg) was labeled using the Oyster-550 based Flashtag
RNA labelling kit (Genisphere). miRCURY LNA microRNA Array probe spotting,
microarray hybridization and wash conditions, data extraction and image analysis were
performed as previously described (Singaravelu et al., 2015b). Quantile normalization was
performed using the preprocessCore library of the Bioconductor package in the R
environment. Each array was performed in at least triplicate from three biological replicates.
Comparisons of BA-induced miRNA changes were made with previously obtained miRNA
profiles for methanol (vehicle) and 25-hydroxycholesterol (25-HC) treatment, available at
Gene Expression Omnibus (Series GSE73164).
CARS microscopy
Huh7 cells were seeded in 4.2 cm2 Lab-Tek Chambers Slide System (NUNC). Prior to
imaging, cells were washed twice with phosphate-buffered saline (PBS), and fixed in a 4%
formaldehyde, 4% sucrose solution for 15 min at room temperature. Fixed cells were
subsequently washed twice with PBS for 3 min and stored at 4°C in PBS prior to imaging.
The imaging, quantitative voxel analysis of cellular LD content, and LD sizing was
performed using ImageJ (NIH), as previously described (Lyn et al., 2009; Singaravelu et al.,
2013).

110
Triglyceride assay
Cellular triglyceride (TG) levels were analyzed directly by spectrophotometric analyses,
using the BioVision TG quantification kit according to the manufacturer's instructions. TG
levels were normalized to total protein levels, which were quantified using the Bio-Rad DC
protein assay.
mRNA microarray analysis
RNA isolation from Huh7.5 cells was performed with the RNeasy kit (Qiagen). Gene
expression profiling was performed using Affymetrix Human Gene ST.2.0 arrays. Data was
normalized and analyzed using the Affymetrix Expression Console and Transcriptome
Analysis Console (v3.0), according to the manufacturer’s protocols. Gene ontology,
pathway enrichment, and transcription factor binding site analysis was performed using the
ToppGene Suite (Chen et al., 2009) or Gene Set Enrichment Analysis (GSEA) (Subramanian
et al., 2005). For ToppGene analysis, P values were adjusted with Bonferroni correction. For
GSEA analysis, bi-weight average signals (log2) from Affymetrix arrays were used as input.
The KEGG pathway database was selected for target gene sets, and default settings were
used with the exception of the metric for ranking genes (Ratio of Classes) and permutation
type (Gene Set).
Quantitative RT-PCR
RNA isolation from hepatocytes was performed using TriZol (Life Technologies), RNeasy
kits (Qiagen), or NucleoSpin miRNA (Macherey-Nagel), according to the manufacturer’s
protocol. RNA integrity was confirmed by 0.8% agarose gel electrophoresis in 1X TBE
(Ambion). For mRNA profiling, 10 ng of total RNA was reverse transcribed using the
Superscript II RT kit (Life Technologies) following the manufacturer’s instructions. qPCR
was subsequently performed on an iCycler (Bio-Rad) using iQ SYBR Green SSO Advanced
111
Supermix (Bio-Rad), according to the manufacturer’s protocol. Primer sequences are listed
in Table S4.3. Relative miRNA levels were quantified using the Taqman miRNA Assay
(Applied Biosystems), with 10 ng of total RNA used for reverse transcription using the
TaqMan MicroRNA Reverse Transcription Kit (Applied Biosystems). For both mRNA and
miRNA quantification, the 2−ΔΔCt method was used to calculate fold changes in expression
relative to mock or control treated samples (Livak and Schmittgen, 2001), with 18S rRNA or
RNU6B levels being used for normalization.
Statistical analysis
Data is presented as the mean of replicates, with error bars representing the standard error of
the mean. Unless otherwise stated, statistical significance was evaluated using Student’s t-
test, and P-values less than 0.05 were deemed significant.
Acknowledgments
We kindly thank Shifawn O’Hara for technical assistance with assays and validation
experiments. We thank A. Ridsdale and the NRC CARS facility for technical assistance with
the CARS microscope. mRNA microarray profiling was performed by The Centre for
Applied Genomics (TCAG), The Hospital for Sick Children, Toronto, Ontario, Canada. This
study was supported by funding from a Natural Sciences and Engineering Research Council
(NSERC) grant (298496) and a Canadian Institutes of Health Research (CIHR) grant
(136807). R.S., D.M.J., R.C., and M.H.P. would like to thank the National CIHR Research
Training Program in Hepatitis C for training and funding. R.S. was supported by a Vanier
Canadian Graduate scholarship and Ontario Graduate Scholarship. C.Q. was supported by a
NSERC Undergraduate Student Research Award.

112
Chapter 5 – General discussion and future
directions

113
Elucidation of novel miRNA/mRNA networks regulating hepatic
metabolism
Our work has characterized regulatory roles for miR-27a/b, miR-130b, miR-7, and
miR-185 in the hepatic lipid pathways. These results, combined with other studies
characterizing miRNAs with functions in cellular metabolism (Moore et al., 2011; Rottiers
and Näär, 2012), point to miRNAs being a critical regulatory layer in the maintenance of
metabolic homeostasis. The majority of our studies analyzing these miRNAs’ functions
were performed in cell culture models; it will be of interest to evaluate the effects of these
miRNAs on systemic metabolism in vivo. These miRNAs will also warrant further
investigation in the context of other metabolic disorders, such as non-alcoholic fatty disease
and diabetes, where altered hepatic miRNA expression has been linked to the disease state
(Fu et al., 2015; Liu et al., 2014b; Sobolewski et al., 2015).
In order to properly regulate carbon flux, significant cross-talk must exist between
lipid and glucose metabolic pathways; for example, glucose availability regulates de novo
lipogenesis (Towle, 2005). Therefore, while our studies have been focused on understanding
the role of these miRNAs in lipid metabolism, they also likely influence glucose
homeostasis. This is supported by studies implicating functional roles for specific hepatic
miRNAs in aspects of both metabolism, including miR-26 (Fu et al., 2015), miR-378 (Liu et
al., 2014b), miR-29 (Dooley et al., 2016; Kurtz et al., 2014), and miR-33 (Dávalos et al.,
2011; Najafi-Shoushtari et al., 2010; Rayner et al., 2010). Therefore, it is likely that miR-
130b, miR-185, miR-27 and miR-7 each contribute to the regulation of hepatic glucose
metabolism. In fact, miR-130a (Xiao et al., 2014) and miR-185 (Wang et al., 2014b) have
already been implicated in the regulation of hepatic insulin signaling in mice. miR-27 has
114
been shown to directly regulate the tumour suppressor FoxO1 (Myatt et al., 2010), a
transcription factor which also regulates gluconeogenesis (Tikhanovich et al., 2013), in
endometrial cancer cells; while mmu-miR-7a is an established regulator of glucose
stimulated insulin secretion in the pancreas of mice (Latreille et al., 2014). Future studies
should examine the effects of these miRNAs on hepatic glucose metabolism in detail.
Role of miRNAs in HCV’s hijacking of hepatic metabolism
Prior to my thesis, it had been well established that the hepatitis C virus is reliant on
lipid metabolic pathways to facilitate its life cycle; however, the host factors implicated in
the HCV life cycle were restricted to coding genes. Our work herein strongly suggests HCV
alters the host miRNA milieu to mediate metabolic alterations to infected cells. HCV
appears to activate the expression of miR-27 and down-regulate miR-185 and miR-130b
levels to modulate the expression of several lipid metabolism associated genes, including
ANGPTL3, PPARA, RXRA, SREBF1, SREBF2, SCD, LDLR, PPARG, AGPAT3, and
SCARB1, and promote hepatocellular lipid accumulation (Figure 5.1). Overexpression of
miR-27, miR-185, and miR-130b all resulted in decreased HCV replication, and in the case
of miR-185 and miR-130b, decreased HCV virion production. Our work establishes that
modulation of the expression of hepatic miRNAs regulating lipid metabolism can influence
HCV proliferation. Future work should concentrate on the effects of these miRNAs on
different stages of the viral life cycle.
miR-27a/b
We attributed miR-27’s anti-viral effects to PPAR-α repression yielding disruption of
HCV replication complexes, as we had previously observed with a PPAR-α antagonist

115
Figure 5.1. HCV-modulated miRNAs’ influence on HCV-host interactions in lipid
pathways. HCV infection represses miR-130b and miR-185 expression and stimulates
miR-27 expression to promote hepatocellular lipid accumulation through dysregulation of
these miRNAs’ targets (shown on right). The miRNAs and proteins that promote lipid
accumulation are highlighted in green and up-regulated in HCV infected cells; conversely
miRNAs and proteins inhibitory to this process are highlighted in red. Adapted from Current
Opinion in Virology (2014), Vol. 7, Singaravelu, Russell, Tyrrell & Pezacki, Hepatitis C
virus and microRNAs: miRed in a host of possibilities, pp. 1-10, with permission from
Elsevier.

116
(Lyn et al., 2009). Subsequent work has suggested miR-27-mediated regulation of LDLR
expression also contributes to miR-27a’s anti-viral effects in HCV-infected mesenchymal
cell-derived hepatocyte-like cells (Choi et al., 2014). Examination of miR-27’s effects on
HCV replication in LDLR deficient and PPAR-α deficient cell lines should enable
discrimination of the relevant contribution of these targets to miR-27’s anti-viral effects.
Future studies in these directions will help unravel the mechanistic details of miR-27’s
influence on the virus.
In addition to PPAR-α regulation, miR-27’s influence on hepatic steatosis also
appeared to be derived from down-regulation of ANGPTL3, a negative regulator of hepatic
lipid uptake (Singaravelu et al., 2014a). Subsequent work confirmed decreased ANGPTL3
expression in HCV infected patients (Foka et al., 2014), consistent with HCV’s induction of
miR-27 expression in vivo (Selitsky et al., 2015; Shirasaki et al., 2013). However, the
authors of this study suggested HCV core represses ANGPTL3 expression at the level of
transcription, through inhibition of the liver enriched transcription factor hepatocyte nuclear
factor 1 (HNF1) (Foka et al., 2014). Taken together with our observations (Singaravelu et
al., 2014a), it appears that HCV has evolved multiple mechanisms to regulate ANGPTL3
expression to increase hepatocyte lipid uptake. Future work should evaluate the relative
importance of these mechanisms.
miR-185
miR-185 repressed the expression of host factors with roles in HCV entry (LDLR and
SCARB1), replication (SCD1 and AGPAT3), assembly (SREBP2), and cell-to-cell
transmission (SCARB1) (Singaravelu et al., 2015b). This is an excellent example of a
miRNA, which has evolved to regulate multiple nodes of a functionally-associated gene
network to have a greater overall regulatory effect. Furthermore, given the intimate link

117
between HCV and lipids, the regulation of multiple aspects of hepatic lipid metabolism also
confers miR-185 significant regulatory effects on the HCV life cycle. Future work should to
aim identify and study the relevant contribution of each target to miR-185’s overall anti-viral
effects on the viral life cycle.
miR-130b
miR-130b also exhibited significant anti-viral effects against HCV; however, we
weren’t able to establish a clear link between its regulation of hepatic lipid storage, through
targeting of PPAR-γ and LDLR, to its inhibition of HCV replication (Singaravelu et al.,
2015b). Interestingly, the miR-130 family has been shown to exhibit anti-viral activity
against several different viruses, albeit via different mechanisms. miR-130a’s regulation of
PPAR-γ yields anti-viral effects against another hepatotropic virus, hepatitis B virus (HBV)
as PPAR-γ stimulates HBV replication (Huang et al., 2015). An independent study
demonstrated that miR-130 family inhibits porcine reproductive and respiratory syndrome
virus (PRRSV) replication, both in vitro and in vivo, through direct interaction with the
5’UTR of the viral genome (Li et al., 2015). Independent of these unique mechanisms, miR-
130b may have a broadly anti-viral role mediated through stimulation of IFN production, as
demonstrated by our group and others in hepatoma cells (Li et al., 2014; Singaravelu et al.,
2015b); however, the mechanism by which miR-130b regulates the innate immune response
remains unclear, and future work should aim to delineate the miRNA’s mechanism of action.
miR-7
In Chapter 4, we compared the miRNA signatures associated with 25-HC treatment
and PPAR-α antagonism to identify miRNAs mediating cross-talk between PPAR, LXR, and
SREBP signaling. In general, this may be an effective strategy to elucidate non-coding
RNAs that enable two different signaling pathways to “communicate”. Using this strategy,

118
we uncovered a role for miR-7 in regulating hepatic lipid metabolism. Our gene expression
profiling results suggested miR-7 mediates cross-talk between LXR-β and PPAR-α-regulated
pathways, and stimulates SREBP1 signaling. These are all pathways that have been
implicated in the HCV life cycle; therefore, it is likely that miR-7 influences HCV
proliferation. Regulation of SREBP signaling should have an impact on HCV assembly,
since this stage of the viral life cycle is dependent on LD accumulation (Li et al., 2013a).
Future work should investigate the effect of miR-7 on the different stages of the HCV life
cycle.
Interestingly, the HBV protein X (HBx) activates miR-7 expression in hepatoma cells
(Chen et al., 2013). Although HBV and HCV belong to phylogenetically unrelated families
of viruses, chronic HBV infection can also result in disruption of hepatic lipid homeostasis in
patients. In particular, HBx-transgenic mice display increased SREBP1 expression (Kim et
al., 2007). Taken together with our study’s results, HBx-induced miR-7 expression may
contribute to the viral protein’s activation of SREBP1-mediated lipogenesis and HBV-
associated aberrant lipid metabolism.
miRNAs and HCV-associated steatosis
HCV genotype 3a infection is associated with increased severity of steatosis (Rubbia-
Brandt et al., 2000), which has been associated with accelerated rate of fibrosis (Asselah et
al., 2006). A few molecular determinants have been identified to explain this genotype-
specific phenomenon (Roingeard, 2013), with the HCV core protein appears to play a
predominant role (Abid et al., 2005; Clément et al., 2011; Hourioux et al., 2007; Jhaveri et
al., 2008). Since miR-130b, miR-185, and miR-7 regulate PPAR and SREBP signaling,
two pathways linked to the increased severity of steatosis in HCV genotype 3a infected
patients (Roingeard, 2013), future work should analyze the effects of viral diversity on the

119
modulation of these miRNAs’ expression levels. It is plausible that differential modulation
of non-coding RNA expression may rationalize the differences in the severity of steatosis
between HCV genotypes.
Recent work has shed light on the potential of serum miRNAs as non-invasive
biomarkers of liver disease (Bala et al., 2012). In fact, the levels of miR-16, miR-33, miR-
34a, miR-122, miR-136, and miR-224 have already been found to correlate with the
presence or severity of HCV steatosis (Boštjančič et al., 2015; Cermelli et al., 2011; Lendvai
et al., 2014). Future work should similarly examine the prognostic value of serum miR-7,
miR-185, miR-130b, and miR-27 levels in similar contexts.
Systematic approaches to identify miRNAs regulating virus-associated
pathways
Several studies have demonstrated aberrant miRNA expression during viral infection.
It appears that viruses utilize modulation of host miRNA expression as a common strategy to
fine tune specific host pathways influencing viral pathogenesis (Kim et al., 2015; Kitab et al.,
2015; Singaravelu et al., 2014b). Traditional miRNA profiling studies, comparing the
miRNA signatures of virus-infected and healthy cells, can produce several miRNA
candidates of potential interest. It remains challenging to prioritize which of these miRNAs
are likely to influence the virus through regulation of host pathways, and, therefore, warrant
functional analysis. Furthermore, given the context-specific function of miRNAs,
elucidation of the function of miRNAs based off nucleotide sequence isn’t always
straightforward, as evidenced by the false positives and false negatives associated with
individual computational algorithms for miRNA target prediction (Min and Yoon, 2010).

120
One strategy to identify pro- and anti-viral miRNAs, which circumvents the need to
characterize miRNA function is screening of miRNA inhibitors and mimics. In fact, this
strategy proved quite effective in was able to identify miR-199a-3p as an inhibitor of the
herpesvirus family through regulation of the PI3K pathway (Santhakumar et al., 2010).
However, this type of strategy can prove laborious, and it can prove costly to purchase
mimics and/or inhibitors for each individual miRNA of interest. Our work herein developed
a more rapid and cost-effective approach.
My thesis work described the use of small molecules to systematically identify
miRNA regulators of HCV-associated host pathways (SMART). SMART comprises of a
comparison of the miRNA signature of viral infection to the miRNA signature associated
with inhibition of a virus-associated host pathway to produce a list of miRNAs modulated by
the virus to hijack the specific host pathway. Our work utilized a small molecule modulator
of specific host pathways associated with HCV’s life cycle, 25-HC, to identify miR-185 as a
regulator of the HCV’s hijacking of hepatic lipid metabolism. Specifically, the use of 25-HC
allowed us to filter putative pathologically relevant miR-185 targets by focusing on genes
with functional roles in metabolic pathways. Collectively, this demonstrates the potential of
the SMART strategy to not only identify anti-viral miRNAs, but, in parallel, the host
pathways regulated by miRNAs to influence the virus.
This strategy could easily be extended to identify miRNAs regulating other microbes’
pathogenesis, and different host pathways could be targeted through the use of appropriate
small molecules. This approach could also be applied to look at the role of other non-coding
RNA families in microbe pathogenesis. For example, we currently have a limited
understanding of lncRNAs’ functions; however, given their implication in diverse biological
processes (Zhao and Lin, 2015), it is likely that a subset of these lncRNAs have the capacity

121
to influence viral pathogenesis, and the application of an adapted SMART strategy could
prove useful in determining these lncRNAs’ identities.
In future implementations of the SMART strategy, it may prove beneficial to utilize
siRNAs targeting major regulators of host pathways of interest to produce a complementary
miRNA profile for analysis. Comparison of small molecule and siRNA-associated miRNA
profiles would help distinguish changes in miRNA expression resulting from off-target
effects of the small molecule (and the siRNA). Also, comparing miRNA profiles associated
with an agonist and an antagonist of the virus-associated host pathway may allow one to
further enrich the list of candidates for miRNAs regulating the pathway of interest.
In future work, it will also be of interest to consider the impact of single nucleotide
polymorphisms (SNPs) on miRNA regulation of host-virus interactions. A recent report
described an alternative approach for genome-wide identification of miRNAs with regulatory
functions in lipid homeostasis based on their proximity of the gene loci encoding the
miRNAs to SNPs associated with abnormal circulating lipid levels to disease (Wagschal et
al., 2015). In the latter study, the authors also identified miR-130b as a regulator of
cholesterol-lipoprotein trafficking through repression of LDLR (Wagschal et al., 2015),
consistent with our results (Singaravelu et al., 2015b). As genetic variants influencing the
progression of HCV infection have been identified, it is worth considering whether non-
coding RNAs expressed from genomic regions in proximity to these SNPs regulate HCV
proliferation through regulation of HCV-associated host pathways. When located in the
3’UTR encoding exons, SNPs also have the potential to alter miRNA regulation of host-virus
interactions through disrupting miRNA regulation of host transcripts. This phenomenon was
previously described for a functional polymorphism in the 3’UTR of IFNL3, a gene
encoding IFN-λ3 (McFarland et al., 2014). This SNP disrupted the binding of HCV-induced

122
miRNAs, miR-208b and miR-499a, to the IFNL3 3’UTR, yielding increased stability of the
IFNL3 mRNA, potentially explaining the SNP’s link to a viral clearance (McFarland et al.,
2014). Since several studies have identified SNPs associated with the course and outcome
of HCV infection (Matsuura and Tanaka, 2015), including SNPs in human lipid metabolism-
associated genes, such as LDLR, MTTP, PPARG, and patatin-like phospholipase family 3
protein (PNPLA3) (Cai et al., 2011; Hennig et al., 2002), it is tempting to speculate that a
subset of these SNPs alter non-coding RNA regulation of HCV’s hijacking of lipid
pathways.
miR-185 and 25-HC mediated innate anti-viral response
Our work has highlighted a novel role for miR-185 in the immunometabolic
response. We demonstrated that 25-HC induction of miR-185 in the liver helps combat viral
infection. Future work will examine if this mechanism is conserved in the context of other
tissues. Since the publication of our study elucidating miR-185’s involvement in 25-
hydroxycholesterol-mediated suppression of lipid metabolic pathways during the anti-viral
response (Singaravelu et al., 2015b), York et al. described a stimulatory role for suppression
of cholesterol biosynthesis in interferon signaling (York et al., 2015). Inhibition of lipid
biosynthesis primes interferon signaling as illustrated by the heightened anti-viral immunity
observed in SREBP2-/- mouse embryonic fibroblasts and SCAP-/- bone marrow-derived
macrophages (York et al., 2015). This priming effect was attributed to increased activity of
the ER resident protein Stimulator of Interferon Genes (STING), an inducer of interferon
production (York et al., 2015). This suggests that, in addition to depriving viruses of
cholesterol required for their life cycles, miR-185’s inhibition of cholesterol likely stimulates

123
the STING-dependent activation of IFN signaling as part of the anti-viral response. The
majority of our work investigated miR-185’s function was performed in Huh7.5 cells, which
are deficient in the production of interferon. It will be of interest to examine whether miR-
185 has enhanced anti-viral effects in cell lines with robust IFN production.
In addition to its anti-viral effects, recent work highlighted a role for 25-HC in the
regulation of inflammasome activity (Reboldi et al., 2014). SREBP transcriptionally
activates interleukin 1B (IL-1B) expression, and 25-HC-mediated inhibition of SREBP
processing leads to suppression of IL-1B activated inflammation (Reboldi et al., 2014).
Since miR-185 represses the expression of SREBPs (Singaravelu et al., 2015b), future work
should examine if miR-185 similarly represses IL1B-driven inflammation.
General conclusions
In my thesis work, we established novel miRNA/mRNA regulatory modules that act
as a critical regulatory layer in metabolic signaling pathways. Our miRNA profiling work
revealed miR-27, miR-130b, miR-7, and miR-185 as miRNAs which co-operate to maintain
triglyceride and cholesterol homeostasis in the liver. We also developed a systematic
approach to identify miRNAs regulating virus-associated host pathways. The Small
Molecule-mediated annotation of miRNAs targets (SMART) approach allowed for facile
identification of miRNAs capable of influencing viruses through regulation of critical host
pathways. HCV modulates the expression of miR-27, miR-130b and miR-185 to promote
hepatic lipid accumulation, and increasing the levels of these three miRNAs could
independently inhibit the virus. We also identified miR-185 as a regulator of the 25-HC-
mediated immunometabolic anti-viral response. Interestingly, HCV counteracts these anti-
viral effects by actively suppressing miR-185 expression. Overall, my thesis work

124
highlighted miRNAs as regulators of hepatic metabolism and point to exciting roles for
miRNAs as mediators of the emerging link between lipid pathways and innate immunity.

125
References
Abe, K., Kurata, T., Teramoto, Y., Shiga, J., and Shikata, T. (1993). Lack of susceptibility of
various primates and woodchucks to hepatitis C virus. J. Med. Primatol. 22, 433-434.
Abid, K., Pazienza, V., de Gottardi, A., Rubbia-Brandt, L., Conne, B., Pugnale, P., Rossi, C.,
Mangia, A., and Negro, F. (2005). An in vitro model of hepatitis C virus genotype 3a-
associated triglycerides accumulation. J. Hepatol. 42, 744-751.
Adams, C.M., Reitz, J., De Brabander, J.K., Feramisco, J.D., Li, L., Brown, M.S., and
Goldstein, J.L. (2004). Cholesterol and 25-hydroxycholesterol inhibit activation of SREBPs
by different mechanisms, both involving SCAP and Insigs. J. Biol. Chem. 279, 52772-
52780.
Agarwal, V., Bell, G.W., Nam, J.-W., and Bartel, D.P. (2015). Predicting effective
microRNA target sites in mammalian mRNAs. eLife 4, e05005.
Agostini, M., and Knight, R.A. (2014). miR-34: from bench to bedside. Oncotarget 5, 872-
881
Albecka, A., Belouzard, S., de Beeck, A.O., Descamps, V., Goueslain, L., Bertrand-Michel,
J., Tercé, F., Duverlie, G., Rouillé, Y., and Dubuisson, J. (2012). Role of low-density
lipoprotein receptor in the hepatitis C virus life cycle. Hepatology 55, 998-1007.
Alisi, A., Da Sacco, L., Bruscalupi, G., Piemonte, F., Panera, N., De Vito, R., Leoni, S.,
Bottazzo, G.F., Masotti, A., and Nobili, V. (2011). Mirnome analysis reveals novel
molecular determinants in the pathogenesis of diet-induced nonalcoholic fatty liver disease.
Lab. Invest. 91, 283-293.
Alter, H.J., Purcell, R.H., Holland, P.V., and Popper, H. (1978). Transmissible agent in non-
A, non-B hepatitis. Lancet 1, 459-463.
Alvisi, G., Madan, V., and Bartenschlager, R. (2011). Hepatitis C virus and host cell lipids:
An intimate connection. RNA Biol. 8, 258-269.
Amako, Y., Tsukiyama-Kohara, K., Katsume, A., Hirata, Y., Sekiguchi, S., Tobita, Y.,
Hayashi, Y., Hishima, T., Funata, N., Yonekawa, H., et al. (2010). Pathogenesis of hepatitis
C virus infection in Tupaia belangeri. J. Virol. 84, 303-311.
Amini-Bavil-Olyaee, S., Choi, Youn J., Lee, Jun H., Shi, M., Huang, I.-C., Farzan, M., and
Jung, Jae U. (2013). The antiviral effector IFITM3 disrupts intracellular cholesterol
homeostasis to block viral entry. Cell Host Microbe 13, 452-464.
André, P., Komurian-Pradel, F., Deforges, S., Perret, M., Berland, J.L., Sodoyer, M., Pol, S.,
Bréchot, C., Paranhos-Baccalà, G., and Lotteau, V. (2002). Characterization of low- and
very-low-density hepatitis C virus RNA-containing particles. J. Virol. 76, 6919-6928.
Asselah, T., Rubbia-Brandt, L., Marcellin, P., and Negro, F. (2006). Steatosis in chronic
hepatitis C: Why does it really matter? Gut 55, 123-130.
Bala, S., Petrasek, J., Mundkur, S., Catalano, D., Levin, I., Ward, J., Alao, H., Kodys, K.,
and Szabo, G. (2012). Circulating microRNAs in exosomes indicate hepatocyte injury and
inflammation in alcoholic, drug-induced, and inflammatory liver diseases. Hepatology 56,
1946-1957.

126
Banaudha, K., Kaliszewski, M., Korolnek, T., Florea, L., Yeung, M.L., Jeang, K.T., and
Kumar, A. (2011). MicroRNA silencing of tumor suppressor DLC-1 promotes efficient
hepatitis C virus replication in primary human hepatocytes. Hepatology 53, 53-61.
Bandyopadhyay, S., Friedman, R.C., Marquez, R.T., Keck, K., Kong, B., Icardi, M.S.,
Brown, K.E., Burge, C.B., Schmidt, W.N., Wang, Y., et al. (2011). Hepatitis C virus
infection and hepatic stellate cell activation downregulate miR-29: miR-29 Overexpression
reduces hepatitis C viral abundance in culture. J. Infect. Dis. 203, 1753-1762.
Barad, O., Meiri, E., Avniel, A., Aharonov, R., Barzilai, A., Bentwich, I., Einav, U., Gilad,
S., Hurban, P., Karov, Y., et al. (2004). MicroRNA expression detected by oligonucleotide
microarrays: system establishment and expression profiling in human tissues. Genome Res.
14, 2486-2494.
Barba, G., Harper, F., Harada, T., Kohara, M., Goulinet, S., Matsuura, Y., Eder, G., Schaff,
Z., Chapman, M.J., Miyamura, T., et al. (1997). Hepatitis C virus core protein shows a
cytoplasmic localization and associates to cellular lipid storage droplets. Proc. Natl. Acad.
Sci. USA 94, 1200-1205.
Barretto, N., Sainz, B., Hussain, S., and Uprichard, S.L. (2014). Determining the
involvement and therapeutic implications of host cellular factors in hepatitis C virus cell-to-
cell spread. J. Virol. 88, 5050-5061.
Bartel, D.P. (2009). MicroRNAs: Target tecognition and regulatory functions. Cell 136, 215-
233.
Bartenschlager, R., Penin, F., Lohmann, V., and André, P. (2011). Assembly of infectious
hepatitis C virus particles. Trends Microbiol. 19, 95-103.
Bassendine, M.F., Sheridan, D.A., Bridge, S.H., Felmlee, D.J., and Neely, R.D.G. (2012).
Lipids and HCV. Semin. Immunopathol. 35, 87-100.
Berger, K.L., Kelly, S.M., Jordan, T.X., Tartell, M.A., and Randall, G. (2011). Hepatitis C
virus stimulates the phosphatidylinositol 4-kinase III alpha-dependent phosphatidylinositol
4-phosphate production that is essential for its replication. J. Virol. 85, 8870-8883.
Bissig, K.-D., Wieland, S.F., Tran, P., Isogawa, M., Le, T.T., Chisari, F.V., and Verma, I.M.
(2010). Human liver chimeric mice provide a model for hepatitis B and C virus infection and
treatment. J. Clin. Invest. 120, 924-930.
Blais, D.R., Nasheri, N., McKay, C.S., Legault, M.C.B., and Pezacki, J.P. (2012). Activity-
based protein profiling of host–virus interactions. Trends Biotechnol. 30, 89-99.
Blanc, M., Hsieh, Wei Y., Robertson, Kevin A., Kropp, Kai A., Forster, T., Shui, G., Lacaze,
P., Watterson, S., Griffiths, Samantha J., Spann, Nathanael J., et al. (2013). The transcription
factor STAT-1 couples macrophage synthesis of 25-hydroxycholesterol to the interferon
antiviral response. Immunity 38, 106-118.
Blanc, M., Hsieh, W.Y., Robertson, K.A., Watterson, S., Shui, G., Lacaze, P., Khondoker,
M., Dickinson, P., Sing, G., Rodríguez-Martín, S., et al. (2011). Host defense against viral
infection involves interferon mediated down-regulation of sterol biosynthesis. PLoS Biol. 9,
e1000598.

127
Blight, K.J., Kolykhalov, A.A., and Rice, C.M. (2000). Efficient initiation of HCV RNA
replication in cell culture. Science 290, 1972-1974.
Blight, K.J., McKeating, J.A., and Rice, C.M. (2002). Highly permissive cell lines for
subgenomic and genomic hepatitis C virus RNA replication. J. Virol. 76, 13001-13014.
Boergesen, M., Pedersen, T.Å., Gross, B., van Heeringen, S.J., Hagenbeek, D., Bindesbøll,
C., Caron, S., Lalloyer, F., Steffensen, K.R., Nebb, H.I., et al. (2012). Genome-wide
profiling of liver X receptor, retinoid X receptor, and peroxisome proliferator-activated
receptor α in mouse liver reveals extensive sharing of binding sites. Mol. Cell. Biol. 32, 852-
867.
Borawski, J., Troke, P., Puyang, X., Gibaja, V., Zhao, S., Mickanin, C., Leighton-Davies, J.,
Wilson, C.J., Myer, V., CornellaTaracido, I., et al. (2009). Class III phosphatidylinositol 4-
kinase alpha and beta are novel host factor regulators of hepatitis C virus replication. J.
Virol. 83, 10058-10074.
Boštjančič, E., Bandelj, E., Luzar, B., Poljak, M., and Glavač, D. (2015). Hepatic expression
of miR-122, miR-126, miR-136 and miR-181a and their correlation to histopathological and
clinical characteristics of patients with hepatitis C. J. Viral. Hepat. 22, 146-157.
Boulant, S., Douglas, M.W., Moody, L., Budkowska, A., Targett-Adams, P., and
McLauchlan, J. (2008). Hepatitis C virus core protein induces lipid droplet redistribution in a
microtubule- and dynein-dependent manner. Traffic 9, 1268-1282.
Boulant, S., Targett-Adams, P., and McLauchlan, J. (2007). Disrupting the association of
hepatitis C virus core protein with lipid droplets correlates with a loss in production of
infectious virus. J. Gen. Virol. 88, 2204-2213.
Bradley, D., McCaustland, K., Krawczynski, K., Spelbring, J., Humphey, C., and Cook, E.H.
(1991). Hepatitis C virus: Buoyant density if the factor VIII-derived isolate in sucrose. J.
Med. Virol. 34, 206-208.
Brimacombe, C.L., Grove, J., Meredith, L.W., Hu, K., Syder, A.J., Flores, M.V., Timpe,
J.M., Krieger, S.E., Baumert, T.F., Tellinghuisen, T.L., et al. (2011). Neutralizing antibody-
resistant hepatitis C virus cell-to-cell transmission. J. Virol. 85, 596-605.
Brown, M.S., and Goldstein, J.L. (1999). A proteolytic pathway that controls the cholesterol
content of membranes, cells, and blood. Proc. Natl. Acad. Sci. USA 96, 11041-11048.
Cai, T., Dufour, J.-F., Muellhaupt, B., Gerlach, T., Heim, M., Moradpour, D., Cerny, A.,
Malinverni, R., Kaddai, V., Bochud, M., et al. (2011). Viral genotype-specific role of
PNPLA3, PPARG, MTTP, and IL28B in hepatitis C virus-associated steatosis. J. Hepatol.
55, 529-535.
Calattini, S., Fusil, F., Mancip, J., Dao Thi, V.L., Granier, C., Gadot, N., Scoazec, J.-Y.,
Zeisel, M.B., Baumert, T.F., Lavillette, D., et al. (2015). Functional and biochemical
characterization of hepatitis C virus (HCV) particles produced in a humanized liver mouse
model. J. Biol. Chem. 290, 23173-23187.
Camus, G., Herker, E., Modi, A.A., Haas, J.T., Ramage, H.R., Farese, R.V., and Ott, M.
(2013). Diacylglycerol acyltransferase-1 localizes hepatitis C virus NS5A protein to lipid

128
droplets and enhances NS5A interaction with the viral capsid core. J. Biol. Chem. 288, 9915-
9923.
Camus, G., Schweiger, M., Herker, E., Harris, C., Kondratowicz, A.S., Tsou, C.-L., Farese,
R.V., Herath, K., Previs, S.F., Roddy, T.P., et al. (2014). The hepatitis C virus core protein
inhibits adipose triglyceride lipase (ATGL)-mediated lipid mobilization and enhances the
ATGL interaction with Comparative Gene Identification 58 (CGI-58) and Lipid Droplets. J.
Biol. Chem. 289, 35770-35780.
Carr, R.M., and Ahima, R.S. (2015). Pathophysiology of lipid droplet proteins in liver
diseases. Exp. Cell Res., in press.
Carthew, R.W., and Sontheimer, E.J. (2009). Origins and Mechanisms of miRNAs and
siRNAs. Cell 136, 642-655.
Catanese, M.T., and Dorner, M. (2015). Advances in experimental systems to study hepatitis
C virus in vitro and in vivo. Virology 479-480, 221-233.
Catanese, M.T., Loureiro, J., Jones, C.T., Dorner, M., von Hahn, T., and Rice, C.M. (2013).
Different requirements for scavenger receptor class B Type I in hepatitis C virus cell-free
versus cell-to-cell Transmission. J. Virol. 87, 8282-8293.
Cermelli, S., Ruggieri, A., Marrero, J.A., Ioannou, G.N., and Beretta, L. (2011). Circulating
microRNAs in patients with chronic hepatitis C and non-alcoholic fatty liver disease. PLoS
ONE 6, e23937.
Charlton, M., Ruppert, K., Belle, S.H., Bass, N., Schafer, D., Wiesner, R.H., Detre, K., Wei,
Y., and Everhart, J. (2004). Long-term results and modeling to predict outcomes in recipients
with HCV infection: Results of the NIDDK liver transplantation database. Liver Transpl. 10,
1120-1130.
Chen, C., Ridzon, D.A., Broomer, A.J., Zhou, Z., Lee, D.H., Nguyen, J.T., Barbisin, M., Xu,
N.L., Mahuvakar, V.R., Andersen, M.R., et al. (2005). Real-time quantification of
microRNAs by stem–loop RT–PCR. Nucleic Acids Res. 33, e179.
Chen, I.Y., and Ichinohe, T. (2015). Response of host inflammasomes to viral infection.
Trends Microbiol. 23, 55-63.
Chen, J., Bardes, E.E., Aronow, B.J., and Jegga, A.G. (2009). ToppGene Suite for gene list
enrichment analysis and candidate gene prioritization. Nucleic Acids Res. 37, W305-W311.
Chen, W.-J., Yin, K., Zhao, G.-J., Fu, Y.-C., and Tang, C.-K. (2012). The magic and mystery
of MicroRNA-27 in atherosclerosis. Atherosclerosis 222, 314-323.
Chen, Y.J., Chien, P.H., Chen, W.S., Chien, Y.F., Hsu, Y.Y., Wang, L.Y., Chen, J.Y., Lin,
C.W., Huang, T.C., Yu, Y.L., et al. (2013). Hepatitis B virus-encoded X protein
downregulates EGFR expression via inducing microRNA-7 in hepatocellular carcinoma
cells. Evid. Based Complement. Alternat. Med. 2013, 682380.
Cheng, J.-C., Yeh, Y.-J., Tseng, C.-P., Hsu, S.-D., Chang, Y.-L., Sakamoto, N., and Huang,
H.-D. (2012). Let-7b is a novel regulator of hepatitis C virus replication. Cell. Mol. Life Sci.
69, 2621-2633.

129
Cheng, Y., Dharancy, S., Malapel, M., and Desreumaux, P. (2005). Hepatitis C virus
infection down-regulates the expression of peroxisome proliferator-activated receptor alpha
and carnitine palmitoyl acyl-CoA transferase 1A. World J. Gastroenterol. 11, 7591-7596.
Chi, S.W., Hannon, G.J., and Darnell, R.B. (2012). An alternative mode of microRNA target
recognition. Nat. Struct. Mol. Biol. 19, 321-327.
Choi, J.E., Hur, W., Kim, J.-H., Li, T.Z., Lee, E.B., Lee, S.W., Kang, W., Shin, E.-C.,
Wakita, T., and Yoon, S.K. (2014). MicroRNA-27a modulates HCV infection in
differentiated hepatocyte-like cells from adipose tissue-derived mesenchymal stem cells.
PLoS ONE 9, e91958.
Choo, Q.L., Kuo, G., Weiner, A.J., Overby, L.R., Bradley, D.W., and Houghton, M. (1989).
Isolation of a cDNA clone derived from a blood-borne non-A, non-B viral hepatitis genome.
Science 244, 359-362.
Chukkapalli, V., Heaton, N.S., and Randall, G. (2012). Lipids at the interface of virus–host
interactions. Curr. Opin. Microbiol. 15, 512-518.
Civra, A., Cagno, V., Donalisio, M., Biasi, F., Leonarduzzi, G., Poli, G., and Lembo, D.
(2014). Inhibition of pathogenic non-enveloped viruses by 25-hydroxycholesterol and 27-
hydroxycholesterol. Sci. Rep. 4, 7487.
Clément, S., Peyrou, M., Sanchez-Pareja, A., Bourgoin, L., Ramadori, P., Suter, D.,
Vinciguerra, M., Guilloux, K., Pascarella, S., Rubbia-Brandt, L., et al. (2011). Down-
regulation of phosphatase and tensin homolog by hepatitis C virus core 3a in hepatocytes
triggers the formation of large lipid droplets. Hepatology 54, 38-49.
Colin, S., Briand, O., Touche, V., Wouters, K., Baron, M., Pattou, F., Hanf, R., Tailleux, A.,
Chinetti, G., Staels, B., et al. (2013). Activation of intestinal peroxisome proliferator-
activated receptor-α increases high-density lipoprotein production. Eur. Heart J. 34, 2566-
2574.
Coller, K.E., Heaton, N.S., Berger, K.L., Cooper, J.D., Saunders, J.L., and Randall, G.
(2012). Molecular determinants and dynamics of hepatitis C virus secretion. PLoS Pathog. 8,
e1002466.
Cullen, B.R. (2011). Herpesvirus microRNAs: phenotypes and functions. Curr. Opin. Virol.
1, 211-215.
Cusi, K. (2014). The relationship between hepatitis C virus infection and diabetes: Time for a
divorce? Hepatology 60, 1121-1123.
Dambal, S., Shah, M., Mihelich, B., and Nonn, L. (2015). The microRNA-183 cluster: the
family that plays together stays together. Nucleic Acids Res. 43, 7173-7188.
Dao Thi, V.L., Granier, C., Zeisel, M.B., Guérin, M., Mancip, J., Granio, O., Penin, F.,
Lavillette, D., Bartenschlager, R., Baumert, T.F., et al. (2012). Characterization of hepatitis
C virus particle subpopulations reveals multiple usage of the scavenger receptor BI for entry
steps. J. Biol. Chem. 287, 31242-31257.
Dávalos, A., Goedeke, L., Smibert, P., Ramírez, C.M., Warrier, N.P., Andreo, U., Cirera-
Salinas, D., Rayner, K., Suresh, U., Pastor-Pareja, J.C., et al. (2011). miR-33a/b contribute to

130
the regulation of fatty acid metabolism and insulin signaling. Proc. Natl. Acad. Sci. USA
108, 9232-9237.
Delang, L., Paeshuyse, J., and Neyts, J. (2012). The role of phosphatidylinositol 4-kinases
and phosphatidylinositol 4-phosphate during viral replication. Biochem. Pharmacol. 84,
1400-1408.
Dharancy, S., Malapel, M., Perlemuter, G., Roskams, T., Cheng, Y., Dubuquoy, L., Podevin,
P., Conti, F., Canva, V., Philippe, D., et al. (2005). Impaired expression of the peroxisome
proliferator-activated receptor alpha during hepatitis C virus infection. Gastroenterology 128,
334-342.
Diamond, D.L., Syder, A.J., Jacobs, J.M., Sorensen, C.M., Walters, K.-A., Proll, S.C.,
McDermott, J.E., Gritsenko, M.A., Zhang, Q., Zhao, R., et al. (2010). Temporal proteome
and lipidome profiles reveal hepatitis C virus-associated reprogramming of hepatocellular
metabolism and bioenergetics. PLoS Pathog. 6, e1000719.
Djebali, S., Davis, C.A., Merkel, A., Dobin, A., Lassmann, T., Mortazavi, A., Tanzer, A.,
Lagarde, J., Lin, W., Schlesinger, F., et al. (2012). Landscape of transcription in human cells.
Nature 489, 101-108.
Dooley, J., Garcia-Perez, J.E., Sreenivasan, J., Schlenner, S.M., Vangoitsenhoven, R.,
Papadopoulou, A.S., Tian, L., Schonefeldt, S., Serneels, L., Deroose, C., et al. (2016). The
microRNA-29 family dictates the balance between homeostatic and pathological glucose
handling in diabetes and obesity. Diabetes 65, 53-61.
Dorner, M., Horwitz, J.A., Donovan, B.M., Labitt, R.N., Budell, W.C., Friling, T., Vogt, A.,
Catanese, M.T., Satoh, T., Kawai, T., et al. (2013). Completion of the entire hepatitis C virus
life cycle in genetically humanized mice. Nature 501, 237-241.
Dorner, M., Horwitz, J.A., Robbins, J.B., Barry, W.T., Feng, Q., Mu, K., Jones, C.T.,
Schoggins, J.W., Catanese, M.T., Burton, D.R., et al. (2011). A genetically humanized
mouse model for hepatitis C virus infection. Nature 474, 208-211.
Dorobantu, C.M., Albulescu, L., Harak, C., Feng, Q., van Kampen, M., Strating, J.R.P.M.,
Gorbalenya, A.E., Lohmann, V., van der Schaar, H.M., and van Kuppeveld, F.J.M. (2015).
Modulation of the host lipid landscape to promote RNA virus replication: The Picornavirus
encephalomyocarditis virus converges on the pathway used by hepatitis C Virus. PLoS
Pathog. 11, e1005185.
Douam, F., Lavillette, D., and Cosset, F.-L. (2015). The mechanism of HCV entry into host
cells. In Progress in Molecular Biology and Translational Science (Academic Press), pp. 63-
107.
Dreux, M., Boson, B., Ricard-Blum, S., Molle, J., Lavillette, D., Bartosch, B., Pécheur, E.-I.,
and Cosset, F.-L.c. (2007). The exchangeable apolipoprotein ApoC-I promotes membrane
fusion of hepatitis C virus. J. Biol. Chem. 282, 32357-32369.
Ducheix, S., Podechard, N., Lasserre, F., Polizzi, A., Pommier, A., Murzilli, S., Di Lisio, C.,
D'Amore, S., Bertrand-Michel, J., Montagner, A., et al. (2013). A systems biology approach
to the hepatic role of the oxysterol receptor LXR in the regulation of lipogenesis highlights a
cross-talk with PPARα. Biochimie 95, 556-567.

131
Dyer, B.W., Ferrer, F.A., Klinedinst, D.K., and Rodriguez, R. (2000). A noncommercial dual
luciferase enzyme assay system for reporter gene analysis. Analytical Biochemistry 282,
158-161.
Evans, M.J., von Hahn, T., Tscherne, D.M., Syder, A.J., Panis, M., Wolk, B., Hatziioannou,
T., McKeating, J.A., Bieniasz, P.D., and Rice, C.M. (2007). Claudin-1 is a hepatitis C virus
co-receptor required for a late step in entry. Nature 446, 801-805.
Fang, Y., Xue, J.-L., Shen, Q., Chen, J., and Tian, L. (2012). MicroRNA-7 inhibits tumor
growth and metastasis by targeting the phosphoinositide 3-kinase/Akt pathway in
hepatocellular carcinoma. Hepatology 55, 1852-1862.
Fauvelle, C., Felmlee, D.J., Crouchet, E., Lee, J., Heydmann, L., Lefèvre, M., Magri, A.,
Hiet, M.-S., Fofana, I., Habersetzer, F.o., et al. (2016). Apolipoprotein E mediates evasion
from hepatitis C virus neutralizing antibodies. Gastroenterology 150, 206-217.e204.
Fernández-Alvarez, A., Alvarez, M.S., Gonzalez, R., Cucarella, C., Muntané, J., and Casado,
M. (2011). Human SREBP1c expression in liver is directly regulated by peroxisome
proliferator-activated receptor α (PPARα). J. Biol. Chem. 286, 21466-21477.
Ferraris, P., Blanchard, E., and Roingeard, P. (2010). Ultrastructural and biochemical
analyses of hepatitis C virus-associated host cell membranes. J. Gen. Virol. 91, 2230-2237.
Filipe, A., and McLauchlan, J. (2015). Hepatitis C virus and lipid droplets: finding a niche.
Trends Mol. Med. 21, 34-42.
Fischl, W., and Bartenschlager, R. (2013). High-throughput screening using dengue virus
reporter genomes. In Antiviral Methods and Protocols. E.Y. Gong, ed. (Humana Press), pp.
205-219.
Foka, P., Karamichali, E., Dalagiorgou, G., Serti, E., Doumba, P.P., Pissas, G., Kakkanas,
A., Kazazi, D., Kochlios, E., Gaitanou, M., et al. (2014). Hepatitis C virus modulates lipid
regulatory factor Angiopoietin-like 3 gene expression by repressing HNF-1α activity. J.
Hepatol. 60, 30-38.
Folch, J., Lees, M., and Stanley, G.H.S. (1957). A simple method for the isolation and
pruifcation of total lipides from animal tissues. J. Biol. Chem. 226, 497-509.
Friebe, P., Boudet, J., Simorre, J.-P., and Bartenschlager, R. (2005). Kissing-loop interaction
in the 3' end of the hepatitis C virus genome essential for RNA replication. J. Virol. 79, 380-
392.
Friedman, R.C., Farh, K.K.-H., Burge, C.B., and Bartel, D.P. (2009). Most mammalian
mRNAs are conserved targets of microRNAs. Genome Res. 19, 92-105.
Fu, X., Dong, B., Tian, Y., Lefebvre, P., Meng, Z., Wang, X., Pattou, F., Han, W., Wang, X.,
Lou, F., et al. (2015). MicroRNA-26a regulates insulin sensitivity and metabolism of glucose
and lipids. J. Clin. Invest. 125, 2497-2509.
Garcia-Mediavilla, M.V., Pisonero-Vaquero, S., Lima-Cabello, E., Benedicto, I., Majano,
P.L., Jorquera, F., Gonzalez-Gallego, J., and Sanchez-Campos, S. (2012). Liver X receptor
α-mediated regulation of lipogenesis by core and NS5A proteins contributes to HCV-induced
liver steatosis and HCV replication. Lab. Invest. 92, 1191-1202.

132
Gastaminza, P., Cheng, G., Wieland, S., Zhong, J., Liao, W., and Chisari, F.V. (2008).
Cellular determinants of hepatitis C virus assembly, maturation, degradation, and secretion.
J. Virol. 82, 2120-2129.
Gearing, K.L., Göttlicher, M., Teboul, M., Widmark, E., and Gustafsson, J.A. (1993).
Interaction of the peroxisome-proliferator-activated receptor and retinoid X receptor. Proc.
Natl. Acad. Sci. USA 90, 1440-1444.
Germi, R., Crance, J.-M., Garin, D., Guimet, J., Lortat-Jacob, H., Ruigrok, R.W.H., Zarski,
J.-P., and Drouet, E. (2002). Cellular glycosaminoglycans and low density lipoprotein
receptor are involved in hepatitis C virus adsorption. J. Med. Virol. 68, 206-215.
Go, G.W., and Mani, A. (2012). Low-density lipoprotein receptor (LDLR) family
orchestrates cholesterol homeostasis. Yale J. Biol. Med. 85, 19-28.
Goldstein, J.L., DeBose-Boyd, R.A., and Brown, M.S. (2006). Protein sensors for membrane
sterols. Cell 124, 35-46.
Goldwasser, J., Cohen, P.Y., Lin, W., Kitsberg, D., Balaguer, P., Polyak, S.J., Chung, R.T.,
Yarmush, M.L., and Nahmias, Y. (2011). Naringenin inhibits the assembly and long-term
production of infectious hepatitis C virus particles through a PPAR-mediated mechanism. J.
Hepatol. 55, 963-971.
Gondar, V., Molina-Jiménez, F., Hishiki, T., García-Buey, L., Koutsoudakis, G.,
Shimotohno, K., Benedicto, I., and Majano, P.L. (2015). Apolipoprotein E, but not
apolipoprotein B, Is essential for efficient cell-to-cell transmission of hepatitis C virus. J.
Virol. 89, 9962-9973.
Graeve, M., and Janssen, D. (2009). Improved separation and quantification of neutral and
polar lipid classes by HPLC–ELSD using a monolithic silica phase: Application to
exceptional marine lipids. J. Chromatogr. B 877, 1815-1819.
Gregory, R.I., and Shiekhattar, R. (2005). MicroRNA biogenesis and cancer. Cancer Res. 65,
3509-3512.
Gu, S., Jin, L., Zhang, F., Sarnow, P., and Kay, M.A. (2009). Biological basis for restriction
of microRNA targets to the 3' untranslated region in mammalian mRNAs. Nat. Struct. Mol.
Biol. 16, 144-150.
Gudleski-O'Regan, N., Greco, Todd M., Cristea, Ileana M., and Shenk, T. (2012). Increased
expression of LDL receptor-related protein 1 during human cytomegalovirus infection
reduces virion cholesterol and infectivity. Cell Host Microbe 12, 86-96.
Harris, C., Herker, E., Farese, R.V., and Ott, M. (2011). Hepatitis C Virus Core Protein
Decreases Lipid Droplet Turnover: A mechanism for core-induced steatosis. J. Biol. Chem.
286, 42615-42625.
Heaton, N.S., and Randall, G. (2011). Multifaceted roles for lipids in viral infection. Trends
Microbiol. 19, 368-375.
Henke, J.I., Goergen, D., Zheng, J., Song, Y., Schüttler, C.G., Fehr, C., Jünemann, C., and
Niepmann, M. (2008). microRNA-122 stimulates translation of hepatitis C virus RNA.
EMBO J. 27, 3300-3310.

133
Hennig, B.J.W., Hellier, S., Frodsham, A.J., Zhang, L., Klenerman, P., Knapp, S., Wright,
M., Thomas, H.C., Thursz, M., and Hill, A.V.S. (2002). Association of low-density
lipoprotein receptor polymorphisms and outcome of hepatitis C infection. Genes Immun. 3,
359-367.
Her, G.M., Hsu, C.-C., Hong, J.-R., Lai, C.-Y., Hsu, M.-C., Pang, H.-W., Chan, S.-K., and
Pai, W.-Y. (2011). Overexpression of gankyrin induces liver steatosis in zebrafish (Danio
rerio). Biochim. Biophys. Acta 1811, 536-548.
Herker, E., Harris, C., Hernandez, C., Carpentier, A., Kaehlcke, K., Rosenberg, A.R., Farese,
R.V., and Ott, M. (2010). Efficient hepatitis C virus particle formation requires
diacylglycerol acyltransferase-1. Nat. Med. 16, 1295-1298.
Herker, E., and Ott, M. (2011). Unique ties between hepatitis C virus replication and
intracellular lipids. Trends Endocrinol. Metab. 22, 241-248.
Herker, E., and Ott, M. (2012). Emerging role of lipid droplets in host/pathogen interactions.
J. Biol. Chem. 287, 2280-2287.
Hinson, E.R., and Cresswell, P. (2009). The antiviral protein, viperin, localizes to lipid
droplets via its N-terminal amphipathic α-helix. Proc. Natl. Acad. Sci. USA 106, 20452-
20457.
Hoffmann, T.W., Gilles, D., and Abderrahmane, B. (2012). MicroRNAs and hepatitis C
virus: Toward the end of miR-122 supremacy. Virology J. 9, 1-8.
Hoofnagle, J.H. (2002). Course and outcome of hepatitis C. Hepatology 36, s21-s29.
Hooper, A.J., Burnett, J.R., and Watts, G.F. (2015). Contemporary aspects of the biology and
therapeutic regulation of the microsomal triglyceride transfer protein. Circ. Res. 116, 193-
205.
Horsham, J.L., Ganda, C., Kalinowski, F.C., Brown, R.A.M., Epis, M.R., and Leedman, P.J.
(2015). MicroRNA-7: A miRNA with expanding roles in development and disease. Int. J.
Biochem. Cell Biol. 69, 215-224.
Hourioux, C., Patient, R., Morin, A., Blanchard, E., Moreau, A., Trassard, S., Giraudeau, B.,
and Roingeard, P. (2007). The genotype 3-specific hepatitis C virus core protein residue
phenylalanine 164 increases steatosis in an in vitro cellular model. Gut 56, 1302-1308.
Hsu, N.-Y., Ilnytska, O., Belov, G., Santiana, M., Chen, Y.-H., Takvorian, P.M., Pau, C., van
der Schaar, H., Kaushik-Basu, N., Balla, T., et al. (2010). Viral reorganization of the
secretory pathway generates distinct organelles for RNA replication. Cell 141, 799-811.
Hsu, P.W.-C., Lin, L.-Z., Hsu, S.-D., Hsu, J.B.-K., and Huang, H.-D. (2007). ViTa:
prediction of host microRNAs targets on viruses. Nucleic Acids Res. 35, D381-D385.
Huang, H., Chen, Y., and Ye, J. (2007a). Inhibition of hepatitis C virus replication by
peroxidation of arachidonate and restoration by vitamin E. Proc. Natl. Acad. Sci. USA 104,
18666-18670.
Huang, H., Sun, F., Owen, D.M., Li, W., Chen, Y., Gale, M., and Ye, J. (2007b). Hepatitis C
virus production by human hepatocytes dependent on assembly and secretion of very low-
density lipoproteins. Proc. Natl. Acad. Sci. USA 104, 5848-5853.

134
Huang, J.-Y., Chou, S.-F., Lee, J.-W., Chen, H.-L., Chen, C.-M., Tao, M.-H., and Shih, C.
(2015). MicroRNA-130a can inhibit hepatitis B virus replication via targeting PGC1α and
PPARγ. RNA 21, 385-400.
Huber, M.D., Vesely, P.W., Datta, K., and Gerace, L. (2013). Erlins restrict SREBP
activation in the ER and regulate cellular cholesterol homeostasis. J. Cell Biol. 203, 427-436.
Huntzinger, E., and Izaurralde, E. (2011). Gene silencing by microRNAs: contributions of
translational repression and mRNA decay. Nat. Rev. Genet. 12, 99-110.
Ishida, H., Tatsumi, T., Hosui, A., Nawa, T., Kodama, T., Shimizu, S., Hikita, H., Hiramatsu,
N., Kanto, T., Hayashi, N., et al. (2011). Alterations in microRNA expression profile in
HCV-infected hepatoma cells: Involvement of miR-491 in regulation of HCV replication via
the PI3 kinase/Akt pathway. Biochem. Biophys. Res. Comm. 412, 92-97.
Israelow, B., Mullokandov, G., Agudo, J., Sourisseau, M., Bashir, A., Maldonado, A.Y., Dar,
A.C., Brown, B.D., and Evans, M.J. (2014). Hepatitis C virus genetics affects miR-122
requirements and response to miR-122 inhibitors. Nat. Commun. 5, 5408.
Ivey, K.N., and Srivastava, D. (2010). MicroRNAs as regulators of differentiation and cell
fate decisions. Cell Stem Cell 7, 36-41.
Jackel-Cram, C., Qiao, L., Xiang, Z., Brownlie, R., Zhou, Y., Babiuk, L., and Liu, Q. (2010).
Hepatitis C virus genotype-3a core protein enhances sterol regulatory element-binding
protein-1 activity through the phosphoinositide 3-kinase–Akt-2 pathway. J. Gen. Virol. 91,
1388-1395.
Jangra, R.K., Yi, M., and Lemon, S.M. (2010). Regulation of hepatitis C virus translation
and infectious virus production by the microRNA miR-122. J. Virol. 84, 6615-6625.
Janowski, B.A., Willy, P.J., Devi, T.R., Falck, J.R., and Mangelsdorf, D.J. (1996). An
oxysterol signalling pathway mediated by the nuclear receptor LXRα. Nature 383, 728-731.
Janssen, H.L., Reesink, H.W., Lawitz, E.J., Zeuzem, S., Rodriguez-Torres, M., Patel, K., van
der Meer, A.J., Patick, A.K., Chen, A., Zhou, Y., et al. (2013). Treatment of HCV infection
by targeting microRNA. New Engl. J. Med. 368, 1685-1694.
Jeon, T.-I., Esquejo, R.M., Roqueta-Rivera, M., Phelan, P.E., Moon, Y., Govindarajan, S.S.,
Esau, C.C., and Osborne, T.F. (2013). An SREBP-responsive microRNA operon contributes
to a regulatory loop for intracellular lipid homeostasis. Cell Metab. 18, 51-61.
Jeon, T.-I., and Osborne, T.F. (2012). SREBPs: metabolic integrators in physiology and
metabolism. Trends Endocrinol. Metab. 23, 65-72.
Jhaveri, R., McHutchison, J., Patel, K., Qiang, G., and Diehl, A.M. (2008). Specific
polymorphisms in hepatitis C virus genotype 3 core protein associated with intracellular lipid
accumulation. J. Infect. Dis. 197, 283-291.
Ji, J., Zhang, J., Huang, G., Qian, J., Wang, X., and Mei, S. (2009). Over-expressed
microRNA-27a and 27b influence fat accumulation and cell proliferation during rat hepatic
stellate cell activation. FEBS Letters 583, 759-766.
Jiang, J., Cun, W., Wu, X., Shi, Q., Tang, H., and Luo, G. (2012). Hepatitis C virus
attachment mediated by apolipoprotein E binding to cell surface heparan sulfate. J. Virol. 86,
7256-7267.

135
Jiang, J., and Luo, G. (2009). Apolipoprotein E but not B Is required for the formation of
infectious hepatitis C virus particles. J. Virol. 83, 12680-12691.
Jin, L., Wessely, O., Marcusson, E.G., Ivan, C., Calin, G.A., and Alahari, S.K. (2013).
Prooncogenic Factors miR-23b and miR-27b Are Regulated by Her2/Neu, EGF, and TNF-α
in Breast Cancer. Cancer Res. 73, 2884-2896.
Jo, Y., Sguigna, P.V., and DeBose-Boyd, R.A. (2011). Membrane-associated ubiquitin ligase
complex containing gp78 mediates sterol-accelerated degradation of 3-hydroxy-3-
methylglutaryl-coenzyme A reductase. J. Biol. Chem. 286, 15022-15031.
John, E., Wienecke-Baldacchino, A., Liivrand, M., Heinäniemi, M., Carlberg, C., and
Sinkkonen, L. (2012). Dataset integration identifies transcriptional regulation of microRNA
genes by PPARγ in differentiating mouse 3T3-L1 adipocytes. Nucleic Acids Res. 40, 4446-
4460.
Jopling, C.L., Schütz, S., and Sarnow, P. (2008). Position-dependent function for a tandem
microRNA miR-122-binding site located in the hepatitis C virus RNA genome. Cell Host
Microbe 4, 77-85.
Jopling, C.L., Yi, M., Lancaster, A.M., Lemon, S.M., and Sarnow, P. (2005). Modulation of
hepatitis C virus RNA abundance by a liver-specific microRNA. Science 309, 1577-1581.
Kapadia, S.B., and Chisari, F.V. (2005). Hepatitis C virus RNA replication is regulated by
host geranylgeranylation and fatty acids. Proc. Natl. Acad. Sci. USA 102, 2561-2566.
Kato, T., Date, T., Miyamoto, M., Furusaka, A., Tokushige, K., Mizokami, M., and Wakita,
T. (2003). Efficient replication of the genotype 2a hepatitis C virus subgenomic replicon.
Gastroenterology 125, 1808-1817.
Kato, T., Furusaka, A., Miyamoto, M., Date, T., Yasui, K., Hiramoto, J., Nagayama, K.,
Tanaka, T., and Wakita, T. (2001). Sequence analysis of hepatitis C virus isolated from a
fulminant hepatitis patient. J. Med. Virol. 64, 334-339.
Kennedy, D.C., Lyn, R.K., and Pezacki, J.P. (2009). Cellular lipid metabolism is influenced
by the coordination environment of copper. J. Am. Chem. Soc. 131, 2444-2445.
Kennedy, D.C., McKay, C.S., Legault, M.C., Danielson, D.C., Blake, J.A., Pegoraro, A.F.,
Stolow, A., Mester, Z., and Pezacki, J.P. (2011). Cellular consequences of copper complexes
used to catalyze bioorthogonal click reactions. J. Am. Chem. Soc. 133, 17993-18001.
Khan, I., Katikaneni, D.S., Han, Q., Sanchez-Felipe, L., Hanada, K., Ambrose, R.L.,
Mackenzie, J.M., and Konan, K.V. (2014). Modulation of hepatitis C virus genome
replication by glycosphingolipids and four-phosphate adaptor protein 2. J. Virol. 88, 12276-
12295.
Kida, K., Nakajima, M., Mohri, T., Oda, Y., Takagi, S., Fukami, T., and Yokoi, T. (2011).
PPARα Is regulated by miR-21 and miR-27b in human liver. Pharm. Res. 28, 2467-2476.
Kim, K.H., Shin, H.J., Kim, K., Choi, H.M., Rhee, S.H., Moon, H.B., Kim, H.H., Yang,
U.S., Yu, D.Y., and Cheong, J. (2007). Hepatitis B virus X protein induces hepatic steatosis
via transcriptional activation of SREBP1 and PPARγ. Gastroenterology 132, 1955-1967.

136
Kim, S., Seo, D., Kim, D., Hong, Y., Chang, H., Baek, D., Kim, V.N., Lee, S., and Ahn, K.
(2015). Temporal landscape of microRNA-mediated host-virus crosstalk during productive
human cytomegalovirus infection. Cell Host Microbe 17, 838-851.
Kitab, B., Alj, H.S., Ezzikouri, S., and Benjelloun, S. (2015). MicroRNAs as important
players in host-hepatitis B virus interactions. J. Clin. Transl. Hepatol. 3, 149-161.
Kolykhalov, A.A., Agapov, E.V., Blight, K.J., Mihalik, K., Feinstone, S.M., and Rice, C.M.
(1997). Transmission of hepatitis C by intrahepatic inoculation with transcribed RNA.
Science 277, 570-574.
Kornfeld, J.-W., Baitzel, C., Konner, A.C., Nicholls, H.T., Vogt, M.C., Herrmanns, K.,
Scheja, L., Haumaitre, C., Wolf, A.M., Knippschild, U., et al. (2013). Obesity-induced
overexpression of miR-802 impairs glucose metabolism through silencing of Hnf1b. Nature
494, 111-115.
Koukiekolo, R., Jakubek, Z.J., Cheng, J., Sagan, S.M., and Pezacki, J.P. (2009). Studies of a
viral suppressor of RNA silencing p19-CFP fusion protein: A FRET-based probe for sensing
double-stranded fluorophore tagged small RNAs. Biophys. Chem. 143, 166-169.
Krahmer, N., Farese, R.V., and Walther, T.C. (2013). Balancing the fat: lipid droplets and
human disease. EMBO Mol. Med. 5, 973-983.
Kumar, A., Bühler, S., Selisko, B., Davidson, A., Mulder, K., Canard, B., Miller, S., and
Bartenschlager, R. (2013). Nuclear localization of dengue virus nonstructural protein 5 does
not strictly correlate with efficient viral RNA replication and inhibition of Type I interferon
signaling. J. Virol. 87, 4545-4557.
Kurtz, C.L., Peck, B.C.E., Fannin, E.E., Beysen, C., Miao, J., Landstreet, S.R., Ding, S.,
Turaga, V., Lund, P.K., Turner, S., et al. (2014). MicroRNA-29 fine-tunes the expression of
key FOXA2-activated lipid metabolism genes and is dysregulated in animal models of
insulin resistance and diabetes. Diabetes 63, 3141-3148.
Langhi, C., and Baldán, Á. (2015). CIDEC/FSP27 is regulated by peroxisome proliferator-
activated receptor alpha and plays a critical role in fasting- and diet-induced hepatosteatosis.
Hepatology 61, 1227-1238.
Latreille, M., Hausser, J., Stützer, I., Zhang, Q., Hastoy, B., Gargani, S., Kerr-Conte, J.,
Pattou, F., Zavolan, M., Esguerra, J.L.S., et al. (2014). MicroRNA-7a regulates pancreatic β
cell function. J. Clin. Invest. 124, 2722-2735.
Lavanchy, D. (2011). Evolving epidemiology of hepatitis C virus. Clin. Microbiol. Infect.
17, 107-115.
Lee, W.-M., and Ahlquist, P. (2003). Membrane synthesis, specific lipid requirements, and
localized lipid composition changes associated with a positive-strand RNA virus RNA
replication protein. J. Virol. 77, 12819-12828.
Lendvai, G., Jarmay, K., Karacsony, G., Halasz, T., Kovalszky, I., Baghy, K., Wittmann, T.,
Schaff, Z., and Kiss, A. (2014). Elevated miR-33a and miR-224 in steatotic chronic hepatitis
C liver biopsies. World J. Gastroenterol. 20, 15343-15350.
137
Li, J.Z., Ye, J., Xue, B., Qi, J., Zhang, J., Zhou, Z., Li, Q., Wen, Z., and Li, P. (2007). Cideb
regulates diet-induced obesity, liver steatosis, and insulin sensitivity by controlling
lipogenesis and fatty acid oxidation. Diabetes 56, 2523-2532.
Li, L., Gao, F., Jiang, Y., Yu, L., Zhou, Y., Zheng, H., Tong, W., Yang, S., Xia, T., Qu, Z., et
al. (2015). Cellular miR-130b inhibits replication of porcine reproductive and respiratory
syndrome virus in vitro and in vivo. Sci. Rep. 5, 17010.
Li, Q., Pene, V., Krishnamurthy, S., Cha, H., and Liang, T.J. (2013a). Hepatitis C virus
infection activates an innate pathway involving IKK-α in lipogenesis and viral assembly.
Nat. Med. 19, 722-729.
Li, S., Duan, X., Li, Y., Liu, B., McGilvray, I., and Chen, L. (2014). MicroRNA-130a
inhibits HCV replication by restoring the innate immune response. J. Viral. Hepat. 21, 121-
128.
Li, Y., Masaki, T., Yamane, D., McGivern, D.R., and Lemon, S.M. (2013b). Competing and
noncompeting activities of miR-122 and the 5' exonuclease Xrn1 in regulation of hepatitis C
virus replication. Proc. Natl. Acad. Sci. USA 110, 1881-1886.
Li, Y., Xu, S., Mihaylova, M.M., Zheng, B., Hou, X., Jiang, B., Park, O., Luo, Z., Lefai, E.,
Shyy, J.Y.J., et al. (2011a). AMPK phosphorylates and inhibits SREBP activity to attenuate
hepatic steatosis and atherosclerosis in diet-induced insulin-resistant mice. Cell Metab. 13,
376-388.
Li, Z.-Y., Na, H.-M., Peng, G., Pu, J., and Liu, P. (2011b). Alteration of microRNA
expression correlates to fatty acid-mediated insulin resistance in mouse myoblasts. Mol.
Biosyst. 7, 871-877.
Liefhebber, J.M.P., Hague, C.V., Zhang, Q., Wakelam, M.J.O., and McLauchlan, J. (2014).
Modulation of triglyceride and cholesterol ester synthesis impairs assembly of infectious
hepatitis C virus. J. Biol. Chem. 289, 21276-21288.
Lin, J., Jenna, L.B., and Liqing, Y. (2011). Niemann-Pick C1-like 1 (NPC1L1) Protein in
intestinal and hepatic cholesterol transport. Annu. Rev. Physiol. 73, 239-259.
Lindenbach, B.D., Evans, M.J., Syder, A.J., Wölk, B., Tellinghuisen, T.L., Liu, C.C.,
Maruyama, T., Hynes, R.O., Burton, D.R., McKeating, J.A., et al. (2005). Complete
replication of hepatitis C virus in cell culture. Science 309, 623-626.
Lindenbach, B.D., Meuleman, P., Ploss, A., Vanwolleghem, T., Syder, A.J., McKeating,
J.A., Lanford, R.E., Feinstone, S.M., Major, M.E., Leroux-Roels, G., et al. (2006). Cell
culture-grown hepatitis C virus is infectious in vivo and can be recultured in vitro. Proc.
Natl. Acad. Sci. USA 103, 3805-3809.
Lindenbach, B.D., and Rice, C.M. (2005). Unravelling hepatitis C virus replication from
genome to function. Nature 436, 933-938.
Lindenbach, B.D., and Rice, C.M. (2013). The ins and outs of hepatitis C virus entry and
assembly. Nat. Rev. Microbiol. 11, 688-700.
Liu, Q.Y., Chang, M.N., Lei, J.X., Koukiekolo, R., Smith, B., Zhang, D., and Ghribi, O.
(2014a). Identification of microRNAs involved in Alzheimer's progression using a rabbit
model of the disease. Am. J. Neurodegener. Dis. 3, 33-44.

138
Liu, S.-Y., Aliyari, R., Chikere, K., Li, G., Marsden, Matthew D., Smith, Jennifer K., Pernet,
O., Guo, H., Nusbaum, R., Zack, Jerome A., et al. (2013). Interferon-inducible cholesterol-
25-hydroxylase broadly inhibits viral entry by production of 25-hydroxycholesterol.
Immunity 38, 92-105.
Liu, W., Cao, H., Ye, C., Chang, C., Lu, M., Jing, Y., Zhang, D., Yao, X., Duan, Z., Xia, H.,
et al. (2014b). Hepatic miR-378 targets p110α and controls glucose and lipid homeostasis by
modulating hepatic insulin signalling. Nat. Commun. 5, 5864.
Livak, K.J., and Schmittgen, T.D. (2001). Analysis of relative gene expression data using
real-time quantitative PCR and the 2–ΔΔCT method. Methods 25, 402-408.
Lohmann, V., and Bartenschlager, R. (2014). On the history of hepatitis C virus cell culture
systems. J. Med. Chem. 57, 1627-1642.
Lohmann, V., Körner, F., Koch, J.O., Herian, U., Theilmann, L., and Bartenschlager, R.
(1999). Replication of subgenomic hepatitis C virus RNAs in a hepatoma cell line. Science
285, 110-113.
Long, Y.C., and Zierath, J.R. (2006). AMP-activated protein kinase signaling in metabolic
regulation. J. Clin. Invest. 116, 1776-1783.
Loyer, X., Paradis, V., Hénique, C., Vion, A.-C., Colnot, N., Guerin, C.L., Devue, C.c., On,
S., Scetbun, J., Romain, M., et al. (2015). Liver microRNA-21 is overexpressed in non-
alcoholic steatohepatitis and contributes to the disease in experimental models by inhibiting
PPARα expression. Gut.
Luna, J.M., Scheel, T.K.H., Danino, T., Shaw, K.S., Mele, A., Fak, J.J., Nishiuchi, E.,
Takacs, C.N., Catanese, M.T., de Jong, Y.P., et al. (2015). Hepatitis C virus RNA
functionally sequesters miR-122. Cell 160, 1099-1110.
Lyn, R.K., Kennedy, D.C., Sagan, S.M., Blais, D.R., Rouleau, Y., Pegoraro, A.F., Xie, X.S.,
Stolow, A., and Pezacki, J.P. (2009). Direct imaging of the disruption of hepatitis C virus
replication complexes by inhibitors of lipid metabolism. Virology 394, 130-142.
Lyn, R.K., Singaravelu, R., Kargman, S., O'Hara, S., Chan, H., Oballa, R., Huang, Z., Jones,
D.M., Ridsdale, A., Russell, R.S., et al. (2014). Stearoyl-CoA desaturase inhibition blocks
formation of hepatitis C virus-induced specialized membranes. Sci. Rep. 4, 4549.
Machlin, E.S., Sarnow, P., and Sagan, S.M. (2011). Masking the 5' terminal nucleotides of
the hepatitis C virus genome by an unconventional microRNA-target RNA complex. Proc.
Natl. Acad. Sci. USA 108, 3193-3198.
Maianti, J.P., McFedries, A., Foda, Z.H., Kleiner, R.E., Du, X.Q., Leissring, M.A., Tang,
W.-J., Charron, M.J., Seeliger, M.A., Saghatelian, A., et al. (2014). Anti-diabetic activity of
insulin-degrading enzyme inhibitors mediated by multiple hormones. Nature 511, 94-98.
Maillard, P., Huby, T., Andréo, U., Moreau, M., Chapman, J., and Budkowska, A. (2006).
The interaction of natural hepatitis C virus with human scavenger receptor SR-BI/Cla1 is
mediated by ApoB-containing lipoproteins. FASEB J.
Malone, C.D., and Hannon, G.J. (2009). Small RNAs as guardians of the genome. Cell 136,
656-668.

139
Masaki, T., Suzuki, R., Murakami, K., Aizaki, H., Ishii, K., Murayama, A., Date, T.,
Matsuura, Y., Miyamura, T., Wakita, T., et al. (2008). Interaction of hepatitis C virus
nonstructural protein 5A with core protein is critical for the production of infectious virus
particles. J. Virol. 82, 7964-7976.
Matsuura, K., and Tanaka, Y. (2015). Host genetic variants influencing the clinical course of
hepatitis C virus infection. J. Med. Virol. 88, 185-195.
Mattijssen, F., and Kersten, S. (2012). Regulation of triglyceride metabolism by
Angiopoietin-like proteins. Biochim. Biophys. Acta 1821, 782-789.
Mauger, D.M., Golden, M., Yamane, D., Williford, S., Lemon, S.M., Martin, D.P., and
Weeks, K.M. (2015). Functionally conserved architecture of hepatitis C virus RNA genomes.
Proc. Natl. Acad. Sci. USA 112, 3692-3697.
McRae, S., Iqbal, J., Sarkar-Dutta, M., Lane, S., Nagaraj, A., Ali, N., and Waris, G. (2015).
Hepatitis C virus-induced NLRP3-inflammasome activates the sterol regulatory element
binding protein (SREBP) and regulates lipid metabolism. J. Biol. Chem., in press.
Meex, S.J.R., Andreo, U., Sparks, J.D., and Fisher, E.A. (2011). Huh-7 or HepG2 cells:
which is the better model for studying human apolipoprotein-B100 assembly and secretion?
J. Lipid Res. 52, 152-158.
Meiler, S., Baumer, Y., Toulmin, E., Seng, K., and Boisvert, W.A. (2015). MicroRNA 302a
is a novel modulator of cholesterol homeostasis and atherosclerosis. Arterioscler. Thromb.
Vasc. Biol. 35, 323-331.
Menzel, N., Fischl, W., Hueging, K., Bankwitz, D., Frentzen, A., Haid, S., Gentzsch, J.,
Kaderali, L., Bartenschlager, R., and Pietschmann, T. (2012). MAP-kinase regulated
cytosolic phospholipase A2 Activity is essential for production of infectious hepatitis C virus
particles. PLoS Pathog. 8, e1002829.
Mercer, D.F., Schiller, D.E., Elliott, J.F., Douglas, D.N., Hao, C., Rinfret, A., Addison,
W.R., Fischer, K.P., Churchill, T.A., Lakey, J.R.T., et al. (2001). Hepatitis C virus
replication in mice with chimeric human livers. Nat. Med. 7, 927-933.
McFarland, A.P., Horner, S.M., Jarret, A., Joslyn, R.C., Bindewald, E., Shapiro, B.A.,
Delker, D.A., Hagedorn, C.H., Carrington, M., Gale Jr, M., et al. (2014). The favorable
IFNL3 genotype escapes mRNA decay mediated by AU-rich elements and hepatitis C virus-
induced microRNAs. Nat. Immunol. 15, 72-79.
Meunier, J.-C., Russell, R.S., Engle, R.E., Faulk, K.N., Purcell, R.H., and Emerson, S.U.
(2008). Apolipoprotein C1 association with hepatitis C virus. J. Virol. 82, 9647-9656.
Mi, H., Muruganujan, A., and Thomas, P.D. (2013). PANTHER in 2013: modeling the
evolution of gene function, and other gene attributes, in the context of phylogenetic trees.
Nucleic Acids Res. 41, D377-D386.
Michalik, L., Auwerx, J., Berger, J.P., Chatterjee, V.K., Glass, C.K., Gonzalez, F.J.,
Grimaldi, P.A., Kadowaki, T., Lazar, M.A., O'Rahilly, S., et al. (2006). International Union
of Pharmacology. LXI. Peroxisome Proliferator-Activated Receptors. Pharmacol. Rev. 58,
726-741.

140
Miller, S., and Krijnse-Locker, J. (2008). Modification of intracellular membrane structures
for virus replication. Nat. Rev. Microbiol. 6, 363-374.
Min, H., and Yoon, S. (2010). Got target?: computational methods for microRNA target
prediction and their extension. Exp. Mol. Med. 42, 233-244.
Miyanari, Y., Atsuzawa, K., Usuda, N., Watashi, K., Hishiki, T., Zayas, M., Bartenschlager,
R., Wakita, T., Hijikata, M., and Shimotohno, K. (2007). The lipid droplet is an important
organelle for hepatitis C virus production. Nat. Cell. Biol. 9, 1089-1097.
Monazahian, M., Böhme, I., Bonk, S., Koch, A., Scholz, C., Grethe, S., and Thomssen, R.
(1999). Low density lipoprotein receptor as a candidate receptor for hepatitis C virus. J. Med.
Virol. 57, 223-229.
Moore, K.J., Rayner, K.J., Suárez, Y., and Fernández-Hernando, C. (2011). The role of
microRNAs in cholesterol efflux and hepatic lipid metabolism. Annu. Rev. Nutr. 31, 49-63.
Moradpour, D., Englert, C., Wakita, T., and Wands, J.R. (1996). Characterization of cell
lines allowing tightly regulated expression of hepatitis C virus core protein. Virology 222,
51-63.
Moradpour, D., Penin, F., and Rice, C.M. (2007). Replication of hepatitis C virus. Nat. Rev.
Micro. 5, 453-463.
Moriya, K., Yotsuyanagi, H., Shintani, Y., Fujie, H., Ishibashi, K., Matsuura, Y., Miyamura,
T., and Koike, K. (1997). Hepatitis C virus core protein induces hepatic steatosis in
transgenic mice. J. Gen. Virol. 78, 1527-1531.
Motiño, O., Francés, D.E., Mayoral, R., Castro-Sánchez, L., Fernández-Velasco, M., Boscá,
L., García-Monzón, C., Brea, R., Casado, M., Agra, N., et al. (2015). Regulation of
microRNA 183 by cyclooxygenase 2 in liver is DEAD-Box helicase p68 (DDX5) dependent:
Role in insulin signaling. Mol. Cell. Biol. 35, 2554-2567.
Munger, J., Bennett, B.D., Parikh, A., Feng, X.-J., McArdle, J., Rabitz, H.A., Shenk, T., and
Rabinowitz, J.D. (2008). Systems-level metabolic flux profiling identifies fatty acid
synthesis as a target for antiviral therapy. Nat. Biotech. 26, 1179-1186.
Murakami, Y., Aly, H.H., Tajima, A., Inoue, I., and Shimotohno, K. (2009). Regulation of
the hepatitis C virus genome replication by miR-199a*. J. Hepatol. 50, 453-460.
Myatt, S.S., Wang, J., Monteiro, L.J., Christian, M., Ho, K.-K., Fusi, L., Dina, R.E., Brosens,
J.J., Ghaem-Maghami, S., and Lam, E.W.F. (2010). Definition of microRNAs that repress
expression of the tumor suppressor gene FOXO1 in endometrial cancer. Cancer Res. 70,
367-377.
Myers, R.P., Shah, H., Burak, K.W., Cooper, C., and Feld, J.J. (2015). An update on the
management of chronic hepatitis C: 2015 Consensus guidelines from the Canadian
Association for the Study of the Liver. Can. J. Gastroenterol. Hepatol. 29, 19 - 34.
Nahoum, V., Pérez, E., Germain, P., Rodrı́guez-Barrios, F., Manzo, F., Kammerer, S.,
Lemaire, G., Hirsch, O., Royer, C.A., Gronemeyer, H., et al. (2007). Modulators of the
structural dynamics of the retinoid X receptor to reveal receptor function. Proc. Natl. Acad.
Sci. USA 104, 17323-17328.

141
Najafi-Shoushtari, S.H., Kristo, F., Li, Y., Shioda, T., Cohen, D.E., Gerszten, R.E., and Näär,
A.M. (2010). MicroRNA-33 and the SREBP host genes cooperate to control cholesterol
homeostasis. Science 328, 1566-1569.
Nan, X., Tonary, A.M., Stolow, A., Xie, X.S., and Pezacki, J.P. (2006). Intracellular imaging
of HCV RNA and cellular lipids by using simultaneous two-photon fluorescence and
coherent anti-Stokes Raman scattering Microscopies. ChemBioChem 7, 1895-1897.
Nasheri, N., Joyce, M., Rouleau, Y., Yang, P., Yao, S., Tyrrell, D.L., and Pezacki, John P.
(2013). Modulation of fatty acid synthase enzyme activity and expression during hepatitis C
virus replication. Chem. Biol. 20, 570-582.
Nasheri, N., Singaravelu, R., Goodmurphy, M., Lyn, R.K., and Pezacki, J.P. (2011).
Competing roles of microRNA-122 recognition elements in hepatitis C virus RNA. Virology
410, 336-344.
Negro, F. (2011). Mechanisms of hepatitis C virus-related insulin resistance. Clin. Res.
Hepatol. Gastroenterol. 35, 358-363.
Ning, B.-F., Ding, J., Liu, J., Yin, C., Xu, W.-P., Cong, W.-M., Zhang, Q., Chen, F., Han, T.,
Deng, X., et al. (2014). Hepatocyte nuclear factor 4α-nuclear factor-κB feedback circuit
modulates liver cancer progression. Hepatology 60, 1607-1619.
Nishimura, G., Ikeda, M., Mori, K., Nakazawa, T., Ariumi, Y., Dansako, H., and Kato, N.
(2009). Replicons from genotype 1b HCV-positive sera exhibit diverse sensitivities to anti-
HCV reagents. Antiviral Res. 82, 42-50.
Oem, J.-K., Jackel-Cram, C., Li, Y.-P., Zhou, Y., Zhong, J., Shimano, H., Babiuk, L.A., and
Liu, Q. (2008). Activation of sterol regulatory element-binding protein 1c and fatty acid
synthase transcription by hepatitis C virus non-structural protein 2. J. Gen. Virol. 89, 1225-
1230.
Okamura, K., Hagen, J.W., Duan, H., Tyler, D.M., and Lai, E.C. (2007). The mirtron
pathway generates microRNA-class regulatory RNAs in Drosophila. Cell 130, 89-100.
Olmstead, A.D., Knecht, W., Lazarov, I., Dixit, S.B., and Jean, F. (2012). Human subtilase
SKI-1/S1P is a master regulator of the HCV lifecycle and a potential host cell target for
developing indirect-acting antiviral agents. PLoS Pathog. 8, e1002468.
Osborne, T.F. (2000). Sterol regulatory element-binding proteins (SREBPs): Key regulators
of nutritional homeostasis and insulin action. J. Biol. Chem. 275, 32379-32382.
Owen, D.M., Huang, H., Ye, J., and Gale Jr, M. (2009). Apolipoprotein E on hepatitis C
virion facilitates infection through interaction with low-density lipoprotein receptor.
Virology 394, 99-108.
Owens, C.M., Mawhinney, C., Grenier, J.M., Altmeyer, R., Lee, M.S., Borisy, A.A., Lehár,
J., and Johansen, L.M. (2010). Chemical combinations elucidate pathway interactions and
regulation relevant to Hepatitis C replication. Mol. Syst. Biol. 6.
Pan, S., Yang, X., Jia, Y., Li, R., and Zhao, R. (2014). Microvesicle-shuttled miR-130b
reduces fat deposition in recipient primary cultured porcine adipocytes by inhibiting PPAR-γ
expression. J. Cell. Physiol. 229, 631-639.

142
Parameswaran, P., Sklan, E., Wilkins, C., Burgon, T., Samuel, M.A., Lu, R., Ansel, K.M.,
Heissmeyer, V., Einav, S., Jackson, W., et al. (2010). Six RNA viruses and forty-one hosts:
viral small RNAs and modulation of small RNA repertoires in vertebrate and invertebrate
systems. PLoS Pathog. 6, e1000764.
Park, C.-Y., Jun, H.-J., Wakita, T., Cheong, J.H., and Hwang, S.B. (2009). Hepatitis C virus
nonstructural 4B protein modulates sterol regulatory element-binding protein signaling via
the AKT pathway. J. Biol. Chem. 284, 9237-9246.
Park, K., and Scott, A.L. (2010). Cholesterol 25-hydroxylase production by dendritic cells
and macrophages is regulated by type I interferons. J. Leukoc. Biol. 88, 1081-1087.
Pasquinelli, A.E. (2012). MicroRNAs and their targets: recognition, regulation and an
emerging reciprocal relationship. Nat. Rev. Genet. 13, 271-282.
Paul, D., Hoppe, S., Saher, G., Krijnse-Locker, J., and Bartenschlager, R. (2013).
Morphological and biochemical characterization of the membranous hepatitis C virus
replication compartment. J. Virol. 87, 10612-10627.
Paul, D., Madan, V., and Bartenschlager, R. (2014). Hepatitis C virus RNA replication and
assembly: Living on the fat of the land. Cell Host Microbe 16, 569-579.
Pawlotsky, J.-M., Feld, J.J., Zeuzem, S., and Hoofnagle, J.H. (2015). From non-A, non-B
hepatitis to hepatitis C virus cure. J. Hepatol. 62, S87-S99.
Pedersen, I.M., Cheng, G., Wieland, S., Volinia, S., Croce, C.M., Chisari, F.V., and David,
M. (2007). Interferon modulation of cellular microRNAs as an antiviral mechanism. Nature
449, 919-922.
Peng, X., Li, Y., Walters, K.A., Rosenzweig, E.R., Lederer, S.L., Aicher, L.D., Proll, S., and
Katze, M.G. (2009). Computational identification of hepatitis C virus associated microRNA-
mRNA regulatory modules in human livers. BMC Genomics 10.
Petersen, J., Drake, M.J., Bruce, E.A., Riblett, A.M., Didigu, C.A., Wilen, C.B., Malani, N.,
Male, F., Lee, F.-H., Bushman, F.D., et al. (2014). The major cellular sterol regulatory
pathway is required for Andes virus infection. PLoS Pathog. 10, e1003911.
Pezacki, J.P., Blake, J.A., Danielson, D.C., Kennedy, D.C., Lyn, R.K., and Singaravelu, R.
(2011). Chemical contrast for imaging living systems: molecular vibrations drive CARS
microscopy. Nat. Chem. Biol. 7, 137-145.
Pezacki, J.P., Sagan, S.M., Tonary, A.M., Rouleau, Y., Bélanger, S., Supekova, L., and Su,
A.I. (2009). Transcriptional profiling of the effects of 25-hydroxycholesterol on human
hepatocyte metabolism and the antiviral state it conveys against the hepatitis C virus. BMC
Chem. Biol. 9, 1-15.
Pezacki, J.P., Singaravelu, R., and Lyn, R.K. (2010). Host-virus interactions during hepatitis
C virus infection: a complex and dynamic molecular biosystem. Mol. Biosyst. 6, 1131-1142.
Pietschmann, T., Kaul, A., Koutsoudakis, G., Shavinskaya, A., Kallis, S., Steinmann, E.,
Abid, K., Negro, F., Dreux, M., Cosset, F.-L., et al. (2006). Construction and
characterization of infectious intragenotypic and intergenotypic hepatitis C virus chimeras.
Proc. Natl. Acad. Sci. USA 103, 7408-7413.

143
Pietschmann, T., Zayas, M., Meuleman, P., Long, G., Appel, N., Koutsoudakis, G., Kallis,
S., Leroux-Roels, G., Lohmann, V., and Bartenschlager, R. (2009). Production of infectious
genotype 1b virus particles in cell culture and impairment by replication enhancing
mutations. PLoS Pathog. 5, e1000475.
Pileri, P., Uematsu, Y., Campagnoli, S., Galli, G., Falugi, F., Petracca, R., Weiner, A.J.,
Houghton, M., Rosa, D., Grandi, G., et al. (1998). Binding of hepatitis C virus to CD81.
Science 282, 938-941.
Ploss, A., Evans, M.J., Gaysinskaya, V.A., Panis, M., You, H., de Jong, Y.P., and Rice, C.M.
(2009). Human occludin is a hepatitis C virus entry factor required for infection of mouse
cells. Nature 457, 882-886.
Prentoe, J., Serre, S.B.N., Ramirez, S., Nicosia, A., Gottwein, J.M., and Bukh, J. (2014).
Hypervariable region 1 deletion and required adaptive envelope mutations confer decreased
dependency on scavenger receptor class B type I and low-density lipoprotein receptor for
hepatitis C virus. J. Virol. 88, 1725-1739.
Prochnik, S., Rokhsar, D., and Aboobaker, A.A. (2007). Evidence for a microRNA
expansion in the bilaterian ancestor. Dev. Genes Evol. 217, 73-77.
Qadir, X.V., Han, C., Lu, D., Zhang, J., and Wu, T. (2014). miR-185 inhibits hepatocellular
carcinoma growth by targeting the DNMT1/PTEN/Akt pathway. Am. J. Pathol. 184, 2355-
2364.
Radhakrishnan, A., Ikeda, Y., Kwon, H.J., Brown, M.S., and Goldstein, J.L. (2007). Sterol-
regulated transport of SREBPs from endoplasmic reticulum to Golgi: Oxysterols block
transport by binding to Insig. Proc. Natl. Acad. Sci. USA 104, 6511-6518.
Rakic, B., Sagan, S.M., Noestheden, M., Bélanger, S., Nan, X., Evans, C.L., Xie, X.S., and
Pezacki, J.P. (2006). Peroxisome proliferator-activated receptor α antagonism inhibits
hepatitis C virus replication. Chem. Biol. 13, 23-30.
Randall, G., Panis, M., Cooper, J.D., Tellinghuisen, T.L., Sukhodolets, K.E., Pfeffer, S.,
Landthaler, M., Landgraf, P., Kan, S., Lindenbach, B.D., et al. (2007). Cellular cofactors
affecting hepatitis C virus infection and replication. Proc. Natl. Acad. Sci. U S A 104,12884-
12889.
Rayner, K.J., Suárez, Y., Dávalos, A., Parathath, S., Fitzgerald, M.L., Tamehiro, N., Fisher,
E.A., Moore, K.J., and Fernández-Hernando, C. (2010). MiR-33 contributes to the regulation
of cholesterol homeostasis. Science 328, 1570-1573.
Reboldi, A., Dang, E.V., McDonald, J.G., Liang, G., Russell, D.W., and Cyster, J.G. (2014).
25-Hydroxycholesterol suppresses interleukin-1–driven inflammation downstream of type I
interferon. Science 345, 679-684.
Régeard, M., Trotard, M., Lepère, C., Gripon, P., and Le Seyec, J. (2008). Entry of
pseudotyped hepatitis C virus into primary human hepatocytes depends on the scavenger
class B type I receptor. J. Viral. Hepat. 15, 865-870.
Reiss, S., Rebhan, I., Backes, P., Romero-Brey, I., Erfle, H., Matula, P., Kaderali, L.,
Poenisch, M., Blankenburg, H., Hiet, M.-S., et al. (2011). Recruitment and activation of a

144
lipid kinase by hepatitis C virus NS5A is essential for integrity of the membranous
replication compartment. Cell Host Microbe 9, 32-45.
Repa, J.J., Liang, G., Ou, J., Bashmakov, Y., Lobaccaro, J.-M.A., Shimomura, I., Shan, B.,
Brown, M.S., Goldstein, J.L., and Mangelsdorf, D.J. (2000). Regulation of mouse sterol
regulatory element-binding protein-1c gene (SREBP-1c) by oxysterol receptors, LXRα and
LXRβ. Genes Dev. 14, 2819-2830.
Rodgers, M.A., Villareal, V.A., Schaefer, E.A., Peng, L.F., Corey, K.E., Chung, R.T., and
Yang, P.L. (2012). Lipid metabolite profiling identifies desmosterol metabolism as a new
antiviral target for hepatitis C virus. J. Am. Chem. Soc. 134, 6896-6899.
Roe, B., Kensicki, E., Mohney, R., and Hall, W.W. (2011). Metabolomic profile of hepatitis
C virus-infected hepatocytes. PLoS ONE 6, e23641.
Roingeard, P. (2013). Hepatitis C virus diversity and hepatic steatosis. J. Viral. Hepat. 20,
77-84.
Ross-Thriepland, D., and Harris, M. (2015). Hepatitis C virus NS5A: enigmatic but still
promiscuous 10 years on! J. Gen. Virol. 96, 727-738.
Rottiers, V., and Näär, A.M. (2012). MicroRNAs in metabolism and metabolic disorders.
Nat. Rev. Mol. Cell. Biol. 13, 239-250.
Roulin, P.S., Lötzerich, M., Torta, F., Tanner, L.B., van Kuppeveld, F.M., Wenk, M.R., and
Greber, U.F. (2014). Rhinovirus uses a phosphatidylinositol 4-phosphate/cholesterol counter-
current for the formation of replication compartments at the ER-Golgi interface. Cell Host
Microbe 16, 677-690.
Rubbia-Brandt, L., Quadri, R., Abid, K., Giostra, E., Malé, P.-J., Mentha, G., Spahr, L.,
Zarski, J.-P., Borisch, B., Hadengue, A., et al. (2000). Hepatocyte steatosis is a cytopathic
effect of hepatitis C virus genotype 3. J. Hepatol. 33, 106-115.
Rui, L. (2014). Energy metabolism in the liver. In Comprehensive Physiology (John Wiley &
Sons, Inc.).
Russell, R.S., Meunier, J.-C., Takikawa, S., Faulk, K., Engle, R.E., Bukh, J., Purcell, R.H.,
and Emerson, S.U. (2008). Advantages of a single-cycle production assay to study cell
culture-adaptive mutations of hepatitis C virus. Proc. Natl. Acad. Sci. USA 105, 4370-4375.
Saeed, M., Andreo, U., Chung, H.-Y., Espiritu, C., Branch, A.D., Silva, J.M., and Rice, C.M.
(2015). SEC14L2 enables pan-genotype HCV replication in cell culture. Nature 524, 471-
475.
Sagan, S.M., Rouleau, Y., Leggiadro, C., Supekova, L., Schultz, P.G., Su, A.I., and Pezacki,
J.P. (2006). The influence of cholesterol and lipid metabolism on host cell structure and
hepatitis C virus replication. Biochem. Cell Biol. 84, 67-79.
Sainz, B., Barretto, N., Martin, D.N., Hiraga, N., Imamura, M., Hussain, S., Marsh, K.A.,
Yu, X., Chayama, K., Alrefai, W.A., et al. (2012). Identification of the Niemann-Pick C1-
like 1 cholesterol absorption receptor as a new hepatitis C virus entry factor. Nat. Med. 18,
281-285.
Saka, H.A., and Valdivia, R. (2012). Emerging roles for lipid droplets in immunity and host-
pathogen interactions. Annu. Rev. Cell Dev. Biol. 28, 411-437.

145
Sakamoto, H., Okamoto, K., Aoki, M., Kato, H., Katsume, A., Ohta, A., Tsukuda, T.,
Shimma, N., Aoki, Y., Arisawa, M., et al. (2005). Host sphingolipid biosynthesis as a target
for hepatitis C virus therapy. Nat. Chem. Biol. 1, 333-337.
Salloum, S., Wang, H., Ferguson, C., Parton, R.G., and Tai, A.W. (2013). Rab18 binds to
hepatitis C virus NS5A and promotes interaction between sites of viral replication and lipid
droplets. PLoS Pathog. 9, e1003513.
Salmena, L., Poliseno, L., Tay, Y., Kats, L., and Pandolfi, P.P. (2011). A ceRNA Hypothesis:
The Rosetta Stone of a hidden RNA language? Cell 146, 353-358.
Sandgren, E.P., Palmiter, R.D., Heckel, J.L., Daugherty, C.C., Brinster, R.L., and Degen, J.L.
(1991). Complete hepatic regeneration after somatic deletion of an albumin-plasminogen
activator transgene. Cell 66, 245-256.
Santhakumar, D., Forster, T., Laqtom, N.N., Fragkoudis, R., Dickinson, P., Abreu-Goodger,
C., Manakov, S.A., Choudhury, N.R., Griffiths, S.J., Vermeulen, A., et al. (2010). Combined
agonist–antagonist genome-wide functional screening identifies broadly active antiviral
microRNAs. Proc. Natl. Acad. Sci. U S A 107, 13830-13835.
Sarnow, P., Jopling, C.L., Norman, K.L., Schütz, S., and Wehner, K.A. (2006). MicroRNAs:
expression, avoidance and subversion by vertebrate viruses. Nat. Rev. Microbiol. 4, 651-659.
Scarselli, E., Ansuini, H., Cerino, R., Roccasecca, R.M., Acali, S., Filocamo, G., Traboni, C.,
Nicosia, A., Cortese, R., and Vitelli, A. (2002). The human scavenger receptor class B type I
is a novel candidate receptor for the hepatitis C virus. EMBO J. 21, 5017-5025.
Schoggins, J.W., and Randall, G. (2013). Lipids in innate antiviral defense. Cell Host
Microbe 14, 379-385.
Schoonjans, K., Staels, B., and Auwerx, J. (1996). Role of the peroxisome proliferator-
activated receptor (PPAR) in mediating the effects of fibrates and fatty acids on gene
expression. J. Lipid Res. 37, 907-925.
Scull, M.A., Shi, C., de Jong, Y.P., Gerold, G., Ries, M., von Schaewen, M., Donovan, B.M.,
Labitt, R.N., Horwitz, J.A., Gaska, J.M., et al. (2015). Hepatitis C virus infects rhesus
macaque hepatocytes and simianized mice. Hepatology 62, 57-67.
Sedano, C.D., and Sarnow, P. (2014). Hepatitis C virus subverts liver-specific miR-122 to
protect the viral genome from exoribonuclease Xrn2. Cell Host Microbe 16, 257-264.
Selitsky, S.R., Dinh, T.A., Toth, C.L., Kurtz, C.L., Honda, M., Struck, B.R., Kaneko, S.,
Vickers, K.C., Lemon, S.M., and Sethupathy, P. (2015). Transcriptomic analysis of chronic
hepatitis B and C and liver cancer reveals microRNA-mediated control of cholesterol
synthesis programs. mBio 6, e01500-15.
Shah, Y.M., Morimura, K., Yang, Q., Tanabe, T., Takagi, M., and Gonzalez, F.J. (2007).
Peroxisome proliferator-activated receptor α regulates a microRNA-mediated signaling
cascade responsible for hepatocellular proliferation. Mol. Cell. Biol. 27, 4238-4247.
Shen, W.-J., Hu, J., Hu, Z., Kraemer, F.B., and Azhar, S. (2014). Scavenger Receptor class B
type I (SR-BI): A versatile receptor with multiple functions and actions. Metabolism 63, 875-
886.

146
Sherratt, A.R., Nasheri, N., McKay, C.S., O'Hara, S., Hunt, A., Ning, Z., Figeys, D., Goto,
N.K., and Pezacki, J.P. (2014). A new chemical probe for phosphatidylinositol kinase
activity. ChemBioChem 15, 1253-1256.
Shi, T., Fan, G.Q., and Xiao, S.D. (2010). SIRT3 reduces lipid accumulation via AMPK
activation in human hepatic cells. J. Dig. Dis. 11, 55-62.
Shimizu, Y., Hishiki, T., Sugiyama, K., Ogawa, K., Funami, K., Kato, A., Ohsaki, Y.,
Fujimoto, T., Takaku, H., and Shimotohno, K. (2010). Lipoprotein lipase and hepatic
triglyceride lipase reduce the infectivity of hepatitis C virus (HCV) through their catalytic
activities on HCV-associated lipoproteins. Virology 407, 152-159.
Shin, C., Nam, J.-W., Farh, K.K.-H., Chiang, H.R., Shkumatava, A., and Bartel, D.P. (2010).
Expanding the microRNA targeting code: Functional sites with centered pairing. Mol. Cell
38, 789-802.
Shirasaki, T., Honda, M., Shimakami, T., Horii, R., Yamashita, T., Sakai, Y., Sakai, A.,
Okada, H., Watanabe, R., Murakami, S., et al. (2013). MicroRNA-27a regulates lipid
metabolism and inhibits hepatitis C virus replication in human hepatoma cells. J. Virol. 87,
5270-5286.
Simmonds, P., Bukh, J., Combet, C., Deléage, G., Enomoto, N., Feinstone, S., Halfon, P.,
Inchauspé, G., Kuiken, C., Maertens, G., et al. (2005). Consensus proposals for a unified
system of nomenclature of hepatitis C virus genotypes. Hepatology 42, 962-973.
Singaravelu, R., Chen, R., Lyn, R.K., Jones, D.M., O'Hara, S., Rouleau, Y., Cheng, J.,
Srinivasan, P., Nasheri, N., Russell, R.S., et al. (2014a). Hepatitis C virus induced up-
regulation of microRNA-27: A novel mechanism for hepatic steatosis. Hepatology 59, 98-
108.
Singaravelu, R., Desrochers, G.F., Srinivasan, P., O'Hara, S., Lyn, R.K., Müller, R., Jones,
D.M., Russell, R.S., and Pezacki, J.P. (2015a). Soraphen A: A probe for investigating the
role of de novo lipogenesis during viral infection. ACS Infect. Dis. 1, 130-134.
Singaravelu, R., Lyn, R.K., Srinivasan, P., Delcorde, J., Steenbergen, R.H., Tyrrell, D.L., and
Pezacki, J.P. (2013). Human serum activates CIDEB-mediated lipid droplet enlargement in
hepatoma cells. Biochem. Biophys. Res. Comm. 441, 447-452.
Singaravelu, R., O'Hara, S., Jones, D.M., Chen, R., Taylor, N.G., Srinivasan, P., Quan, C.,
Roy, D.G., Steenbergen, R.H., Kumar, A., et al. (2015b). MicroRNAs regulate the
immunometabolic response to viral infection in the liver. Nat. Chem. Biol. 11, 988-993.
Singaravelu, R., Russell, R.S., Tyrrell, D.L., and Pezacki, J.P. (2014b). Hepatitis C virus and
microRNAs: miRed in a host of possibilities. Curr. Opin. Virol. 7, 1-10.
Singaravelu, R., Srinivasan, P., and Pezacki, J.P. (2015c). Armand-Frappier Outstanding
Student Award - The emerging role of 25-hydroxycholesterol in innate immunity. Can. J.
Microbiol. 61, 521-530.
Smith, D.B., Bukh, J., Kuiken, C., Muerhoff, A.S., Rice, C.M., Stapleton, J.T., and
Simmonds, P. (2014). Expanded classification of hepatitis C virus into 7 genotypes and 67
subtypes: Updated criteria and genotype assignment web resource. Hepatology 59, 318-327.

147
Sobolewski, C., Calo, N., Portius, D., and Foti, M. (2015). MicroRNAs in fatty liver disease.
Semin. Liver Dis. 35, 12-25.
Steenbergen, R.H.G., Joyce, M.A., Thomas, B.S., Jones, D., Law, J., Russell, R., Houghton,
M., and Tyrrell, D.L. (2013). Human serum leads to differentiation of human hepatoma cells,
restoration of very-low-density lipoprotein secretion, and a 1000-fold increase in HCV
Japanese fulminant hepatitis type 1 titers. Hepatology 58, 1907-1917.
Stojdl, D.F., Lichty, B.D., tenOever, B.R., Paterson, J.M., Power, A.T., Knowles, S., Marius,
R., Reynard, J., Poliquin, L., Atkins, H., et al. (2003). VSV strains with defects in their
ability to shutdown innate immunity are potent systemic anti-cancer agents. Cancer Cell 4,
263-275.
Su, A.I., Pezacki, J.P., Wodicka, L., Brideau, A.D., Supekova, L., Thimme, R., Wieland, S.,
Bukh, J., Purcell, R.H., Schultz, P.G., et al. (2002). Genomic analysis of the host response to
hepatitis C virus infection. Proc. Natl. Acad. Sci. USA 99, 15669-15674.
Subramanian, A., Tamayo, P., Mootha, V.K., Mukherjee, S., Ebert, B.L., Gillette, M.A.,
Paulovich, A., Pomeroy, S.L., Golub, T.R., Lander, E.S., et al. (2005). Gene set enrichment
analysis: A knowledge-based approach for interpreting genome-wide expression profiles.
Proc. Natl. Acad. Sci. USA 102, 15545-15550.
Sumpter, R., Loo, Y.-M., Foy, E., Li, K., Yoneyama, M., Fujita, T., Lemon, S.M., and Gale,
M. (2005). Regulating intracellular antiviral defense and permissiveness to hepatitis C virus
RNA replication through a cellular RNA helicase, RIG-I. J. Virol. 79, 2689-2699.
Syed, G.H., Amako, Y., and Siddiqui, A. (2010). Hepatitis C virus hijacks host lipid
metabolism. Trends Endocrinol. Metab. 21, 33-40.
Syed, G.H., and Siddiqui, A. (2011). Effects of hypolipidemic agent nordihydroguaiaretic
acid on lipid droplets and hepatitis C virus. Hepatology 54, 1936-1946.
Syed, G.H., Tang, H., Khan, M., Hassanein, T., Liu, J., and Siddiqui, A. (2014). Hepatitis C
virus stimulates low-density lipoprotein receptor expression to facilitate viral propagation. J.
Virol. 88, 2519-2529.
Szostak, E., and Gebauer, F. (2013). Translational control by 3'-UTR-binding proteins. Brief.
Funct. Genomics 12, 58-65.
Tabor, E., Gerety, R.J., Drucker, J.A., Seeff, L.B., Hoofnagle, J.H., Jackson, D.R., April, M.,
Barker, L.F., and Pineda-Tamondong, G. (1978). Transmission of non-A, non-B hepatitis
from man to chimpanzee. Lancet 1, 463-466.
Tailleux, A., Duriez, P., Fruchart, J.-C., and Clavey, V.r. (2002). Apolipoprotein A-II, HDL
metabolism and atherosclerosis. Atherosclerosis 164, 1-13.
Takeuchi, K., and Reue, K. (2009). Biochemistry, physiology, and genetics of GPAT,
AGPAT, and lipin enzymes in triglyceride synthesis. Am. J. Physiol. Endocrinol. Metab.
296, E1195-E1209.
Tang, W.-J. (2016). Targeting insulin-degrading enzyme to treat type 2 diabetes mellitus.
Trends Endocrinol. Metab. 27, 24-34.

148
Tao, J., Kang, K.-D., Hall, S.D., Laube, A.H., Liu, J., Renfrow, M.B., Novak, J., and Luo, G.
(2015). The serum very-low-density lipoprotein serves as a restriction factor against hepatitis
C virus infection. J. Virol. 89, 6782-6791.
Teissier, É., and Pécheur, E.-I. (2007). Lipids as modulators of membrane fusion mediated
by viral fusion proteins. European Biophysics Journal 36, 887-899.
Tikhanovich, I., Cox, J., and Weinman, S.A. (2013). Forkhead box class O transcription
factors in liver function and disease. J. Gastroenterol. Hepatol. 28, 125-131.
Timpe, J.M., Stamataki, Z., Jennings, A., Hu, K., Farquhar, M.J., Harris, H.J., Schwarz, A.,
Desombere, I., Roels, G.L., Balfe, P., et al. (2008). Hepatitis C virus cell-cell transmission in
hepatoma cells in the presence of neutralizing antibodies. Hepatology 47, 17-24.
Tomohiro, I., Hitoshi, S., Tomohiro, Y., Naoya, Y., Michiyo, A.-K., Takashi, M., Masanori,
N., Shigeru, Y., Yoko, I., Sachiko, T., et al. (2003a). Cross-talk between peroxisome
proliferator-activated receptor (PPAR) α and liver X receptor (LXR) in nutritional regulation
of fatty acid metabolism. II. LXRs suppress lipid degradation gene promoters through
inhibition of PPAR signaling. Mol. Endocrinol. 17, 1255-1267.
Tomohiro, Y., Tomohiro, I., Hitoshi, S., Naoya, Y., Michiyo, A.-K., Takashi, M., Shigeru,
Y., Tetsuya, K., Hiroaki, O., Yoshiaki, T., et al. (2003b). Cross-talk between peroxisome
proliferator-activated receptor (PPAR) α and liver X receptor (LXR) in nutritional regulation
of fatty acid metabolism. I. PPARs suppress sterol regulatory element binding protein-1c
promoter through inhibition of LXR signaling. Mol. Endocrinol. 17, 1240-1254.
Towle, H.C. (2005). Glucose as a regulator of eukaryotic gene transcription. Trends
Endocrinol. Metab. 16, 489-494.
Ujino, S., Nishitsuji, H., Hishiki, T., Sugiyama, K., Takaku, H., and Shimotohno, K. (2016).
Hepatitis C virus utilizes VLDLR as a novel entry pathway. Proc. Natl. Acad. Sci. USA, in
press.
Umehara, T., Sudoh, M., Yasui, F., Matsuda, C., Hayashi, Y., Chayama, K., and Kohara, M.
(2006). Serine palmitoyltransferase inhibitor suppresses HCV replication in a mouse model.
Biochem. Biophys. Res. Comm. 346, 67-73.
Vercauteren, K., de Jong, Y.P., and Meuleman, P. (2014). HCV animal models and liver
disease. J. Hepatol. 61, S26-S33.
Vercauteren, K., de Jong, Y.P., and Meuleman, P. (2015). Animal models for the study of
HCV. Curr. Opin. Virol. 13, 67-74.
Viaud, J., Mansour, R., Antkowiak, A., Mujalli, A., Valet, C., Chicanne, G., Xuereb, J.-M.,
Terrisse, A.-D., Séverin, S., Gratacap, M.-P., et al. (2015). Phosphoinositides: Important
lipids in the coordination of cell dynamics. Biochimie, in press.
Vickers, K.C., Shoucri, B.M., Levin, M.G., Wu, H., Pearson, D.S., Osei-Hwedieh, D.,
Collins, F.S., Remaley, A.T., and Sethupathy, P. (2013). MicroRNA-27b is a regulatory hub
in lipid metabolism and is altered in dyslipidemia. Hepatology 57, 533-542.
Vlachos, I.S., Kostoulas, N., Vergoulis, T., Georgakilas, G., Reczko, M., Maragkakis, M.,
Paraskevopoulou, M.D., Prionidis, K., Dalamagas, T., and Hatzigeorgiou, A.G. (2012).

149
DIANA miRPath v.2.0: investigating the combinatorial effect of microRNAs in pathways.
Nucleic Acids Res. 40, W498-W504.
Vogt, D.A., Camus, G., Herker, E., Webster, B.R., Tsou, C.-L., Greene, W.C., Yen, T.-S.B.,
and Ott, M. (2013). Lipid droplet-binding protein TIP47 regulates hepatitis C virus RNA
replication through interaction with the viral NS5A protein. PLoS Pathog. 9, e1003302.
Wagschal, A., Najafi-Shoushtari, S.H., Wang, L., Goedeke, L., Sinha, S., deLemos, A.S.,
Black, J.C., Ramirez, C.M., Li, Y., Tewhey, R., et al. (2015). Genome-wide identification of
microRNAs regulating cholesterol and triglyceride homeostasis. Nat. Med. 21, 1290-1297.
Wahli, W., and Michalik, L. (2012). PPARs at the crossroads of lipid signaling and
inflammation. Trends Endocrinol. Metab. 23, 351-363.
Wakita, T., Pietschmann, T., Kato, T., Date, T., Miyamoto, M., Zhao, Z., Murthy, K.,
Habermann, A., Krausslich, H.-G., Mizokami, M., et al. (2005). Production of infectious
hepatitis C virus in tissue culture from a cloned viral genome. Nat. Med. 11, 791-796.
Walters, K.-A., Joyce, M.A., Thompson, J.C., Proll, S., Wallace, J., Smith, M.W., Furlong,
J., Tyrrell, D.L., and Katze, M.G. (2006). Application of functional genomics to the chimeric
mouse model of HCV infection: optimization of microarray protocols and genomics analysis.
Virology J. 3, 1-8.
Walther, T.C., and Farese, J., R. V. (2012). Lipid Droplets and Cellular Lipid Metabolism.
Annu. Rev. Biochem. 81, 687-714.
Wang, C., Gale, M., Jr., Keller, B.C., Huang, H., Brown, M.S., Goldstein, J.L., and Ye, J.
(2005). Identification of FBL2 as a geranylgeranylated cellular protein required for hepatitis
C virus RNA replication. Mol. Cell 18, 425-434.
Wang, H., Perry, J.W., Lauring, A.S., Neddermann, P., De Francesco, R., and Tai, A.W.
(2014a). Oxysterol-binding protein is a phosphatidylinositol 4-kinase effector required for
HCV replication membrane integrity and cholesterol trafficking. Gastroenterology 146,
1373-1385.e1311.
Wang, L., Jia, X.-J., Jiang, H.-J., Du, Y., Yang, F., Si, S.-Y., and Hong, B. (2013).
MicroRNAs 185, 96, and 223 repress selective high-density lipoprotein cholesterol uptake
through posttranscriptional inhibition. Mol. Cell. Biol. 33, 1956-1964.
Wang, X.C., Zhan, X.R., Li, X.Y., Yu, J.J., and Liu, X.M. (2014b). MicroRNA-185 regulates
expression of lipid metabolism genes and improves insulin sensitivity in mice with non-
alcoholic fatty liver disease. World J. Gastroenterol. 20, 17914-17923.
Waris, G., Felmlee, D.J., Negro, F., and Siddiqui, A. (2007). Hepatitis C virus induces
proteolytic cleavage of sterol regulatory element binding proteins and stimulates their
phosphorylation via oxidative stress. J. Virol. 81, 8122-8130.
Washburn, M.L., Bility, M.T., Zhang, L., Kovalev, G.I., Buntzman, A., Frelinger, J.A.,
Barry, W., Ploss, A., Rice, C.M., and Su, L. (2011). A humanized mouse model to study
hepatitis C virus infection, immune response, and liver disease. Gastroenterology 140, 1334-
1344.
150
Weng, L., Hirata, Y., Arai, M., Kohara, M., Wakita, T., Watashi, K., Shimotohno, K., He,
Y., Zhong, J., and Toyoda, T. (2010). Sphingomyelin activates hepatitis C virus RNA
polymerase in a genotype-specific manner. J. Virol. 84, 11761-11770.
Westhaus, S., Bankwitz, D., Ernst, S., Rohrmann, K., Wappler, I., Agné, C., Luchtefeld, M.,
Schieffer, B., Sarrazin, C., Manns, M.P., et al. (2013). Characterization of the inhibition of
hepatitis C virus entry by in vitro–generated and patient-derived oxidized low-density
lipoprotein. Hepatology 57, 1716-1724.
Willy, P.J., Umesono, K., Ong, E.S., Evans, R.M., Heyman, R.A., and Mangelsdorf, D.J.
(1995). LXR, a nuclear receptor that defines a distinct retinoid response pathway. Genes
Dev. 9, 1033-1045.
Wilson, J.A., and Sagan, S.M. (2014). Hepatitis C virus and human miR-122: insights from
bench to the clinic. Curr Opin Virol. 7, 11-18.
Wilson, J.A., Zhang, C., Huys, A., and Richardson, C.D. (2011). Human Ago2 Is required
for efficient microRNA 122 regulation of hepatitis C virus RNA accumulation and
translation. J. Virol. 85, 2342-2350.
Wittrup, A., and Lieberman, J. (2015). Knocking down disease: a progress report on siRNA
therapeutics. Nat. Rev. Genet. 16, 543-552.
Wu, C., Gilroy, R., Taylor, R., Olyaee, M., Abdulkarim, B., Forster, J., O'Neil, M.,
Damjanov, I., and Wan, Y.-J.Y. (2011). Alteration of hepatic nuclear receptor-mediated
signaling pathways in hepatitis C virus patients with and without a history of alcohol
drinking. Hepatology 54, 1966-1974.
Wu, J.-M., Skill, N.J., and Maluccio, M.A. (2010). Evidence of aberrant lipid metabolism in
hepatitis C and hepatocellular carcinoma. HPB 12, 625-636.
Xiang, Z., Qiao, L., Zhou, Y., Babiuk, L.A., and Liu, Q. (2010). Hepatitis C virus
nonstructural protein-5A activates sterol regulatory element-binding protein-1c through
transcription factor Sp1. Biochem. Biophys. Res. Comm. 402, 549-553.
Xiao, F., Yu, J., Liu, B., Guo, Y., Li, K., Deng, J., Zhang, J., Wang, C., Chen, S., Du, Y., et
al. (2014). A novel function of microRNA 130a-3p in hepatic insulin sensitivity and liver
steatosis. Diabetes 63, 2631-2642.
Xu, H.E., Stanley, T.B., Montana, V.G., Lambert, M.H., Shearer, B.G., Cobb, J.E., McKee,
D.D., Galardi, C.M., Plunket, K.D., Nolte, R.T., et al. (2002). Structural basis for antagonist-
mediated recruitment of nuclear co-repressors by PPARα. Nature 415, 813-817.
Xu, L., Zhou, L.K., and Li, P. (2012). CIDE proteins and lipid metabolism. Arterioscler.
Thromb. Vasc. Biol. 32, 1094-1098.
Xu, M.-J., Cai, Y., Wang, H., Altamirano, J., Chang, B., Bertola, A., Odena, G., Lu, J.,
Tanaka, N., Matsusue, K., et al. (2015). Fat-Specific Protein 27/CIDEC promotes
development of alcoholic steatohepatitis in mice and humans. Gastroenterology 149, 1030-
1041.e1036.
Yamane, D., McGivern, D.R., Wauthier, E., Yi, M., Madden, V.J., Welsch, C., Antes, I.,
Wen, Y., Chugh, P.E., McGee, C.E., et al. (2014). Regulation of the hepatitis C virus RNA
replicase by endogenous lipid peroxidation. Nat. Med. 20, 927-935.

151
Yanagi, M., Purcell, R.H., Emerson, S.U., and Bukh, J. (1997). Transcripts from a single
full-length cDNA clone of hepatitis C virus are infectious when directly transfected into the
liver of chimpanzee. Proc. Natl. Acad. Sci. USA 94, 8738-8743.
Yang, M., Liu, W., Pellicane, C., Sahyoun, C., Joseph, B.K., Gallo-Ebert, C., Donigan, M.,
Pandya, D., Giordano, C., Bata, A., et al. (2014). Identification of miR-185 as a regulator of
de novo cholesterol biosynthesis and low density lipoprotein uptake. J. Lipid Res. 55, 226-
238.
Yasui, K., Harano, Y., Mitsuyoshi, H., Tsuji, K., Endo, M., Nakajima, T., Minami, M., Itoh,
Y., Zen, Y., Nakanuma, Y., et al. (2009). Steatosis and hepatic expression of genes
regulating lipid metabolism in Japanese patients infected with hepatitis C virus. J.
Gastroenterol. 45, 95-104.
Ye, J., Wang, C., Sumpter, R., Brown, M.S., Goldstein, J.L., and Gale, M. (2003). Disruption
of hepatitis C virus RNA replication through inhibition of host protein geranylgeranylation.
Proc. Natl. Acad. Sci. USA 100, 15865-15870.
York, A.G., Williams, K.J., Argus, J.P., Zhou, Q.D., Brar, G., Vergnes, L., Gray, E.E., Zhen,
A., Wu, N.C., Yamada, D.H., et al. (2015). Limiting cholesterol biosynthetic flux
spontaneously engages type I IFN signaling. Cell 163, 1716-1729.
Zelcer, N., and Tontonoz, P. (2006). Liver X receptors as integrators of metabolic and
inflammatory signaling. J. Clin. Invest. 116, 607-614.
Zeng, J., Wu, Y., Liao, Q., Li, L., Chen, X., and Chen, X. (2012). Liver X receptors agonists
impede hepatitis C virus infection in an Idol-dependent manner. Antiviral Res. 95, 245-256.
Zhang, C., Huys, A., Thibault, P.A., and Wilson, J.A. (2012). Requirements for human Dicer
and TRBP in microRNA-122 regulation of HCV translation and RNA abundance. Virology
433, 479-488.
Zhang, X., Daucher, M., Armistead, D., Russell, R., and Kottilil, S. (2013). MicroRNA
expression profiling in HCV-infected human hepatoma cells identifies potential anti-viral
targets induced by interferon-α. PLoS ONE 8, e55733.
Zhao, X.-Y., and Lin, J.D. (2015). Long noncoding RNAs: A new regulatory code in
metabolic control. Trends Biochem. Sci. 40, 586-596.
Zhong, J., Gastaminza, P., Chung, J., Stamataki, Z., Isogawa, M., Cheng, G., McKeating,
J.A., and Chisari, F.V. (2006). Persistent hepatitis C virus infection in vitro: Coevolution of
virus and host. J. Virol. 80, 11082-11093.

152
Contribution of Collaborators
Contributions of all collaborators are delineated in the preface sections of Chapters 2-4.

153
Appendices
154
Supplemental information for Chapter 2
Supplemental materials and methods
Cell Culture, transfections, and infections
Adherent Huh7.5 and Huh7 cells were cultured in Dulbecco's Modified Eagle Medium
(DMEM; Invitrogen, Burlington, ON) supplemented with 100 nM nonessential amino acids
(NEAA), 50 U/mL penicillin, 50 mg/mL streptomycin, and 10% fetal bovine serum (FBS;
PAA Laboratories, Etobicoke, ON). Transfections were done using DMRIE-C (Invitrogen)
for the HCV subgenomic replicon (SGR) RNA and Lipofectamine 2000 (Invitrogen) for both
the psiCheck2 (Promega, Madison, WI), miRNA mimics and inhibitors (Ambion, Austin,
TX). All transfections were performed following the manufacturers’ protocols. HCV SGR
transfection efficiency was confirmed via luciferase assay. 2-chloro-5-nitro-N-
(pyridyl)benzamide (Calbiochem, San Diego, CA) and bezafibrate (Cedarlane, Burlington,
ON), LY294002 (Selleck Chem, Houston, TX) treatments were performed at the described
concentrations after washing cells with 1X PBS.
JFH-1T harbors 3 amino acid changes that enhance infectious virus production and was
derived from the cell culture-adapted JFH-1 strain JFH-AM1, as previously described
(Russell et al., 2008). JFH-1T infections of Huh7.5 were performed in 6-well plates. In
brief, cells were seeded with 2x10⁵ cells per well. 24 hours later, cells were either infected
with JFH-1T (MOI = 0.1) or mock infected. 4hrs post-infection (or mock infection), medium
was removed and replaced with fresh medium (the normal DMEM + 10 % FCS). Cells were
harvested for RNA isolation 72 hours post-infection.

155
Cytotoxicity assay
Post-transfection, cytotoxicity was evaluated using MTT assays as previously described
(Kennedy et al., 2009; Kennedy et al., 2011). After two PBS washes, 50 µL of 2.5 mg/mL
MTT in PBS was added to each well. The cells were incubated with MTT for 3 hrs, and the
media was aspirated. The remaining formazzan crystals were solubilized in 150 µL of
DMSO. Absorbance of the wells was then measured on a Spectra Max M2 (Molecular
Devices), and the data was recorded using Softmax Pro 4.7 software with a pre-shake time of
10 seconds.
Triglyceride assay
Triglyceride concentrations were analyzed directly by spectrophotometric analyses, using the
triglyceride quantification kit (BioVision, Mountain View, CA) according to the
manufacturer's instructions. For triglyceride assays, total protein levels in lysates were
quantified with the DC protein assay (Bio-Rad, Hercules, CA). Triglyceride levels were
expressed as nmol/mg protein.
Quantitative RT-PCR
MicroRNA levels were quantified using the Taqman MicroRNA Assay (Applied
Biosystems, Foster City, CA). In brief, 10 ng of total RNA was reverse transcribed using the
TaqMan MicroRNA Reverse Transcription Kit. miRNA levels were analyzed using the
Taqman real-time (qRT-PCR) method (Chen et al., 2005). Each PCR sample included 1X
Universal Taqman PCR Master Mix (Applied Biosystems), TaqMan probes against either U6
RNA or miR-27a/b (Applied Biosystems), forward primer, and the universal reverse primer.
For mRNA and HCV RNA levels, 500 ng of total RNA was used for cDNA synthesis using
the Superscript II kit (Invitrogen, Burlington, ON) according to the manufacturer's protocol.
Quantitative PCR (qPCR) was subsequently performed on an iCycler (Bio-Rad) using iQ
156
SYBR Green Supermix (Bio-Rad), as per manufacturer’s protocol. Primer sequences are
listed in Table S2.1. A 20 μL reaction was assembled according to the manufacturer's
protocol. For data analysis, the 2− ΔΔCt method was used and mean fold changes in
expression are shown relative to mock or control transfected samples (Livak and Schmittgen,
2001).
RNA isolation
RNA isolation from hepatocytes was performed using TriZol (Invitrogen) as per the
manufacturer’s protocol. RNA integrity was confirmed by electrophoresis on 0.8% agarose
gel in 1X TBE (Ambion, Austin, TX).
In vitro transcription
In vitro transcripts were synthesized using the MEGAscript T7 kit (Ambion) according to the
manufacturer's protocol. Briefly, the template DNA was linearized with the restriction
enzyme ScaI (New England Biolabs, Pickering, ON), ethanol precipitated for 30 min, and
subsequently resuspended in RNase-free water to a final concentration of 0.5 μg/μL. The
IVT reaction was set up in a final volume of 20 μL and incubated at 37 °C for 4 h. In order to
degrade the template DNA, 1 μL of DNase I was added and the reaction was incubated for an
additional 15 min at 37 °C. The in vitro transcripts were then cleaned up using the
MEGAclear™ kit (Ambion) according to the manufacturer's protocol. The concentration was
determined by measurement of the absorbance at 260 nm with an ND-1000
spectrophotometer (NanoDrop Technologies, Rockland, DE), and RNA integrity was
verified by electrophoresis on 0.8% agarose gel in TBE.
Immunoblot analysis
Huh7.5-FGR cells were seeded with 2.5×10⁵ cells in 6 well plates for preparation of Western
blot lysates. After transfection with miR-27 or control mimics and inhibitors, as described

157
previously, cells were washed twice with PBS and lysed with an SDS lysis buffer consisting
of 50 mM Tris–HCl (pH 6.8), 2% SDS, and 10% glycerol. A protease inhibitor cocktail mix
(Roche Diagnostics, Penzberg, Germany) was added to each extract. The protein
concentration of each sample was quantified using the Bio-Rad DC Protein Assay according
to the manufacturer's protocol. Prior to loading, 10% v/v of DTT and bromophenol blue (1:1)
were added to each sample, and 30-60 µg/well was loaded onto a SDS–PAGE gel (10%
resolving, 4% stacking gel). The resolved proteins were transferred to a Hybond-P
(Amersham Biosciences, Piscataway, NJ) polyvinylidene difluoride membrane. The
membrane was probed using a mouse anti-NS5A (1:3000 dilution, Virogen, Boston, MA),
mouse anti-NS3 (1:3000 dilution, Virostat, Portland, ME), or mouse anti-PTP1D (1:10000
dilution; Sigma, Saint Louis, MO) primary antibodies followed by a secondary (HRP)-
conjugated goat anti-mouse IgG antibody (1:10,000 dilution, Jackson ImmunoResearch
Laboratories, Inc., Westgrove, PA). Protein bands were visualized by Western Lightning
Western Blot Chemiluminescence reagents (GE Healthcare, Baie d'Urfé, QC) according to
the manufacturer's protocol.
Statistical analysis
Student’s t-test was used to analyze the data, and P-values less than 0.05 were deemed
significant.
miRNA sensors and luciferase assays
miR-27b sensor plasmid was constructed as previously described.(Okamura et al., 2007)
Briefly, an insert containing two complementary sequences to the guide strand of miR-27b
was cloned into the 3’UTR of the Renilla luciferase gene of the psiCheck-2 vector
(Promega). Sequences corresponding to the oligonucleotides to make the inserts for the
miR-27 sensor cloning are listed in Table S2.1. Dual luciferase assays for psiCheck2 vector

158
transfected cells were performed as previously described (Dyer et al., 2000). For co-
transfections of reporter and sensor plasmids, the viral protein expressing plasmids were
described elsewhere (Nasheri et al., 2013). The control pTriEx4-CFP plasmid was derived
from a previously described pOpsin-CFP (Koukiekolo et al., 2009) using the following
primers and restriction sites:
AAGGAAAAAAGCGGCCGCAATGGTGAGCAAGGGCGAGG (Forward – NotI site) and
CGACCATGGCTTGTACAGCTCGTCCATGC (Reverse – XhoI site). Individual viral
proteins was confirmed via Western blot, as described elsewhere (Nasheri et al., 2013). The
procedure for single luciferase assays performed to confirm transient transfection efficiency
of HCV SGR is described elsewhere (Nasheri et al., 2011).
Generation of SCID/beige-Alb/uPA chimeric mice
All mice were housed and maintained under specific pathogen-free conditions according to
Canadian Council on Animal Care guidelines. SCID-beige/Alb-uPa mice were transplanted
with human primary hepatocytes as described previously (Mercer et al., 2001).
Cryopreserved human primary hepatocytes were purchased from CellDirect Inc, USA. Each
lot number represents a distinct donor individual. In this study, two lots of cells were used:
Hu8063 and Hu8085. Four and eight weeks after transplantation, human hepatocyte
repopulation levels were determined by measuring human albumin in mouse serum using
sandwich ELISA. Briefly, the sandwich ELISA was performed using goat anti-human
albumin antibody (Cedarlane) as capture antibody, goat anti-human albumin antibody
conjugated with HRP (BETHYL) as detection antibody and TMB microwell peroxidase
substrate system (KPL) for detection. Human hepatocyte repopulation of profiled mice
samples were characterized as previously described (Walters et al., 2006). On average,
percentage human hepatocyte repopulation was 87 + 2 % (SEM).

159
Chimeric animals with human albumin concentrations at 1000 ug/mL or higher at
eight weeks post transplantation were used for HCV infection studies. For viral infection,
animals received a single intravenous injection of human patient HCV-positive serum. Two
isolates of HCV viruses were used in this study: HCV genotype 1a and HCV genotype 2a.
Mice were terminated by cervical dislocation, and the livers were excised, dissected into
small pieces, and then snap frozen in liquid nitrogen or fixed in formalin for further
histological and molecular analyses. Total RNA was then isolated according to a standard
TriZOL procedure.
HCV RNA was extracted from 30ul mouse serum samples using High Pure Viral
Nucleic Acid kit (Roche) following the instructions. Extracted RNA samples was dried in
speedvaccum at 60C for 1.5 hours, followed by reverse transcription using HCV specific
reverse primer 3’-GTG TTT CTT TTG GTT TTT CTT TGA GGT TTA GG-5’ and
ThermoScript™ reverse transcriptase (Invitrogen). Real-time quantification PCR was
performed in ABI 7900 Real Time PCR system and Taqman chemistry with HCV specific
primers and probe: forward primer 3’-TCT GCG GAA CCG GTG AGT A-5’, reverse primer
as described above and probe 5'-/56-FAM/ CAC GGT CTA CGA GAC CTC CCG GGG
CAC /36-TAMTSp/-3'. Known references of cloned HCV genomic cDNA were amplified in
parallel to establish a standard curve for quantification. The PCR efficiency was determined
by the slope of the standard curve. Viral load was determined using the Applied Biosystems
SDS Software 2.3 (Applied Biosystems). Quantification of HCV intrahepatic RNA levels
was performed on the same total RNA sample that was used for the gene expression real
time PCR experiments. cDNA was synthesized using M-MLV (Invitrogen) and random
primer oligonucleotides (Invitrogen), followed by quantitative realtime PCR as described
above. Gene expression real-time PCR of human-specific hypoxanthine-guanine

160
phosphoribosyltransferase-1 (HPRT-1) levels (forward primer:
CTTGGTCAGGCAGTATAATCCA, reverse primer: CAAATCCAACAAAGTC TGGCT)
was run in parallel for human-content normalization purpose.

161
Supplemental figures and tables
Figure S2.1. miR-27 isoforms and conservation of sequence. Sequences of both isoforms
of miR-27 (a and b) are depicted. The single nucleotide difference in miRNA sequences in
conserved across species. Since, only one nucleotide separates the two miRNAs, the
majority of computational target prediction algorithms predict the same subset of genes as
targets of miR-27a and b. Therefore, target validation was restricted to miR-27b, but the
results are assumed to be applicable for both isoforms.
hsa-miR-27a uucacaguggcuaaguuccgc
mmu-miR-27a uucacaguggcuaaguuccgc
rno-miR-27a uucacaguggcuaaguuccgc
ptr-miR-27a uucacaguggcuaaguuccgcc
cfa-miR-27a uucacaguggcuaaguuccg
hsa-miR-27b uucacaguggcuaaguucugc
mmu-miR-27b uucacaguggcuaaguucugc
rno-miR-27b uucacaguggcuaaguucugc
ptr-miR-27b uucacaguggcuaaguucugc
cfa-miR-27b uucacaguggcuaaguucugc

162
Mock Core NS4B0.0
0.5
1.0
1.5
2.0
2.5miR-27a
miR-27b
Transfection
Rela
tive m
iRN
A
exp
ressio
n
Figure S2.2. Overexpression of HCV viral proteins yields increases in expression of
both miR-27 isoforms. Huh7 cells were transfected with plasmids expressing core and
NS4B. RNA was isolated 48 hours post-transfection and qRT-PCR was performed to
measure relative expression of miR-27a and miR-27b relative to mock. All miR-27
expression values were normalized to RNU6B levels (housekeeping gene). Error bars
represent the standard error of the mean (n>2).

163
A
B
Figure S2.3. HCV core and NS4B activate miR-27 activity in a PI3K pathway-
dependent manner. Huh7 cells were co-transfected with dual luciferase reporter plasmid
bearing tandem wildtype (a) or mutant (b) miR-27 binding sites in the 3’UTR of the Renilla
luciferase gene and plasmids expressing core and NS4B. Four hours post-transfection, cells
were treated with either LY290042, a PI3K inhibitor, or DMSO (mock). Forty hours post-
treatment, cells were lysed and luciferase activity was measured. Luciferase activity was
normalized by firefly luciferase activity for transfection efficiency and plotted as fold change
relative to cells transfected with the reporter construct alone (mock). Error bars represent
standard error of the mean for three independent trials.
Mock Core NS4B0.00
0.25
0.50
0.75
1.00
1.25
1.50
1.75Mock
LY290042
Transfection
Rela
tive l
ucif
era
se
acti
vit
y
Mock Core NS4B0.0
0.1
0.2
0.3
0.4
0.5
0.6
0.7
0.8
0.9
1.0
1.1
Mock
LY290042
Transfection
Rela
tive l
ucif
era
se
acti
vit
y

164
Figure S2.4. Validation of miRNA mimic and inhibitor activity. Huh7 cells were co-
transfected with dual luciferase reporter plasmid bearing tandem wildtype miR-27 binding
sites in the 3’UTR of the Renilla luciferase gene and 20 nM miR-27b or control mimics and
inhibitors for 48 hours. The wildtype sensor plasmid contained two perfectly complementary
miR-27b binding sites spanning the entire guide strand, while the mutant sensor plasmid
contained three mutations in the seed sequence region of miR-27b. Luciferase activity was
normalized by firefly luciferase activity for transfection efficiency and plotted as fold change
relative to cells transfected with only the reporter construct (mock). Error bars represent the
standard deviation of two independent trials.

165
A
B
Figure S2.5. miR-27 overexpression induces lipid accumulation in Huh7.5 cells. (a)
Representative CARS images are shown of Huh7.5 cells transfected with 20 nM miR-27b or
control mimics. Cells were fixed 48 hours post-transfection. Scale bars shown represents 10
μm. The results of voxel analysis are shown in (b) and represent the percentage cellular lipid
volume. Voxel analysis is representative of n > 30 cells. Error bars represent the standard
error of the mean.
Control miR-27b0.00
0.25
0.50
0.75
1.00
1.25
1.50
1.75
Mimic
Cell
ula
r li
pid
vo
lum
e
(%)
Control miR-27b
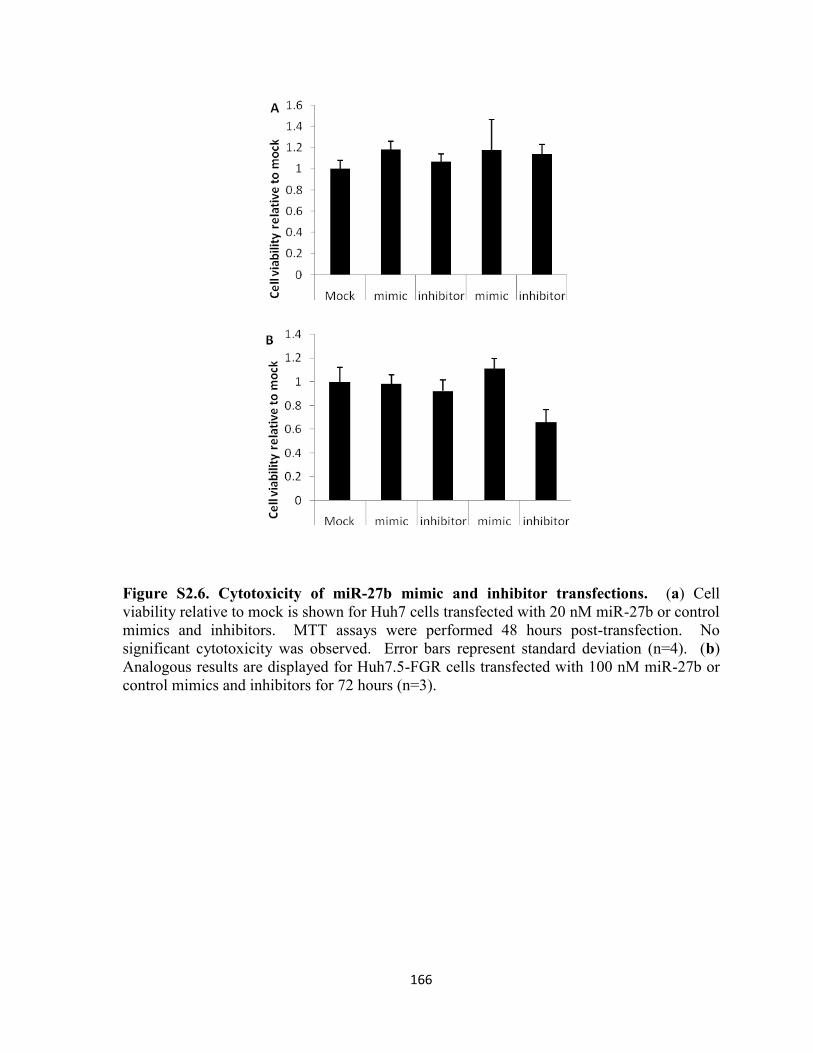
166
Figure S2.6. Cytotoxicity of miR-27b mimic and inhibitor transfections. (a) Cell
viability relative to mock is shown for Huh7 cells transfected with 20 nM miR-27b or control
mimics and inhibitors. MTT assays were performed 48 hours post-transfection. No
significant cytotoxicity was observed. Error bars represent standard deviation (n=4). (b)
Analogous results are displayed for Huh7.5-FGR cells transfected with 100 nM miR-27b or
control mimics and inhibitors for 72 hours (n=3).

167
A
B
Figure S2.7. miR-27b regulates key genes involved in triglyceride homeostasis. (a)
Huh7.5-FGR cells were transfected with either 20 nM control (n=2) or miR-27b mimics
(n=3). Total RNA was isolated 72 hours post-transfection and real-time PCR was used to
measure the abundance of miR-27 gene targets associated with lipid metabolism. RNA
abundance was normalized relative to control levels. Error bars represent the standard error
of the mean. (b) The miR-27b predicted binding sites and their conservation across various
species are depicted. Predicted sites were obtained from Targetscan
(http://www.targetscan.org/). Numbering of nucleotides is based off the first nucleotide of
either the open reading frame (ORF) or 3’UTR for the human transcript mRNA. Similar
binding of these targets is predicted for miR-27a. For the ANGPTL3 ORF site, rare codons
preceding miRNA binding site are highlighted by yellow boxes. Rare codons were
designated as having a codon frequency less than 12.5 per thousand as designated by the
codon usage database (http://www.kazusa.or.jp/codon/).
PPAR- ANGPTL30.0
0.1
0.2
0.3
0.4
0.5
0.6
0.7
0.8
0.9
1.0
1.1Control mimic
miR-27b mimic
Rela
tive m
RN
A a
bu
nd
an
ce

168
Figure S2.8. PPAR-α antagonism in Huh7 cells induces lipid accumulation. Huh7 cells
were treated with a PPAR antagonist, 2-chloro-5-nitro-N-(pyridyl)benzamide (BA) or
vehicle (methanol; mock). Six hours post-treatment, samples were fixed and imaged using
CARS microscopy to visualize hepatic lipid content. We observed a significant increase in
triglyceride levels, similar to the phenotype observed during miR-27 overexpression.
Representative images are shown (n=3). Scale bars shown represent 10 µm.
Mock BA
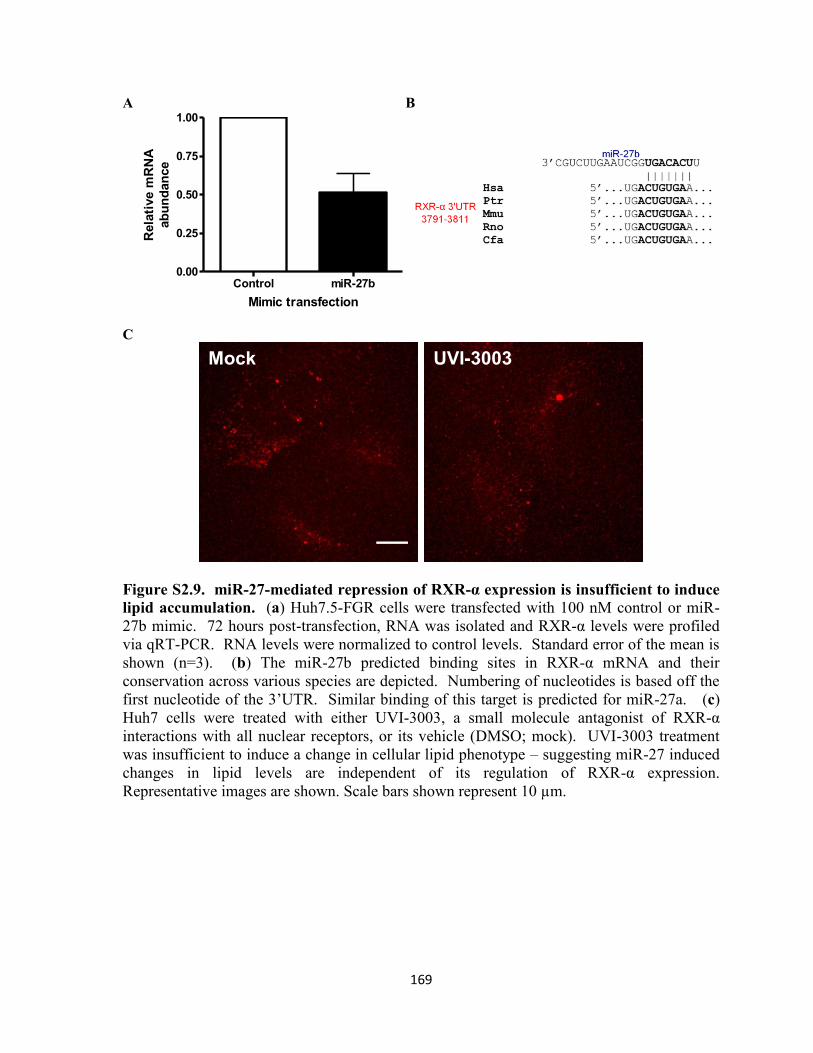
169
A B
C
Figure S2.9. miR-27-mediated repression of RXR-α expression is insufficient to induce
lipid accumulation. (a) Huh7.5-FGR cells were transfected with 100 nM control or miR-
27b mimic. 72 hours post-transfection, RNA was isolated and RXR-α levels were profiled
via qRT-PCR. RNA levels were normalized to control levels. Standard error of the mean is
shown (n=3). (b) The miR-27b predicted binding sites in RXR-α mRNA and their
conservation across various species are depicted. Numbering of nucleotides is based off the
first nucleotide of the 3’UTR. Similar binding of this target is predicted for miR-27a. (c)
Huh7 cells were treated with either UVI-3003, a small molecule antagonist of RXR-α
interactions with all nuclear receptors, or its vehicle (DMSO; mock). UVI-3003 treatment
was insufficient to induce a change in cellular lipid phenotype – suggesting miR-27 induced
changes in lipid levels are independent of its regulation of RXR-α expression.
Representative images are shown. Scale bars shown represent 10 µm.
Control miR-27b0.00
0.25
0.50
0.75
1.00
Mimic transfection
Rela
tive m
RN
A
ab
un
dan
ce
UVI-3003 Mock
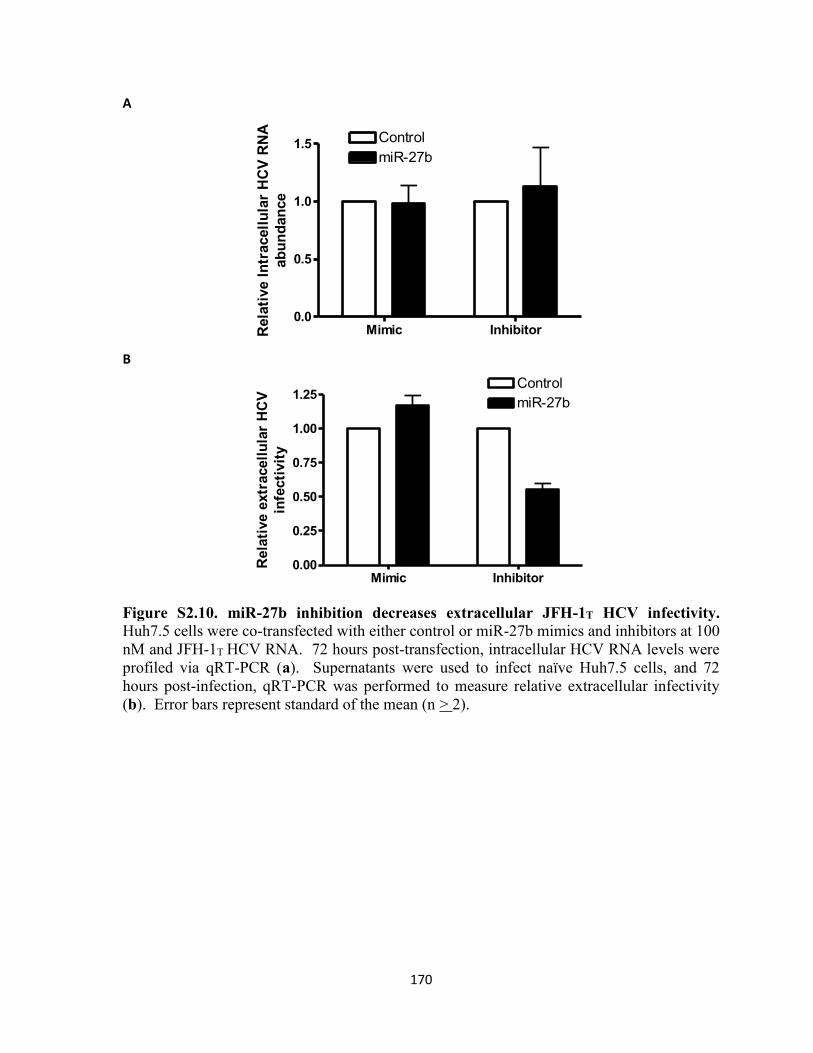
170
A
B
Figure S2.10. miR-27b inhibition decreases extracellular JFH-1T HCV infectivity.
Huh7.5 cells were co-transfected with either control or miR-27b mimics and inhibitors at 100
nM and JFH-1T HCV RNA. 72 hours post-transfection, intracellular HCV RNA levels were
profiled via qRT-PCR (a). Supernatants were used to infect naïve Huh7.5 cells, and 72
hours post-infection, qRT-PCR was performed to measure relative extracellular infectivity
(b). Error bars represent standard of the mean (n > 2).
Mimic Inhibitor0.0
0.5
1.0
1.5 Control
miR-27b
Rela
tive I
ntr
acell
ula
r H
CV
RN
A
ab
un
dan
ce
Mimic Inhibitor0.00
0.25
0.50
0.75
1.00
1.25Control
miR-27b
Rela
tive e
xtr
acell
ula
r H
CV
infe
cti
vit
y

171
Figure S2.11. HCV infection of SCID-beige/Alb-uPa mice. HCV viremia RNA (right
panel) and intrahepatic HCV RNA (left panel) levels of HCV infected SCID-beige/Alb-uPa
mice. Mice were infected with clinical isolates of genotype 1a (gt1) or 2a (gt2) and samples
were taken at either 21 days or 7 weeks. Each bar corresponds to an individual infected
mouse. Two sets of donor hepatocytes (Hu0865 and Hu0863) were used for this study.
Viremia RNA levels are shown in genome equivalents per mL (GE/mL) while intrahepatic
HCV RNA levels were normalized by HPRT expression levels, as described in Supplemental
Materials and Methods.
Intrahepatic HCV RNA
mo
ck
gt1
-1
gt1
- 2
gt1
- 3
gt1
-4
gt1
- 5
gt1
- 6
gt1
- 7
gt1
-8
gt2
-1
gt2
-2
10 0
10 1
10 2
10 3
10 4
10 5
21 days 7 weeks
Donor Hu8085 Donor Hu8063
*
HC
V G
E r
ela
tive t
o H
prt
HCV viremia RNA
mo
ck
gt1
-1
gt1
- 2
gt1
- 3
gt1
-4
gt1
- 5
gt1
- 6
gt1
- 7
gt1
-8
gt2
-1
gt2
-2
10 0
10 1
10 2
10 3
10 4
10 5
10 6
10 7
10 8
21 days 7 weeks
Donor Hu8085 Donor Hu8063
*
HC
V G
E/m
l

172
Table S2.1. List of oligonucleotides
*mutations of miR-27b seed sequence highlighted in green

173
Supplemental information for Chapter 3
Supplemental figures and tables
Figure S3.1. 25-hydroxycholesterol (25-HC) inhibits HCV replication. Dose response
curve of 25-HC inhibition of HCV replication in Huh7.5 cells infected with JFH-1T. (IC50 =
1.5 μM). Huh7.5 cells were treated with a concentration range of 25-HC for 24 hours, and
then infected with JFH1T (MOI=0.1). 48 hours post-infection, qPCR analysis was performed
to measure relative intracellular HCV RNA levels. Values for each trial were normalized to
vehicle (methanol) conditions.

174
Figure S3.2. 25-hydroxycholesterol (25-HC) inhibits Dengue virus infectivity. (a)-(b),
Huh7.5 cells were treated with 5 μM 25-HC for 24 hours, and then infected with Dengue
virus (MOI=5). 48 hours post-infection, supernatants were then used to infect Vero cells
(n=3) and plaque assays were performed to measure infectivity (a). Values for each trial
were normalized to vehicle (methanol) conditions. Intracellular Dengue viral RNA levels
were measured by qPCR (n=3) and expression levels relative to mock are shown (b). Data
represents mean values s.e. Unpaired two-tailed t-test was used to evaluate statistical
significance. (*P ≤ 0.05)

175
Figure S3.3. Overview of general application of SMART technique towards
identification of pathways regulated by miRNAs modulated by pathogens or in disease
states.

176
Figure S3.4. Functional analysis of the role of 25-HC regulated miRNAs in HCV
replication. (a) qRT-PCR analysis of relative intracellular HCV RNA levels in abundance in
Huh7.5-FGR cells transfected with control, miR-130b, or miR-185 inhibitors at indicated
concentrations (n ≥ 3). (b) qRT-PCR analysis of relative intracellular HCV RNA levels in
Huh7.5-FGR cells transfected with 100 nM control or miRNA inhibitors (n=3). Data
represents mean values s.e. Unpaired two-tailed t-test was used to evaluate statistical
significance. (*P ≤ 0.05)

177
Figure S3.5. HCV represses miR-185 expression. Huh7.5 cells were either mock infected
or infected with a high titer strain of HCV (JFH-1T). 72 hours post-infection, cells were
lysed. qRT-PCR analysis of relative miRNA expression was performed to validate a subset
of miRNAs that were differentially expressed during HCV infection (>1.5 fold; P < 0.05).
Data represents mean values (n=2).

178
Figure S3.6. 25-HC–stimulated miRNAs inhibit HCV infection. (a) qRT-PCR analysis of
relative intracellular HCV RNA levels in JFH-HS infected Huh7.5 cells transfected with 100
nM control or miR-185 mimics. Data represents mean values s.e (n=3). Unpaired two-
tailed t-test was used to evaluate statistical significance. (*P ≤ 0.05) (b) qRT-PCR analysis
of relative intracellular HCV RNA abundance in JFH-HS infected Huh7.5 cells transfected
with control or miR-185 inhibitor (n=2). Data represents mean values.

179
Figure S3.7. 25-HC–stimulated miRNAs regulate hepatic lipid metabolism. (a)–(b)
Relative mRNA expression level of miR-185 targets in 100 nM control and miR-185 mimic
transfected (a) JFH-HS and (b) JFH-1T infected Huh7.5 cells (n ≥ 3). Data represents mean
values s.e. (c) Western blot analysis of miR-185 and miR-130b target protein expression
in Huh7.5-FGR cells transfected with 100 nM control or miR-130b mimic, 72 hours post-
transfection. Mature (M) and precursor (P) forms of SREBP2 are shown. Band
corresponding to the processed form of LDLR is shown. β-tubulin serves as a loading
control. Relative miRNA target protein levels to control were quantified using ImageJ.
Image is representative of three independent experiments. (d) Western blot analysis of
LDLR expression in Huh7.5-FGR cells transfected with 100 nM control, miR-185, or miR-
130b mimics at the indicated concentrations. Band corresponding to the processed form of
LDLR is shown. β-tubulin serves as a loading control. Image is representative of two
independent experiments. Relative miRNA target protein levels to control were quantified
using ImageJ. Unpaired two-tailed t-test was used to evaluate statistical significance. (*P ≤
0.05)

180
Figure S3.8. 25-HC–stimulated miRNAs directly regulate SCD1, AGPAT3, SREBP2,
and LDLR. (a)–(d) Relative luciferase reporter activity in Hek293 cells transfected with
bicistronic vectors encoding firefly luciferase with the 3’UTRs of (a) SREBP2, (b)
AGPAT3, (c) SCD, and (d) LDLR bearing the wildtype (WT) and mutated (PM) miR-185
binding sites. 24 hours post-transfection, cells were transfected with 50 nM control (Con
miR) or miR-185 mimics. 48 hours later, dual luciferase activity was analyzed, and Renilla
luciferase signal was used to normalize for transfection efficiency. (e) Analogous
experiments were performed with miR-130b binding sites in LDLR 3’UTR. Data are
expressed as mean % of 3′UTR activity relative to control miRNA transfected samples
(n>5). Binding sites taken from TargetScan (Friedman et al., 2009). In all instances,
mutations of predicted sites rescued luciferase signaling demonstrating direct targeting of the
miRNA to the 3’UTR. Data represents mean values s.e. Unpaired two-tailed t-test was
used to evaluate statistical significance. (*P ≤ 0.05)

181
Figure S3.9. Conservation of miRNA recognition elements in direct targets of 25-HC–
stimulated miRNAs. (a)–(d), Sequence conservation of miR-185 binding sites across
vertebrates (Hsa = Homo sapiens; Ptr = Pan troglodytes; Mmu = Mus musculus; Rno =
Rattus norvegicus; Cfa = Canis familiaris) in the 3’UTRs of (a) SCD1, (b) SREBP2, (c)
LDLR, and (d) AGPAT3. (e) Sequence conservation of miR-130b binding sites in LDLR
3’UTR. Refer to Figure S3.8 for position of miRNA binding sites in context of 3’UTR.
Sequences were taken from TargetScan (Friedman et al., 2009).

182
Figure S3.10. miR-185 overexpression activates miR-130b expression. (a)–(b) qRT-PCR
analysis of relative (a) miR-130b and (b) miR-185 expression in Huh7.5 cells transfected
with 100 nM (a) miR-185 and (b) miR-130b mimics (n 3). Data represents mean values
s.e. Unpaired two-tailed t-test was used to evaluate statistical significance. (*P ≤ 0.05)
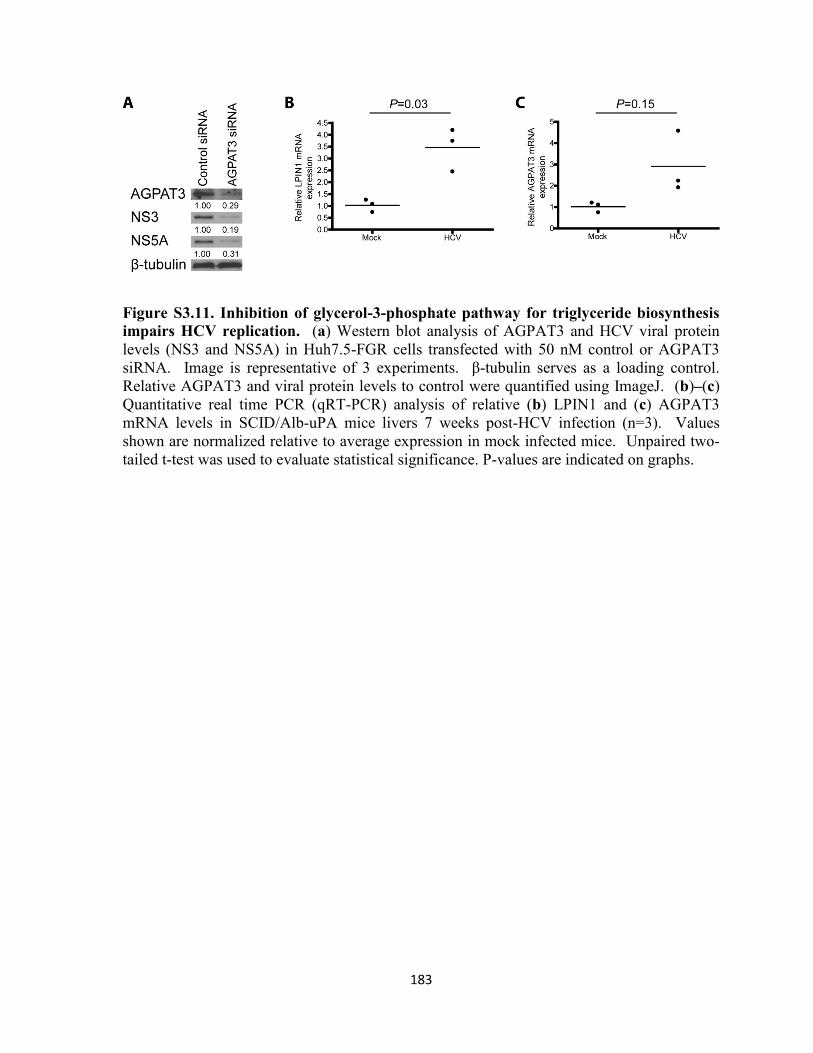
183
Figure S3.11. Inhibition of glycerol-3-phosphate pathway for triglyceride biosynthesis
impairs HCV replication. (a) Western blot analysis of AGPAT3 and HCV viral protein
levels (NS3 and NS5A) in Huh7.5-FGR cells transfected with 50 nM control or AGPAT3
siRNA. Image is representative of 3 experiments. β-tubulin serves as a loading control.
Relative AGPAT3 and viral protein levels to control were quantified using ImageJ. (b)–(c)
Quantitative real time PCR (qRT-PCR) analysis of relative (b) LPIN1 and (c) AGPAT3
mRNA levels in SCID/Alb-uPA mice livers 7 weeks post-HCV infection (n=3). Values
shown are normalized relative to average expression in mock infected mice. Unpaired two-
tailed t-test was used to evaluate statistical significance. P-values are indicated on graphs.
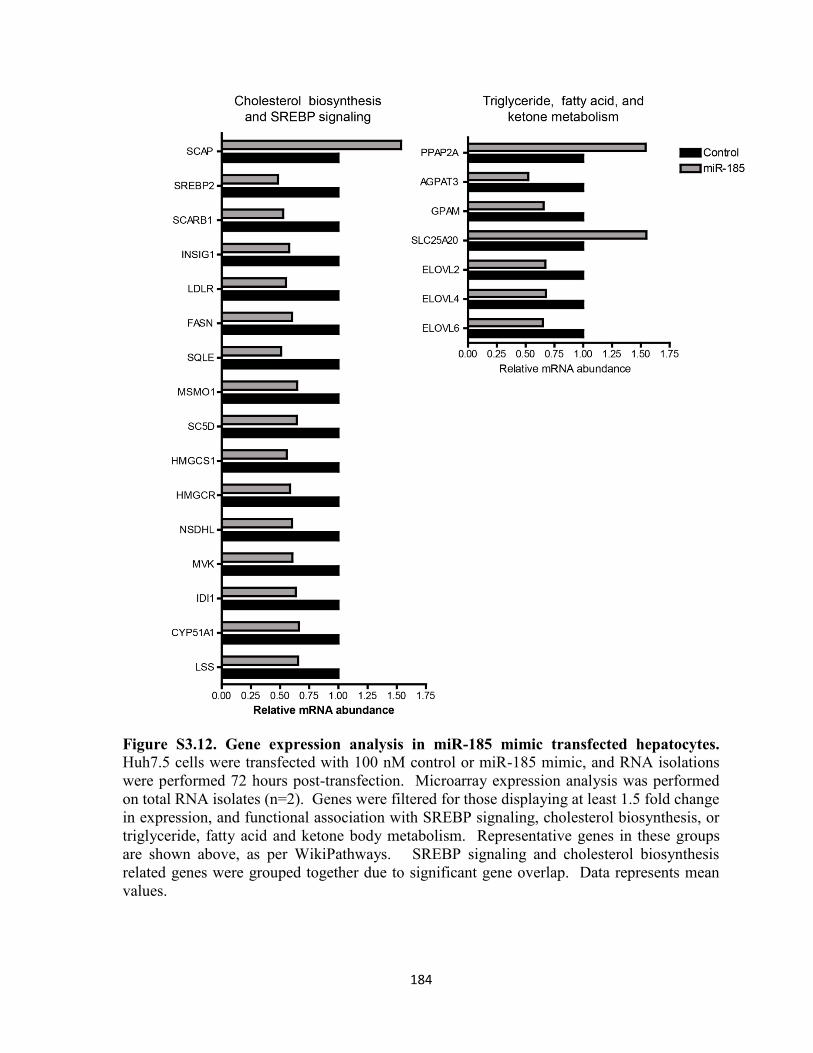
184
Figure S3.12. Gene expression analysis in miR-185 mimic transfected hepatocytes.
Huh7.5 cells were transfected with 100 nM control or miR-185 mimic, and RNA isolations
were performed 72 hours post-transfection. Microarray expression analysis was performed
on total RNA isolates (n=2). Genes were filtered for those displaying at least 1.5 fold change
in expression, and functional association with SREBP signaling, cholesterol biosynthesis, or
triglyceride, fatty acid and ketone body metabolism. Representative genes in these groups
are shown above, as per WikiPathways. SREBP signaling and cholesterol biosynthesis
related genes were grouped together due to significant gene overlap. Data represents mean
values.

185
Figure S3.13. HCV infection in vivo perturbs hepatic lipid homeostasis. (a)–(b) Human
liver xenotransplanted SCID/Alb-uPA mice were infected with clinical isolates of HCV
genotype 1a (n > 3). qRT-PCR analyses of relative (a) miR-185 expression levels in mice
liver 21 days post-infection and (b) miR-130b expression levels 21 days and 7 weeks post-
infection. Values shown are normalized relative to average expression in mock infected
mice. (c)–(d) Fatty acid methyl ester (FAME) and total lipid analysis was performed on
liver lysates of mock (n=3) and HCV genotype 1a (n=3) and 2b (n=2) infected mice.
Significant changes were only observed in (c) palmitoleic acid and (d) cholesterol ester (CE)
levels. Palmitoleic acids are displayed as percentage of total fatty acids analyzed. CE levels
represent sum of two HPLC trace peaks corresponding two species of CEs (in nanograms per
milligram of lysate analyzed). Data represents mean values ± s.e. Unpaired two-tailed t-test
was used to evaluate statistical significance. P values are indicated on each graph.

186
Figure S3.14. Effect of oleic acid and lipid mixture on 25-HC induced miRNAs’ anti-
viral effect. (a) Relative HCV RNA and miR-185 target mRNA levels in Huh7.5-FGR cells
transfected with 100 nM control (Con miR) or miR-185 mimics in the presence and absence
of oleic acid (OA) (n=3). (b) Relative HCV RNA and LDLR mRNA levels in Huh7.5-FGR
cells transfected with control (Con miR) or miR-130b mimics in the presence or absence of a
lipid mixture (LM) (n=3). (c) Relative IFNB1 mRNA levels in JFH1T infected Huh7.5 cells
transfected with 100 nM control or miR-130b mimics (n=3). Unpaired two-tailed t-test was
used to evaluate statistical significance. Data represents mean values s.e. (*P ≤ 0.05)

187
Figure S3.15. miR-185 inhibits DENV and VSV infectivity. (a)–(b) Effect of miR-185
overexpression on (a) VSV and (b) DENV virion production assessed by plaque assays
(n≥3). DENV infections were performed in Huh7.5 cells, while VSV infections were
performed in HepG2 cells. Cells were transfected with 100 nM of control or miR-185
mimic. Data represents mean values s.e. Unpaired two-tailed t-test was used to evaluate
statistical significance. (*P ≤ 0.05)

188
Figure S3.16. 25-HC induced miR-185 expression regulates immunometabolic response. Model illustrating 25-HC’s regulation of cellular lipid metabolism. IFN stimulated
cholesterol 25-hydroxylase (CH25H) expression results in the conversion of cholesterol to
25-HC, which is secreted and can exert autocrine or paracrine effects on gene expression.
25-HC–stimulated miR-185 expression in the liver results in broad effects on hepatic
metabolism. Direct targets of miR-185 are highlighted in red.

189
Figure S3.17. miR-185 regulates macrophage lipid metabolism. (a) Relative mRNA
expression level of miR-185 targets in 100 nM control and miR-185 mimic transfected THP-
1 monocyte-derived macrophages (n>3). Data represents mean values s.e. Unpaired two-
tailed t-test was used to evaluate statistical significance. (*P ≤ 0.05) (b) Relative cellular
triglyceride levels in THP-1 macrophages transfected with 100 nM control or miR-185
mimics (n=2). Data represents mean values.

190
Table S3.1. Summary of HCV modulated miRNAs.
microRNA Fold Change
microRNA Fold Change
microRNA Fold Change
microRNA Fold Change
hsa-let-7b 3.22 hsa-miR-149* 0.41 hsa-miR-423-5p 0.39 hsa-miR-586 2.54 hsa-let-7c 2.40 hsa-miR-153 0.40 hsa-miR-425* 0.40 hsa-miR-589 0.32 hsa-let-7f 2.95 hsa-miR-154 3.98 hsa-miR-454* 0.05 hsa-miR-596 2.43 hsa-let-7f-1* 1.61 hsa-miR-15b 2.17 hsa-miR-455-5p 2.68 hsa-miR-601 0.24 hsa-miR-10a 2.27 hsa-miR-16 0.53 hsa-miR-483-5p 0.20 hsa-miR-606 0.32 hsa-miR-1178 4.42 hsa-miR-16-1* 0.45 hsa-miR-485-3p 0.19 hsa-miR-615-3p 0.31 hsa-miR-1181 5.62 hsa-miR-181b 0.61 hsa-miR-486-3p 1.91 hsa-miR-617 0.18 hsa-miR-1185 3.56 hsa-miR-1825 2.15 hsa-miR-487a 1.88 hsa-miR-621 3.30 hsa-miR-1204 2.76 hsa-miR-1826 2.93 hsa-miR-489 0.43 hsa-miR-625 0.18 hsa-miR-1207-3p 5.08 hsa-miR-183* 0.25 hsa-miR-490-3p 0.15 hsa-miR-629* 0.37 hsa-miR-1208 3.75 hsa-miR-183 0.06 hsa-miR-493 1.82 hsa-miR-630 0.22 hsa-miR-1225-3p 4.13 hsa-miR-184 0.23 hsa-miR-494 3.43 hsa-miR-636 0.28 hsa-miR-1225-5p 3.72 hsa-miR-185 0.06 hsa-miR-497 0.31 hsa-miR-638 0.63 hsa-miR-1228 3.13 hsa-miR-187 3.19 hsa-miR-498 0.17 hsa-miR-642 2.60 hsa-miR-1231 4.16 hsa-miR-190 2.08 hsa-miR-500* 3.77 hsa-miR-646 3.27 hsa-miR-1233 3.51 hsa-miR-1908 0.48 hsa-miR-502-3p 4.61 hsa-miR-659 0.47 hsa-miR-1237 2.02 hsa-miR-193a-3p 0.52 hsa-miR-505/ 2.66 hsa-miR-663b 6.34 hsa-miR-124 0.53 hsa-miR-195* 0.23 hsa-miR-512-5p 3.94 hsa-miR-665 0.13 hsa-miR-1246 3.48 hsa-miR-195 0.17 hsa-miR-513a-3p 0.39 hsa-miR-668 0.41 hsa-miR-1247 4.93 hsa-miR-198 0.36 hsa-miR-513a-5p 0.23 hsa-miR-675 0.60 hsa-miR-1250 2.05 hsa-miR-200a 2.40 hsa-miR-513c 3.95 hsa-miR-7-1* 0.65
hsa-miR-1251 2.81 hsa-miR-200b* 0.27 hsa-miR-516a-3p/ hsa-miR-516b*
0.42 hsa-miR-720 4.79
hsa-miR-1254 3.50 hsa-miR-205 2.88 hsa-miR-518a-3p 3.90 hsa-miR-873 3.27
hsa-miR-1269 3.89 hsa-miR-212 0.33 hsa-miR-518a-5p/ hsa-miR-527
0.29 hsa-miR-875-3p 0.34
hsa-miR-1270 0.59 hsa-miR-214 0.16 hsa-miR-518c 2.10 hsa-miR-877 0.39 hsa-miR-1274a 3.22 hsa-miR-222 0.43 hsa-miR-518c* 4.26 hsa-miR-885-3p 0.59 hsa-miR-1277 3.78 hsa-miR-23a 2.13 hsa-miR-518f 2.62 hsa-miR-885-5p 2.71 hsa-miR-1278 4.58 hsa-miR-23b 2.07 hsa-miR-520c-3p 0.39 hsa-miR-890 0.22 hsa-miR-128 6.25 hsa-miR-26b 2.03 hsa-miR-520d-3p 0.50 hsa-miR-891a 0.20 hsa-miR-1282 5.31 hsa-miR-27b 2.72 hsa-miR-520f 1.88 hsa-miR-922 0.31 hsa-miR-1283 2.79 hsa-miR-29a 0.65 hsa-miR-524-3p 3.01 hsa-miR-92a-1* 1.92 hsa-miR-1285 0.51 hsa-miR-29b-1* 0.34 hsa-miR-524-5p 1.92 hsa-miR-934 0.26 hsa-miR-1287 6.27 hsa-miR-29b-2* 0.53 hsa-miR-525-5p 0.30 hsa-miR-936 0.53 hsa-miR-1288 4.84 hsa-miR-302d* 3.91 hsa-miR-542-3p 0.40 hsa-miR-938 0.31 hsa-miR-1292 4.91 hsa-miR-30c-2* 1.87 hsa-miR-545* 2.69 hsa-miR-944 0.33 hsa-miR-1295 4.05 hsa-miR-320c 5.26 hsa-miR-548b-3p 3.99 hsa-miR-1298 2.19 hsa-miR-328 3.11 hsa-miR-548b-5p 0.15 hsa-miR-1302 1.67 hsa-miR-330-3p 0.42 hsa-miR-548e 0.21 hsa-miR-1303 2.62 hsa-miR-335 0.52 hsa-miR-548h 1.74 hsa-miR-1305 2.22 hsa-miR-33b* 4.66 hsa-miR-548j 2.74 hsa-miR-130b* 0.16 hsa-miR-340* 0.33 hsa-miR-548l 2.90 hsa-miR-130b 0.34 hsa-miR-342-5p 0.21 hsa-miR-548o 4.49 hsa-miR-1323 1.68 hsa-miR-34a 0.26 hsa-miR-548p 3.05 hsa-miR-133b 1.67 hsa-miR-34b 0.61 hsa-miR-549 0.52 hsa-miR-138 0.41 hsa-miR-34c-3p 0.18 hsa-miR-550 0.13 hsa-miR-139-5p 2.20 hsa-miR-363 0.65 hsa-miR-562 0.65 hsa-miR-143* 3.41 hsa-miR-374b* 0.13 hsa-miR-572 5.06 hsa-miR-145* 3.40 hsa-miR-376a 3.05 hsa-miR-574-5p 0.26 hsa-miR-1468 3.44 hsa-miR-381 0.30 hsa-miR-576-3p 0.54 hsa-miR-146b-3p 0.32 hsa-miR-411* 0.37 hsa-miR-576-5p 1.88
Table includes miRNAs which were modulated by at least 1.5 fold during 72 hour JFH-1T
HCV infection of Huh7.5 cells (MOI = 0.1; P<0.05).

191
Table S3.2. Summary of 25-HC modulated human miRNAs.
microRNA Fold Change
microRNA Fold Change
hsa-let-7c* 0.23 hsa-miR-296-3p 2.98 hsa-let-7f 0.36 hsa-miR-297 2.84 hsa-miR-1183 0.39 hsa-miR-338-3p 4.11 hsa-miR-122* 0.21 hsa-miR-367 1.89 hsa-miR-122 2.68 hsa-miR-425* 2.50 hsa-miR-124 2.07 hsa-miR-507 2.66 hsa-miR-1244 0.28 hsa-miR-509-3p 3.10 hsa-miR-1246 2.21 hsa-miR-509-5p 0.11 hsa-miR-125a-3p 3.15 hsa-miR-575 0.64 hsa-miR-130a 3.57 hsa-miR-578 2.31 hsa-miR-130b 3.73 hsa-miR-618 3.72 hsa-miR-139-3p 0.22 hsa-miR-647 0.63 hsa-miR-147 2.29 hsa-miR-657 0.15 hsa-miR-1826 2.73 hsa-miR-7 0.20 hsa-miR-185 2.97 hsa-miR-934 0.14 hsa-miR-200c* 0.43
Table includes miRNAs which were modulated by at least 1.5 fold during 5 µM 25-HC
treatment of JFH-1T infected Huh7.5 cells (P<0.05).

192
Table S3.3. Gene ontology analysis of 25-HC modulated miRNAs’ experimentally
validated targets.
KEGG pathway P-value
Glycosaminoglycan biosynthesis – chondroitin sulfate 4.00E-22
Prion diseases 5.33E-19
Fatty acid elongation in mitochondria 9.05E-13
Fatty acid metabolism 5.64E-09
Glioma 1.63E-06
Non-small cell lung cancer 9.31E-06
ECM-receptor interaction 2.34E-05
ErbB signaling pathway 0.00039
Bladder cancer 0.00061
Chronic myeloid leukemia 0.0022
Pathways in cancer 0.0022
Melanoma 0.0023
Small cell lung cancer 0.0047
Pancreatic cancer 0.0053
Cell cycle 0.0097
Endometrial cancer 0.0100
Prostate cancer 0.0106
Progesterone-mediated oocyte maturation 0.0123
Colorectal cancer 0.0129
Steroid biosynthesis 0.0146
Biosynthesis of unsaturated fatty acids 0.0163
Pathway enrichment analysis, using DIANA miRPath21, revealed an enrichment of 25-HC
regulated miRNAs’ targets with functional roles in metabolic pathways (highlighted in bold).
P values were adjusted with Benjamini and Hochberg correction.

193
Table S3.4. Gene ontology analysis classifying genes repressed by >1.5 fold in miR-185
mimic transfected Huh7.5 cells by biological process.
ID Name* P-value†
GO:0006695 cholesterol biosynthetic process 6.17E-06
GO:0016126 sterol biosynthetic process 1.22E-05
GO:0008203 cholesterol metabolic process 3.92E-05
GO:0016125 sterol metabolic process 1.35E-04
GO:0006639 acylglycerol metabolic process 7.07E-04
GO:0006694 steroid biosynthetic process 7.07E-04
GO:0006638 neutral lipid metabolic process 7.07E-04
GO:0008202 steroid metabolic process 7.93E-03
GO:0006641 triglyceride metabolic process 8.33E-03
GO:0048864 stem cell development 8.40E-03
*Only top 10 overrepresented processes are listed.
†Adjusted with Bonferroni correction.

194
Table S3.5. Gene ontology analysis classifying genes repressed by >1.5 fold in miR-185
mimic transfected Huh7.5 cells by molecular function.
ID Name P value†
GO:0008374 O-acyltransferase activity 1.20E-02
GO:0016747 transferase activity, transferring acyl groups
other than amino-acyl groups 2.22E-02
GO:0016746 transferase activity, transferring acyl groups 4.61E-02
GO:0000983
RNA polymerase II core promoter
sequence-specific DNA binding
transcription factor activity
5.31E-02
GO:0016411 acylglycerol O-acyltransferase activity 5.73E-02
GO:0016420 malonyltransferase activity 7.65E-02
GO:0016419 S-malonyltransferase activity 7.65E-02
GO:0016418 S-acetyltransferase activity 7.65E-02
GO:0016416 O-palmitoyltransferase activity 1.09E-01
GO:0016406 carnitine O-acyltransferase activity 1.52E-01
*Only top 10 overrepresented molecular functions are listed.
†Adjusted with Bonferroni correction.
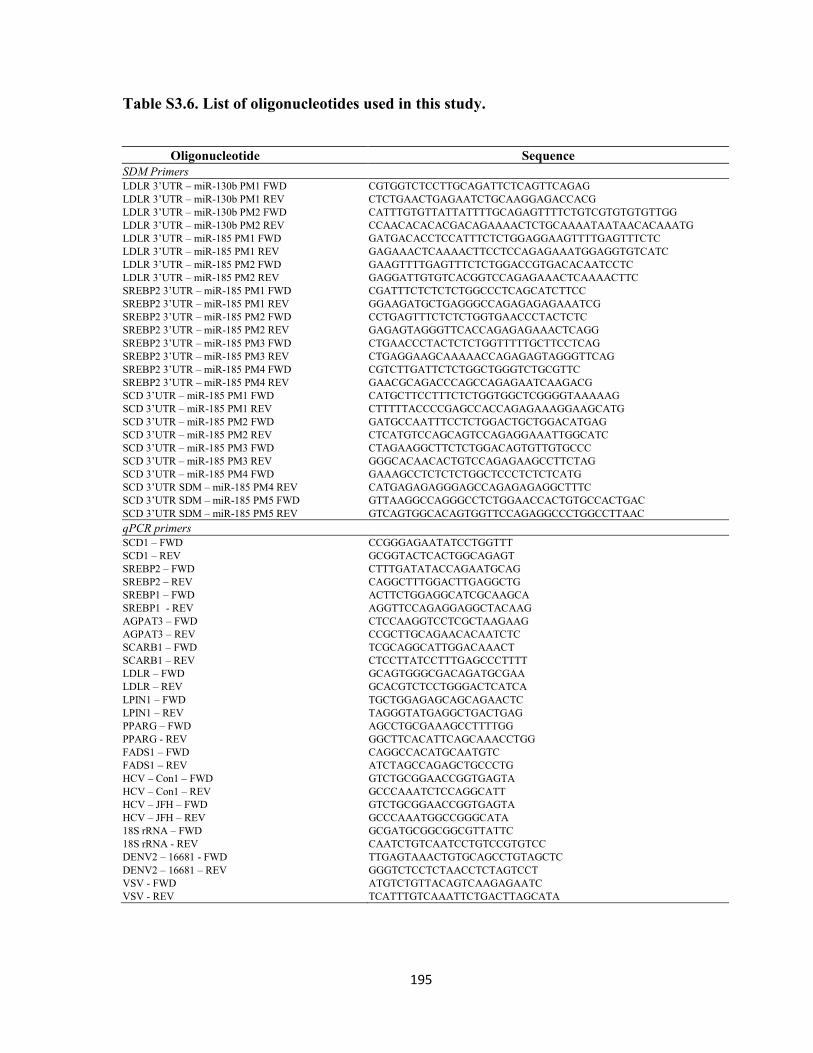
195
Table S3.6. List of oligonucleotides used in this study.
Oligonucleotide Sequence
SDM Primers LDLR 3’UTR – miR-130b PM1 FWD CGTGGTCTCCTTGCAGATTCTCAGTTCAGAG
LDLR 3’UTR – miR-130b PM1 REV CTCTGAACTGAGAATCTGCAAGGAGACCACG
LDLR 3’UTR – miR-130b PM2 FWD CATTTGTGTTATTATTTTGCAGAGTTTTCTGTCGTGTGTGTTGG
LDLR 3’UTR – miR-130b PM2 REV CCAACACACACGACAGAAAACTCTGCAAAATAATAACACAAATG
LDLR 3’UTR – miR-185 PM1 FWD GATGACACCTCCATTTCTCTGGAGGAAGTTTTGAGTTTCTC
LDLR 3’UTR – miR-185 PM1 REV GAGAAACTCAAAACTTCCTCCAGAGAAATGGAGGTGTCATC
LDLR 3’UTR – miR-185 PM2 FWD GAAGTTTTGAGTTTCTCTGGACCGTGACACAATCCTC
LDLR 3’UTR – miR-185 PM2 REV GAGGATTGTGTCACGGTCCAGAGAAACTCAAAACTTC
SREBP2 3’UTR – miR-185 PM1 FWD CGATTTCTCTCTCTGGCCCTCAGCATCTTCC
SREBP2 3’UTR – miR-185 PM1 REV GGAAGATGCTGAGGGCCAGAGAGAGAAATCG
SREBP2 3’UTR – miR-185 PM2 FWD CCTGAGTTTCTCTCTGGTGAACCCTACTCTC
SREBP2 3’UTR – miR-185 PM2 REV GAGAGTAGGGTTCACCAGAGAGAAACTCAGG
SREBP2 3’UTR – miR-185 PM3 FWD CTGAACCCTACTCTCTGGTTTTTGCTTCCTCAG
SREBP2 3’UTR – miR-185 PM3 REV CTGAGGAAGCAAAAACCAGAGAGTAGGGTTCAG
SREBP2 3’UTR – miR-185 PM4 FWD CGTCTTGATTCTCTGGCTGGGTCTGCGTTC
SREBP2 3’UTR – miR-185 PM4 REV GAACGCAGACCCAGCCAGAGAATCAAGACG
SCD 3’UTR – miR-185 PM1 FWD CATGCTTCCTTTCTCTGGTGGCTCGGGGTAAAAAG
SCD 3’UTR – miR-185 PM1 REV CTTTTTACCCCGAGCCACCAGAGAAAGGAAGCATG
SCD 3’UTR – miR-185 PM2 FWD GATGCCAATTTCCTCTGGACTGCTGGACATGAG
SCD 3’UTR – miR-185 PM2 REV CTCATGTCCAGCAGTCCAGAGGAAATTGGCATC
SCD 3’UTR – miR-185 PM3 FWD CTAGAAGGCTTCTCTGGACAGTGTTGTGCCC
SCD 3’UTR – miR-185 PM3 REV GGGCACAACACTGTCCAGAGAAGCCTTCTAG
SCD 3’UTR – miR-185 PM4 FWD GAAAGCCTCTCTCTGGCTCCCTCTCTCATG
SCD 3’UTR SDM – miR-185 PM4 REV CATGAGAGAGGGAGCCAGAGAGAGGCTTTC
SCD 3’UTR SDM – miR-185 PM5 FWD GTTAAGGCCAGGGCCTCTGGAACCACTGTGCCACTGAC
SCD 3’UTR SDM – miR-185 PM5 REV GTCAGTGGCACAGTGGTTCCAGAGGCCCTGGCCTTAAC
qPCR primers SCD1 – FWD CCGGGAGAATATCCTGGTTT
SCD1 – REV GCGGTACTCACTGGCAGAGT
SREBP2 – FWD CTTTGATATACCAGAATGCAG
SREBP2 – REV CAGGCTTTGGACTTGAGGCTG
SREBP1 – FWD ACTTCTGGAGGCATCGCAAGCA
SREBP1 - REV AGGTTCCAGAGGAGGCTACAAG
AGPAT3 – FWD CTCCAAGGTCCTCGCTAAGAAG
AGPAT3 – REV CCGCTTGCAGAACACAATCTC
SCARB1 – FWD TCGCAGGCATTGGACAAACT
SCARB1 – REV CTCCTTATCCTTTGAGCCCTTTT
LDLR – FWD GCAGTGGGCGACAGATGCGAA
LDLR – REV GCACGTCTCCTGGGACTCATCA
LPIN1 – FWD TGCTGGAGAGCAGCAGAACTC
LPIN1 – REV TAGGGTATGAGGCTGACTGAG
PPARG – FWD AGCCTGCGAAAGCCTTTTGG
PPARG - REV GGCTTCACATTCAGCAAACCTGG
FADS1 – FWD CAGGCCACATGCAATGTC
FADS1 – REV ATCTAGCCAGAGCTGCCCTG
HCV – Con1 – FWD GTCTGCGGAACCGGTGAGTA
HCV – Con1 – REV GCCCAAATCTCCAGGCATT
HCV – JFH – FWD GTCTGCGGAACCGGTGAGTA
HCV – JFH – REV GCCCAAATGGCCGGGCATA
18S rRNA – FWD GCGATGCGGCGGCGTTATTC
18S rRNA - REV CAATCTGTCAATCCTGTCCGTGTCC
DENV2 – 16681 - FWD TTGAGTAAACTGTGCAGCCTGTAGCTC
DENV2 – 16681 – REV GGGTCTCCTCTAACCTCTAGTCCT
VSV - FWD ATGTCTGTTACAGTCAAGAGAATC
VSV - REV TCATTTGTCAAATTCTGACTTAGCATA
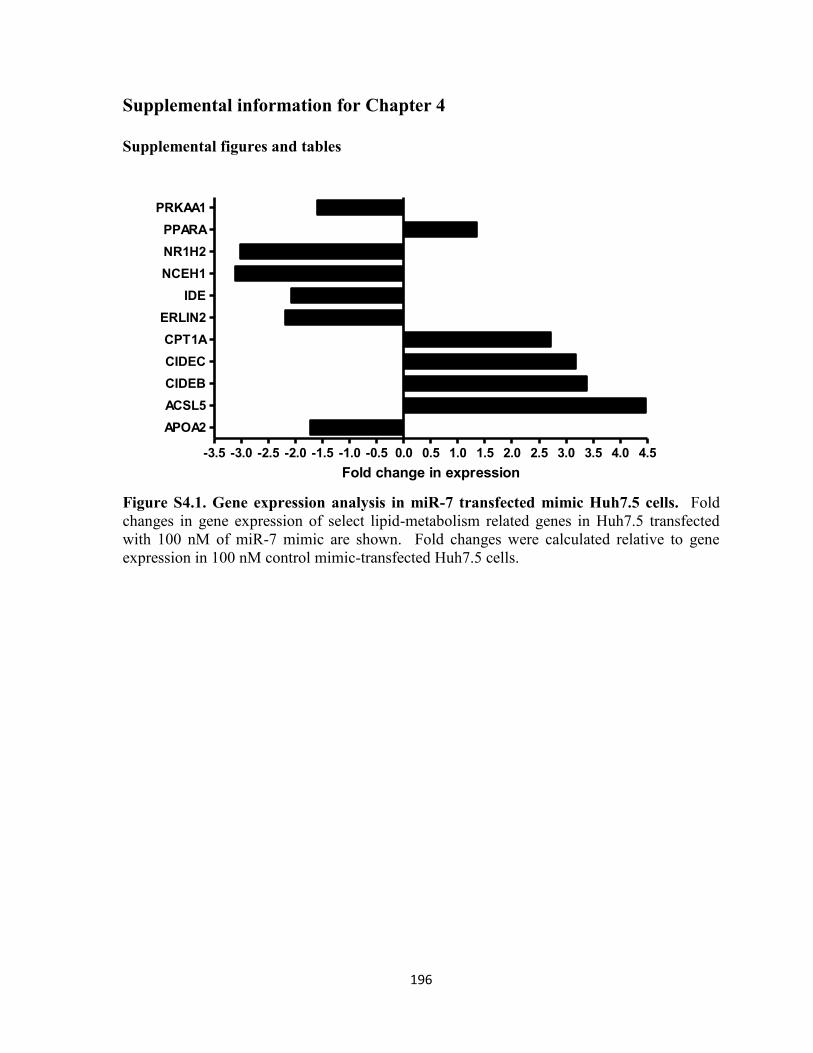
196
Supplemental information for Chapter 4
Supplemental figures and tables
Figure S4.1. Gene expression analysis in miR-7 transfected mimic Huh7.5 cells. Fold
changes in gene expression of select lipid-metabolism related genes in Huh7.5 transfected
with 100 nM of miR-7 mimic are shown. Fold changes were calculated relative to gene
expression in 100 nM control mimic-transfected Huh7.5 cells.
-3.5 -3.0 -2.5 -2.0 -1.5 -1.0 -0.5 0.0 0.5 1.0 1.5 2.0 2.5 3.0 3.5 4.0 4.5
APOA2
ACSL5
CIDEB
CIDEC
CPT1A
ERLIN2
IDE
NCEH1
NR1H2
PPARA
PRKAA1
Fold change in expression
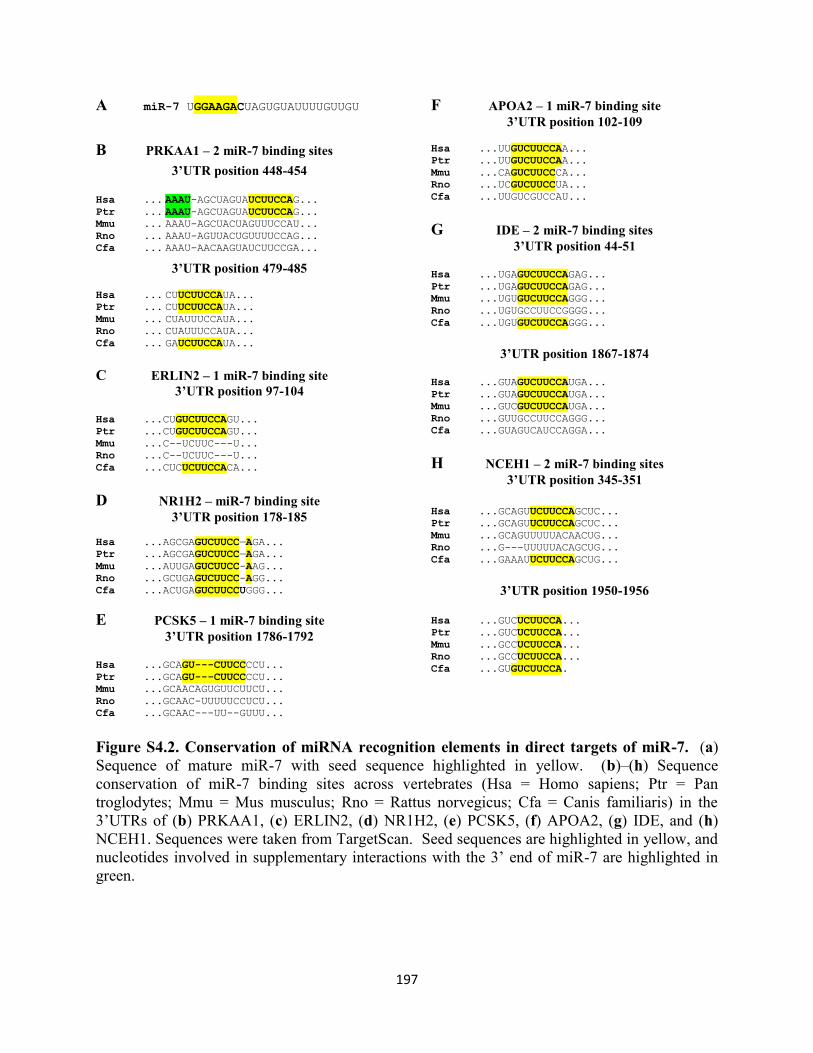
197
A miR-7 UGGAAGACUAGUGUAUUUUGUUGU
B PRKAA1 – 2 miR-7 binding sites
3’UTR position 448-454
Hsa ... AAAU-AGCUAGUAUCUUCCAG... Ptr ... AAAU-AGCUAGUAUCUUCCAG... Mmu ... AAAU-AGCUACUAGUUUCCAU... Rno ... AAAU-AGUUACUGUUUUCCAG... Cfa ... AAAU-AACAAGUAUCUUCCGA...
3’UTR position 479-485
Hsa ... CUUCUUCCAUA... Ptr ... CUUCUUCCAUA... Mmu ... CUAUUUCCAUA... Rno ... CUAUUUCCAUA... Cfa ... GAUCUUCCAUA...
C ERLIN2 – 1 miR-7 binding site
3’UTR position 97-104
Hsa ...CUGUCUUCCAGU...
Ptr ...CUGUCUUCCAGU...
Mmu ...C--UCUUC---U...
Rno ...C--UCUUC---U...
Cfa ...CUCUCUUCCACA...
D NR1H2 – miR-7 binding site
3’UTR position 178-185
Hsa ...AGCGAGUCUUCC—AGA...
Ptr ...AGCGAGUCUUCC—AGA...
Mmu ...AUUGAGUCUUCC-AAG...
Rno ...GCUGAGUCUUCC-AGG...
Cfa ...ACUGAGUCUUCCUGGG...
E PCSK5 – 1 miR-7 binding site
3’UTR position 1786-1792
Hsa ...GCAGU---CUUCCCCU...
Ptr ...GCAGU---CUUCCCCU...
Mmu ...GCAACAGUGUUCUUCU...
Rno ...GCAAC-UUUUUCCUCU...
Cfa ...GCAAC---UU--GUUU...
F APOA2 – 1 miR-7 binding site
3’UTR position 102-109
Hsa ...UUGUCUUCCAA...
Ptr ...UUGUCUUCCAA...
Mmu ...CAGUCUUCCCA...
Rno ...UCGUCUUCCUA...
Cfa ...UUGUCGUCCAU...
G IDE – 2 miR-7 binding sites
3’UTR position 44-51
Hsa ...UGAGUCUUCCAGAG...
Ptr ...UGAGUCUUCCAGAG...
Mmu ...UGUGUCUUCCAGGG...
Rno ...UGUGCCUUCCGGGG...
Cfa ...UGUGUCUUCCAGGG...
3’UTR position 1867-1874
Hsa ...GUAGUCUUCCAUGA...
Ptr ...GUAGUCUUCCAUGA...
Mmu ...GUCGUCUUCCAUGA...
Rno ...GUUGCCUUCCAGGG...
Cfa ...GUAGUCAUCCAGGA...
H NCEH1 – 2 miR-7 binding sites
3’UTR position 345-351
Hsa ...GCAGUUCUUCCAGCUC...
Ptr ...GCAGUUCUUCCAGCUC...
Mmu ...GCAGUUUUUACAACUG...
Rno ...G---UUUUUACAGCUG...
Cfa ...GAAAUUCUUCCAGCUG...
3’UTR position 1950-1956
Hsa ...GUCUCUUCCA...
Ptr ...GUCUCUUCCA...
Mmu ...GCCUCUUCCA...
Rno ...GCCUCUUCCA...
Cfa ...GUGUCUUCCA.
Figure S4.2. Conservation of miRNA recognition elements in direct targets of miR-7. (a)
Sequence of mature miR-7 with seed sequence highlighted in yellow. (b)–(h) Sequence
conservation of miR-7 binding sites across vertebrates (Hsa = Homo sapiens; Ptr = Pan
troglodytes; Mmu = Mus musculus; Rno = Rattus norvegicus; Cfa = Canis familiaris) in the
3’UTRs of (b) PRKAA1, (c) ERLIN2, (d) NR1H2, (e) PCSK5, (f) APOA2, (g) IDE, and (h)
NCEH1. Sequences were taken from TargetScan. Seed sequences are highlighted in yellow, and
nucleotides involved in supplementary interactions with the 3’ end of miR-7 are highlighted in
green.

198
Table S4.1. Gene ontology analysis classifying genes activated by >1.5 fold in miR-7 mimic
transfected Huh7.5 cells by biological process.
ID Name* P-value†
GO:0044282 small molecule catabolic process 3.17E-7
GO:0016054 organic acid catabolic process 3.26E-6
GO:0046395 carboxylic acid catabolic process 3.26E-6
GO:0072329 monocarboxylic acid catabolic process 4.40E-4
GO:0015711 organic anion transport 5.50E-4
GO:0043436 oxoacid metabolic process 6.62E-4
GO:0019752 carboxylic acid metabolic process 7.55E-4
GO:0006082 organic acid metabolic process 9.52E-4
GO:0044242 cellular lipid catabolic process 2.71E-3
GO:0032787 monocarboxylic acid metabolic process 3.03E-3
GO:0042073 intraciliary transport 4.32E-3
GO:0046942 carboxylic acid transport 5.12E-3
GO:0015849 organic acid transport 6.30E-3
GO:0006820 anion transport 8.03E-3
GO:0008203 cholesterol metabolic process 1.10E-2
GO:0008202 steroid metabolic process 1.32E-2
GO:0030705 cytoskeleton-dependent intracellular
transport
1.41E-2
GO:0016125 sterol metabolic process 2.62E-2
GO:0060271 cilium morphogenesis 2.96E-2
GO:0010970 microtubule-based transport 3.50E-2
GO:0010927 cellular component assembly involved in
morphogenesis
4.04E-2
GO:0016042 lipid catabolic process 4.30E-2
GO:0044282 small molecule catabolic process 3.17E-7
GO:0016054 organic acid catabolic process 3.26E-6
GO:0046395 carboxylic acid catabolic process 3.26E-6
*Only biological processes with P < 0.05 are listed. Pathways related to lipid metabolism are
highlighted in bold
†Adjusted with Bonferroni correction.

199
Table S4.2. Summary of GSEA results with FDR < 0.05 – KEGG pathways enriched in
miR-7 transfected cells.
*KEGG pathways related to lipid metabolism are highlighted in bold
ID Name* FDR q value
1 KEGG_COMPLEMENT_AND_COAGULATION_CASCADES <0.001
2 KEGG_PPAR_SIGNALING_PATHWAY <0.001
3 KEGG_DRUG_METABOLISM_CYTOCHROME_P450 0.002
4 KEGG_LYSOSOME 0.006
5 KEGG_OTHER_GLYCAN_DEGRADATION 0.009
6 KEGG_ABC_TRANSPORTERS 0.017
7 KEGG_PRIMARY_BILE_ACID_BIOSYNTHESIS 0.018
8 KEGG_PEROXISOME 0.034
9 KEGG_GLYCINE_SERINE_AND_THREONINE_METABOLISM 0.037
10 KEGG_RETINOL_METABOLISM 0.040
11 KEGG_FATTY_ACID_METABOLISM 0.040
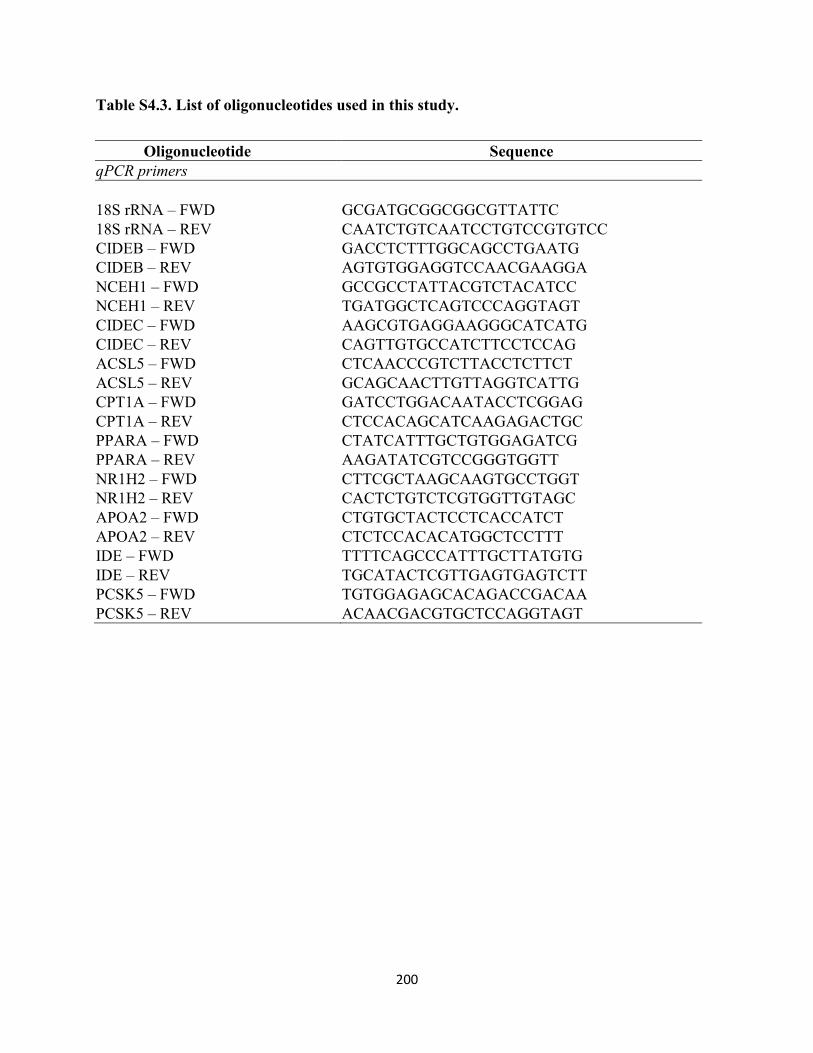
200
Table S4.3. List of oligonucleotides used in this study.
Oligonucleotide Sequence
qPCR primers
18S rRNA – FWD GCGATGCGGCGGCGTTATTC
18S rRNA – REV CAATCTGTCAATCCTGTCCGTGTCC
CIDEB – FWD GACCTCTTTGGCAGCCTGAATG
CIDEB – REV AGTGTGGAGGTCCAACGAAGGA
NCEH1 – FWD GCCGCCTATTACGTCTACATCC
NCEH1 – REV TGATGGCTCAGTCCCAGGTAGT
CIDEC – FWD AAGCGTGAGGAAGGGCATCATG
CIDEC – REV CAGTTGTGCCATCTTCCTCCAG
ACSL5 – FWD CTCAACCCGTCTTACCTCTTCT
ACSL5 – REV GCAGCAACTTGTTAGGTCATTG
CPT1A – FWD GATCCTGGACAATACCTCGGAG
CPT1A – REV CTCCACAGCATCAAGAGACTGC
PPARA – FWD CTATCATTTGCTGTGGAGATCG
PPARA – REV AAGATATCGTCCGGGTGGTT
NR1H2 – FWD CTTCGCTAAGCAAGTGCCTGGT
NR1H2 – REV CACTCTGTCTCGTGGTTGTAGC
APOA2 – FWD CTGTGCTACTCCTCACCATCT
APOA2 – REV CTCTCCACACATGGCTCCTTT
IDE – FWD TTTTCAGCCCATTTGCTTATGTG
IDE – REV TGCATACTCGTTGAGTGAGTCTT
PCSK5 – FWD TGTGGAGAGCACAGACCGACAA
PCSK5 – REV ACAACGACGTGCTCCAGGTAGT

201
Rights and Permissions
Chapters 1 and 5
R. Singaravelu, R.S. Russell, D.L. Tyrrell & J.P. Pezacki, Hepatitis C virus and microRNAs:
miRed in a host of possibilities (2014), Curr. Opin. Virol. 7: 1-10.
License for re-use of full text in this thesis was procured from Elsevier.
R. Singaravelu, P. Srinivasan & J.P. Pezacki, Armand-Frappier Outstanding Student Award —
The emerging role of 25-hydroxycholesterol in innate immunity (2015), Can. J. Microbiol. 61(8):
521-530.
License for re-use of full text in this thesis was procured from Canadian Science Publishing.
Chapter 2
R. Singaravelu, R. Chen, R.K. Lyn, D.M. Jones, S. O’Hara, Y. Rouleau, J. Cheng, P. Srinivasan,
N. Nasheri, R.S. Russell, D.L. Tyrrell & J.P. Pezacki, Hepatitis C virus induced up-regulation of
microRNA-27: a novel mechanism for hepatic steatosis (2014), Hepatology 59 (1): 98-109.
License for re-use of full text in this thesis was procured from John Wiley and Sons Inc.
Chapter 3
R. Singaravelu, S. O’Hara, D.M. Jones, R. Chen, N.G. Taylor, P. Srinivasan, C. Quan, D.G. Roy,
R.H. Steenbergen, A. Kumar, R.K. Lyn, D. Özcelik, Y. Rouleau, M.A. Nguyen, K.J. Rayner,
T.C. Hobman, D.L. Tyrrell, R.S. Russell, & J.P. Pezacki, MicroRNAs regulate the
immunometabolic response in the liver (2015), Nat. Chem. Biol. 11, 988–993
It is reproduced in this thesis with permission from the publisher – refer to Rights and
Permissions. For articles published in Nature Chemical Biology, ownership of copyright in the
article remains with the Authors, and provided that, when reproducing the Contribution or
extracts from it, the Authors acknowledge first and reference publication in the Journal, the
Authors retain the non-exclusive right to reproduce the Contribution in whole or in part in any
printed volume (book or thesis) of which they are the author(s). In addition, license for re-use of
full text in this thesis was procured from Nature Publishing Group.
Chapter 4
R. Singaravelu, C. Quan, M.H. Powdrill, P. Srinivasan, R.K. Lyn, D.M. Jones, R.S. Russell &
J.P. Pezacki, miR-7 mediates cross-talk between metabolic signaling pathways in the liver.
Chemistry & Biology – submitted. Ref No. CELL-CHEMICAL-BIOLOGY-D-16-00020.
License to be obtained from Cell Press pending publication.

202
Curriculum Vitae
Ragunath Singaravelu
EDUCATION
Degree (U of Ottawa) Discipline GPA (out of 10)
B.Sc. Biochemistry 9.7 B.A.Sc. Chemical Engineering 9.7 Ph.D. Microbiology & Immunology 10.0
TRAINING
Supervisor Research Field Duration
Dr. John P. Pezacki (NRC/University of Ottawa)
Chemical Biology/Virology 2009-2016
Dr. D. Lorne Tyrrell (University of Alberta)
Virology June 2014
Dr. Daniel Figeys (University of Ottawa)
Proteomics Summer 2006
Dr. Tony Durst (University of Ottawa)
Organic/Medicinal Chemistry Summer 2004-05
RESEARCH CONTRIBUTIONS
Contribution Number/Description Co-authored publications 17 (published, 8 – first author, 2 – corresponding author;
publications in Nat. Chem. Biol., Hepatology, and other specialized journals)
2 (under revision, 1 – first author, 1 – corresponding author) Oral Presentations Poster Presentations
7 (2 International, 5 National)
10 (5 International, 5 National) Class Lectures 9 (2 Graduate level, 7 Undergraduate level) Grant Writing Made major contributions to a Canadian Institutes of
Health Research grant that was ranked 1st iby the Virology and Viral Pathogenesis Committee nationwide
MAJOR SCHOLARSHIPS AND AWARDS (Total awards: 31; Total value in excess of $200K)
Award Year
Vanier Canadian Graduate Scholarship (top graduate scholarship in Canada) 2010-13 National Canadian Research Training Program - Hepatitis C Fellowship 2010-15 Ontario Graduate Scholarship 2014-15 University of Ottawa Syed Sattar Student Award – top Ph.D. student in department 2015 Canadian Society for Microbiology - Armand Frappier Gold Medal (1 awarded annually, nationwide to an outstanding Canadian graduate student microbiologist)
2014
University of Ottawa Award of Excellence in Graduate Studies – Ph.D. Microbiology 2014 University of Ottawa Dean’s Scholarship 2010-14 Canadian Association for the Study of the Liver - Student Prize Awarded for best student oral presentation abstract at national conference
2013, 2015
Fisher Scientific Award of Excellence – M.Sc. Microbiology 2012 Natural Sciences and Engineering Research Council Alexander Graham Bell Canada Graduate Scholarship
2009-10
Golden Key Society - Inducted into society for having GPA in top 15% of faculty 2009

203
DETAILS OF ACCOMPLISHMENTS
EDUCATION
University of Ottawa
Completed Ph.D. in Microbiology and Immunology at University of Ottawa in Dr. Pezacki’s lab at National Research Council (NRC) investigating the influence of endogenous regulators of lipid metabolism on HCV pathogenesis with a major focus on miRNAS
Completed Honours B.Sc. in Biochemistry and B.A.Sc. Chemical Engineering degree (as part of biotechnology program) at University of Ottawa
Completed Honours thesis in Biochemistry with Dr. Pezacki at NRC Steacie Institute of Molecular Sciences (SIMS) - Activity-based protein profiling: Investigating Hepatitis C virus novel host-virus interactions using a non-directed probe
Completed Engineering Design project of hexamethylene diamine synthesis plant in consultation for Invista
9.7 (out of 10.0) CGPA and DGPA at end of five year undergraduate program
10.0 (out of 10.0) GPA for graduate program
TRAINING Trainee in National Canadian Research Training Program in Hepatitis C (NCRTP-HepC) 2010-15
As part of scholarship program, undergoing training in both clinical and basic science of hepatitis C. Responsibilities include knowledge translation with the community and liver clinic observations. Research elective with Dr. D. Lorne Tyrrell and Dr. Tom Hobman (University of Alberta) June 2014
As part of the NCRTP-HepC, I performed a one month research elective in Dr.D. Lorne Tyrrell’s lab to gain experience with infectious HCV models. Also started collaboration with Dr. Tom Hobman investigating anti-viral miRNAs in other flaviviral models (Dengue and West Nile) Research assistant with Dr. John Pezacki (NRC SIMS) Summer 2007/09 In conjunction with the NRC Summer Student Scholarship performed activity-based protein profiling to investigate novel biomarkers of Hepatitis C Virus (2007) and aided in the development of a novel assay to profile miRNA levels in biological samples using a size-selective, sequence independent small RNA binding protein, p19 (2009) Research assistant with Dr. Daniel Figeys (University of Ottawa) Summer 2006 In conjunction with NSERC Undergraduate Research Scholarship, worked on identification of novel interacting partners of β-Secretase, an enzyme implicated in Alzheimer’s disease Organic Chemistry, Engineering Economics, and Physics Tutoring 2006 Through the University of Ottawa Peer Helping Centre tutored various students Research assistant with Dr. Tony Durst (University of Ottawa) 2004-05 In conjunction with the University of Ottawa Undergraduate Research Scholarship, worked on synthesizing analogs of a natural anti-fungal agent, cinnamadiol

204
ACADEMIC ACHIEVEMENTS
University of Ottawa Faculty of Science Award ($125) 2015 Awarded for best oral presentation abstract at 98th Canadian Chemistry Conference and Exhibition in the biological and medicinal chemistry section
University of Ottawa Syed Sattar Student Award – Ph.D. ($500) 2015 Awarded to top graduate student in the departments of Biochemistry, Microbiology and Immunology for research success and contributions to supervisor`s overall research program Canadian Association for the Study of the Liver (CASL) Student Prize ($750) 2015 Awarded for oral presentation abstract at national conference in Banff, Canada Canadian Society of Microbiologists (CSM) Armand Frappier Gold Medal 2014 Awarded annually by the CSM to one outstanding Canadian graduate student microbiologist University of Ottawa – Poster Day Competition - 1st Place (Ph.D. students) 2014 Awarded first place in Department of Microbiology and Immunology poster presentation competition Canadian Association for the Study of the Liver (CASL) Student Prize ($750) 2014 Awarded for oral presentation abstract at national conference in Toronto, Canada University of Ottawa Award of Excellence in Graduate Studies – Ph.D. Microbiology ($500) 2013 Awarded for academic excellence and research capabilities as well as involvement in extracurricular activities related to Faculty of Medicine or in the community 18th Annual Meeting of RNA Society – Travel Scholarship ($650) 2013 Vanier Canada Graduate Scholarship ($50000/yr) 2010-2013 Most prestigious graduate scholarship awarded nationally in Canada University of Ottawa Admission Scholarship (valued at $3000/session) 2010-2013 University of Ottawa Excellence Scholarship (covers tuition) 2010-2013 National Canadian Research Training Program in Hepatitis C (valued at $23300) 2010-2014 NSERC Post Graduate Scholarship – Ph.D. – declined (valued at $21000) 2010-2013 CASL Annual Winter Meeting – Poster of Distinction 2011 Awarded for poster presentation at national conference in Vancouver, Canada Fisher Scientific Award of Excellence – M.Sc. Microbiology ($500) 2010 Awarded for academic excellence and research capabilities as well as involvement in extracurricular activities related to Faculty of Medicine or in the community University of Ottawa Dean’s Scholarship ($1500) 2010 Awarded for successfully transferring to Ph.D. program within 3 terms of M.Sc. NSERC Alexander Graham Bell Canada Graduate Scholarship (~$17500) 2009-2010 Ontario Graduate Scholarship ($15000) – declined 2009-2011 NCRTP in Hepatitis C - Summer Student Scholarship (~$3750) Summer 2009 Funding for summer research related to Hepatitis C Virus

205
National Research Council of Canada (NRC) Summer Student Scholarship (~$11000) Summer 2009 Plaque of Society of Chemical Industry and 2004-2009 Plaque of University of Ottawa Department of Biochemistry Awarded for highest standing in honours B.Sc. in Biochemistry graduating class (May 2009) at University of Ottawa Dean’s Honour List 2004-08 Ottawa Technology Venture Challenge Semifinalist 2008 Member of team who proposed a novel spray-on matrix for sealing wounds as part of competition for a new innovative business idea Barrick Unlock the Value Competition 2008 Co-author on patent submitted as part of competition to economically leach silver from gold ore - Method for induction of fractures in mining materials (Application #: 2,629,605) University of Ottawa Research Excellence Award (~$75) 2008 Best poster presentation in the Infection and Immunity Section among Biochemistry Honours students at University of Ottawa NRC Summer Student Scholarship (~$9000) Summer 2007 NSERC Undergraduate Student Research Award ($5625) Summer 2006 Golden Key Society 2005 Inducted into society for having GPA in top 15% of faculty University of Ottawa Chancellor Scholarship 2nd Runner Up (declined - $2500) 2004-05 Runner up for top entrance scholarship award at University of Ottawa Miller Thomson Scholarship ($1000) 2004-05 Awarded to students Canada-wide who show dedication to school/community and demonstrate potential for continued success in future endeavours Boehringer Ingelheim Scholarship ($5000) Summer 2005 Awarded to University of Ottawa Undergraduate Research Scholarship Winner with highest GPA after first term of the first semester
University of Ottawa Undergraduate Research Scholarship ($3000) Summer 2005
MENTORING During graduate studies, mentored several trainees – several of which have co-authored publications:
Curtis Quan Summer 2014-15 and Honours Project 2015-16
Prashanth Srinivasan Summers 2011-14 and Honours Project 2014-15
Matthew Lafrenière Masters 2012-14
Geneviève Desrochers Summers 2012 & 2013 and Honours Project 2012-13
Julie Delcorde Summers 2011 & 2012 and Honours Project 2011-12
Matthew Goodmurphy Summers 2009 & 2010 and Honours Project 2010-2011
Natalie Sachrajda Summer 2011

206
VOLUNTEER AND EXTRACURRICULAR ACTIVITIES Abstract Review – Canadian Symposium on Hepatitis C Virus (CSHCV) 2014/15 Reviewed abstract submissions for oral and poster presentations for national conference held in Banff (Feb 2015)
Guest Lecturer – Chemical Biology (University of Ottawa) Winter 2012/14 Each year, performed one lecture in graduate class (CHM8304) & two lectures in undergraduate class (CHM 4125) on applications of unnatural amino acids and photoswitches Ottawa Sports and Social Club – Floor hockey, futsal, and basketball 2011-15 Teaching assistant – Protein Structure and Function (University of Ottawa) Spring 2010-11 Led discussion sessions with third-year undergraduate students (BCH 3125) with focus on critiquing and analyzing scientific papers Let’s Talk Science 2010-12
As part of team, performed science experiments with children from Gr. 2-8 National Research Council of Canada (NRC) Partners in Education Program 2010-12 Helped run lab demos for Gr. 7-8 students to expose them to modern science and promote careers in research
PUBLICATIONS In preparation or under revision:
1. Singaravelu R.*, Quan, C., Powdrill, M.H., Srinivasan, P., Lyn, R.K., Jones, D.M., Russell, R.S. and
Pezacki, J.P. MicroRNA-7 mediates cross-talk between metabolic signaling pathways in the liver. Manuscript submitted to Chemistry & Biology. Ref #:CELL-CHEMICAL-BIOLOGY-D-16-00020.
2. Powdrill M.H.*, Desrochers G., Singaravelu R., and Pezacki, J.P. The role of microRNAs in metabolic interactions between viruses and their hosts. Manuscript submitted to Current Opinion in Virology. Ref #: COVIRO-D-15-00108. (Invited review; co-corresponding author)
Accepted: 1. Singaravelu, R.*, O’Hara, S., Jones, D.M., Chen, R., Steenbergen, R.H., Kumar, A., Taylor, N.G.,
Srinivasan, P., Lyn, R.K., Quan, C., Özcelik, D., Nguyen, M.A., Rayner, K.J., Hobman, T.C., Tyrrell, D.L., Russell, R.S., and Pezacki, J.P. MicroRNAs regulate the immunometabolic response to viral infection in the liver. Nature Chemical Biology, 11(12):988-993. (Highlighted in Nature News & Views & Nature Reviews Gastroenterology & Hepatology – HCV in 2015)
2. Singaravelu, R.*, Srinivasan, P., Pezacki, J.P., Evolving role of 25-hydroxycholesterol in immunity. Canadian Journal of Microbiology, 61(8):521-30. (Invited review, co-corresponding author)
3. Karunakaran, D., Thrush, A.B., Nguyen, M.A., Richards, L., Geoffrion, M., Singaravelu, R., Ramphos, E., Shangari, P., Ouimet, M., Pezacki, J.P., Moore, K.J., Perisic, L., Maegdefessel, L., Hedin, U., Harper, M.E., Rayner, K.J., Macrophage mitochondrial energy status regulates cholesterol efflux and is enhanced by anti-miR33 in atherosclerosis. Circulation Research, 117(3):266-278.
4. Singaravelu, R.*, Desrochers, G., O’Hara, S., Srinivasan, P., Jones, D.M.., Müller, R., Russell, R.S., and Pezacki, J.P. Soraphen A mediated inhibition of ACC polymerization disrupts HCV replication. ACS Infectious Diseases, 1(2):130-134. (Cover article)

207
5. Singaravelu, R.*, Delcorde, J.*, Lyn, R.K., Jones, D.M., Srinivasan, P., Russell, R.S., and Pezacki, J.P. Investigating the antiviral role of cell death-inducing DFF45-like effector B in HCV replication. FEBS Journal, 281(16):3751-65.
6. Singaravelu, R.*, Tyrrell, D.L., Russell, R.S., and Pezacki, J.P. Hepatitis C virus and human
miRNAs: miRed in a host of possibilities. Current Opinions in Virology, 7C:1-10 (2014). (Co-corresponding author)
7. Lyn, R.K.*, Singaravelu, R., Kargman, S., O’Hara, S., Chan, H., Oballa, R., Huang, Z., Jones, D.M., Ridsdale, A., Russell, R.S., Partridge, A., and Pezacki, J.P. Stearoyl-CoA desaturase inhibition blocks formation of hepatitis C virus-induced specialized membranes. Scientific Reports, 4:4549 (2014).
8. Singaravelu, R.*, Chen, R., Lyn, R.K., Jones, D.M., Rouleau, Y., O’Hara, S., Cheng, J., Srinivasan, P., Nasheri, N., Russell, R.S., Tyrrell, D.L., and Pezacki, J.P. Hepatitis C virus-induced up-regulation of miR-27: A novel mechanism for hepatic steatosis. Hepatology, 59:98-108. (Cover article highlighted by editor)
9. Singaravelu, R.*, Lyn, R.K., Srinivasan, P., Delcorde, J., Steenbergen, R.H., Tyrrell, D.L., and Pezacki, J.P. Human serum activates CIDEB-mediated lipid droplet enlargement in hepatoma cells. Biochemical and Biophysical Research Communications, 441(2):447-452.
10. Mazumder, N.*, Lyn, R.K.*, Singaravelu, R., Ridsdale, A., Moffatt, D.J., Hu, C., Tsai, H., McLauchlan, J., Stolow, A., Kao, F., Pezacki, J.P. Fluorescence lifetime imaging of alterations to cellular metabolism by domain 2 of the hepatitis C virus core protein. PLoS ONE, 8(6):e66738.
11. Singaravelu, R.*, Nasheri, N., Sherratt, A., and Pezacki, J.P. Systems biology methods help develop a better understanding of HCV-induced liver injury. Hepatology, 56(1):1-4.
12. Cheng, J.*, Danielson, D.C.*, Nasheri, N., Singaravelu, R., and Pezacki, J.P. Enhanced specificity of the viral suppressor of RNA silencing protein p19 towards sequestering of human microRNA-122. Biochemistry, 50(36):7745-7755.
13. Nasheri, N.*, Cheng, J., Singaravelu, R., Wu, P., McDermott, M.T., and Pezacki, J.P. An enzyme-linked assay for the rapid quantification of miRNAs based on the viral suppressor of RNA silencing protein p19. Analytical Biochemistry, 412(2):165-172.
14. Pezacki, J.P.*, Blake, J.A., Danielson, D.C., Kennedy, D.C., Lyn, R.K., and Singaravelu, R. Chemical contrast for imaging living systems: molecular vibrations drive CARS microscopy. Nature Chemical Biology, 7(3):137-145.
15. Nasheri, N.*, Singaravelu, R., Goodmurphy, M., Lyn, R.K, and Pezacki, J.P. MicroRNA-122 seed site accessibility in hepatitis C virus RNA. Virology, 2011, 410(2):336-344.
16. Pezacki, J.P.*, Singaravelu, R., Lyn, R.K.. Host-virus interactions during hepatitis C virus infection: A complex and dynamic molecular biosystem. Molecular Biosystems, 2010, 6(7):1131-1142.
17. Singaravelu, R.*, Blais, D.R.*, Mackay, C.S., and Pezacki, J.P. The evaluation of the active proteome in Huh-7.5 cells during hepatitis C virus replication using a non-directed activity-based proteome profiling probe. Proteome Science, 2010, 8:5.

208
POSTERS & PRESENTATIONS
Oral Presentations: 1. 98th Canadian Chemistry Conference and Exhibition 2015 Presented Doctoral research at national conference in Ottawa, Ontario Singaravelu, R.*, O’Hara, S., Chen, R., Jones, D.M., Rayner K.J., Russell, R.S., and Pezacki, J.P. 25-hydroxycholesterol stimulated antiviral microRNAs regulate hepatic lipid metabolism. (Oral)
2. Annual Canadian Association for the Study of the Liver (CASL) Winter Meeting 2015 Presented Doctoral research at national conference in Banff, Canada
Singaravelu, R.*, O’Hara, S., Lyn, R.K., Jones, D.M., Srinivasan, P., Hobman, T., Russell, R.S., and Pezacki, J.P.
25-hydroxycholesterol stimulated antiviral microRNAs regulate hepatic lipid metabolism. (Oral)
3. Canadian Society of Microbiology (CSM) Symposium 2014 Presented Doctoral research at international conference in Montreal, Canada Singaravelu, R.*, O’Hara, S., Jones, D.M., Srinivasan, P., Russell, D.R., and Pezacki, J.P. 25-hydroxycholesterol stimulated antiviral miRNAs regulate hepatic lipid metabolism (Award Lecture for Armand-Frappier Outstanding Student Award - Oral)
4. International Union of Microbiological Societies (IUMS) Congresses 2014 Presented Doctoral research at international conference in Montreal, Canada
Singaravelu, R.*, O’Hara, S., Jones, D.M., Srinivasan, P., Russell, D.R., and Pezacki, J.P. 25-hydroxycholesterol stimulated antiviral miRNAs regulate hepatic lipid metabolism (Oral)
5. Annual Canadian Association for the Study of the Liver (CASL) Winter Meeting 2014 Presented Doctoral research at national conference in Toronto, Canada Singaravelu, R.*, Lyn, R.K., Desrochers, G., Jones, D.M., Russell, D.R., and Pezacki, J.P. HCV replication complex formation is dependent on hepatic fatty acid synthesis pathway. (Oral) 6. 2nd Canadian Symposium on Hepatitis C Virus 2013 Presented Doctoral research at national conference in Victoria, Canada Singaravelu, R.*, Chen, R., Lyn, R.K., Jones, D.M., O’Hara, S., Rouleau, Y., Cheng, J., Srinivasan,
P., Russell, R.S., Tyrrell, D.L., and Pezacki J.P. Hepatitis C virus induced miR-27 expression promotes hepatic triglyceride accumulation (Oral) 7. 19th International Methods in Protein Structure Analysis (MPSA) Conference 2012 Presented Doctoral research at international conference in Ottawa, Canada Singaravelu, R.*, Jones, D.M., Lyn, R.K., Russell, R.S., and Pezacki, J.P. MicroRNA regulators of hepatic lipid homeostasis: Novel therapeutic targets for hepatitis C virus
(Oral)
Poster Presentations: 1. Keystone Symposium on Lipid Pathway in Biology and Disease 2014 Presented Doctoral research at international conference in Dublin, Ireland Singaravelu, R.*, Lyn, R.K., Desrochers, G., Jones, D.M., Russell, D.R., and Pezacki, J.P. 25-hydroxycholesterol stimulated antiviral miRNAs regulate lipid metabolism. (Poster)
2. 18th Annual Meeting of the RNA Society 2013
Presented Doctoral research at international conference in Davos, Switzerland Singaravelu, R.*, Chen, R., Lyn, R.K., Jones, D.M., O’Hara, S., Rouleau, Y., Cheng, J., Srinivasan,
P., Russell, R.S., Tyrrell, D.L., and Pezacki J.P. Hepatitis C virus induced miR-27 expression promotes hepatic triglyceride accumulation (Poster)
209
3. 2012 National CIHR Research Training Program in Hepatitis C (NCRTP-HepC) Meeting 2012 Presented Doctoral research at national graduate symposium in Montreal, Canada Singaravelu, R.*, Jones, D.,M., Russell, D.R., and Pezacki, J.P. Small molecule-mediation perturbation of HCV-associated host pathways reveal potential anti-viral
modulations in miRNA expression (Poster) 4. Annual Canadian Association for the Study of the Liver (CASL) Winter Meeting 2012 Presented Doctoral research at national conference in Montreal, Canada Singaravelu, R.*, Jones, D.M., Russell, D.R., and Pezacki, J.P. Small molecule-mediation perturbation of HCV-associated host pathways reveal potential anti-viral
modulations in miRNA expression (Poster) 5. 8th International Symposium on Hepatitis C virus and related viruses 2011 Presented Doctoral research at international conference in Seattle, U.S.A. Singaravelu, R.*, Jones, D.M., Russell, D.R., and Pezacki, J.P. Small molecule-mediation perturbation of HCV-associated host pathways reveal potential anti-viral
modulations in miRNA expression (Poster)
6. 2011 National CIHR Research Training Program in Hepatitis C (NCRTP-HepC) Meeting 2011 Presented Doctoral research at national graduate symposium in Vancouver, Canada Singaravelu, R.*, Jones, D.,M., Russell, D.R., and Pezacki, J.P. Characterizing microRNA profiles for HCV pathogenesis and antiviral mechanisms (Poster) 7. Annual Canadian Association for the Study of the Liver (CASL) Winter Meeting 2011 Presented Doctoral research at national conference in Vancouver, Canada Singaravelu, R.*, Jones, D.M., Russell, D.R., and Pezacki, J.P. Characterizing microRNA profiles for HCV pathogenesis and antiviral mechanisms (Poster) 8. NRC Steacie Institute for Molecular Sciences (SIMS) Annual Review 2010 Presented summary of Pezacki group’s work at NRC institutional presentation Singaravelu, R., Nasheri, N., Goodmurphy, M., Lyn, R.K, and Pezacki, J.P. Development and application of tools to probe small RNA interactions and profile miRNA levels (Poster)
9. 17th International Symposium on Hepatitis C virus and related viruses 2010 Presented two posters about Masters research at international conference in Yokohama, Japan Singaravelu, R.*, Kennedy, D.C., Lyn, R.K., and Pezacki, J.P. Characterizing microRNA profiles for HCV pathogenesis and antiviral mechanisms (Poster) Nasheri, N.*, Singaravelu, R., Goodmurphy, M., Lyn, R.K, and Pezacki, J.P. MicroRNA-122 seed site accessibility in hepatitis C virus RNA (Poster)
10. 16th International Symposium on Hepatitis C virus and related viruses 2009 Presented preliminary Masters research at international conference in Nice, France Singaravelu, R.*, Sagan, S.M., Luebbert, C., and Pezacki, J.P. Investigating the microRNA signature of hepatitis C virus infection (Poster)
CONFERENCE PROCEEDINGS 1. Singaravelu R., Jones D.M., Russell R.S., Pezacki J.P.: Small molecule-mediated perturbation of
HCV-associated host pathways reveal potential antiviral modulations in miRNA expression – A327. In Canadian Journal of Gastroenterology; 2012. Volume 26, Supplement SA.
2. Singaravelu R., Pezacki J.P.: Characterizing microRNA profiles for HCV pathogenesis and antiviral
mechanisms – A149. In Canadian Journal of Gastroenterology; 2011. Volume 25, Supplement SA.

210
MEDIA 1. Natural Sciences and Engineering Research Council of Canada (NSERC) 2015 Interviewed about article in Nature Chemical Biology by Brittany St. Louis to explain role of miRNAs
in immunometabolic response. 2. Genetic Engineering & Biotechnology News (http://www.genengnews.com) 2014 Vol 34, Issue 4: MicroRNAs leaping from Lab to Clinic – Cover Article
Interviewed about article in Hepatology by Dr. Kate Marusina for article on outlook on miRNAs as prognostics and therapeutics for hepatitis C
3. College of American Pathologists (CAP) Today (http://www.captodayonline.com/) June 2014
microRNAs entice as diagnostic key to multiple disease – pg. 56-62 Interviewed by Anne Paxton as part of Q&A for outlook on microRNAs as diagnostic and therapeutic tools
CONTRIBUTED GRANTS Canadian Institute of Health Research Operating Grant – March 2014 RN 0000229561 – 326533 The role of microRNAs in hepatitis C virus induced metabolic alterations of the liver. PI: John P. Pezacki. Grant was ranked first by the Virology & Viral Pathogenesis committee across Canada. Role: Helped conceive ideas, contributed the majority of the preliminary data, and helped with the writing of the grant.
PEER REVIEWER Annals of Clinical Biochemistry;