evaluation of the risk of flood in iskandar malaysia...
TRANSCRIPT

Evaluation of the Risk of Flood in Iskandar Malaysia Region, Using
Fuzzy Logic and Weighted Linear Combination in Geographic
Information System
NASIM YEGANEH
A project report submitted in partial fulfillment of the requirements for the
award of the degree of Master of Science (Urban and Regional Planning)
Faculty of Built Environment
Universiti Teknologi Malaysia
JUNE 2013
iii
DEDICATION
To my beloved Mother and Father
with Regards…
iv
ACKNOWLEDGMENT
Many have contributed to the completion of this study, knowingly and
unknowingly, for which I am highly indebted. First of all, I am greatly indebted to
my supervisor, Dr. Soheil Sabri, for his knowledge, advice, patience and immense
contribution in directing the framework of the study, and for putting up with my
initial endless “waffling”. His time and effort is highly appreciated. I also would like
to express my appreciation to Assoc. Prof. Dr. Foziah Johar for her comments and
cooperation during conducting this study.
Further gratitude is extended to my friends especially Zhou wei. For their
encouragement, support and presence helped. I’m also grateful to them for filling my
academic days with joy and happiness.
Last but not the least, I would like to sincerely thank my family, brother
Bizhan Yeganeh and sisters Maryam Abbasi and Negin Yeganeh, specially my
parents Nezam Yeganeh and Shahin Shahbazi for their endless love, support and
encouragement. I could not have done it without you!
v
ABSTRACT
Recently, Iskandar Malaysia region have been affected by flood events,
which cause environmental, social and economic impacts. Severe rainfall, natural
situation, new unplanned developments, and insufficient drainage systems make the
situation more remarkable.
This research is an approach of flood hazard assessment at regional scale. The
objectives of this study are to find out the criteria which contribute to the risk of
flooding based on the characteristic of the region to develop a GIS-aided urban flood
susceptibility map. Fuzzy logic and Weighted Linear Combination (WLC) methods
in Geographic Information System (GIS) are used to achieve the objectives. Defined
criteria are evaluated by means of complexity, uncertainty and sensitivity analysis.
The methodology emphasizes on uncertainty criteria which contribute to the risk of
flood and increase the risk. Distance from main stream, elevation, slope, land use
type, distance from river and distance from discharge channel are recognized as
effective criteria within the region. Each criterion is evaluated based on fuzzy
membership type and generated map are combined using weighted linear
combination to produce the final flood susceptibility map. Final susceptibility map
indicates that around 6.586 square kilometers within the region face high level of
risk. Pulai, Senai Kulai, Tebrau and Johor Bahru can be considered as areas which
face the risk. Natural and man-made situation influence the level of risk in each area.
Generally the southern part of the region has high level of risk as a consequence of
conjunction of location of stream, lowland and land use type. The model is evaluated
by sensitivity analysis to analysis the uncertainty and degree of importance of input
criteria. Finally the situation in 2025 is investigated based on the proposed plan for
2025.
vi
ABSTRAK
Baru-baru ini wilayah Iskandar, Malaysia telah terjejas dengan kejadian-
kejadian banjir yang menyebabkan impak alam sekitar, sosial dan ekonomi. Hujan
yang sangat lebat, keadaan semulajadi, pembangunan baru yang tidak dirancang, dan
sistem perparitan yang tidak mencukupi menjadikan keadaan lebih parah lagi.
Kajian ini adalah satu pendekatan penilaian bahaya banjir dalam skala
wilayah. Objektif kajian ini ialah untuk mencari kriteria yang menyumbang kepada
risiko banjir berdasarkan kepada ciri-ciri wilayah tersebut dan membangunkan peta
kecenderungan banjir bandar dengan bantuan GIS. Kaedah Fuzzy Logic dan
Weighted Linear Combination (WLC) dalam Sistem Maklumat Geografi (GIS) telah
digunakan untuk mencapai objektif yang digariskan. Kriteria yang telah ditetapkan
dinilai melalui kerumitan, ketidaktentuan, dan analisis sensitiviti. Kaedah yang
digunakan menumpukan kepada ketidaktentuan kriteria yang menyumbang kepada
risiko banjir dan meningkatkan lagi risiko ini. Jarak dari aliran utama, ketinggian,
cerun, jenis penggunaan tanah, jarak dari sungai, dan jarak dari saluran pembuangan
adalah ciri-ciri yang yang dikenalpasti sebagai kriteria yang efektif dalam wilayah
ini. Setiap kriteria dinilai berdasarkan kepada jenis Fuzzy membership dan gabungan
peta yang dijana adalah menggunakan kombinasi linear wajaran (weighted linear
combination) untuk menghasilkan peta kecenderungan banjir yang terakhir. Peta
kecenderungan banjir yang terakhir ini menunjukkan bahawa linkungan 6.586
kilometer persegi dalam wilayah yang dikaji berdepan dengan risiko tahap tinggi.
Pulai, Senai, Kulai, Tebrau, dan Johor Bahru boleh dianggap sebagai kawasan yang
berdepan dengan risiko ini. Keadaan semulajadi dan buatan manusia mempengaruhi
tahap risiko dalam setiap kawasan. Secara umumnya, bahagian selatan wilayah ini
mempunyai tahap risiko yang tinggi berdasarkan kepada lokasi sungai, tanah rendah,
dan jenis penggunaan tanah. Model ini dinilai oleh analisis sensitiviti untuk menilai
ketidaktentuan dan tahap kepentingan kriteria input. Akhirnya, situasi pada tahun
2025 dikaji berdasarkan pelan perancangan yang dicadangkan untuk tahun tersebut.
vii
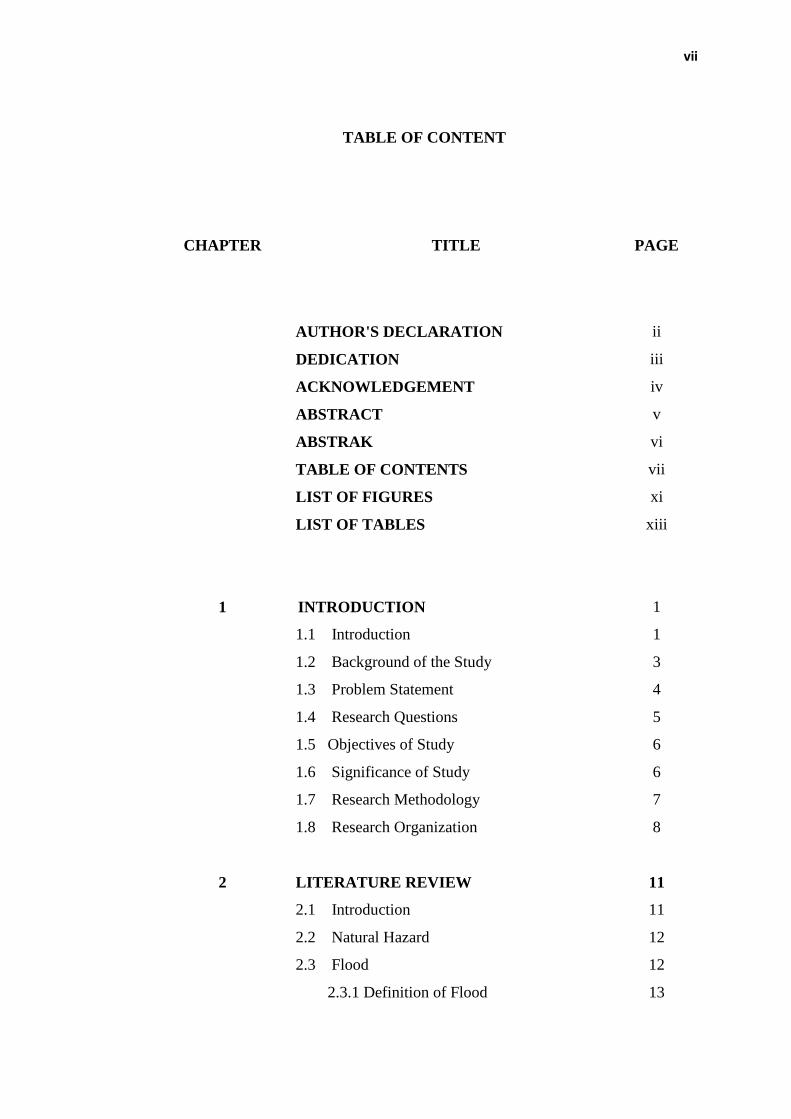
TABLE OF CONTENT
CHAPTER
TITLE
PAGE
AUTHOR'S DECLARATION ii
DEDICATION iii
ACKNOWLEDGEMENT iv
ABSTRACT v
ABSTRAK vi
TABLE OF CONTENTS vii
LIST OF FIGURES xi
LIST OF TABLES xiii
1 INTRODUCTION 1
1.1 Introduction 1
1.2 Background of the Study 3
1.3 Problem Statement 4
1.4 Research Questions 5
1.5 Objectives of Study 6
1.6 Significance of Study 6
1.7 Research Methodology 7
1.8 Research Organization 8
2
LITERATURE REVIEW
11
2.1 Introduction 11
2.2 Natural Hazard 12
2.3 Flood 12
2.3.1 Definition of Flood 13
viii
2.3.2 Causes of Flood 14
2.3.3 Flash Flood 16
2.4 Risk 17
2.5 Flood Risk Assessment 18
2.5.1.Different Methodologies for Flood
Risk Assessment 19
2.6 Flood Effects on Built Environment 21
2.7 Effects of Urban Development on Flood 22
2.7.1 Urban Development Hydrologic Effect 23
2.7.2 Hydraulic Effects due to Stream
Channels and Floodplains Changes 25
2.7.3 Urban Development Effects on Flood
Frequency and Discharge 26
2.8 Indicators Which Contribute to the Risk of
Flood 29
2.8.1 Distance to the Discharge Channels 36
2.8.2 Elevation 37
2.8.3 Slope 38
2.8.4 Land Use and Cover Type 38
2.8.5 Distance from Stream 39
2.9.6 Population Density 39
2.9 Flood in Malaysia 41
3 RESEARCH METHODOLOGY AND DATA
PREPARATION 46
3.1 Introduction 46
3.2 Methodological Framework and Model
Introduction 46
3.3 Methodology Approach 49
3.3.1 Phase One: Investigate the Main
Criteria which are Associated with
Flood Risk
49

ix
3.3.2 Phase Two: Find out to what Extent
do Criteria Associate with the Risk
of Flooding
49
3.3.2.1 Justification for Suggested
Method 50
3.3.2.2 Criterion Weighting 51
3.3.3 Phase Three: Generate Flood
Susceptibility Map with Respect to
Defined Criteria
52
3.4 Study Area 54
3.5 Data Collection and Data Preparation 58
3.5.1 Map Projection 58
3.5.2 Convert Vector Data to Raster Data 58
3.5.3 Data Reclassification 60
3.5.4 Fuzzy Membership Type Selection 63
3.5.5 Weighted Linear Combination 71
3.6 Modeling 73
3.6.1 Model Validation 73
3.6.2 Model Evaluation 73
3.6.3 Sensitivity Analysis 74
3.7 Summary
75
4 DATA ANALYSIS, RESULTS AND
DISCUSSION 76
4.1 Introduction 76
4.2 Model validation 77
4.3 Model Evaluation 78
4.4 Investigate the condition and highlighting
effective criteria in different Mukim 81
4.4.1 Tebrau 81
4.4.2 Senai Kulai 84
4.4.3 Pulai 88
4.4.4 Sungai Karang, Tanjong Kupang, 92
x
Jelutong and Jeram Batu
4.4.5 Johor Bahru 93
4.4.6 Comparison between Different
Mukims 95
4.4.7 Model Sensitivity Analysis 98
4.4.8 Vulnerability Assessment 105
4.5 Generated Model based on Proposed Plan
for 2025 107
4.4.1 Generated Model for 2025 107
4.6 Summary
110
5 CONCLUSION 112
5.1 Summary of Finding 112
5.2 Conclusion 113
5.3 Recommendation 114
REFERENCES 116
xi
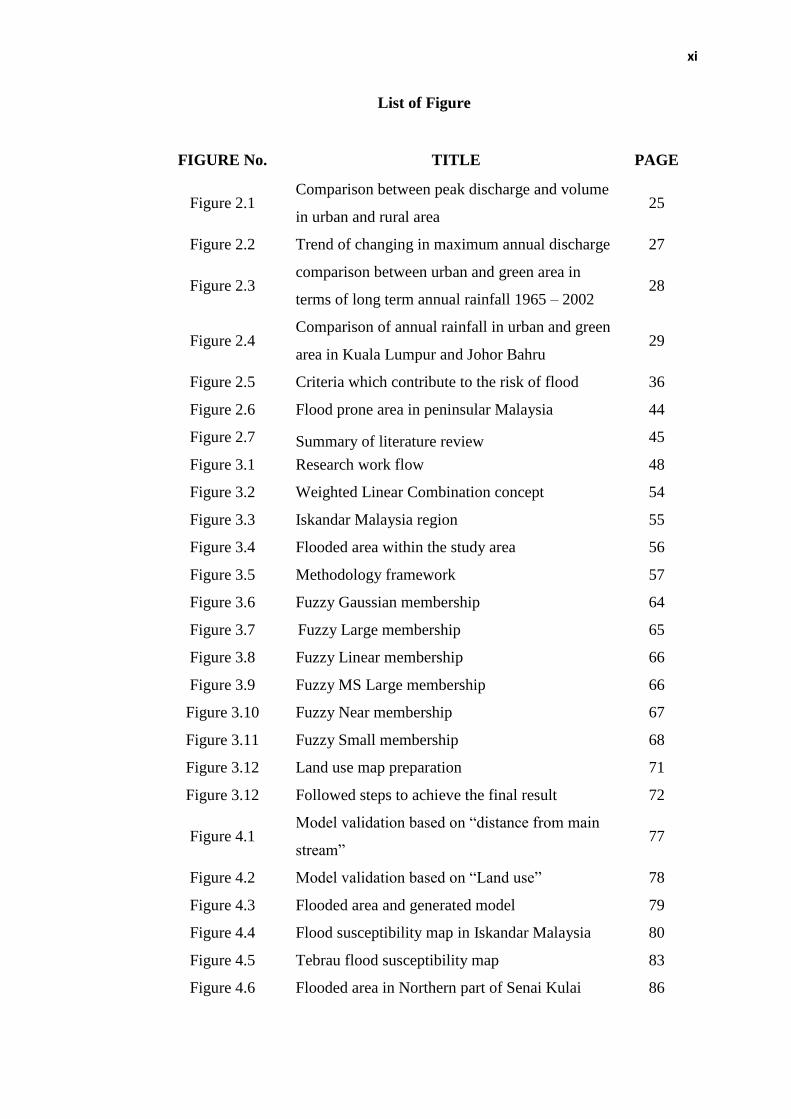
List of Figure
FIGURE No. TITLE PAGE
Figure 2.1 Comparison between peak discharge and volume
in urban and rural area 25
Figure 2.2 Trend of changing in maximum annual discharge 27
Figure 2.3 comparison between urban and green area in
terms of long term annual rainfall 1965 – 2002 28
Figure 2.4 Comparison of annual rainfall in urban and green
area in Kuala Lumpur and Johor Bahru 29
Figure 2.5 Criteria which contribute to the risk of flood 36
Figure 2.6 Flood prone area in peninsular Malaysia 44
Figure 2.7 Summary of literature review 45
Figure 3.1 Research work flow 48
Figure 3.2 Weighted Linear Combination concept 54
Figure 3.3 Iskandar Malaysia region 55
Figure 3.4 Flooded area within the study area 56
Figure 3.5 Methodology framework 57
Figure 3.6 Fuzzy Gaussian membership 64
Figure 3.7 Fuzzy Large membership 65
Figure 3.8 Fuzzy Linear membership 66
Figure 3.9 Fuzzy MS Large membership 66
Figure 3.10 Fuzzy Near membership 67
Figure 3.11 Fuzzy Small membership 68
Figure 3.12 Land use map preparation 71
Figure 3.12 Followed steps to achieve the final result 72
Figure 4.1 Model validation based on “distance from main
stream” 77
Figure 4.2 Model validation based on “Land use” 78
Figure 4.3 Flooded area and generated model 79
Figure 4.4 Flood susceptibility map in Iskandar Malaysia 80
Figure 4.5 Tebrau flood susceptibility map 83
Figure 4.6 Flooded area in Northern part of Senai Kulai 86

xii
Figure 4.7 Fuzzy membership map in terms of land use type
in Senai Kulai 87
Figure 4.8 Senai Kulai flood susceptibility map 88
Figure 4.9 Flooded area in Northern part of Pulai 90
Figure 4.10 Pulai flood susceptibility map 91
Figure 4.11 Sungai Karang, Tanjong Kupang, Jelutong and
Jeram Batu flood susceptibility map 93
Figure 4.12 Johor Bahru flood susceptibility map 95
Figure 4.13 Built up and non-built up area 97
Figure 4.14 Sensitivity analysis maps in Iskandar Malaysia 100
Figure 4.15 First step of sensitivity analysis 101
Figure 4.16 Second step of sensitivity analysis 102
Figure 4.17 Third step of sensitivity analysis 102
Figure 4.18 Fourth step of sensitivity analysis 103
Figure 4.19 Fifth step of sensitivity analysis 104
Figure 4. 20 Sixth step of sensitivity analysis 104
Figure 4. 21 Population density and area under the flood risk 106
Figure 4.22 Fuzzy membership maps in terms of land use for
2011 and 2025 108
Figure 4.23 Flood susceptibility map for 2011 and 2025 108
Figure 4.24 Comparison between built up and non-built up
area in 2011 and 2025 110

xiii
List of Table
TABLE No. TITLE PAGE
Table 2.1 Criteria and Indicators 40
Table 3.1 Distance from main stream, river and drainage
system 60
Table 3.2 Assigned rank for reclassify the indicators 62
Table 3.3 Type of fuzzy membership 70
Table 3.4 Weight of criteria 72
Table 4.1 Land use type in Tebrau 82
Table 4.2 Land use type in Senai Kulai 84
Table 4.3 Land use type in Pulai 89
Table 4.4 Land use type in Sungai Karang, Tanjong
Kupang, Jelutong and Jeram Batu 92
Table 4.5 Land use type in Johor Bahru 94
Table 4.6 Comparision between elevation and slope in
Mukims 96
Table 4.7 Comparision between land use type in Mukims 97
Table 4.8 Sensitivity analysis result 105
Table 4.9 Comparison between land use type in 2011 and
2025 in different Mukims 109
CHAPTER 1
INTRODUCTION
1.1 Introduction
Floodplains are recognized as desirable places for habitation and
development due to the inherent advantages for water supply, irrigation system,
power, food and defense (White, 2008). Also convenient navigation and
transportation system for communication provide along coastal area and rivers
(Tingsanchali, 2012). Despite the above mentioned advantages, this situation
increases the risk of flooding and make flooding one of the most remarkable natural
hazards (White, 2008).
During the last decade, flooding is recognized as the most common disaster in
all over the world and causes nearly half of all victims of natural hazards. In addition
to that, economic losses is estimated around US $185 billion (Alderman et al., 2012).
More than 50 percent of global flood damages occur in Asian countries
(Tingsanchali, 2012). Due to climate change and arising sea level flooding are
expected to occur more frequent and intensive. In addition, more people will be put
in jeopardy of flooding due to increasing levels of urbanization recently. Land use
2
change is associated with urban development and affects flooding in many ways
(Alderman et al., 2012).
Natural hazards’ threat in urban areas is mostly inscribed via land-use zoning
and building regulation (Khailani and Perera, 2013). Deforestation, removing soil
and vegetation, grading land surface and improper drainage system implementation
intensify runoff. Volume, vehemence and frequency of flood will be increased as a
result of the peak discharge. Capacity of stream channels for transmitting floodwater
are affected and decreased due to the urban development. Constructing roads and
building in place which are located in flood prone areas increase the risk of flooding,
inundation and erosion. Surface water flooding management is impeded due to the
urban drainage characteristic (Kaźmierczak et al., 2011).
Basically, some attributes can provide inherent resilience within the city.
Impermeable surface within the cities such as buildings, parking and roads increase
the surface runoff. On the other hand presences of green space and city surface which
have high capacity to observe water reduce runoff volume (Kaźmierczak et al.,
2011).
Apparently, land use and evapotranspiring surfaces proportion have effects
on water behavior and flooding. Housing type as one of the city features affects the
risk of flooding. Housing units which are located at or below ground level or housing
with low floor are more frequently exposed to flood (Kaźmierczak et al., 2011).
Lightweight constructions are more affected by flooding than solid masonry
building. In addition, risk of flooding is associated with natural feature, slope,
topography and land use as well (Kaźmierczak et al., 2011). As a result, urban area
where once seen as a safety place, nowadays face to different disasters and risks
(White, 2008).

3
Based on the above argument it can be inferred that various criteria might
increase the risk of flooding and flood vulnerability. Hence to find the criteria that
contribute to the risk of flooding and appropriate method to evaluate the criteria
seems necessary to mitigate the risk. Therefore, providing effective geospatial
information by using information and communication technology can provide proper
basis to improve the decisions which are made in planning system and development
(Chandio et al., 2012).
1.2 Background of the Study
In Malaysia floods are known as the most common natural hazards due to the
heavy rainfall that causes some destruction every year. During 1956–2007, the
number of victims of flooding has estimated around 2.7 million people. In Malaysia
9% of total land that occupies an area of 29,000 km2 which includes 23% of total
urban area are located in flood prone areas. Due to the lack of appropriate measure
for development control, the annual cost of flooding in the country is estimated
RM100 million (Khailani and Perera, 2013). Flood as a common natural hazard
within the country has effects on environmental, economic and social aspects of
people’s life. Mitigating the effects of flood on different aspects of society can
ensure more sustainable development.
Therefore, emphasis on physical adaptations and effective criteria to reduce
the risk of flood in built environment and vulnerability of settlements through
planning and development interventions for making the human settlement more
sustainable during natural hazards is an essential term (Khailani and Perera, 2013).
Morphology, natural situation and artificial element must be considered in
risk assessment and future development. Recognizing built and natural elements

4
which are affected the risk of flooding within the area can be considered as an
important part of evaluating flood hazard. In addition, the risk of flooding is higher
in more urbanized area (Morelli et al., 2012). Therefore, to find out the reasons and
criteria that increase the risk of flood exposure must be considered.
Furthermore during last decade Malaysia accelerate urbanization trend and
also deforestation can be observed within the country (Malaysia National Physical
Plan, 2010). Due to this situation more area expose to the risk of flooding. Different
urban features that can increase the amount of runoff and the risk of flooding can be
observed within the urbanized area. Percentage of impervious surface is remarkably
high in cities. This character can affect the rainfall infiltration, inundation and flood
damages (Tingsanchali, 2012). Hence identifying all the criteria which are associated
with the risk of flood can lead the planners toward sustainable development.
Besides the destructive environmental effect flood hazard also has economic
and social effect especially in urban area that affect the development in direct and
indirect ways (Tingsanchali, 2012). Hence, evaluating the data about stream flow and
the effects of land use can help us to reduce loss of social capital and property.
1.3 Problem Statement
Iskandar Malaysia is situated on the South of Peninsular Malaysia and it is
considered as a very special and strategic location. Because of its location, it became
the most popular gateway from South. Based on National Physical Plan rapid urban
growth can be observed in the area.
5
In terms of weather, study area is under tropical weather with the different
daily temperature from 24ºC until 32ºC. Overall, the topographic condition is up to
640 meters above sea level and the lowest is about 2 meters from sea level. Average
annual rainfall is 1778 mm with average temperature of between 25.5 °C (78 °F) and
27.8 °C (82 °F). Humidity is between 82% and 86% (www.mbjb.gov.my). Basically,
in recent years due to the heavy rainfall the region faced several damages because of
flood. Therefore, to find the character within the study area which are increased the
risk of flooding can be helpful to reduce the number of victims and property loss.
In addition, rapid urban growth and deforestation within the region make the
situation more remarkable. Flood hazard recognizes as environmental phenomenon
but it can affect other components of sustainability including social and economic
aspects as well. One of the main goals of Malaysia National Physical Plan is promote
the current situation toward the sustainable development (Malaysia National Physical
Plan, 2010). Therefore, going through sustainability strategy and following the
National Physical Plan framework needs to find out effective criteria which are
associated with sustainability and risk of flooding. Evaluating the identified criteria
can provide an appropriate basis for future development especially in developing
area and mitigate the risk in current and future situation.
1.4 Research Questions
This research is conducted to find out the appropriate answer for questions below:
Which criteria contribute to the risk of flooding?
To what extent do criteria associate with the risk of flooding?
Which place within the study area face higher risk of flooding?
6
How to mitigate the flood vulnerability with respect to flood susceptibility
map?
1.5 Objectives of Study
This study aims to evaluate the effect of urban form on the flood vulnerability in
urban areas. Objectives of the study are mentioned below:
To investigate the main criteria which are associated with flood risk
To evaluate degree of importance for criteria that increase the risk of flooding
To generate flood susceptibility map with respect to defined criteria
To examine the impact of significant criteria which contribute to the flood
vulnerability for evaluating future development
1.6 Significance of Study
Flood is identified as the most common type of natural disaster and has
occurred more intensive and recurrent in recent year (Alderman et al., 2012).
Different conditions such as climate change, global warming, heavy rainfall, rising
level of sea, high tides and manmade factors including more urbanized area,
inappropriate land use, deforestation, aggravation of drainage channels and etc.
increase the risk of flood occurrence (Tingsanchali, 2012). Environmental
devastation, social and economic loss can be observed obviously as an outcome of

7
this phenomenon. Actually different environmental, social and economic aspects of
society are affected by flooding. Therefore, addressing the measures that can mitigate
the effects of the flood seems necessary.
This study carries out in the Southern Malaysia where flood is a dominant
natural disaster. Also rapid urbanization and deforestation can be observed within the
area clearly. Furthermore, this area is coastal area in which the risk of flooding is
high due to the low lying level (Tingsanchali, 2012). Moreover urbanized area
experience more social and property loss when the flood hazard occurs. Due to the
many changes which are happened during urbanization trend such as green space
devastation and generating more impervious surfaces, risk of flooding has been
increased in urban area (Tingsanchali, 2012). Hence, it can be concluded that natural
and manmade situation affect the risk of flooding in the study area. Therefore
investigating the criteria which contribute to the risk of flooding is necessary to find
out the appropriate direction for future development and measures for mitigating the
risk of flooding and its effect.
1.7 Research Methodology
Methodology is a systematic process of collecting, organizing and analyzing
data which is selected based on the research objective. Methods that will be used
through conducting the research are described below. Research methodology to
conduct the research will be elaborated in chapter 3.
I. To investigate the main urban form criteria which are associated with flood
risk in urban area, different sources is reviewed to find out relevant criteria
which contribute to the risk of flood.
8
II. To evaluate degree of importance for criteria, Fuzzy logic can be operated to
analyze the criteria and alternatives which are extracted through literature
review.
III. To examine the impact of significant criteria combination between
Geographical Information Systems (GIS) and Fuzzy Logic by using
Weighted Linear Combination (WLC) can be carried out to create flood
susceptibility map. GIS provide basis for criteria computation and can be
used in spatial analysis and modeling while a Fuzzy logic provide basis for
categorizing and ranking the criteria.
1.8 Research Design and Organization
A research design can be recognized as blueprint or framework for shedding
light into the procedure and provide bases for conducting the research. It can be
defined as a tool to gain the research questions. Six factors which are mentioned
below identified by Sekaran (1992) as research design elements:
i. Type of investigation: Type of investigation includes experimental,
descriptive or comparative research.
ii. Purpose of the study: Purpose of study indicates the goal of research that can
be descriptive, exploratory or hypothesis testing.
iii. Research limitation: each research has its own limitation in terms of
researcher and specific field of science where the research will be carried out; a
research design defines all limitation.
iv. Setting the goals of the study: Goals of the study must be adjusted before
beginning the research. Study goals give the researcher clear direction and also it is
necessary part of research design.
9
v. Measures that are related to analysis: Each research includes various
indicators as input or output to be measured. These indicators must be defined clearly
in research design.
vi. Research scheduling regards to time: The final part of research design is
recognized as time scheduling. In some experimental research different factors such
as production life span or perishable material can be affected by timing. All the
research must follow the scheduling which can be used as helpful tools to get output
from the process by regarding to the time.
Chapter1
Chapter 1 includes an introduction to the research and its significance.
Research question and objectives are introduced in this chapter as well, followed by
research methodology to conduct the research.
Chapter 2
Chapter 2 discusses about relevant terms to provide clear understanding about
the subject. Causes and effects of flooding are investigated. Relevant researches are
revised to find out the criteria which are associated with the risk of flooding to be the
source of criteria and indicators selection.
Chapter 3
Chapter 3 presents the research structure and main method that are used to
conduct the research. Data preparation trend by using Fuzzy method and Weighted
Linear Combination in Geographic Information system environment discusses as
well.
10
Chapter 4
Chapter 4 elaborates the data analysis, result and finding of the research. The
main aim of this chapter is to indicate the area with high level of risk and find out the
significant criteria which contribute to the risk and compare the different situation.
Chapter 5
Chapter 5 sums up the research finding, also presents some potential for uses
of the outcome of the research and recommend suggestions regarding the current and
future situation.
116
REFERENCE
Alderman, K., Turner, L. R., and Tong, S. (2012). Floods and human health: a
systematic review. Environment international. 47: 37_47.
Al-Hanbali, A. (2011). Using GIS-Based Weighted Linear Combination Analysis
and Remote Sensing Techniques to Select Optimum Solid Waste Disposal
Sites within Mafraq City, Jordan. Journal of Geographic Information System.
03(04): 267_278.
AS Badrul Hisham, Marzukhi, MI., Daud. AR. (2009). The Worst Flood in 100
Years : Johore Experience. Somatosensory & Motor Research. 21(2):
145_145.
Azlina, N., Aziz, A., Aziz, K.A. (2011). Managing Disaster with Wireless Sensor
Networks. 13th International Conference on Advanced Communication
Technology (ICACT) 13-16 Feb. Seoul: IEEE, 202_207.
Boroushaki, S. and Malczewski, J. (2008). Implementing an extension of the
analytical hierarchy process using ordered weighted averaging operators with
fuzzy quantifiers in ArcGIS. Computers & Geosciences. 34(4): 399–410.
Calianno, M., Ruin, I. and Gourley, J.J. (2013). Supplementing flash flood reports
with impact classifications. Journal of Hydrology. 477: 1_16.
Camarasa Belmonte, A.M., López-García, M.J. and Soriano-García, J. (2011).
Mapping temporally-variable exposure to flooding in small Mediterranean
basins using land-use indicators. Applied Geography. 31(1):.136–145.
Chandio, I. A., Matori, A. N. B., WanYusof, K. B., Talpur, M. A. H., Balogun, A.-
L., and Lawal, D. U. (2012). GIS-based analytic hierarchy process as a
multicriteria decision analysis instrument: a review. Arabian Journal of
Geosciences.
117
Chang, H. and Franczyk, J. (2008). Climate Change , Land-Use Change , and
Floods : Toward an Integrated Assessment. Geography Compass. 5(2):
1549_1579.
Chang.K, Introduction to Geographic information system (sixth edition), 2012. Mc
Graw-Hill companies. New York
Crosetto, M. and Tarantola, S. (2001). Tools for GIS-based model Implementation.
International Journal of Geographical Information Science. 15(5): 415_437.
Drobne, S. and Lisec, A. (2009). Multi-attribute Decision Analysis in GIS : Weighted
Linear Combination and Ordered Weighted Averaging. Informatica. 33:
459_474.
Fernández, D.S. and Lutz, M. A. (2010). Urban flood hazard zoning in Tucumán
Province, Argentina, using GIS and multicriteria decision analysis.
Engineering Geology. 111(1-4): 90_98.
Hajek, Petr, "Fuzzy Logic" The Stanford Encyclopedia of Philosophy (Fall 2010
Edition).
Hock, K.M. and Ramli, A.T. (2006). Iso dose-rate contour map of terrestrial gamma
radiation in johor bahru district, johor. Fiz. UTM. (1): 22–26.
Jianfen, L., Xingnan, Z. and Huimin, W. (2013). Flood Risk Mapping for Different
Landuse Senarios Based on RS and GIS. Applied Mechanics and Materials.
298: 2415–2419.
Joerin, F., The´riault, M. and Musy,A. (2001). Using GIS and outranking
multicriteria analysis for land-use. Geographical Information Science. 15(2):
153–174.
118
Julien, P.Y., Ghani, A. Ab., Zakaria, N. A., Abdullah, R.and Chang, C. K. (2010).
Case Study : Flood Mitigation of the Muda River, Malaysia. Journal of
Hydraulic Engineering. 136(April): 251–261.
Kamsin, A. (2008). A Real Time Simulation and Modeling of Flood Hazard Faculty
of Computer Science and Information Technology. 12th WSEAS
International Conference on SYSTEMS, Heraklion, Greece. July 22-24, 438–
443.
Kaźmierczak, A., and Cavan, G. (2011). Surface water flooding risk to urban
communities: Analysis of vulnerability, hazard and exposure. Landscape and
Urban Planning. 103(2): 185–197.
Khailani, D. K., and Perera, R. (2013). Mainstreaming disaster resilience attributes in
local development plans for the adaptation to climate change induced
flooding: A study based on the local plan of Shah Alam City, Malaysia. Land
Use Policy. 30(1): 615–627.
Kia, M.B., Pradhan,B., Pirasteh,S., Azmin Sulaiman,W.N, Mahmud,A.R., and
Moradi, A. (2012). An artificial neural network model for flood simulation
using GIS: Johor River Basin, Malaysia. Environmental Earth Sciences.
67(1): 251–264. •
Konrad, C.P. (2002). Hydrologic Trends Associated with Urban Development for
Selected Streams in the Puget Sound Basin , Western Washington Hydrologic
Trends Associated with Urban Development for Selected Streams in the. U.S.
Department of the Interior U.S. Geological Survey: 1–38.
Konrad, C.P. (2003). Effects of Urban Development on Floods. U.S. Department of
the Interior U.S. Geological Survey: 1–4.
Kubal,C., D. Haase,D., Meyer,V. and Scheuer,S. (2009). Integrated urban flood risk
assessment, adapting a multicriteria approach to a city. Natural Hazards and
Earth System Sciences. 9: 1881–1895.
119
Lamond, J., Booth, C., Hammond, F. and Proverbs, D. (2012). FLOOD HAZARDS
Impact and Responses for the Built Environment. Taylor and Francis Group:
CRC press.
Levy, J.K., Hartmann,J., Kevin W. Li, Yunbi, A. and Asgari,A. (2007). Multi-
Criteria Decision Support Systems for Flood Hazard Mitigation and
Emergency Response in Urban Watersheds. Journal of the American Water
Resources Association. 43(2): 346–358.
Mackenzie, L.D. and David, A.C: Hydrology. Introduction to Environmental
Engineering. Third Edition. USA: Mc Graw Hill. (1998):81.
Malaysia : Floods. (2007). International Federation of Red Cross and Red Crescent
Societies. (July): 1–7.
Malaysia National Physical Plan, Federal Department of Town and Country
Planning, Ministry of Housing and Local Government, 2010.
Malczewski J. (1999). GIS and Multicriteria Decision Analysis, John Wiley and
Sons, Toronto.
Mohd, M.S, Alias,B. and Daud, D. (2006). GIS Analysis for flood Hazard Mapping :
Case Study ; Segamat, Johor, West Malaysia. Seminar Nasional GIS: 1–15.
Montz, B.E. and Tobin, G. A. (2011). Natural hazards: An evolving tradition in
applied geography. Applied Geography. 31(1): 1–4.
Morelli, S., Segoni, S., Manzo, G., Ermini, L., and Catani, F. (2012). Urban
planning, flood risk and public policy: The case of the Arno River, Firenze,
Italy. Applied Geography. 34: 205–218.
Musungu, K., Motala, S. and Smit, J. (2012). Using Multi-criteria Evaluation and
GIS for Flood Risk Analysis in Informal Settlements of Cape Town : The
Case of Graveyard Pond. South African Journal of Geomatics. 1(1): 77–91.
120
Ologunorisa, T E and Abawua, M.J. (2005). Flood Risk Assessment : A Review.
Appl. Sci. environ. Mgt. 9(1): 57–63.
Ologunorisa,T. (2004). An Assessment of Flood Vulnerability Zones in the Niger
Delta, Nigeria. International Journal of Environmental Studies. 61(1): 31–38.
Paquette, J. and Lowry, J. (2012). Flood hazard modelling and risk assessment in the
Nadi River Basin , Fiji , using GIS and MCDA. The South Pacific Journal of
Natural and Applied Sciences. 30(Fms 2009): 33–43.
Popovska, C. and Ivanoski, D. (2009). Flood risk assessment of urban areas. Risk
Management of Water Supply and Sanitation Systems: 101–113.
Pradhan, B. (2009). Flood susceptible mapping and risk area delineation using
logistic regression, GIS and remote sensing. Journal of Spatial Hydrology.
9(2): 1–18.
Saini, S.S, and Kaushik, S.P. (2012). Risk and vulnerability assessment of flood
hazard in part of Ghaggar Basin : A case study of Guhla block , Kaithal ,
Haryana , India. International journal of geomatics and geosciences. 3(1):
42–54.
Sadeghi-niaraki, A., Varshosaz, M., Kyehyun, K., Jung,J.J. (2011). Expert Systems
with Applications Real world representation of a road network for route
planning in GIS. Expert Systems with Applications. 38(10): 11999–12008.
Scheuer, S., Haase, D. and Meyer, V. (2011). Exploring multicriteria flood
vulnerability by integrating economic, social and ecological dimensions of
flood risk and coping capacity: from a starting point view towards an end
point view of vulnerability. Natural Hazards. 58(2): 731–751.
Sekaran, U. (1992). Research Methods for Business – A skill building approach (2nd
Ed). John Wiley & Sons, New Yourk.
121
Shafie, A. (2009). Extreme Flood Event: A Case Study on Floods of 2006 and 2007
in Johor, Malaysia. Technical report for Department of Civil and
Environmental Engineering, Colorado State University.
Shaluf, I.M. and Ahmadun, F. R. (2006). Disaster types in Malaysia: an overview.
Disaster Prevention and Management.15(2): 286–298.
Smyth, C.G. and Royle, S.A. (2000). Urban landslide hazards : incidence and
causative factors in Nitero´i, Rio de Janeiro, State, Brazil. Applied
Geography.20: 95–117.
Stefanidis, S. and Stathis, D. (2013). Assessment of flood hazard based on natural
and anthropogenic factors using analytic hierarchy process (AHP). Natural
Hazards: 1_17.
Sulaiman, N.A., Faizah, H., Afendy, H.K and Manan, S.A. (2012). A study on flood
risk assessment for Bandar Segamat sustainability using remote sensing and
GIS approach. Control and System Graduate Research Colloquium (ICSRC):
386–391.
Tingsanchali, T. (2012). Urban flood disaster management. Procedia Engineering.
32: 25–37.
White, I. (2008). The absorbent city: urban form and flood risk management.
Proceedings of the ICE - Urban Design and Planning. 161(4): 151–161.
Yaoyao. H, Jianzhong, Z., Pangao, K., Ning, L. and Qiang, Z. (2011). A fuzzy
clustering iterative model using chaotic differential evolution algorithm for
evaluating flood disaster. Expert Systems with Applications.38(8): 10060–
10065.
Youssef, A.M., Pradhan, B. and Tarabees, E. (2010). Integrated evaluation of urban
development suitability based on remote sensing and GIS techniques:

122
contribution from the analytic hierarchy process. Arabian Journal of
Geosciences. 4 (3-4): 463–473.
Zadeh, L.A. (1965). Fuzzy Sets. Information and Control. 8: 338–353.
Zadeh, L. A. (1988). Fuzzy logic. Computer. 21(4): 83–93.