evaluation of poverty alleviation...
TRANSCRIPT

POVERTY IN PUNJAB: A DISTRICT LEVEL STUDY
Evaluation of Poverty Alleviation Programmes 191
CHAPTER 6
EVALUATION OF POVERTY ALLEVIATION PROGRAMMES
Evaluation not only helps in counting the milestones but also setting the target in
future. It can be done during the implementation of the programme or after the completion of
the programme. In our study, evaluation is specifically related to socio-economic impact of
these poverty alleviation programmes. In this chapter an attempt has been made to evaluate
various poverty alleviation programmes adopted to check poverty. This chapter has been
divided into three sections. The first section delineates various poverty alleviation
programmes that are in vogue, in India. Section II deals with effectiveness of various poverty
alleviation programmes implemented in Punjab. Section III gives an overview of evaluation
of poverty alleviation programmes on the basis of feed back of 100 beneficiaries from Punjab
(Doaba region).
SECTION I
6.1 Various Poverty Alleviation Programmes Working in India
Poverty is a most threatening single challenge that needs a multidimensional
approach. A broad spectrum solution is required to curb and control it. It has been apparent
from various empirical studies. Sundaram (2004), and Verma and Gogna (2009) observed
that education is a necessary condition for improving the lot of poor. Mishra and Rao (2003)
found that trade liberalization accelerates growth and thereby reduces poverty. Rajan (2002)
provided the empirical authentication that various countries managed to reduce poverty with
trade liberalization policies. Ray and Lancaster (2005) established the evidence that public
distribution system is useful for backward classes as anti-poverty programme. Dev (2000)
observed that expenditure on rural infrastructure and technical support to agriculture had a
better impact than government spending on poverty alleviation programmes. Various studies
such as Ahluwalia (1978), Shrinivasan (1985), and Dev (1988) show that agricultural
development reduces poverty.
The government has taken various steps to alleviate poverty in the country. Explicitly,
the emphasis has been on removing poverty through two approaches i.e. training for rural
self-employment and provision of wage employment.

POVERTY IN PUNJAB: A DISTRICT LEVEL STUDY
Evaluation of Poverty Alleviation Programmes 192
6.1.1 Rural Poverty Alleviation Programmes
Drive against poverty has been undertaken from Fourth Five Year Plan onwards in
the country. During Fourth Five Year Plan, following programmes were launched: Small
Farmer Development Programmes (SFDP) and Drought-Prone Area Programme. Poverty
alleviation programmes started in Fifth Plan were: Food for Work Programme and Minimum
Needs Programme. Particular programmes for employment were started in Sixth Plan (1980-
85), viz Integrated Rural Development Program (IRDP), National Rural Employment
Program (NREP), Training Rural Youth for Self-Employment (TRYSEM) and Rural
Landless Employment Guarantee Programme (RLEGP). In Seventh Plan (1985-90)
government started the Jawaharlal Rozgar Yojana in 1989, and later on NREP and RLEGP
were merged with it. Employment Assurance Scheme (EAS) was implemented on October 2,
1993 during the Eighth Plan. The process of rural employment continued during Ninth Plan
and the following three schemes were started:
i) Pradhan Mantri Gramodaya Yojana (PMGY, 2000-01) the focus of PMGY is on
health, primary education, drinking water, housing and rural roads. It covers
following programmes:
• Pradhan Mantri Gram Sadak Yojana (PMGSY), launched on 25th December 2000
for constructing roads in rural areas. It is a 100 per cent centrally funded scheme.
• Pradhan Mantri Gramodaya Yojana (Rural Drinking Water Project)
• Pradhan Mantri Gramodaya Yojana (Gramin Awas) fulfills housing needs of
poor.
ii) Swarnjayanti Gram Swarojgar Yojana (SGSY) is an integrated rural development
scheme. Various other programmes (TRYSEM, DWCRA, MWS, SITRA and GKY)
were merged into Swarnjayanti Gram Swarojgar Yojana (SGSY) from April 1, 1999.
It assisted 83 lac people in 2002-03 and 90 lac people in 2003-04.
iii) Sampoorana Grameen Rozgar Yojana (SGRY) is a wage employment scheme.
The Employment Assurance Scheme (EAS) and Jawahar Gram Samridhi Yojana

POVERTY IN PUNJAB: A DISTRICT LEVEL STUDY
Evaluation of Poverty Alleviation Programmes 193
(JGSY) were merged into Sampoorana Gramin Rojgar Yojana. (SGRY) on
September 25, 2001. It is implemented through Panchayati Raj institutions (PRIs).
Rural Employment Guarantee Scheme was launched by Prime Minister Manmohan
Singh on February 2, 2006. This programme guarantees 100 days of wage employment to
every rural household in the country.
6.1.2 Urban Employment Guarantee Programmes
The proportion of urban poor in India was estimated at 23.62 per cent of total urban
population in 1999 and 15.01 per cent in 2007 (Planning Commission). In order to improve
the conditions of the urban poor, two employment schemes namely Prime Minister’s Swarna
Jayanti Shahari Rozgar Yojana (SJSRY) and Prime Minister Rozgar Yojana (PMRY) were
launched. Salient features of the schemes are given below:-
i) Swarna Jayanti Shahari Rozgar Yojana was launched on December 1, 1997. The
three urban employment generation programmes already in operation were subsumed
in SJSRY. These were: Nehru Rozgar Yojana (NRY), Urban Basic Service for Poor
(UBSP), Prime Minister’s Integrated Urban Poverty Eradication Programme
(PMIUPEP)1. This scheme is funded by centre and state, with the objective of
providing self-employment and urban wage employment. This scheme is being
monitored by State Urban Development Authority (SUDA). The SUDA implements
the programme through District Development Agency. Overall responsibility for
execution of these schemes lies with the Ministry of Urban Development and Poverty
Alleviation. The expenditure incurred on this scheme during 2004-05 was Rs.103
crore.
ii) Prime Minister Rozgar Yojana (PMRY) is a 100 per cent centrally funded scheme.
It provides self-employment to urban educated unemployed youth. At district level, it
is implemented by District Industries Centre (DIC). In metropolitan cities, it is
operated by Small Industries Services Institute (SISI).

POVERTY IN PUNJAB: A DISTRICT LEVEL STUDY
Evaluation of Poverty Alleviation Programmes 194
6.1.3 Micro Credit and Poverty Alleviation
Dr. Mohammad Yunus, founder of Grameen Bank, “If we are looking for one single
action which will enable the poor to overcome their poverty, I will focus on credit”
Micro finance in its simplest form is termed as “banking for the poor.” It creates
employment opportunities, empowers the rural women, improves the living standard of the
rural people and alleviates poverty. Micro finance programmes provide loan to poor people
for self-employment projects and helps in generating income, allowing them to care for their
families. Khandelwal (2007) pointed out that micro credit programmes are potentially a very
significant contributor to pro-poor development. Swaminathan (2007), a noted agricultural
scientist, observed that by providing micro credit to the “poorest of the poor” the gap in the
formal rural credit sector can be filled. Fernandez (2007) opined that the non-government
organizations (NGOs) and microfinance institutions (MFIs) together can maintain balance
between the environments for poverty eradication and a loan portfolio.Vasimalai and
Narinder (2007) expressed the view that micro-financing has shown substantial change in the
income in urban context (77 per cent) as compared to rural area (65 per cent). Significantly
the change in income in both the areas has been substantial. In short, micro-credit has been
viewed as the most effective method of providing finance to the less privileged.
Indian money market system there is organized as well as unorganized sector.
Organised money market (Commercial Banks, Regional Rural Banks and Co-operative
Banks) lend money against personal credit of borrowers. It insists on security, which small
landless farmers or poor people can not offer. About 70 crore people live in rural areas. This
section of the population does not have large sum of money and is in dire need of money.
Unfortunately total demand for credit from Indian society cannot be met by Indian banking
alone. Moreover there are a number of people who do not qualify for bank loans. Here comes
the role of micro-credit. Microfinance institutions exist in the form of credit unions,
commercial banks and NGOs and SHGs. The present framework of micro credit in India is as
given below.
i) National Bank of Agriculture and Rural Development (NABARD): - It provides
financial support to Bankers, SHGs and NGOs for promotions of micro-finance. It

POVERTY IN PUNJAB: A DISTRICT LEVEL STUDY
Evaluation of Poverty Alleviation Programmes 195
provides 100 per cent refinance backing to banks for financing SHGs. NABARD has
formulated a scheme for giving assistance to District Co-operative Central Banks
(DCCBs) and Primary Agricultural Co-operatives Credit Societies (PACs) to cherish
self-help groups. The scheme is implemented in various states of the country through
Regional Rural Banks (RRBs). NABARD conducted various training programmes.
Training of staff of banks, NGOs, Government agencies and SHGs leads to booming
operation2.
ii) State Bank of India (SBI):- It has enthusiastically participated in SHG-Bank Credit
Linkage programme project of NABARD. SBI has made a continuous progress in
financing SHGs. Majority of these are women SHGs. SBI is maintaining its position
as a leader among commercial banks in financing of SHGs. As at the end of March
2006, out of total SHGs financed by commercial banks, SBI’s share has been
approximately 47 per cent. SBI had credit linking with 1 million SHGs by March
20083.
iii) Small Industries Development Bank of India (SIDBI):- SIDBI identifies, takes
care of and develops micro financing institutions and provides credit support. SIDBI
Foundation for Micro Credit (SFMC) was launched by the Bank in January 1999 for
providing funds to the poor. SFMC’s mission is to create a national network of strong,
workable and sustainable microfinance institutions (MFIs)4.
iv) Self-help Groups (SHGs):- Micro-credit has proven an effective measure in on
going struggle against poverty. The programme of linking SHGs of rural poor with
banking was launched in 1992 to strengthen credit delivery in rural areas. Its focus is
on the rural poor. There are three forms of SHGs with banks viz.; i) SHGs formed
and financed by banks; ii) SHGs formed by agencies and financed by banks; iii)
SHGs financed by banks using NGOs as financial intermediates5.
POVERTY IN PUNJAB: A DISTRICT LEVEL STUDY
Evaluation of Poverty Alleviation Programmes 196
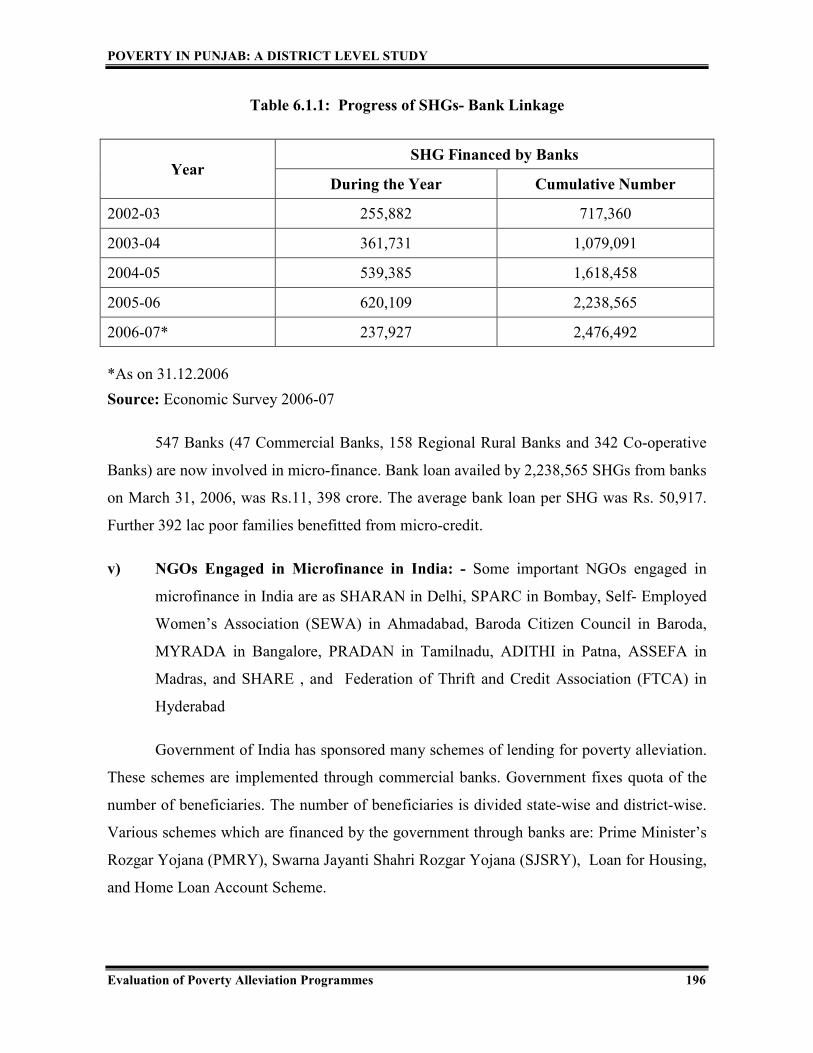
Table 6.1.1: Progress of SHGs- Bank Linkage
Year SHG Financed by Banks
During the Year Cumulative Number
2002-03 255,882 717,360
2003-04 361,731 1,079,091
2004-05 539,385 1,618,458
2005-06 620,109 2,238,565
2006-07* 237,927 2,476,492
*As on 31.12.2006
Source: Economic Survey 2006-07
547 Banks (47 Commercial Banks, 158 Regional Rural Banks and 342 Co-operative
Banks) are now involved in micro-finance. Bank loan availed by 2,238,565 SHGs from banks
on March 31, 2006, was Rs.11, 398 crore. The average bank loan per SHG was Rs. 50,917.
Further 392 lac poor families benefitted from micro-credit.
v) NGOs Engaged in Microfinance in India: - Some important NGOs engaged in
microfinance in India are as SHARAN in Delhi, SPARC in Bombay, Self- Employed
Women’s Association (SEWA) in Ahmadabad, Baroda Citizen Council in Baroda,
MYRADA in Bangalore, PRADAN in Tamilnadu, ADITHI in Patna, ASSEFA in
Madras, and SHARE , and Federation of Thrift and Credit Association (FTCA) in
Hyderabad
Government of India has sponsored many schemes of lending for poverty alleviation.
These schemes are implemented through commercial banks. Government fixes quota of the
number of beneficiaries. The number of beneficiaries is divided state-wise and district-wise.
Various schemes which are financed by the government through banks are: Prime Minister’s
Rozgar Yojana (PMRY), Swarna Jayanti Shahri Rozgar Yojana (SJSRY), Loan for Housing,
and Home Loan Account Scheme.

POVERTY IN PUNJAB: A DISTRICT LEVEL STUDY
Evaluation of Poverty Alleviation Programmes 197
Verma and Gogna (2007) expressed the view that there should be proper
identification of target group for micro-financing. Along with credit, training should be given
for proper utilization of resources. There is a need for continuous improvement in programme
design also. Finance should be used for productive purpose and not for consumption purpose,
and there should be coordination among all the micro-credit institutions.
An attempt has been made to catalogue a brief design of poverty alleviation
programmes in rural and urban areas. Now the question is how these programmes work at
grass root level. The other area that need enquiry is the effectiveness of such programmes for
the poor. The question that haunts is if, the programmes meant for the poor reach them or not.
SECTION II
6.2 Poverty Alleviation Programmes in Punjab
6.2.1 Poverty Alleviation Programmes in Operation in Punjab
This section deals with various poverty alleviation programmes under operation in
Punjab with special reference to district Kapurthala and their effectiveness. At present the
government of Punjab is implementing following poverty alleviation programmes:
Swarnjayanti Gram Swarojgar Yojana (SGSY), National Rural Employment Guarantee
Scheme (NREGS), Indira Awas Yojana (IAY), and Atta Dal Scheme.
6.2.1.1 Swarnjayanti Gram Swarojgar Yojana (SGSY)
The SGSY is a programme for rural poor entrepreneurs. This scheme is meant for
rural BPL families as well as vulnerable groups like SC/STs, women and disabled persons. It
helps the swarozgaries through bank credit and government subsidy. It provides funds to
individuals as well as self-help groups. The objective of SGSY is to bring swarozgaries
above poverty line within three years. Persons covered under this programme are known as
swarozgaries6. There are two types of swarozgaries: Individual Swarozgaries and Self-help
Groups. The financial and physical performance of SGSY has been evaluated for all blocks
of Kapurthala district on the basis of use of funds.

POVERTY IN PUNJAB: A DISTRICT LEVEL STUDY
Evaluation of Poverty Alleviation Programmes 198
Table 6.2.1: Funds Available under SGSY Programme for Kapurthala District
(Rs.in Lac)
Year Opening
Balance
Release of
Fund from
Centre
Release of
Fund from
State
Miscellaneous
Total
Available
Fund
2005-06 0.06 8.90 9.39 4.19 22.54
2006-07 0.31 30.36 6.68 1.01 38.36
2007-08 1.88 21.13 10.03 0.86 33.90
2008-09 2.98 37.18 6.65 0.85 47.67
2009-10 12.43 38.37 12.55 2.38 65.73
Source: District Rural Development Agency, Kapurthala.
The year-wise details of funds released by the center as well as the state government
for SGSY program (Self-help Groups and Swarozgaris) is depicted in Table 6.2.1. During the
year 2006-07, the total funds available was Rs. 38.36 lacs, which decreased to Rs. 33.90 lacs
in 2007-08 but after that it increased to Rs. 47.67 lacs in 2008-09 and to Rs. 65.73 lacs in
2009-10. Thus the release of funds increased excepting the year 2007-08.
Table 6.2.2: Expenditure under SGSY Program for Kapurthala District (Rs. in Lac)
Year Expenditure on
Individual Case
Expenditure
Self-Help group
as Subsidy
Revolving
Fund
Total
Expenditure
2005-06 9.60
(43.18)
11.70
(52.63)
0.93
(4.18)
22.23
(100)
2006-07 15.78
(43.25)
18.00
(49.34)
2.70
(7.40)
36.48
(100)
2007-08 11.12
(35.96)
18.23
(58.95)
1.57
(5.09)
30.92
(100)
2008-09 15.07
(42.76)
16.95
(48.09)
3.22
(9.15)
35.24
(100)
2009-10 26.34
(68.25)
9.60
(24.88)
2.63
(6.87)
38.57
(100)
Note: Figures in parenthesis represent percentages.
Source: District Rural Development Agency, Kapurthala

POVERTY IN PUNJAB: A DISTRICT LEVEL STUDY
Evaluation of Poverty Alleviation Programmes 199
In Kapurthala district, the funds of SGSY programme were spent on individual cases,
self-help groups and in the form of revolving fund. The major portion of the fund till 2008-09
was spent on subsidy to self-help groups. In 2009-10, ratio of expenditure on individual cases
is more in comparison to self-help groups. But amount of expenditure on self-help groups
shows increased tendency till 2007-08, after which it declined.
The financial assistance to individual swarozgaries was 43.18 per cent in 2005-06. It
declined to 35.96 per cent in 2007-08. It shows that during this period comparatively more
attention was given to self-help groups than individual swarozgaries for performing various
activities (dairy, steel furniture, welding, shuttering, timber merchant, embroidery, vegetable
vendors, grocery, electricity, stitching, cycle repair, radio, television repair etc). But after
2007-08, more attention in terms of distribution of funds under SGSY program was given to
individual cases and by 2009-10 more than two-third of expenditure under this scheme was
incurred on individual cases. The expenditure incurred on subsidies to SHGs has been merely
a little less than 25 per cent. However, about 7 per cent of the funds under this scheme were
kept as revolving fund in 2009-10.
Table 6.2.3: Budget of Financial Assistance under SGSY for Kapurthala District
(Rs. in Lac)
Year Total Available Fund Expenditure Balance
2005-06 22.54 22.23
(98.6)
0.31
(1.4)
2006-07 38.36 36.48
(95.09)
1.88
(4.91)
2007-08 33.90 30.92
(91.21)
2.98
(8.79)
2008-09 47.67 35.24
(73.92)
12.47
(26.08)
2009-10 65.73 38.57
(58.67)
27.16
(41.33)
Note: Figures in parenthesis represent percentages.
Source: District Rural Development Agency, Kapurthala

POVERTY IN PUNJAB: A DISTRICT LEVEL STUDY
Evaluation of Poverty Alleviation Programmes 200
Table 6.2.3 shows that in 2005-06 the percentage of utilisation of funds under SGSY
was 98.6 per cent which declined steadily to 95.09 per cent in 2006-07, 91.21 per cent in
2007-08, 73.92 per cent in 2008-09 and finally to 58.67 per cent in 2009-10. Thus, under
utilization of funds under this scheme accelerated over the years. It is clear from the Table
that even the available funds were not fully utilized. From this point of view, it can be
concluded that SGSY is not performing well.
Table 6.2.4: Block-wise Number of Beneficiaries under Self-help Groups
Year Dhilwan Kapurthala Nadala Phagwara Sultanpur
2005-06 23 24 35 20 23
2006-07 29 30 35 22 24
2007-08 32 35 35 28 27
2008-09 38 37 35 30 28
2009-10 40 40 36 32 31
Source: District Rural Development Agency, Kapurthala
So far as progress in terms of member of self-help groups is concerned, it has been
increasing in all the blocks of Kapurthala district. Highest progress is observed in Dhilwan
block and lowest in Nadala. The number of self -help groups increased from 23 to 40 (75.9
per cent increase) in Dhilwan, from 24 to 40 (66.6 per cent increase) in Kapurthala, from 35
to 36 (2.08 per cent increase) in Nadala, from 20 to 32 (60.0 per cent increase) in Phagwara,
from 23 to 31 (75.9 per cent increase) in Sultanpur. Thus it can be concluded that the
progress of SGSY is uneven. It is clear from the Table that even the available funds in any
year were not fully utilised. There should be more involvement of BDOs in the formation of
self-help groups so that more and more funds are utilized and poor people get the benefit of
this scheme.
6.2.1.2 National Rural Employment Guarantee Scheme (NREGS)
The National Rural Employment Guarantee Act was passed in September 2005 and
NREGA was launched in 2006-07 in 200 districts. It covered 130 more districts in 2007-08

POVERTY IN PUNJAB: A DISTRICT LEVEL STUDY
Evaluation of Poverty Alleviation Programmes 201
under further expansion. From April 1, 2008 it has been applied to whole country. On
October 2, 2009 it was renamed as MNREGA. Under this scheme, 3.67 crore rural
households were provided employment during 20107.
Appendix 6.1 shows that employment generated under NREGA scheme varied from
state to state. Appendix 6.2 shows district-wise employment generated in Punjab during the
year 2009-10. Families that completed 100 working days under this scheme varied from
district to district.
Table 6.2.5: Year- wise Details of Employment Generated under NREGA in
Kapurthala District
Year
No of
Registered
Households
Job
Cards
Issued
Employment No. of
Families
Completed
100 days Demanded Offered Provided
2007-08 00526 00000 0000 0000 0000 000
2008-09 11443 10933 0000 0000 0000 000
2009-10 12557 12547 4397 4397 4392 063
Source: http://nrega.nic.in/netnrega
Official data of Kapurthala district shows impressive figure of households registered
and job cards issued. It is found that the number of households registered (12557) is very
close to job cards issued (12547) in 2009-10. Almost all the persons who demanded
employment were offered job under this scheme. The share of SCs in NREGA employment
is 83.86 per cent in Kapurthala district whereas the corresponding figure in Punjab is 78.92
per cent in 2010-20118.
As per the rules and regulation of NREGA scheme, one third of the persons offered
employment should be women9. It is noticed that the share of women in NREGA workforce
has been 33.9 per cent in Kapurthala District, whereas in the Punjab it is 26.28 per cent10
.

POVERTY IN PUNJAB: A DISTRICT LEVEL STUDY
Evaluation of Poverty Alleviation Programmes 202
Table 6.2.6: Block-wise Employment Generated in Kapurthala District under NREGA
up to the Year 2009-10
Year Registered
HHs
Job
Cards
Issued
Employment Families
Completed
100 days Demanded Offered Provided
Dhilwan
Up to
2008 0010 0000 0000 0000 0000 00
Up to
2009 1964 1950 0000 0000 0000 00
Up to
2010 2072 2072 0745 0745 0745 12
Kapurthala
Up to
2008 0053 0000 0000 0000 0000 00
Up to
2009 2425 2186 0000 0000 0000 00
Up to
2010 2740 2734 1074 1074 1074 29
Nadala
Up to
2008 0174 0000 0000 0000 0000 00
Up to
2009 2149 2149 0000 0000 0000 00
Up to
2010 2307 2307 0941 0941 0941 00
Phagwara
Up to
2008 0058 0000 0000 0000 0000 00
Up to
2009 2203 2156 0000 0000 0000 00
Up to
2010 2447 2447 0764 0764 0764 03
Sultanpur
Up to
2008 0231 0000 0000 0000 0000 00
Up to
2009 2702 2492 0000 0000 0000 00
Up to
2010 2991 2987 0873 0873 0868 19
Source: District Rural Development Agency, Kapurthala

POVERTY IN PUNJAB: A DISTRICT LEVEL STUDY
Evaluation of Poverty Alleviation Programmes 203
A continuous increase in wage rate under this scheme has been observed. The wage
rate was increased from Rs. 60 to Rs. 75 per day in 2007-08 i.e. a hike of 15 per cent. It was
again raised to Rs. 100 in 2008-09.The new wage rate Rs.100 per day was made effective
from 1st April 2009
11. It is mentioned in National Rural Employment Guarantee Act
“Different wage rate may be given for different areas but not less than Rs.100”12
.But state
government was given a free hand to add to this centrally fixed wage rate. Just seven states
Haryana, Himachal Pradesh, Kerala, Punjab, Sikkim and Tripura pay Rs.100 or more13
. The
various works undertaken under NREGA are water conservation, irrigation and flood
protection etc14
.The purpose of the scheme is double fold to provide employment and
amenities.
Table 6.2.6 depicts that the progress of number of households registered, job cards
issued, employment demanded, employment offered and employment provided is observed in
all the blocks of the district. But the number of families that completed 100 days of
employment in a year is very less.
6.2.1.3 Indira Awas Yojana (IAY)
This scheme is launched for scheduled caste and non-scheduled caste BPL rural poor.
IAY was started in 1985-86 as a sub-scheme of Rural Landless Employment Guarantee
Program (RLEGP). Since January 1, 1996, it has been working as an independent scheme.
IAY is a centrally sponsored scheme. However the contributory share between centre and
state is 80:20. But in case of union territories, it is funded by Government of India. During a
financial year, 60 per cent of IAY assistance is marked for scheduled castes/ schedule tribes
and remaining 40 per cent is meant for others. It also caters to the need of freed bonded
labour, victim of atrocities and natural calamities, and the families headed by widows and
unmarried women15
.
Under IAY, Rs.25,000 is given to the BPL families for the construction of houses,
sanitary latrines and smokeless chulhas. The beneficiaries are selected from the list of eligible
households by the Gram Sabha.

POVERTY IN PUNJAB: A DISTRICT LEVEL STUDY
Evaluation of Poverty Alleviation Programmes 204
Table 6.2.7: Budget of Financial Assistance under IAY for Kapurthala District
(Rs. in Lac)
Year Receipts Expenditure Balance
2007-08 94.37 74.00
(78.41) 20.37
2008-09 135.56 95.52
(70.46) 40.04
2009-10 261.62 52.97
(20.25) 208.65
Note: Figures in parenthesis represent percentages.
Source: District Rural Development Agency, Kapurthala.
The year -wise release of funds shows that total receipts increased from Rs.94.37 lac
in 2007-08 to Rs. 135.56 lac in 2008-09 and to Rs. 261.62 in 2009-10. Allocation and
receipts under this scheme were observed increasing. These funds were spent for renovation
of old houses. However on the other hand, the ratio of utilization of funds under this scheme
has been decreasing, being 78.41 per cent in 2007-08, 70.46 per cent in 2008-09 and 20.25
per cent in 2009-10. Hence, it shows lack of involvement and awareness among people
regarding IAY (Table 6.2.7).
The release of funds increased over the period under consideration in Dhilwan,
Kapurthala, Phagwara and Sultanpur block, but the same pattern was not observed in case of
Nadala block. Table 6.2.8 shows that in 2007-08 the balance of unutilisated fund under IAY
was only in Nadala and Phagwara, but in 2008-09 it was found in Dhilwan, and in 2009-
10 it is observed in all districts. Further, under utilization of funds under this scheme
accelerated over the years.

POVERTY IN PUNJAB: A DISTRICT LEVEL STUDY
Evaluation of Poverty Alleviation Programmes 205
Table 6.2.8: Block-wise details of Funds Released for Kapurthala District under Indira
Awas Yojana (Rs. in Lac)
District Year Receipts Expenditure Balance
Dhilwan
2007-08 16.88 16.88 00.00
2008-09 18.95 06.20 12.75
2009-10 31.216 - 31.216
Total 67.046 23.08 43.966
Nadala
2007-08 23.12 09.62 13.50
2008-09 17.10 09.92 07.18
2009-10 37.16 06.62 30.54
Total 77.38 26.16 51.22
Kapurthala
2007-08 17.50 17.50 00.00
2008-09 32.68 32.68 00.00
2009-10 92.186 16.10 76.086
Total 142.366 66.28 76.086
Phagwara
2007-08 19.62 12.75 06.87
2008-09 22.21 02.10 20.11
2009-10 34.75 02.65 32.10
Total 76.58 17.50 59.08
Sultanpur
2007-08 17.25 17.25 00.00
2008-09 44.62 44.62 00.00
2009-10 66.31 27.60 38.71
Total 128.18 89.47 38.71
Source: District Rural Development Agency, Kapurthala.

POVERTY IN PUNJAB: A DISTRICT LEVEL STUDY
Evaluation of Poverty Alleviation Programmes 206
6.2.1.4 Atta Dal Scheme
Table 6.2.9 shows that district Faridkot, Muktsar, Nawan Shehar, Ferozepur,
Bathinda, Gurdaspur, Mansa, Barnala, Patiala, Sangrur and Taran Taran have poverty ratio
above average. Ropar, Hoshiarpur, Fatehgarh, Kapurthala, Jalandhar, Mohali, Amritsar,
Ludhiana, Moga on the other hand, have poverty ratio below the state average. As per the
survey conducted for Atta Dal Scheme a total number of families in 2007 in Kapurthala were
1,43,116. Out of these total 1,43,116 families 5,765 were declared BPL as per Planning
Commission report i.e. 4.22 per cent families were below poverty line. But the BPL families
identifies in Atta Dal Survey were 39,956 i.e. 27.92 per cent i.e. difference of 24.70
percentage points.
Big difference in the percentage of BPL families identified through census survey by
Planning Commission and those identified under Atta Dal scheme by Punjab Government has
been observed. In some cases the difference in percentage distribution is inexplicably large.
For instance, in case of district Faridkot the percentage of BPL families identified by the
Planning Commission is 8.23 per cent. This figure is 43.29 per cent under Atta Dal Scheme
of the Punjab Government, a difference between these two estimates being as large as 35.06
percentage points. Like wise, for Nawan Shehar, the difference in the proportion of BPL
families identified by the Punjab Government against these identified by Planning
Commission is 30.26 percentage points. The story is almost similar in case of other districts
too. For all the districts together, Planning Commission surveyed 11.59 per cent of families
as living below poverty line. This figure is as high as 28.31 per cent (a difference of 16.72
percentage points) for the state as a whole. It also gives an indication that even officially the
state Government acknowledges that poverty ratio in the state is much higher than what has
been specified by the Planning Commission.

POVERTY IN PUNJAB: A DISTRICT LEVEL STUDY
Evaluation of Poverty Alleviation Programmes 207
Table 6.2.9: District-wise Number of BPL Families Introduced by Planning Commission
and the BPL Families Identified Under Atta Dal Scheme by Punjab Government
S.
No Districts
Families
Surveyed
BPL Families
Identified by Census
Survey
(Planning
Commission)
BPL Families
Identified under
Atta Dal Scheme by
Punjab Government Difference
Percentage
BPL
Families Percentage
BPL
Families Percentage
1 2 3 4 5 6 7 8 (7-5)
1 Amritsar 410483 40325 10.51 97239 23.69 13.18
2 Bathinda 234627 23884 11.43 74452 31.73 20.30
3 Fatehgarh 96527 14598 15.63 27673 28.67 13.04
4 Faridkot 115684 8044 08.23 50077 43.29 35.06
5 Ferozepur 364568 53407 17.74 109908 30.15 12.41
6 Gurdaspur 429288 34341 09.38 128854 30.02 20.64
7 Hoshiarpur 295799 23082 08.25 83582 28.26 20.01
8 Jalandhar 360011 71870 19.74 99343 27.59 07.85
9 Kapurthala 143116 5765 04.22 39956 27.92 23.70
10 Ludhiana 545594 31351 05.61 131613 24.12 18.51
11 Mansa 141620 15715 12.98 40389 28.52 15.54
12 Moga 174778 18860 12.27 31879 18.24 05.97
13 Muktsar 184085 16848 12.44 65451 35.55 23.11
14 Nawanshehar 119446 5993 05.56 42782 35.82 30.26
15 Patiala 325053 38293 13.20 93789 28.85 15.65
16 Ropar 129542 8543 07.64 33592 25.93 18.29
17 Sangrur 291819 43591 16.97 82665 28.33 11.36
18 Mohali 140244 9044 06.86 35159 25.07 18.21
19 Barnala 92401 25809 28.05 29987 32.45 04.40
20 Taran Taran 164298 14474 09.18 48972 29.81 20.63
Total 4758983 503837 11.59 1347362 28.31 16.72
Source : Atta Dal Scheme 31/05/2007.x
POVERTY IN PUNJAB: A DISTRICT LEVEL STUDY
Evaluation of Poverty Alleviation Programmes 208
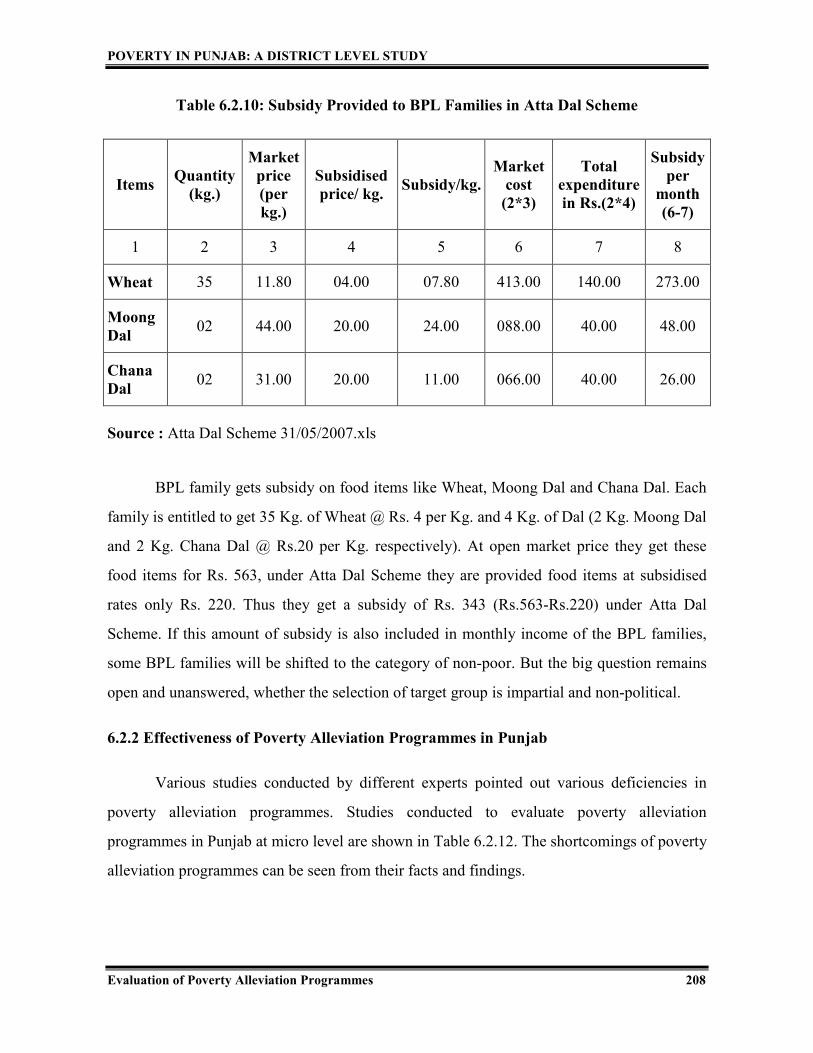
Table 6.2.10: Subsidy Provided to BPL Families in Atta Dal Scheme
Items Quantity
(kg.)
Market
price
(per
kg.)
Subsidised
price/ kg. Subsidy/kg.
Market
cost
(2*3)
Total
expenditure
in Rs.(2*4)
Subsidy
per
month
(6-7)
1 2 3 4 5 6 7 8
Wheat 35 11.80 04.00 07.80 413.00 140.00 273.00
Moong
Dal 02 44.00 20.00 24.00 088.00 40.00 48.00
Chana
Dal 02 31.00 20.00 11.00 066.00 40.00 26.00
Source : Atta Dal Scheme 31/05/2007.xls
BPL family gets subsidy on food items like Wheat, Moong Dal and Chana Dal. Each
family is entitled to get 35 Kg. of Wheat @ Rs. 4 per Kg. and 4 Kg. of Dal (2 Kg. Moong Dal
and 2 Kg. Chana Dal @ Rs.20 per Kg. respectively). At open market price they get these
food items for Rs. 563, under Atta Dal Scheme they are provided food items at subsidised
rates only Rs. 220. Thus they get a subsidy of Rs. 343 (Rs.563-Rs.220) under Atta Dal
Scheme. If this amount of subsidy is also included in monthly income of the BPL families,
some BPL families will be shifted to the category of non-poor. But the big question remains
open and unanswered, whether the selection of target group is impartial and non-political.
6.2.2 Effectiveness of Poverty Alleviation Programmes in Punjab
Various studies conducted by different experts pointed out various deficiencies in
poverty alleviation programmes. Studies conducted to evaluate poverty alleviation
programmes in Punjab at micro level are shown in Table 6.2.12. The shortcomings of poverty
alleviation programmes can be seen from their facts and findings.

POVERTY IN PUNJAB: A DISTRICT LEVEL STUDY
Evaluation of Poverty Alleviation Programmes 209
Table 6.2.11: Evaluation of Poverty Alleviation Programs in Punjab
Investigator Period District Programme Results
Navreet
Singh
1980-85 Bathinda He observed lack of political interest in the schemes.
He also noted that most of bank officials ask for
“cuts” before they sanction the loan. He also found
that many undeserving people had been issued yellow
cards simply because of corruption.
Chander 1984-87 Bathinda He was satisfied that some real poor have been
assisted but he suggested proper publicity of these
programmes.
Karan 1985-86 Sangrur He noticed that 90 per cent of the loans were
sanctioned for dairy purpose and there was misuse of
loans.
Sandhu 1985-86 Ropar He observed that the well-off persons had been issued
yellow cards. He concluded that the whole process is
fraud with misutilization, leakages, undue influences
etc.
Kalsi 1985-86 Ludhiana 55,117 families were identified as below poverty line
by the end of 1982-83 and out of them 22,489 families
benefitted from poverty alleviation programmes.
Sidhu 1985-86 Patiala He focused on defects of yellow cards and reported
the inclusion of many undeserving cases and
exclusion of deserving cases.
Khanna 1988-89 Patiala He found that there were 29 beneficiaries in district
Patiala, village Bhunerheri during 1988-89. “The
BDO’s office has also taken up construction of drains
and streets, latrines and planting of trees in the village,
it also helped out in the creation of other assets.”
Sarangal 1986-87 Amritsar He concluded that “people are not getting proper
benefits from the special programmes”. He found that
undeserving people get the benefit by influencing the
local Sarpanchs, whereas genuine people were
deprived of the benefit.

POVERTY IN PUNJAB: A DISTRICT LEVEL STUDY
Evaluation of Poverty Alleviation Programmes 210
Investigator Period District Programme Results
Mittal 1986-87 Ludhiana “A close study of the programme in district Ludhiana
reveals that its impact on the rural poor has not been
as good as was expected by planners”.
Reddy 1986-87 Hoshiarpur He found that identification of viable schemes has not
been done by administration. He strongly
recommended use of administrative efficiency and
more staff.
Chhatwal 1987-88 Ludhiana His finding has been that none of the beneficiaries
belonged to the poorest of the poor category. Most of
them were no doubt poor but many poorer than those
were left out.
Gupta 1989-90 Many yellow card holders are still waiting for IRDP
loans.
Shankar 1990-91 Amritsar He observed that all surveyed families had mis-
utilized loan amount taken under IRDP. He found
JRY is better as Panchayats use it for making drainage
system and street etc.
Tewari 1991-92 Sangrur JRY was not very helpful as it gives only seasonal
employment.
Vikram 1992-93 Poorest sections of the village i.e. the Harijan Basti
have remained untouched. These parts of the village
have neither proper streets nor drains and they
invariably get water logged and slushy during each
monsoon.
Source: Vora,R. (2000),”Government Programmes in Socio Economic Profile of Rural
India”, Concept Publishing Company, New Delhi.

POVERTY IN PUNJAB: A DISTRICT LEVEL STUDY
Evaluation of Poverty Alleviation Programmes 211
SECTION III
6.3 Empirical Analysis of Poverty Alleviation Programs
This section deals with empirical analysis of poverty alleviation programmes. Poverty
ratio is maximum in Kapurthala district of Doaba region. So, Kapurthala district was selected
for the purpose of survey. Kapurthala district has five blocks –Dhilwan, Kapurthala, Nadala,
Phagwara and Sultanpur and on the basis of highest number of BPL families, Phagwara block
has been selected. The selection of three villages was finalized after consultations with the
concerned Block Development Officer (BDO). Finally, 100 households from rural area were
surveyed. A structured schedule has been used for survey of beneficiaries of different
schemes. The samples were drawn from the beneficiaries’ list provided by the BDO and 100
households from Kapurthala district were surveyed for evaluation of poverty alleviation
programme. Both primary and secondary data were used to evaluate the performance of
poverty alleviation programmes. Secondary data was compiled from the Annual Progress
Reports maintained by the Department of Rural Development, Government of Punjab. For
primary data, out of the sampled 100 BPL households, we took 40 Swarozgaris of Self-help
groups (SGSY) from village Bhularai, 20 MNREGA workers and 10 beneficiaries of Indira
Awas Yojana (IAY) from village Mauli and 30 beneficiaries of Atta Dal Scheme from our
sample survey for poverty estimation.
6.3.1 Socio -Economic Condition of the Beneficiaries
Evaluation of poverty alleviation programmes is based on the feed back of 100
beneficiaries’ households. Out of them ninety per cent households were of scheduled caste
and 10 per cent were of non-scheduled castes. These 100 beneficiaries’ households surveyed
had 544 family members. Out of them, 290 were males and 254 were females. Further, as
regards the education level, it can be seen that out of 502 beneficiaries of +7 years age, 355
beneficiaries were literate and 147 were illiterate. Out of 355 literate people, 134 members
had educational background of primary, 108 members of middle, 69 members of matriculate,
and 42 members of senior secondary, and only 02 members of graduate and above level. In
short, 48.20 per cent had under matriculate qualification. It has been found that 45 per cent
beneficiaries had a family size of 1-5 members, 51 per cent had 6-10 members and 04 per

POVERTY IN PUNJAB: A DISTRICT LEVEL STUDY
Evaluation of Poverty Alleviation Programmes 212
cent had family size of 11 or more members. The family size affects the per capita income
negatively and dependency ratio positively. Table 6.3.1 also depicts the occupation structure
of these respondent beneficiaries. Five per cent beneficiaries were self-employed in non-
agriculture, 4 per cent self-employed in agriculture, 8 per cent were regular labour, 80 per
cent were casual labour and remaining 3 per cent were engaged in private jobs.
Table 6.3.1: Social Characteristics of Households Possessing BPL Card
S.No. Characteristics Number Percentage
1 Gender-wise Household Members
Male 290 53
Female 254 46
2 Caste of Household Head
Scheduled Caste (SC) 91 91
Non-Scheduled Caste (Non - SC) 09 09
3 Size of family
1-5 Members 244 45
6-10 Members 276 51
11 and above members 24 04
4 Literacy of Household Members
Literate 355 65
Illiterate 147 35
5 Literacy Level of Household Members
Primary 134 38.00
Middle 108 30.00
Matriculate 69 19.44
Senior Secondary 42 12.00
Graduate and Above 02 0.56
6 Occupation of Households
Self- employed in non agriculture 05 05
Self -employed in agriculture 04 04
Regular labour 08 08
Casual labour 80 80
Private jobs 03 03
Source: Author’s Calculations

POVERTY IN PUNJAB: A DISTRICT LEVEL STUDY
Evaluation of Poverty Alleviation Programmes 213
Table 6.3.2: Economic Characteristics of Household Possessing a BPL Card
S.No. Characteristics Number
1 Income
i) Below poverty line
Up to 300 04
300-500 23
ii) Above poverty line
500-750 35
750 and above 38
2 Type of house
Kutcha house 27
Semi-pucca house 30
Pucca house 43
3 No. of rooms
One room 27
Two room 54
Three room 15
Four room and more 04
4 Kitchen
Availability of separate kitchen 48
Non-availability of separate kitchen 52
5 Electricity and toilet
Availability of electricity and toilet 53
Non-availability of electricity and toilet 47
6 Tenure status
Own house 93
Rented house 07
7 Use of LPG 46
8 Household durables
Fan 91
Heater 01
Cooler 01
Television 78
Refrigerator 51
Microwave 00
Cycle 78
Scooter/Bike 06
Car 00
Sewing machine 59
Washing machine 02
Telephone 32
Source: Author’s Calculations
POVERTY IN PUNJAB: A DISTRICT LEVEL STUDY
Evaluation of Poverty Alleviation Programmes 214
The economic characteristics presented in Table 6.3.2 show that only 4 per cent
beneficiaries had MPCI of less than Rs. 300, about 23 per cent between Rs.300-500, nearly
35 per cent between Rs. 500-750 and remaining 38 per cent had MPCI above Rs. 750. Thus,
27 per cent beneficiaries had income below poverty line and remaining 73 per cent had
income above poverty line. Hence, it can be concluded that 73 per cent beneficiaries were not
eligible for availing the advantage of poverty alleviation programs on the base of their
income. Table 6.3.2 presents the percentage distribution of BPL card holders on the basis of
economic characteristics. With respect to housing characteristics, Table 6.3.2 reveals that 27
per cent, 30 per cent and 43 per cent households lived in kutcha, semi-pucca and pucca
houses respectively. Further, 27 per cent, 54 per cent, 15 per cent and 04 per cent respectively
have one room, two rooms, three rooms and four or more dwelling rooms.
It is apparent that 27 per cent households were living in kutcha houses, 27 per cent
had only one room, 52 per cent did not have separate kitchen and 47 per cent of the
respondent beneficiaries did not have electricity and toilet. Similar picture is depicted as far
as the possession of other durables is concerned.
The study also confirms that 43 per cent have pucca house, 46 per cent had assess to
LPG, 38 per cent had MPCI greater than Rs. 750, about 48 per cent families had separate
kitchen, 51 per cent families had refrigerator and also possessed BPL cards. It is estimated
that near about 48 per cent of BPL cards were provided to non-poor. This shows that a
substantial number of BPL card holders are from non- poor section of society. This is nothing
but misuse of BPL cards. However, poorest of the poor do not have the BPL card. The
implication is that the beneficiaries are selected not only from the poor group but also from
the non-poor group. Hence, we can conclude that the benefits of poverty alleviation
programmes are being siphoned off by the non-poor section of the society. Overall, the study
provides the evidence that the poverty alleviation programmes have failed to reach poorest of
the poor.
POVERTY IN PUNJAB: A DISTRICT LEVEL STUDY
Evaluation of Poverty Alleviation Programmes 215
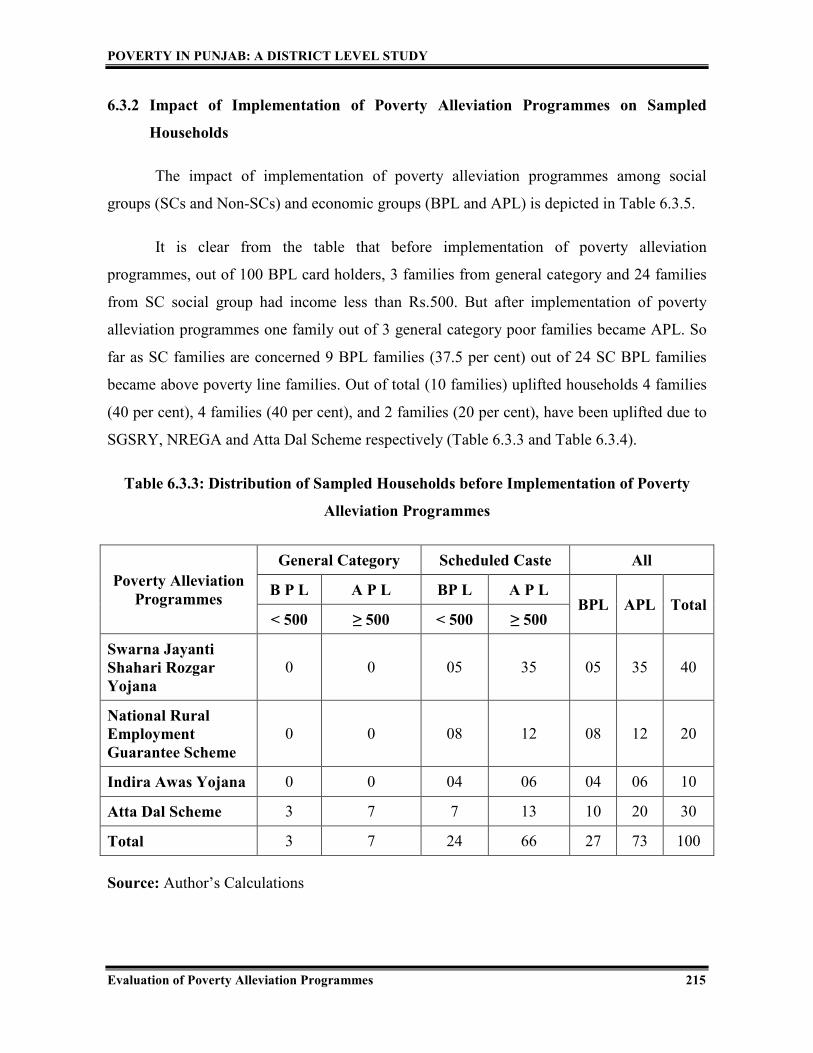
6.3.2 Impact of Implementation of Poverty Alleviation Programmes on Sampled
Households
The impact of implementation of poverty alleviation programmes among social
groups (SCs and Non-SCs) and economic groups (BPL and APL) is depicted in Table 6.3.5.
It is clear from the table that before implementation of poverty alleviation
programmes, out of 100 BPL card holders, 3 families from general category and 24 families
from SC social group had income less than Rs.500. But after implementation of poverty
alleviation programmes one family out of 3 general category poor families became APL. So
far as SC families are concerned 9 BPL families (37.5 per cent) out of 24 SC BPL families
became above poverty line families. Out of total (10 families) uplifted households 4 families
(40 per cent), 4 families (40 per cent), and 2 families (20 per cent), have been uplifted due to
SGSRY, NREGA and Atta Dal Scheme respectively (Table 6.3.3 and Table 6.3.4).
Table 6.3.3: Distribution of Sampled Households before Implementation of Poverty
Alleviation Programmes
Poverty Alleviation
Programmes
General Category Scheduled Caste All
B P L A P L BP L A P L BPL APL Total
< 500 ≥ 500 < 500 ≥ 500
Swarna Jayanti
Shahari Rozgar
Yojana
0 0 05 35 05 35 40
National Rural
Employment
Guarantee Scheme
0 0 08 12 08 12 20
Indira Awas Yojana 0 0 04 06 04 06 10
Atta Dal Scheme 3 7 7 13 10 20 30
Total 3 7 24 66 27 73 100
Source: Author’s Calculations

POVERTY IN PUNJAB: A DISTRICT LEVEL STUDY
Evaluation of Poverty Alleviation Programmes 216
Table 6.3.4: Distribution of Households after Implementation of Poverty Alleviation
Programmes
Poverty
Alleviation
Programs
General Category Scheduled Caste All
B P L A P L BP L A P L BPL APL Total
< 500 ≥ 500 < 500 ≥ 500
Swarna Jayanti
Shahari Rozgar
Yojana
0 0 01 39 01 39 40
National Rural
Employment
Guarantee
Scheme
0 0 04 16 04 16 20
Indira Awas
Yojana 0 0 04 06 04 06 10
Atta Dal Scheme 2 8 06 14 08 22 30
Total 2 8 15 75 17 83 100
Source: Author’s Calculations
Table 6.3.5: Percentage of Poor Before and After Implementation of Poverty Alleviation
Programmes
Particulars
General Category Scheduled Caste All
B P L A P L BP L A P L BPL APL
< 500 ≥ 500 < 500 ≥ 500
Household before
Implementation of
PAP Programs
3 7 24 66 27 73
Household after
Implementation of
PAP programs
2 8 15 75 17 83
Change -1 +1 -9 +9 -10 +10
Source: Author’s Calculations

POVERTY IN PUNJAB: A DISTRICT LEVEL STUDY
Evaluation of Poverty Alleviation Programmes 217
We find that the Atta Dal Scheme pushed 20 per cent below poverty line households
to above poverty line. In case this benefit is withdrawn, people will slip down again to their
previous status i.e. BPL. So, not only food subsidy but also some supplementary requirement
should be met in such a manner that they are able to raise their income by involving
themselves in self-help groups or working as individual swarozgaries. Micro-financing and
wage employment programmes like MNREGA make them self-dependent. How long one can
continue to depend entirely on poverty alleviation programmes? The poverty alleviation
programmes should act only as a pull factor. After providing help to some poor people the
support system of government should cover other poor groups i.e. once a poor should not
remain poor for always. Rather the uplifted people should act as a role model for the other
needy people. Once this system starts working the process of upliftment will go on and the
condition of poor will go on improving. This is the crux of study.
Table 6.3.6: Opinion of Respondents on Implementation of Poverty Alleviation
Programmes
Particulars
General Category Scheduled Caste
All BPL APL BPL APL
< 300 300-
500
500-
750 ≥750 < 300
300-
500
500-
750 ≥750
Beneficiary
households satisfied
with distribution of
benefits under PAP
- - - 4 - - - 34 38
Beneficiary
households satisfied
to some extent
- - 3 - - - 32 - 35
Beneficiary
households not
satisfied
0 3 - - 4 20 - - 27
Total households
holding BPL cards 0 3 3 4 4 20 32 34 100
Source: Author’s Calculations
Table 6.3.6 depicts the opinion of respondents on implementation of poverty
alleviation programmes. Out of 10 beneficiaries (BPL card holders) under general category

POVERTY IN PUNJAB: A DISTRICT LEVEL STUDY
Evaluation of Poverty Alleviation Programmes 218
only 3 families are from below poverty line income group and 7 are from APL income group
(3 household in income group Rs.500-750 and 4 households from ≥Rs.750). However,
among SC households, out of 90 beneficiary families (BPL card holders) 24 families are
below poverty line (4 household in income group < Rs.300 and 20 households from Rs.300-
500) and 66 families are from APL income group (32 household in income group Rs.500-750
and 34 households from ≥ Rs.750). On the basis of income group, we find that the
beneficiaries having less than Rs. 500 income are not satisfied with the benefits under various
poverty alleviation programs. Beneficiaries in the income group Rs.500-750 are satisfied to
some extent. Households with income ≥ Rs. 750 are satisfied with poverty alleviation
programmes. This is found applicable both for SC and non-SC category.
Table 6.3.7: Distribution of Households Regarding their Satisfaction Level for
Various Poverty Alleviation Programmes
Poverty Alleviation
Programs Satisfaction Level
Number Percentage
Swarna Jayanti Shahari
Rozgar Yojana
Satisfied 17 42.50
Satisfied to some extent 17 42.50
Not satisfied 6 15.00
Total 40 100
National Rural
Employment Guarantee
Programme
Satisfied 6 30.00
Satisfied to some extent 6 30.00
Not satisfied 8 40.00
Total 20 100
Indira Awas Yojana
Satisfied 5 50.00
Satisfied to some extent 2 20.00
Not satisfied 3 10.00
Total 10 100
Atta Dal Scheme
Satisfied 10 33.33
Satisfied to some extent 10 33.33
Not satisfied 10 33.33
Total 30 100 ,
Source: Author’s Calculations

POVERTY IN PUNJAB: A DISTRICT LEVEL STUDY
Evaluation of Poverty Alleviation Programmes 219
The results of our study indicates that of the 40 beneficiaries, 17 (42.50 per cent) of
Swarna Jayanti Shahari Rozgar Yojana were satisfied, 17 (42.50 per cent) satisfied to some
extent and 06 (15.00 per cent) were not satisfied with this programme, with regard to training
programme, amount of loans, repayment of installments and income generation.
Out of 20 beneficiaries of National Rural Employment Guarantee Scheme, only 06
(30.00 per cent) beneficiaries reported that they were satisfied with availability of input. They
also reported that their condition has improved. But 06 (30.00 per cent) beneficiaries reported
that they were satisfied to some extent. Remaining 08 (40.00 per cent) beneficiaries reported
that they were not at all satisfied due to inadequacy of input. They further reported that they
were not getting 100 days’ employment under this scheme. They alleged that employment
was provided to kith and kin of the authorities. Moreover, they were not satisfied with the
wage rate also. They suggested improvement in infrastructure for the success of scheme. It is
noteworthy that not even a single beneficiary reported that he/she was selected by giving
bribe.
Out of 10 beneficiaries of Indira Awas Yojana, 05 (50 per cent) responded that they
were satisfied; 02 (20 per cent) were satisfied to some extent; and the remaining only 03
(30.00 per cent) beneficiaries reported that they were not satisfied with the amount available.
Most of them were however thankful to Government for implementing such schemes.
However, out of 30 beneficiaries of Atta Dal schemes the percentage of satisfied,
satisfied to some extent and not satisfied is equal (33.33 per cent). The beneficiaries of Atta
dal scheme have suggested that there should be distribution of Atta and dal of better quality.
Besides, some beneficiaries of Atta dal scheme reported that delivery of Atta dal was not at
proper time. But 100 per cent beneficiaries agreed that the program had significantly
improved their income. They also remarked that Atta dal scheme had fulfilled their
nutritional need.
Under Swarna Jayanti Shahari Rozgar Yojana, formation of SHGs should not be
slow. It can be concluded that though adequate level of employment could not be provided to
them under MNREGA scheme yet it provided employment to a few and improved their
standard of living. It can be suggested that such employment oriented schemes for physical

POVERTY IN PUNJAB: A DISTRICT LEVEL STUDY
Evaluation of Poverty Alleviation Programmes 220
and mental work should be undertaken by the government, communities, clubs and NGOs on
a large scale. The fact is that it should cover more and more people.
We can clearly say that IAY, NREGA, SGSY and Atta Dal Scheme though have not
been working up to mark, yet the role of poverty alleviation programmes have been very
positive. Such programmes like micro financing, self-help groups and MNREGA not only
break vicious circle of poverty but also start the circle of prosperity and bring economic
transformation in rural area.
The problem of poverty can not be eradicated unless it is backed by fundamental
transformation. On the basis of the study, following measures are suggested to reduce
poverty. There should be transformation of education system so that there may be awareness
among people. There should be effective check on Panchayati Raj System also.
Transparency, accountability and honesty need to be applied in implementation of the
programmes. Besides, the implementation of programme should be time bound. At the same
time, there should be public awareness about various poverty alleviation programmes of the
Government. Authentic and reliable information about the poverty alleviation programmes
should be provided to the public.

POVERTY IN PUNJAB: A DISTRICT LEVEL STUDY
Evaluation of Poverty Alleviation Programmes 221
ENDNOTES
1 http://www.nagarnigamdehradun.com/acts/FINAL%5B1%5D-SJSRY-Web.pdf
2 http://www.nabard.org/microfinance/nabardsupport.asp
3 http://www.sbi.co.in/viewsection.jsp
4 http://www.sidbi.com/micro/aboutus.htm
5 http://megselfhelp.gov.in/workshop/02122006/Micro%20Finance%20 and % 20 Micro
6 http://hpkinnaur.nic.in/DRDA/drdaschemes.htm
7 http://nrega.nic.in/netnrega
8 http://nrega.nic.in/homestciti.asp
9 http://nrega.nic.in/homestciti.asp
10 http://nrega.nic.in/homestciti.asp
11 http://nrega.nic.in/WageRateRevision.pdf
12 http://www.business.standard.com
13 http://www.livemint.com2010/03/21205847
14 http://nrega.nic.in/NREGArpt_eng.pdf
15 http://bergarh.nic.in/prfl_drda_IAY.http