evaluation of major determinants in soil nutrients
TRANSCRIPT

International Journal of Agricultural
Science and Research (IJASR)
ISSN 2250-0057
Vol. 3, Issue 3, Aug 2013, 197-210
© TJPRC Pvt. Ltd.
EVALUATION OF MAJOR DETERMINANTS IN SOIL NUTRIENTS AMELIORATE FOR
PRODUCTION OF CANCER CHEMOPREVENTIVE AGENT CURCUMIN IN RHIZOMES
OF CURCUMA LONGA L.
AKHILESHWAR KUMAR SRIVASTAVA1, RAGHVENDRA RAMAN MISHRA
2, MALLIKA TEWARI
3,
HARI SHANKAR SHUKLA4 & BIJOY KRISHNA ROY
5
1,5Department of Botany, Banaras Hindu University, Varanasi, Uttar Pradesh, India
2,3,4Department of Surgical Oncology, Banaras Hindu University, Varanasi, Uttar Pradesh, India
ABSTRACT
The response to soil nutrients on the production of curcumin (cancer chemopreventive agent) in turmeric rhizomes
was studied. Four different sampling sites in northern-India with variable soil properties were selected. Curcumin
production in relation to soil physico-chemical properties was assessed. The variations in curcumin amount depended on
soil pH, level of nutrients (Ca, Cu, Fe, Mg, Zn, N, P, K), and organic C in soil. The curcumin amount in turmeric from
Varanasi district (9.03%) was highest followed by site at Darbhanga (6.04%), Mirzapur (4.47%), and Allahabad (4.43%).
The results revealed that curcumin content enhanced corresponding to the favourable pH (7.1) and high nutrient levels in
soil. Among the soil nutrients, N, K, and total NPK showed positive and significant correlation with curcumin production.
The level of N, K, and combined NPK in the soil were the major determinants of curcumin production.
KEYWORDS: Turmeric, Curcumin, Nutrients, HPLC, Physico-Chemical Properties of Soil, Correlation Coefficient
INTRODUCTION
India has been the great repository of medicinal plants since long (Chattopadhyay et al., 2004). Turmeric
(Curcuma longa) is broadly used in disciplines of Ayurveda, Unani and Siddha (Ammon et al., 1991; Eigner et al., 1999).
The plant belongs to family Zingiberaceae, and originally reported from South and East India and Indonesia.
Now-a-days, India is the largest turmeric producer, exporter, and consumer in the world (Kamble et al., 2011). Presently,
turmeric has been used in many countries as the most favourite spice (Ammon et al., 1991; Ishimine et al., 2004).
Nonetheless, curcumin and volatile oils in the rhizome have proved anti-inflammatory, antimutagen, anticancerous,
antibacterial, anti-oxidant, anti-fungal, antiparasitic, and detox properties (Ammon et al., 1991; Osawa et al., 1995). Some
other active ingredients of turmeric also enhance the function of liver and kidney, and reduce biliary, diabetic and hepatic
disorders (Ammon et al., 1991). Besides above, anticancerous properties of curcumin have been proven experimentally on
different cell lines and animals with different levels of carcinogenesis in skin, breast and gastrointestinal tracks (Rao et al.,
1995; Huang et al., 1994; Huang et al., 1998; Aggarwal et al., 2003).
Looking at spread of cancer and the implication of turmeric as the remedial measure, emphasis has been on high
production of turmeric. There is a lack of information on the agronomic aspects of turmeric production in general, and the
weather relationship in particular. The report on status of scientific agronomic practices for turmeric farming is also
meagre relative to other turmeric producing countries.
Many factors that play vital role in growth/development of turmeric rhizome and leaves are nutrition, cultivation
practices, genotype, and the environment factors (Gregory, 1988; Loomis and Amthor, 1999; Azam-Ali and Squire, 2002).
198 Akhileshwar Kumar Srivastava, Raghvendra Raman Mishra,
Mallika Tewari, Hari Shankar Shukla & Bijoy Krishna Roy
Besides above, growth yield and the quality of cultivars also depend on the soil type, and its nutrients levels (Oya, 1972;
Oya et al., 1977). Therefore, it seems imperative to look for the type of soil and the levels of nutrients for high yield
cultivars (Oya, 1972). Kandiannan et al. (2002) reported that plant requires an annual average rainfall (640 to 4200 mm)
and the annual mean temperature of 18.2 to 27.4 0C. However, the requirement of optimum temperature is in 25-35
0C
range for sprouting of turmeric rhizome. Although the luxuriant growth of turmeric occurs in shades, larger rhizomes are
produced in the open field exposed to sunlight (Ridley, 1912).
Many agronomists earlier employed correlation path and cluster analyses to study the soil type that favoured high
quality turmeric yield (Chenchaiah et al., 2002; Sarma et al., 2003; Nybe et al., 2008) based on the rhizome yield and soil
factors, but failed to explain the uptake of soil nutrients that favours plant growth/metabolism. Among the metabolites,
curcumin is the important one in turmeric rhizome, and its amount increased significantly under Fe deficiency, and it also,
reciprocates with the enhanced levels of soil organic acids (Dixit and Srivastava, 2000). Looking at the medicinal potential
and the numerous pharmaceutical aspects of curcumin, it seems imperative to increase its yield and also to develop the
desired turmeric traits.
In agricultural fields the elimination of soil micronutrients leads to soil deficiency in many countries. The
deficiency of iron is most common to calcareous or alkaline soils. The application of N, P, and K fertilisers at higher doses
also decreased the curcumin amount in rhizomes, but the graded dose of N, P, and K increased (Rao et al., 1975;
Mohanbabu and Muthuswamy, 1984; Ahmed et al., 1988; Meenakshi et al., 2001). Therefore, we attempted to study the
distribution pattern of soil micronutrients levels in North-India keeping in views the possible improvement of turmeric
cultivation, and also the curcumin contents.
Curcumin is easily extracted from the turmeric rhizome by the solvent extraction method, and its amount analysed
by using HPLC (Balashanmugan, 1991). The study was conducted to determine the rhizome curcumin content in relation
to soil organic and inorganic nutrients levels in soils from different locations of North-India.
MATERIAL AND METHODS
Study Site
The turmeric rhizomes were collected from four different locations at district of Varanasi, Allahabad, Mirzapur
(Uttar Pradesh) and Darbhanga (Bihar). All the locations display different geographical status and soils properties.
Varanasi is located in the eastern part of the state of Uttar Pradesh (82° 56’E - 83° 03’E longitude and 25° 14’N -
25° 23.5’N latitude) in the middle Ganges valley of north India. This site is enriched with the fertile gangetic alluvial soil.
Allahabad in the southern part of Uttar Pradesh state, (25°26′ N latitude and 81°50′ E, longitude), stands at the confluence
of the river Ganga and Yamuna with the intermediate alluvial soil. Mirzapur is located between 25.15°N latitude and
82.58°E longitude in the southern part of the state dominated by the Vindhyan alluvial soil. Darbhanga is located in the
north Bihar (26.17°N latitude and 85.9°E longitude) enriched with calcareous and alluvial soil.
Sample Collection
Soils samples are collected randomly at 5 locations of each site at 10 meter intervals from 0-10 cm depth and kept
separately. All the samples were brought to the laboratory and dried at 80 0C, and 100 g of the dried soil was sieved (mesh,
2 mm).
The turmeric rhizomes were collected from the agricultural field of each location, and dried at 50 0C (48 h) and
powdered by grinding for HPLC analysis.
Evaluation of Major Determinants in Soil Nutrients Ameliorate for Production of 199 Cancer Chemopreventive Agent Curcumin in Rhizomes of Curcuma longa L.
Determination of Soil pH
Soil pH was determined in the 1:1 soil-water mixture using the glass electrode (Peech, 1965).
Determination of Nutrients Concentration
Metal Analysis
Soil (1.0 gm) sample was placed in beaker and added with 7.0 ml ternary acid (HNO3:H2SO4:HClO4; 5:1:1), and
incubated (10-12 h). After digestion, the samples were diluted in 50 ml double distilled water and filtered. Metal
concentration in samples as analysed by Atomic Absorption Spectrophotometer (Perkin Elmer model 2380) against
standard metal solutions. Metal concentration is expressed in μg/g soil dry wt.
N, P, and K Analysis
The nutrients N, P, K, were determined separately for N by micro-Kjeldahl procedure (Peach and Tracey 1956), P
was measured after digestion with ternary acid (HNO3/H2SO4/HClO4; 10/1/4, V/V) and assayed by phosphomolybdic acid
blue assay (Jackson, 1958). K was determined by Flame photometer (Mediflame 127) following the method of Jackson
(1958).
Estimation of Organic Carbon
Soil organic carbon was determined by Walkley and Black’s rapid titration method (Jackson, 1958). Air-dried soil
sample (1.0 g) was taken in 500 ml Erlenmeyer flask and added with K2Cr2O7 (10 ml) and H2SO4 (20 ml). The mixture was
swirled until soil and reagents fully mixed. After 30 min, 200 ml of double distilled water was added. Organic carbon was
determined by titration with 0.5N FeSO4 solution containing 3-4 drops of O-phenapthroline as the indicator. Organic
carbon was calculated as:
Organic carbon = (Meq K2Cr2O7-Meq FeSO4) × 0.003 × 100 × f / weight of soil (gm)
Where f = 1.33
HPLC Analysis
The HPLC model, HP C-18 column (1250 × 4.6 mm), and Millipore (0.454 µm) membrane filter was used for
filtration. The injection system used 20 µl sample loop. The solvents (methanol and acetonitrile) were from Spectrochem
laboratories (Mumbai, India). Water for HPLC was purified by the Milli Q water purification (Synergy, Bangalore, India).
The curcumin standard was purchased from MP Biomedicals, LLC BP 50067, Illkirch, France.
Curcumin from turmeric powder was extracted solvent extraction method (ASTA, 1958). About 10 mg standard
curcumin sample was taken in 100 ml volumetric flask and diluted up to 10 ml by methanol and kept as stock. The extract
(2ml) was made up to 10 ml by adding of methanol. Similarly, 10 mg of each turmeric powder sample was put in 100 ml
volumetric flasks and added with 10 ml methanol. After filtration, the extract (2 ml) was transferred to the volumetric flask
and diluted to 10 ml with methanol.
For the separation and detection of the curcumin, a chromatographic system consisted Water (Malaysia) Model
2998 (USA), with the plus autosampler (USA). All the solvents were filtered using 0.45 μm membrane filter (Millipore,
USA) before injection in HPLC. The standard curcumin (20 µl) and other turmeric samples were subjected to HPLC
analysis. The separation and elution were performed by solvents (methanol 24.1%, acetonotrile 38.2% and deionised water
37.7%) as the mobile phase with the flow rate of 1 ml min-1
at 350C, and detected at 425 nm and chromatograms were
processed by Empower 2 software.
200 Akhileshwar Kumar Srivastava, Raghvendra Raman Mishra,
Mallika Tewari, Hari Shankar Shukla & Bijoy Krishna Roy
The concentration of curcumin in different samples was determined by comparing with the standard curcumin
(Figure 3). The amount of curcumin in different turmeric samples was calculated by using the following equation (Kamble
et al., 2011).
Cs = As × Cc × 100 / Ac
Where Cs = concentration of curcumin in turmeric sample (µg/ml) Cc = concentration of standard curcumin
(µg/ml), As = area of sample, AU/min and Ac = area of standard curcumin, AU/min. The amount of curcumin in turmeric
sample from each site was determined and expressed in percent values.
Statistical Analysis
Statistical analysis was performed using the SPSS version 16.0 software (IBM, USA), and the mean and standard
error analysed by T - test. Analysis of mean of replicate of each sample was performed to go for the accuracy and
comparing the results of all the sampling sites. The correlation of variable data was obtained to establish the possible
correlation between production of curcumin and soil physico-chemical properties.
RESULTS
Physicochemical Properties of Soil
Table 1 shows the physico-chemical characteristics of soils from different sites. The level of nutrients varied
among the samples but their levels in the soils from Varanasi favoured maximum curcumin production relative to other
sites, Darbhanga, Mirzapur, or Allahabad. The soils pH varied from 8.5-6.8 and was highest (8.5) in soils of Mirzapur and
the lowest pH (6.8) for Allahabad, followed by soils from Varanasi (pH, 7.1).
Soil Nutrients Content
The concentration of Zn was highest in soils of Allahabad, whereas the amount of Cu, Ca, and Mg was highest in
Darbhanga soils compared to other sites. Similarly, the maximum Fe concentration (65.80 µg/g) was found in soils of
Mirzapur. The Cu concentration (1.10 µg/g) was lowest in soils of Allahabad relative to soils of different location.
Distribution pattern level of Ca was 38.84 μg/g, 47.05 μg/g, 32.53 μg/g, and 35.64 μg/g in soils of Varanasi, Darbhanga,
Allahabad, and Mirzapur, respectively, and indicated that the element was maximum among the other metals in soils. In
comparison, Cu concentration was lowest in soils of all the sites.
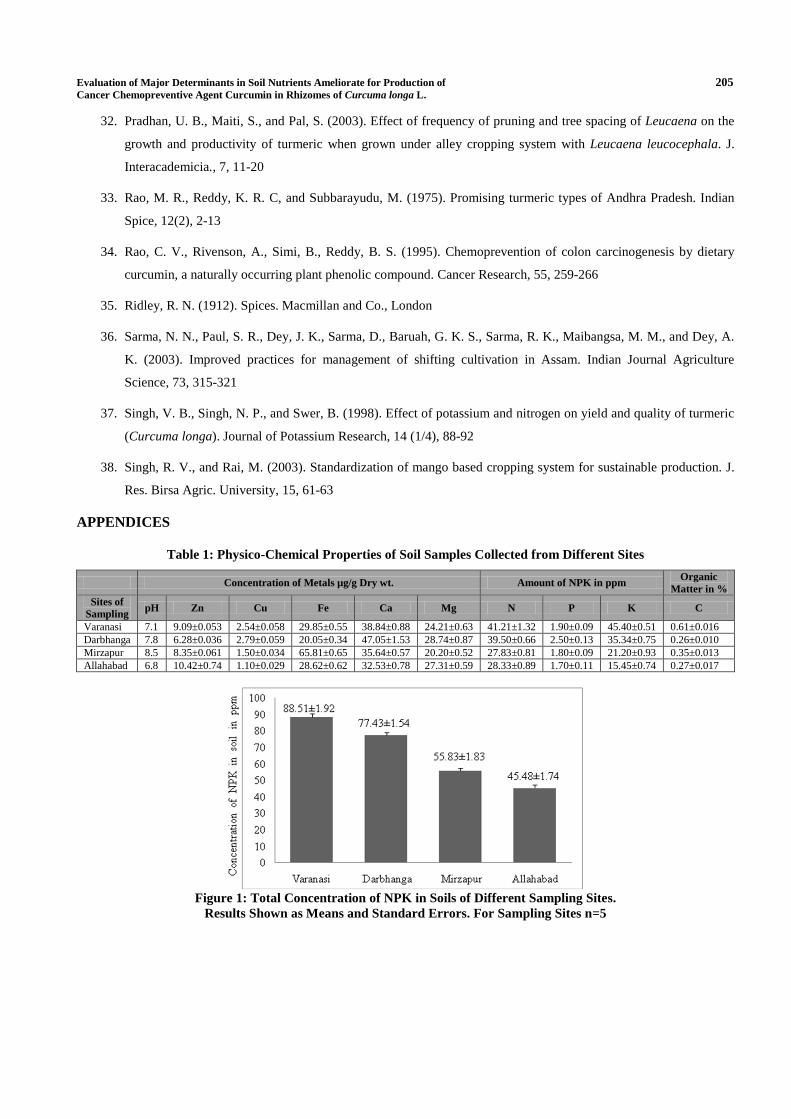
Level of NPK and Organic Carbon in Soil
The amount of N, P, and K varied among soils of the sampling site (Table 1). The highest amount of N (41.21
ppm) and K (45.40 ppm) was observed for soils of Varanasi whereas their amount as comparatively low in soils of other
sites. The amount of P was highest (2.50 ppm) in soils of Darbhanga, and the lowest (1.70 ppm) for Allahabad. For
agricultural practices, N, P, and K were used in combination, and hence the level of combined NPK was the highest (88.51
ppm) in soils of Varanasi followed by Darbhanga > Mirzapur > Allahabad in the decreasing order (Figure 1).
The highest C level (0.61%) was observed in soils of Varanasi, and the lowest (0.26%) for Darbhanga (Table 1).
Curcumin Content in Rhizomes
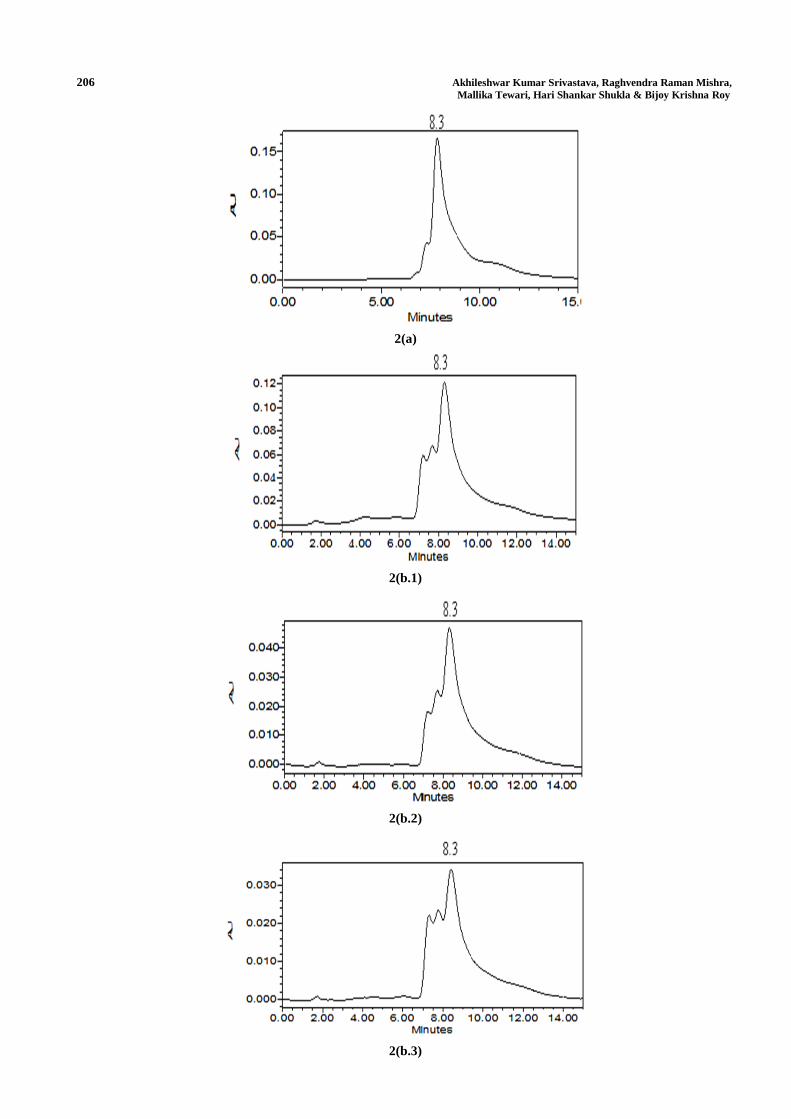
Figure 2 compares the chromatograms of standard curcumin (2a) and turmeric samples 2(b1-b4). The curcumin
was detected at 425 nm and compared with retention time (8.3 min) of the standard. The highest peak of curcumin was
observed in samples of Varanasi, followed by the smallest one in samples of Allahabad. The levels of curcumin in samples
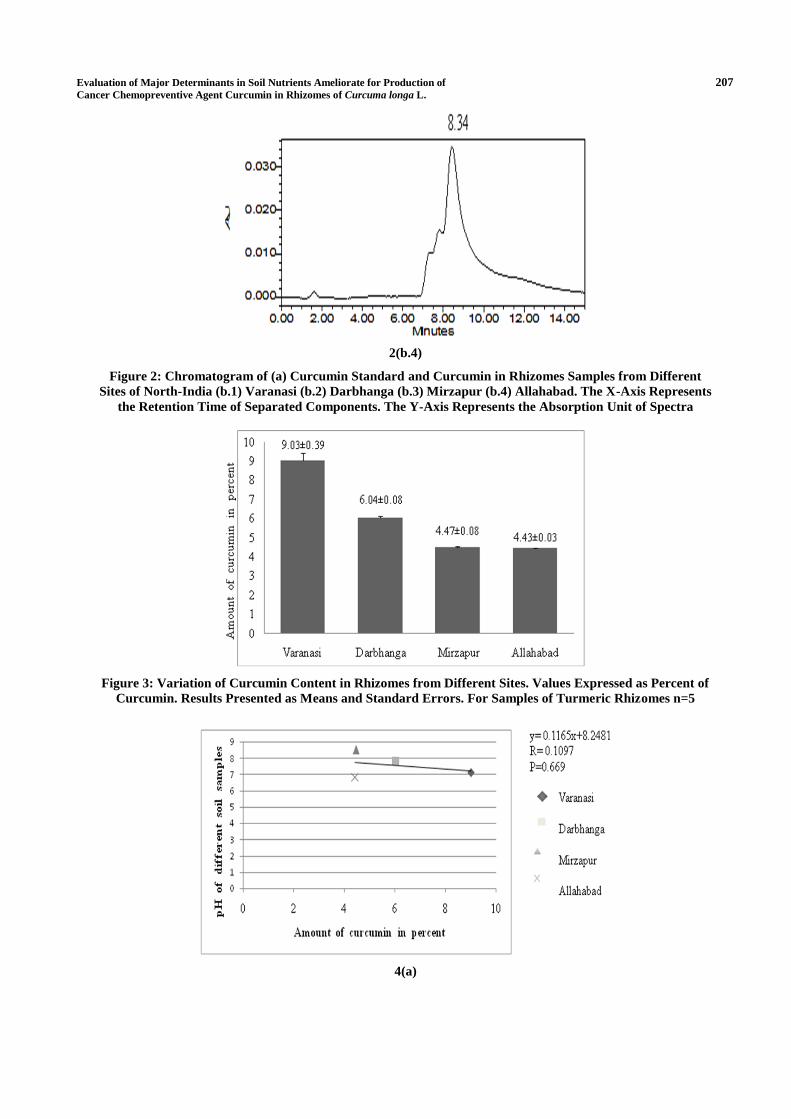
of Allahabad and Mirzapur were comparable. Figure 3 shows a graphical presentation of curcumin amount in turmeric
Evaluation of Major Determinants in Soil Nutrients Ameliorate for Production of 201 Cancer Chemopreventive Agent Curcumin in Rhizomes of Curcuma longa L.
rhizomes. Curcumin contents in samples varied among the rhizomes corresponding to each soil. The highest curcumin
content (9.03%) was from Varanasi, followed by 6.04% from Darbhanga, 4.47% from Mirzapur, and the lowest (4.43%)
from Allahabad, respectively.
The correlation coefficient was used to establish the correlation of curcumin production witrh pH and nutrient
contents in soils as shown [Figure 4(a-e)]. The amount of curcumin was positively correlated with N (R = 0.76) at P ˂
0.05, K (R = 0.89) at P ˂ 0.01, and NPK (R = 0.83) at P ˂ 0.05. The results revealed that curcumin content was
significantly correlated with the level of N, K and combined NPK,whereas rest of soil nutrients were not significant
relation
DISCUSSIONS
In agricultural practices, the correlation between the soil factors and rhizome yield and metabolites synthesis has
been established (Li et al., 1999). The elevated level of micronutrients in soils also play significant role(s) in increasing
curcumin production depending on the absorption, accumulation and their role in the metabolic processes. The knowledge
about the agronomical aspects of turmeric and curcumin production is almost lacking, except for a few reports on the
cultivation of turmeric (Ishamin et al., 2004; Hossain et al., 2005). The supply and absorption of elements needed for
growth and metabolism and their participation with the metabolite production, are closely related. Here, on the basis of our
findings the level of organic and inorganic elements in soils and their role in synthesis of curcumin in rhizome has been
ascertained. The data on the evaluation of the soil physico-chemicals properties (pH, inorganic, and organic elements) in
soils from different locations of North-India have been incorporated in Table 1.
The rhizome curcumin content at four different sites of North-India ranged from 4.43 to 9.03% (Figure 3). Such
variations could be attributed to the difference in the soil physico-chemical properties. The maximum curcumin content
(9.03%) was from Varanasi soils and the lowest (4.43%) from Allahabad. Such findings support the earlier report on
curcumin content in rhizomes of commercially produced turmeric where in the value ranged from 2 to 8% (Heath et al.,
2004). In a previous study, no direct correlation between rhizome growth and the level of micronutrients K, Ca, and Mg in
soils has been reported (Oya, 1972).
Effect of pH Soil on Curcumin Content
The pH levels also influence soil fertility in respect of growth and yield of different plants. Earlier, the pH of soil
(4.5-7.5) has been considered suitable for better growth as well as the enhancement of curcumin production in the turmeric
rhizome (Pradhan et al., 2003; Singh and Rai, 2003). Results incorporated in Table 1, indicate that soil pH varied from 6.8
at Allahabad to the maximum of 8.5 at Mirzapur. The curcumin amount in the rhizome ranged from maximum of 9.09% to
the minimum of 4.43% as shown in Figure 3. Here, it is of great concern that alkaline pH (8.5) at Mirzapur soil favoured
higher curcumin amount in comparison to samples from Allahabad. Although, the data in Figure 4(a) indicated the
correlation coefficient of soil pH (R = 0.109) at P ˃ 0.05 in relation to the curcumin content, it was not significantly related
indicating that not only the individual soil factor but also the soil pH, organic/inorganic elements were playing the
synergistic role(s) on curcumin production.
Relation of Soil Nutrients on Production of Curcumin
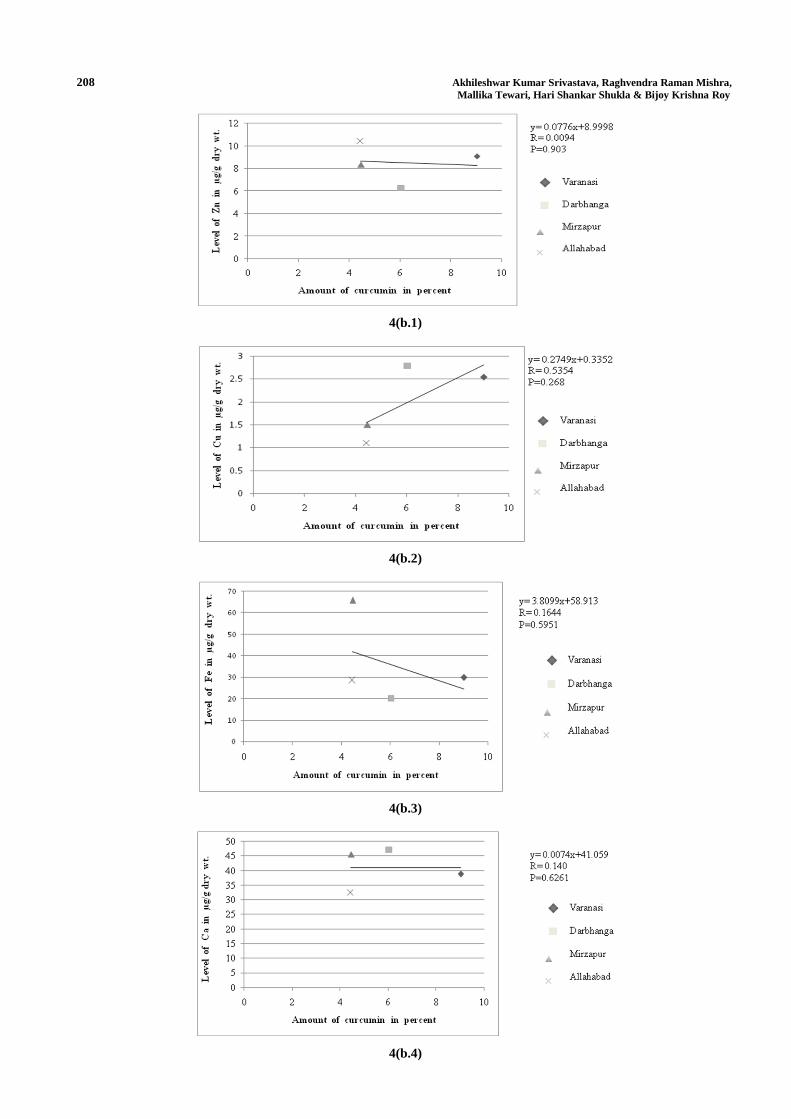
The soil metal concentration varied at different locations as shown in Table 1. It is evident that the amount of
curcumin in rhizomes enhanced with the certain level of particular element in the soil. The concentration of Ca was
dominant in soils of Varanasi, Darbhanga, while Fe was maximum (65.81 µg/g dry wt) for soils from Allahabad. The Ca
concentration decreased in the order: Darbhanga 47.05 > Varanasi 38.84 > Mirzapur 35.64 > Allahabad 32.53 µg/g dry wt
202 Akhileshwar Kumar Srivastava, Raghvendra Raman Mishra,
Mallika Tewari, Hari Shankar Shukla & Bijoy Krishna Roy
followed by Cu (Darbhanga 2.79 > Varanasi 2.54 > Mirzapur 1.50 > Allahabad 1.10 µg/g dry wt), respectively. According
to the present data, the range of curcumin amount can be arranged as: Varanasi 9.03 % > Darbhanga 6.04% > Mirzapur
4.47% > Allahabad 4.43%. Figure 4(b.1-b.5) showed correlation coefficient of soil metal concentration at P ˃ 0.05 with no
relationship with curcumin production. The result also indicated that single nutrient at dominant level in the soil, has no
positive role in enhancing the curcumin production. In the case of the Mirzapur iron-enriched soils, the amount of
curcumin was lower in comparison to Varanasi and Darbhanga, but higher than that of Allahabad. Figure 4(b.3) shows that
the correlation coefficient of Fe (R = 0.164) at P ˃ 0.05 in response to curcumin content contradicts the view of Dixit and
Srivastava (2000) on high curcumin production in the iron-deficient soils. Presently, the enrichment and deficient status of
individual metal in the soil did not count much in curcumin production.
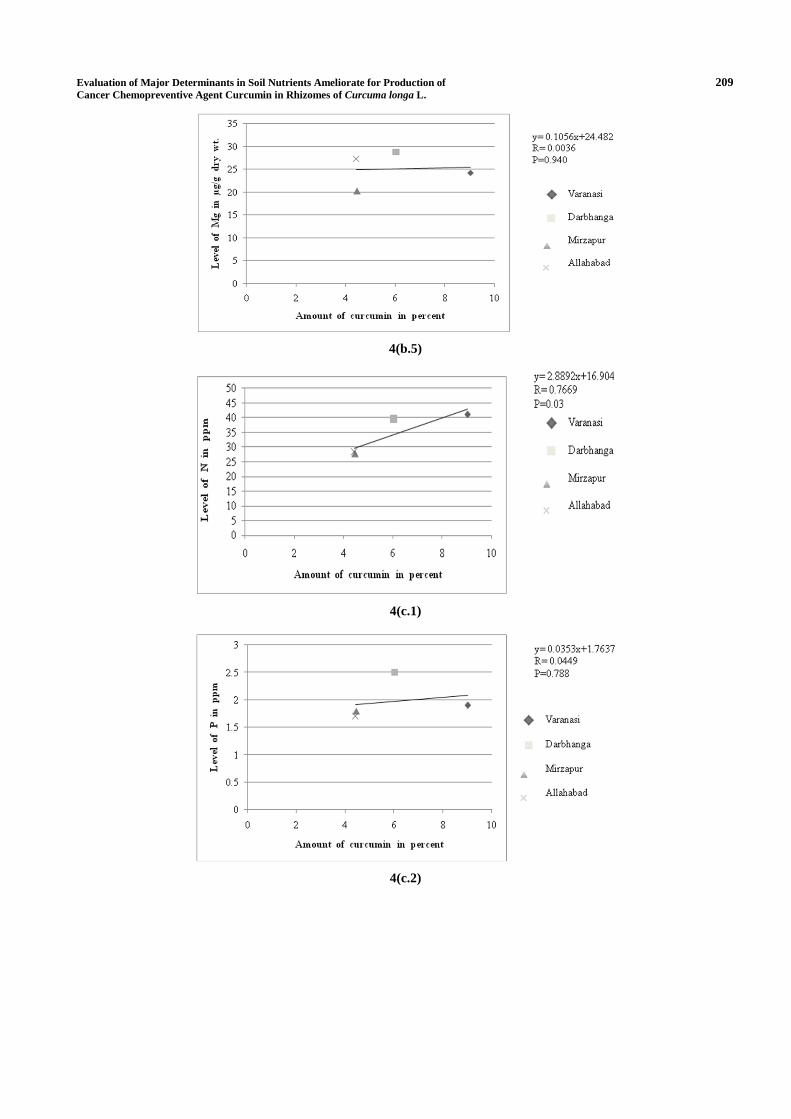
Impact of N, P, and K on Productivity of Curcumin
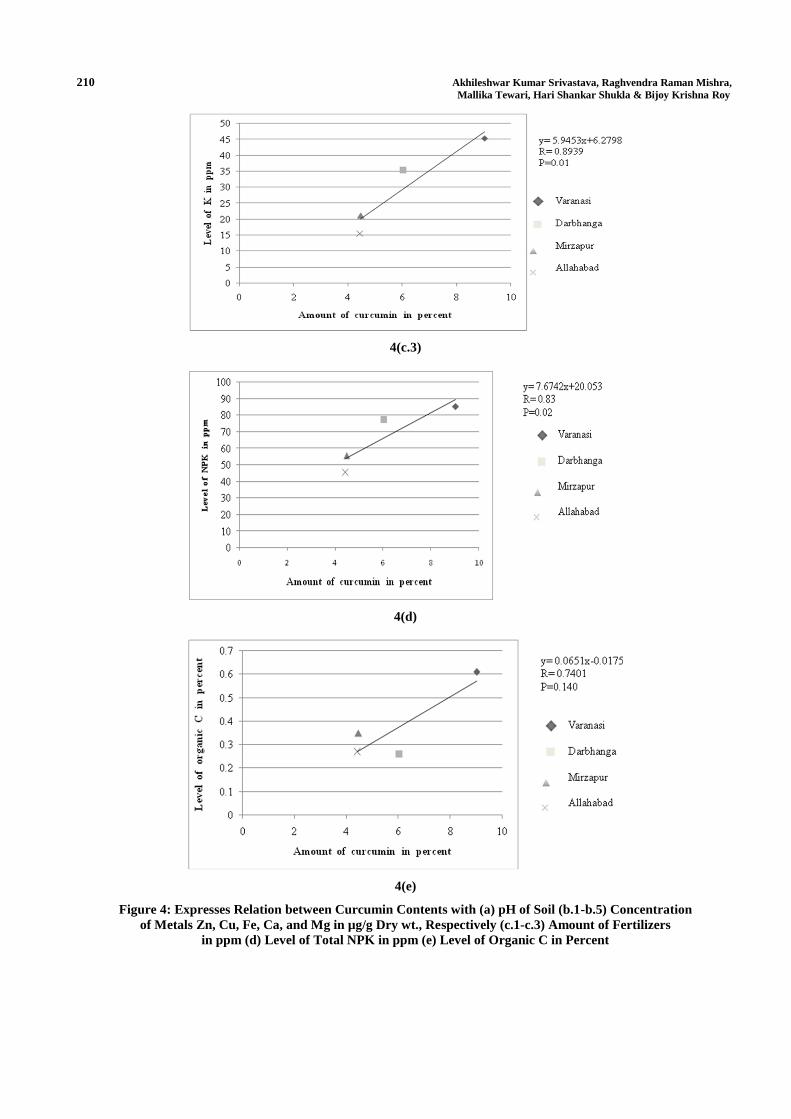
Figure 4(c.1 and c.3) showed the correlation coefficient for N (R = 0.767) at P ˂ 0.05 and K (R = 0.894) at P ˂
0.01 implying that these significantly influenced the curcumin contents, and supported the earlier finding (Hikaru et al.,
2007). Earlier, Singh et al., (1998) reported that increasing the level of K in soils had positive effect on growth of
rhizomes. In comparison, the values in Figure 4(c.3) also had high correlations with curcumin production. However, Figure
4(c.2) shows that insignificant correlation coefficient of fertilizer P (R = 0.0449) at P ˃ 0.05, and indicated that P
individually might not be playing significant role in curcumin production.
Effect of Total Combined NPK
In most parts of India, usually NPK are used as the fertilisers to improve crop growth/yield. The relation between
combined NPK level and curcumin production was correlated (coefficient correlation R = 0.83) at P ˂ 0.05), and expressed
in Figure 4(d) which is suggested that combined NPK levels in soils may be the suitable dose for enhancing the curcumin
amount. Highest amount of curcumin (9.03%) was from Varanasi, indicating that the combined action of NPK in
agricultural soils at suitable doses, was optimum. The present study showed that the combined NPK level and amount of
curcumin can be arranged as: Varanasi ˃ Darbhanga ˃ Mirzapur ˃ Allahabad (Figure 1 and 3).
Effect of Soil Organic Carbon on Curcumin Content
The level of organic carbon seems helpful in increasing the soil capacity to maintain the micronutrient availability
balance between soil and the plant and thus improving the crop quality. Lal (2004) also reported that quality micronutrients
enhanced biomass production through supply of higher amount of organic carbon. In present finding, the highest organic
carbon concentration (0.61%) could be the factor for retaining the nutrients in soils of Varanasi, and might have resulted in
the maximum curcumin production. However, findings on the lower concentration of organic carbon (0.26%) in soils of
Darbhanga and increased production of curcumin (6.04%) in comparison with other two sites at Mirzapur, and Allahabad
with 0.35% and 0.27% of organic carbon in soils (Table 1) and their correlation coefficient (R = 0.74) at P ˃ 0.05 in
relation to curcumin production was insignificant as shown in Figure 4(e) and contradicted this assumption. This could be
explained that other soil factors or the synergistic effects of organic and inorganic nutrients might be playing a role in
enhancing curcumin production.
CONCLUSIONS
It is concluded that curcumin production was dependent mainly on the distribution of fertilizers N, K, or its
combination (NPK) in addition to certain levels of soil nutrients. Curcumin production corresponding to different locations
of North-India indicated that level of K in soil was playing more significant role. However, N and the combined NPK level
Evaluation of Major Determinants in Soil Nutrients Ameliorate for Production of 203 Cancer Chemopreventive Agent Curcumin in Rhizomes of Curcuma longa L.
in soils at suitable doses, may also play a positive role in the enhancement of curcumin production. These findings could
also added to agronomic practices for future line of action.
ACKNOWLEDGEMENTS
Author would like to express their gratitude for financial support from University of Grant Commission and to
Department of Botany, Banaras Hindu University, India for providing the instrumental facility for detection of metals in
soil samples and chromatogram of curcumin in different sample of turmeric rhizomes.
REFERENCES
1. Aggarwal, B. B., Kumar, A., Bharti, A. C. (2003). Anticancer potential of curcumin: preclinical and clinical
studies. Anticancer Research, 23, 363-398
2. Ahmed, S. H., Vedamuthu, P. G. B., Abdul Khader, Md., and Prakasam, V. (1988). Influence of different levels
on potassium on yield and curcumin content of turmeric. In: Satyanarayana et al, (Eds.), Proc Nat Seminar on
Chillies, Ginger and Turmeric, p. 108-113
3. Ammon, H. P. T., Wahl, M. A. (1991). Pharmacology of Curcuma longa. Planta Medica, 57, 1-7
4. ASTA (1958). Official Analytical Methods; American spice Trade Association. Englewood cliff NJ, Method (18)
color power of turmeric
5. Azam-Ali, S. N., and Squire, G. R. (2002). Principles of Tropical Agronomy. CABI Publishing, CAB
International, Wallingford, Oxon, UK, p. 236
6. Balashanmugan, P. V. (1991). Processing and curing of turmeric. South Ind. Horticulture, 39, 214-216
7. Chattopadhyay, I., Kaushik, B., Uday, B., Ranajit, K. B. (2004). Turmeric and curcumin: Biological actions and
medicinal applications. Current Science, 87, 1
8. Chenchaiah, K. C., Biddappa, C. C., and Acharya G. C. (2002). Arecanut based high density multispecies
cropping system for North Bengal. Orissa Journal Horticulture, 30, 114-120
9. Dixit, D., Srivastava, N. K., (2000). Effect of iron deficiency stress on physiological and biochemical changes in
turmeric (Curcuma longa) genotypes. Journal of Medicinal and Aromatic Plant Science, 22, 652-658
10. Eigner, D., Scholz, D. (1999). Ferula asa-foetida and Curcuma longa in traditional medicinal treatment and diet
in Nepal. Journal of Ethnopharmacology, 67, 1-6
11. Gregory, P. J. (1988). Crop growth and development. In: Wild, A (Ed.). Russell’s Soil Conditions and Plant
Growth (Eleventh edition), pp. 31-68
12. Heath, D., Khwaja, F., Rock, C. L. (2004). Curcumin content of turmeric and curry powders. FASEB Journal
Abstract, 18, 114.1
13. Hikaru Akamine, Md. Amzad Hossain, Yukio Ishimine, Kenichi Yogi, Kazuo Hokama, Yukikazu Iraha and Yoko
Aniya (2007). Effect of Application of N, P, and K alone or in Combination on Growth, Yield, and Curcumin
Content of turmeric (Curcuma longa L.). Plant Production Science, 10(1), 151-154
14. Hossain, M. A., Ishamin, Y., Akamine, H., and Motomura, K. (2005). Effects of seed rhizome size on growth and
yield of turmeric (Curcuma longa L.). Plant Production Science 8, 86-94
204 Akhileshwar Kumar Srivastava, Raghvendra Raman Mishra,
Mallika Tewari, Hari Shankar Shukla & Bijoy Krishna Roy
15. Huang, M. T., Lou, Y. R., Ma, W., Newmark, H. L., Reuhl, K. R., Conney, A. H. (1994). Inhibitory effects of
dietary curcumin on forestomach, duodenal, and colon carcinogenesis in mice. Cancer Research, 54, 5841-5847
16. Huang, M. T., Smart, R. C., Wong, C. Q., Conney, A. H. (1998). Inhibitory effect of curcumin, chlorogenic acid,
caffeic acid, and ferulic acid on tumor promotion in mouse skin by 12-O-tetradecanoylphorbol-13-acetate. Cancer
Research, 48, 5941-5946
17. Ishimine, Y., Hossain, M. A., Motomura, K., Akamine, H., Hirayama, T. (2004). Effects of planting date on
emergence, growth and yield of turmeric (Curcuma longa L.) in Okinawa Prefecture, Southern Japan. Japan
Journal of Tropical Agriculture, 48, 10-16
18. Jackson, M. L. (1958). Soil chemical analysis. Asia Publishing House, Bomaby
19. Kamble, K. J., Ingale, V. M., Kaledhonkar, D. P. (2011). Comparative study of curcumin extraction from turmeric
varieties grown in Maharashtra. African Journal of Food Science, 5, 780-789
20. Kandiannan, K., Chandaragiri, K. K., Sankaran, N., Balasubramanian, T. N., and Kailasam, C. (2002). Crop-
weather model for turmeric yield forecasting for Coimbatore district, Tamil Nadu, India. Agriculture Forest
Meteorology, 112, 133-137
21. Lal, R. (2004). Soil carbon sequestration to mitigate climate change. Geoderma., 123, 1-22
22. Li, L., Song, H., Zhang, Y., and Fu, S. (1999). A study on fresh rhizome stimulation model and its application to
comprehensive agronomic measures for good quality and high yield of Curcuma longa L. Zhongg. Zhon. Yao Za
Zhi, 24, 654-657, 701
23. Loomis, R. S., and Amthor, J. S. (1999). Yield potential, plant assimilatory capacity, and metaboloic efficiencies.
Crop Science 39, 1584-1596
24. Meenakshi, N., Sulikeri, G. S., and Hegde, R. V. (2001). Effect of planting material and P & K nutrition on yield
and quality of turmeric. Karnataka Journal of Agriculture Science, 14, 197-198
25. Mohanbabu, N., and Muthuswamy, S. (1984). Influence of potassium on the quality of turmeric. South Indian
Horticulture, 32: 343-46
26. Nybe, E. V., Peter, K. V., and Raj, N. M. (2008). Integrated cropping in coconut involving spice crops. Indian
Coconut Journal, 34, 3-9
27. Osawa, T., Sugiyama, Y., Inayoshi, M., Kawakishi, S. (1995). Antioxidative activity of tetrahydrocurcuminoids.
Bioscience Biotechnology Biochemestry, 59, 1609-1612
28. Oya, K. (1972). Evaluation of potassium availability of four Michigan soils. Sci. Bull Coll. Agr. Univ. Ryukyus,
19, 123-257
29. Oya, K., Tokashiki, Y., Ishimine, Y. (1977). Effects of potassium fertilization on the yields of sweet potato
autumn crop grown on a calcareous soil of Okinawa. Sci. Bull Coll. Agr. Univ. Ryukyus, 24, 191-197
30. Peach, K., and Tracey, M. V. (1956). Modern Methods of Plant Analysis. Springer-Verlag. Berlin. Vol. I.
31. Peech, M. (1965). Soil pH by glass electrode pH meter. Method of Soil Analysis. Amr. Soc. Agronomy, 9, 914-
925
Evaluation of Major Determinants in Soil Nutrients Ameliorate for Production of 205 Cancer Chemopreventive Agent Curcumin in Rhizomes of Curcuma longa L.
32. Pradhan, U. B., Maiti, S., and Pal, S. (2003). Effect of frequency of pruning and tree spacing of Leucaena on the
growth and productivity of turmeric when grown under alley cropping system with Leucaena leucocephala. J.
Interacademicia., 7, 11-20
33. Rao, M. R., Reddy, K. R. C, and Subbarayudu, M. (1975). Promising turmeric types of Andhra Pradesh. Indian
Spice, 12(2), 2-13
34. Rao, C. V., Rivenson, A., Simi, B., Reddy, B. S. (1995). Chemoprevention of colon carcinogenesis by dietary
curcumin, a naturally occurring plant phenolic compound. Cancer Research, 55, 259-266
35. Ridley, R. N. (1912). Spices. Macmillan and Co., London
36. Sarma, N. N., Paul, S. R., Dey, J. K., Sarma, D., Baruah, G. K. S., Sarma, R. K., Maibangsa, M. M., and Dey, A.
K. (2003). Improved practices for management of shifting cultivation in Assam. Indian Journal Agriculture
Science, 73, 315-321
37. Singh, V. B., Singh, N. P., and Swer, B. (1998). Effect of potassium and nitrogen on yield and quality of turmeric
(Curcuma longa). Journal of Potassium Research, 14 (1/4), 88-92
38. Singh, R. V., and Rai, M. (2003). Standardization of mango based cropping system for sustainable production. J.
Res. Birsa Agric. University, 15, 61-63
APPENDICES
Table 1: Physico-Chemical Properties of Soil Samples Collected from Different Sites
Concentration of Metals µg/g Dry wt. Amount of NPK in ppm Organic
Matter in %
Sites of
Sampling pH Zn Cu Fe Ca Mg N P K C
Varanasi 7.1 9.09±0.053 2.54±0.058 29.85±0.55 38.84±0.88 24.21±0.63 41.21±1.32 1.90±0.09 45.40±0.51 0.61±0.016
Darbhanga 7.8 6.28±0.036 2.79±0.059 20.05±0.34 47.05±1.53 28.74±0.87 39.50±0.66 2.50±0.13 35.34±0.75 0.26±0.010
Mirzapur 8.5 8.35±0.061 1.50±0.034 65.81±0.65 35.64±0.57 20.20±0.52 27.83±0.81 1.80±0.09 21.20±0.93 0.35±0.013
Allahabad 6.8 10.42±0.74 1.10±0.029 28.62±0.62 32.53±0.78 27.31±0.59 28.33±0.89 1.70±0.11 15.45±0.74 0.27±0.017
Figure 1: Total Concentration of NPK in Soils of Different Sampling Sites.
Results Shown as Means and Standard Errors. For Sampling Sites n=5
206 Akhileshwar Kumar Srivastava, Raghvendra Raman Mishra,
Mallika Tewari, Hari Shankar Shukla & Bijoy Krishna Roy
2(a)
2(b.1)
2(b.2)
2(b.3)
Evaluation of Major Determinants in Soil Nutrients Ameliorate for Production of 207 Cancer Chemopreventive Agent Curcumin in Rhizomes of Curcuma longa L.
2(b.4)
Figure 2: Chromatogram of (a) Curcumin Standard and Curcumin in Rhizomes Samples from Different
Sites of North-India (b.1) Varanasi (b.2) Darbhanga (b.3) Mirzapur (b.4) Allahabad. The X-Axis Represents
the Retention Time of Separated Components. The Y-Axis Represents the Absorption Unit of Spectra
Figure 3: Variation of Curcumin Content in Rhizomes from Different Sites. Values Expressed as Percent of
Curcumin. Results Presented as Means and Standard Errors. For Samples of Turmeric Rhizomes n=5
4(a)
208 Akhileshwar Kumar Srivastava, Raghvendra Raman Mishra,
Mallika Tewari, Hari Shankar Shukla & Bijoy Krishna Roy
4(b.1)
4(b.2)
4(b.3)
4(b.4)
Evaluation of Major Determinants in Soil Nutrients Ameliorate for Production of 209 Cancer Chemopreventive Agent Curcumin in Rhizomes of Curcuma longa L.
4(b.5)
4(c.1)
4(c.2)
210 Akhileshwar Kumar Srivastava, Raghvendra Raman Mishra,
Mallika Tewari, Hari Shankar Shukla & Bijoy Krishna Roy
4(c.3)
4(d)
4(e)
Figure 4: Expresses Relation between Curcumin Contents with (a) pH of Soil (b.1-b.5) Concentration
of Metals Zn, Cu, Fe, Ca, and Mg in µg/g Dry wt., Respectively (c.1-c.3) Amount of Fertilizers
in ppm (d) Level of Total NPK in ppm (e) Level of Organic C in Percent