understanding soil nutrients - the university of vermont€¦ · understanding soil nutrients. ......
TRANSCRIPT
31
What will be covered in Session II:
A Closer Look at Soil Nutrients
LESSON 1: The Dirt on Soil
LESSON 2: The Nitrogen Cycle
LESSON 3: The Phosphorus Cycle
LESSON 4: The P-Index
Terms to Learn
• cation exchange capacity (CEC)
• nitrate-N
• ammonium-N
• phosphorus index (P-index)
Exercises
1. Calculating Nutrient Availability in Manure
2. P-Index Worksheet
3. Checklist
SESSION II. . .
Understanding Soil Nutrients
32 / Digging In
NMP starts with understanding what’s in your soil. Do you know what’s in yours? This
is the essence of nutrient management. Soil is a com-plex and intricate system.
LESSON II-1. . .The Dirt on Soil
A The real story of soil lies not in its looks, but in its characteristics. Soil has three types of characteristics: physical, chemical, and biological.
Physical
Some physical properties of soil can be seen with the eye or felt between thumb and finger. With the exception of texture, they are all subject to change caused by weather and management.
Color. Color can indicate soil conditions such as organic matter content, drainage conditions, degree of oxidation, and extent of weathering. Darker soils generally contain more organic matter than lighter colored soils.
Texture. Texture depends upon the amount of sand silt and clay particles present. A Covington soil is characterized as a clay and may contain around 65% clay, 30% silt, and 5% sand.
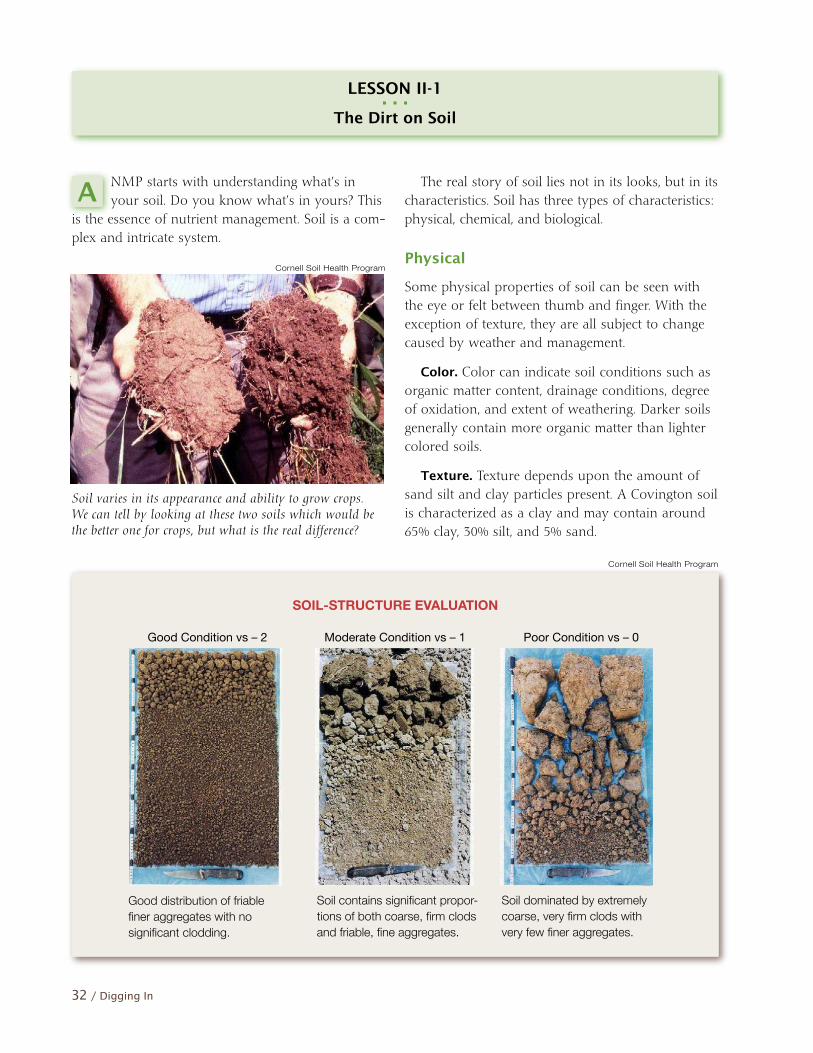
Soil varies in its appearance and ability to grow crops. We can tell by looking at these two soils which would be the better one for crops, but what is the real difference?
Cornell Soil Health Program
SOIL-STRUCTURE EVALUATION
Good distribution of friable finer aggregates with no significant clodding.
Good Condition vs – 2 Moderate Condition vs – 1 Poor Condition vs – 0
Soil contains significant propor-tions of both coarse, firm clods and friable, fine aggregates.
Soil dominated by extremely coarse, very firm clods with very few finer aggregates.
Cornell Soil Health Program

Understanding Soil Nutrients / 33
Structure. The size and arrangement of structural pieces called soil aggregates (the crumbs or chunks of soil) affect the amount and types of pores the soil has, and therefore strongly influence water and oxygen storage and movement through the soil.
Internal Drainage. Water drains below the root zone following saturating rains.
Depth. This is the distance from the surface to the layer that stops downward growth of plant roots (bedrock or extremely compact layer). Depth affects the capacity for water storage in a soil.
Susceptibility to Erosion. Susceptible soils gen-erally have a low amount of stable surface aggre-gates and/or are poorly drained and/or have high slopes. Soils that have lost part or all of their top-soil layer to erosion are harder to till and not as productive.
Chemical
Chemical properties of soil involve the management of soil nutrients at the most basic level.
pH. pH measures the relative acidity or alkalinity of a soil solution. This measurement is done on a scale from one to fourteen. At a pH of 7.0, the solu-tion is neutral. Less than 7.0 is acidic and greater than 7.0 is basic. The pH condition of the soil ranks among a number of environmental conditions that affect the quality of plant growth. Most agricul-
tural soils in Vermont are in the range of pH 5 to pH 7. The major impact of extremes in pH on plant growth is related to availability of plant nutrients. Most agronomic crops prefer soil pH between 6 and 7. However, some crops such as blueberries and cranberries prefer pH below 5. Because pH is expressed on a logarithmic scale, a difference of one pH unit is a tenfold difference in acidity.
Cation Exchange Capacity. Mineral nutrients within the soil have either a positive or negative charge. The nutrients with a positive charge (includ-ing calcium, magnesium, potassium, ammonium,
SOIL PH AND NUTRIENT AVAILABILITY
c) cations held by
organic chelate
b) cations held
on clay particle
Negatively charged organic matter (humus) and clay particles play an important role in retaining positively charged plant nutrients, or cations, in soils.
Building Better Soils for Better Crops
a) cations held
on humus
34 / Digging In
and sodium) are held by negatively charged clay particles and organic matter. Cation exchange capacity (CEC) refers to a soil’s ability to retain these nutrients (because organic matter and clays have negative charges), rather than having them leached away. The more clay and organic matter in a soil, at near neutral pH, the higher its CEC.
Nutrients. The soil supplies the following essen-tial nutrients for proper plant growth and produc-tion. These nutrients can originate from weathered minerals or from decomposing organic matter. Nutrients and their plant-available forms:
Primary Nutrients
Nitrate-N (NO3-)
Ammonium-N (NH4+)
Phosphorus (H2PO4- and HPO4
2-) Potassium (K+)
Secondary Nutrients Calcium (Ca2+) Magnesium (Mg2+) Sulfur (SO4
2-)
Micronutrients
Iron (Fe3+) Manganese (Mn2+) Boron (Bo3
2–) Molybdenum (MoO4
2–) Copper (Cu2+) Zinc (Zn2+) Chlorine (Cl–) Nickel (Ni2+) Cobalt (Co2+)
The primary nutrients are used in the greatest amount by the plant, and are the ones you are most concerned about when creating the NMP.
• Nitrogen is part of the chlorophyll molecule. Plants also require nitrogen in order to produce amino acids for building proteins. When deficient in nitrogen, plants become stunted and yellow coloring appears in older leaves.
• Phosphorus is important in developing healthy root systems, normal seed development, uniform crop maturation, photosynthesis, respiration, cell
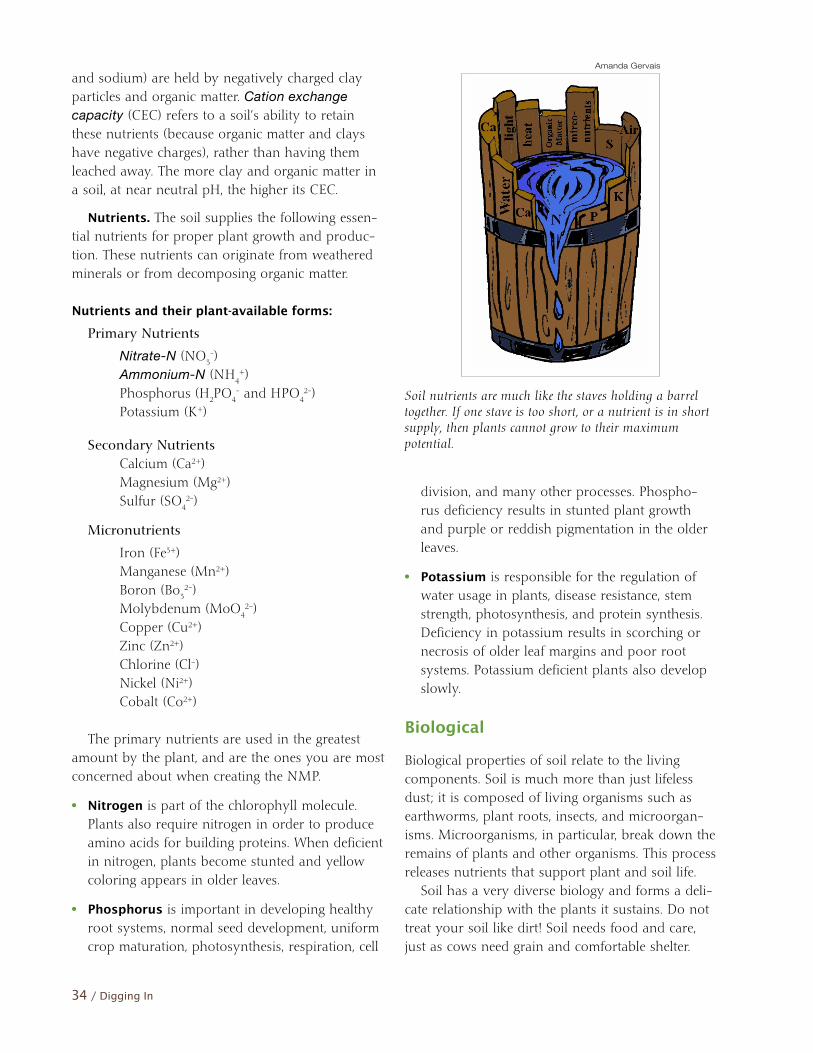
Soil nutrients are much like the staves holding a barrel together. If one stave is too short, or a nutrient is in short supply, then plants cannot grow to their maximum potential.
division, and many other processes. Phospho-rus deficiency results in stunted plant growth and purple or reddish pigmentation in the older leaves.
• Potassium is responsible for the regulation of water usage in plants, disease resistance, stem strength, photosynthesis, and protein synthesis. Deficiency in potassium results in scorching or necrosis of older leaf margins and poor root systems. Potassium deficient plants also develop slowly.
Biological
Biological properties of soil relate to the living components. Soil is much more than just lifeless dust; it is composed of living organisms such as earthworms, plant roots, insects, and microorgan-isms. Microorganisms, in particular, break down the remains of plants and other organisms. This process releases nutrients that support plant and soil life. Soil has a very diverse biology and forms a deli-cate relationship with the plants it sustains. Do not treat your soil like dirt! Soil needs food and care, just as cows need grain and comfortable shelter.
Amanda Gervais
Understanding Soil Nutrients / 35
The Plant and Soil Ecosystem
Plants depend on soil for air, water, nutrients, and mechanical support. In order to accomplish this, a soil should be maintained in as healthy a condition as possible.
Keep in mind that soil fertility is a delicate bal-ance of the physical, biological, and chemical properties. To maintain a healthy balance of these properties you should try to create a soil that has the following characteristics:
• Good water infiltration and storage• Good soil tilth • Low rates of erosion• Good levels of organic matter • Contains a high level of biological diversity • The proper pH for the crops you’re
growing• All the essential nutrients in reasonable propor-
tion to crop needs
We will be looking more closely at farming prac-tices that help you maintain a balance of nutrients. The first step in maintaining healthy soil is knowing how much of each nutrient it contains, and how those nutrients behave in the soil.
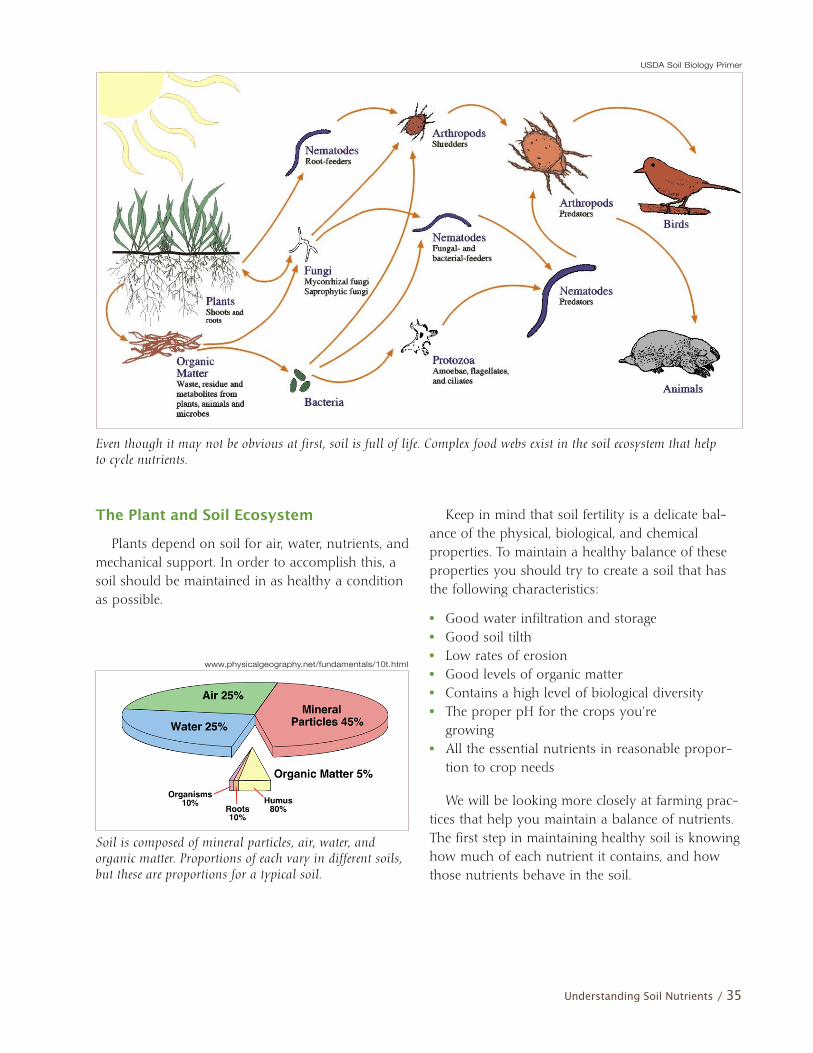
Even though it may not be obvious at first, soil is full of life. Complex food webs exist in the soil ecosystem that help to cycle nutrients.
Soil is composed of mineral particles, air, water, and organic matter. Proportions of each vary in different soils, but these are proportions for a typical soil.
www.physicalgeography.net/fundamentals/10t.html
USDA Soil Biology Primer
36 / Digging In
good balance of nutrients begins with the big three: nitrogen (N), phosphorus (P), and
potassium (K). Let’s get started with nitrogen.
Forms of Nitrogen in the Soil
There are several types of nitrogen in the soil:
Organic Nitrogen. Organic matter contains car-bon. Aside from mineral forms such as calcium carbonate (lime), anything with carbon is either liv-ing or was once living. For instance, a field of grass plowed into the soil is considered organic fertilizer because it was once a living organism. Any nitro-gen bound to the carbon in the dead grass would be considered, by association, organic nitrogen. This kind of nitrogen is not readily available to the plants. It takes microbes to break down the organic matter into inorganic-N forms that plants can use.
Inorganic Nitrogen. Inorganic or mineral nitro-gen is present in the soil in many forms:
• Nitrate-N (NO3–). Plants prefer this type of nitro-
gen, and almost all N taken up by plants is in this form.
• Ammonium-N (NH4+). This is the first form of
N produced when soil microorganisms convert organic N into mineral N. Usually it is rapidly changed into nitrate.
• Nitrogen Gas (N2) This is the type of nitrogen
in the air and is the most abundant form in the world (the air you breathe is 78% N2). The only plants that can extract N from the air are legumes (such as clover, alfalfa, and birdsfoot trefoil). If you plant legumes, you can make your own nitrogen!
• Nitric and Nitrous Oxides (NO and N2O). These
are forms of nitrogen that are not utilized by plants but can be utilized by some microbes.
LESSON II-2. . .The Nitrogen Cycle
A
If you give a legume a lot of fertilizer it can become lazy. It will start to take N almost exclusively from the fertilizer.
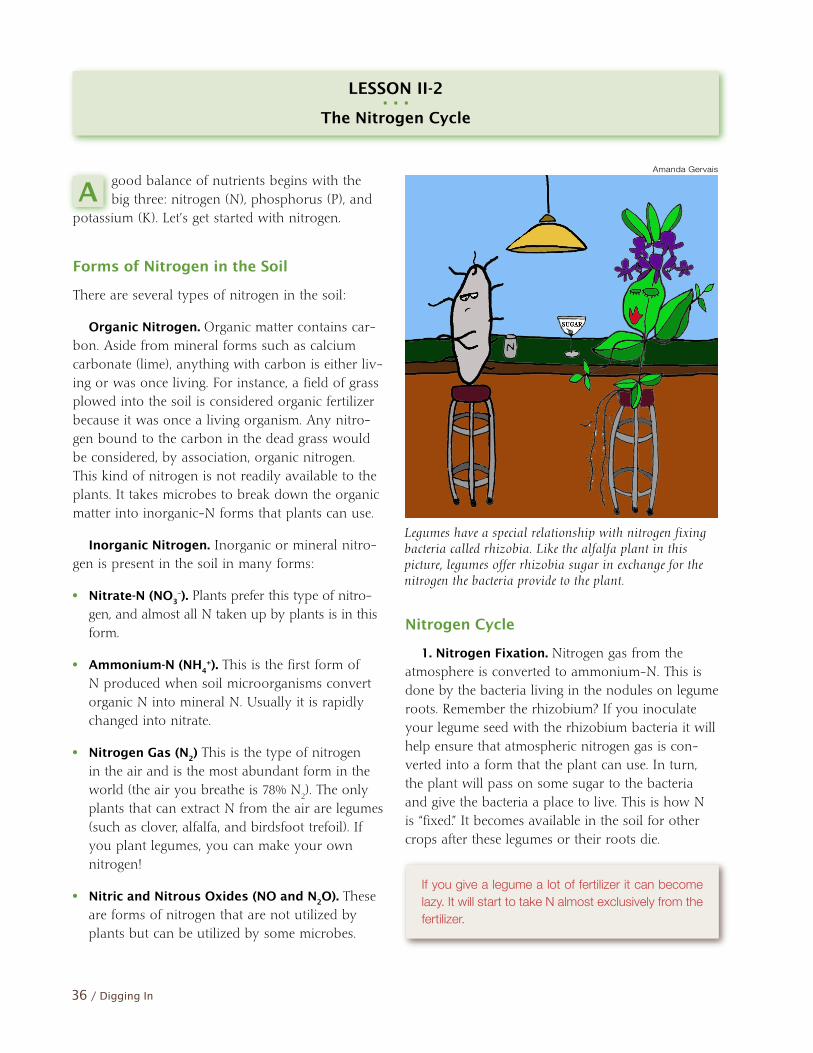
Legumes have a special relationship with nitrogen fixing bacteria called rhizobia. Like the alfalfa plant in this picture, legumes offer rhizobia sugar in exchange for the nitrogen the bacteria provide to the plant.
Nitrogen Cycle
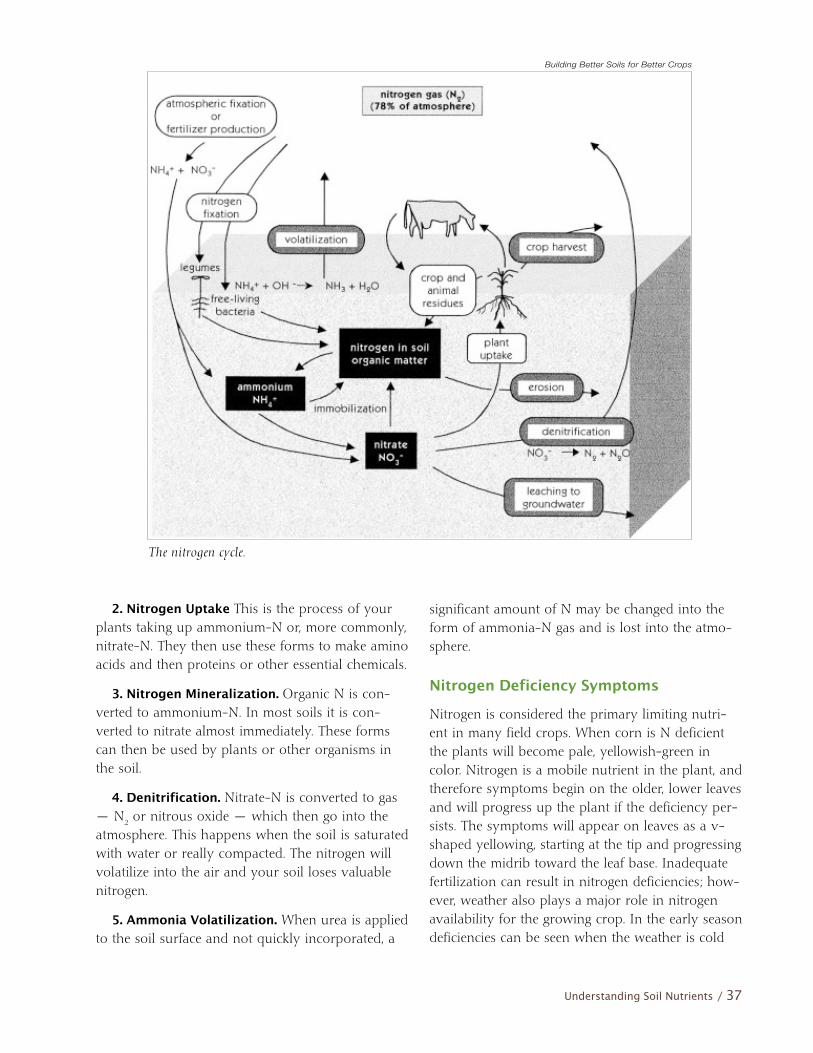
1. Nitrogen Fixation. Nitrogen gas from the atmosphere is converted to ammonium-N. This is done by the bacteria living in the nodules on legume roots. Remember the rhizobium? If you inoculate your legume seed with the rhizobium bacteria it will help ensure that atmospheric nitrogen gas is con-verted into a form that the plant can use. In turn, the plant will pass on some sugar to the bacteria and give the bacteria a place to live. This is how N is “fixed.” It becomes available in the soil for other crops after these legumes or their roots die.
Amanda Gervais
Understanding Soil Nutrients / 37
2. Nitrogen Uptake This is the process of your plants taking up ammonium-N or, more commonly, nitrate-N. They then use these forms to make amino acids and then proteins or other essential chemicals.
3. Nitrogen Mineralization. Organic N is con-verted to ammonium-N. In most soils it is con-verted to nitrate almost immediately. These forms can then be used by plants or other organisms in the soil.
4. Denitrification. Nitrate-N is converted to gas — N2 or nitrous oxide — which then go into the atmosphere. This happens when the soil is saturated with water or really compacted. The nitrogen will volatilize into the air and your soil loses valuable nitrogen.
5. Ammonia Volatilization. When urea is applied to the soil surface and not quickly incorporated, a
significant amount of N may be changed into the form of ammonia-N gas and is lost into the atmo-sphere.
Nitrogen Deficiency Symptoms
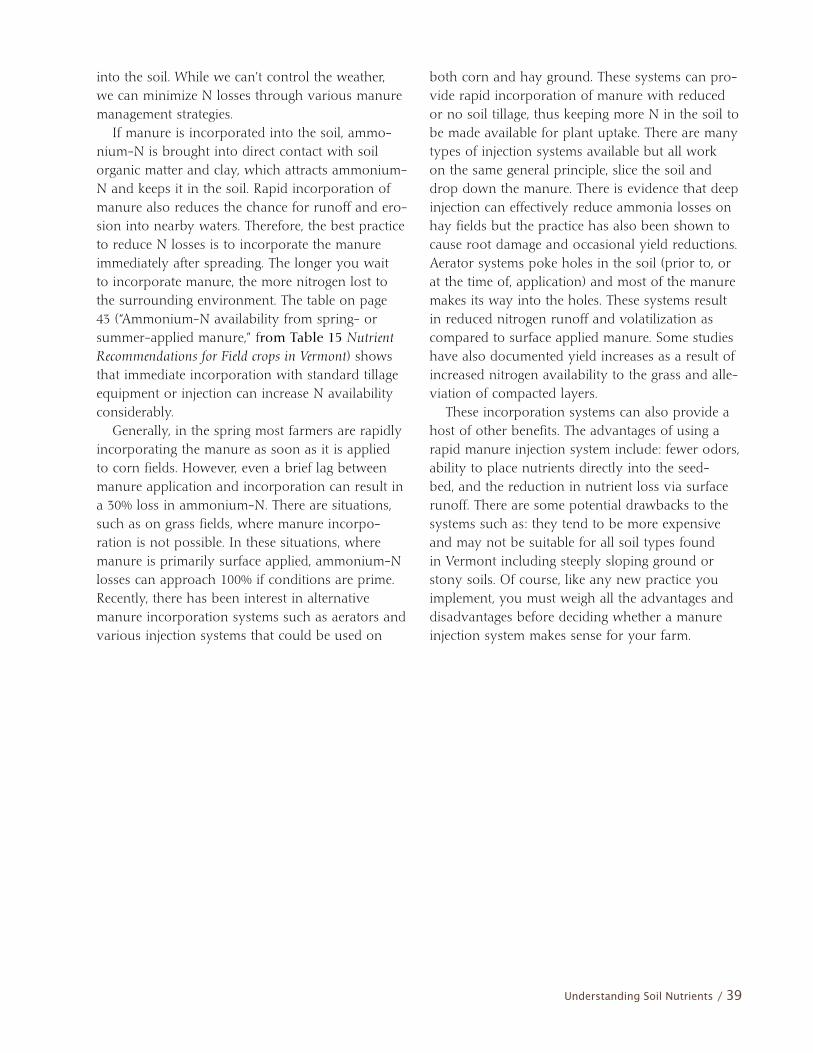
Nitrogen is considered the primary limiting nutri-ent in many field crops. When corn is N deficient the plants will become pale, yellowish-green in color. Nitrogen is a mobile nutrient in the plant, and therefore symptoms begin on the older, lower leaves and will progress up the plant if the deficiency per-sists. The symptoms will appear on leaves as a v-shaped yellowing, starting at the tip and progressing down the midrib toward the leaf base. Inadequate fertilization can result in nitrogen deficiencies; how-ever, weather also plays a major role in nitrogen availability for the growing crop. In the early season deficiencies can be seen when the weather is cold
The nitrogen cycle.
Building Better Soils for Better Crops
38 / Digging In
and the soils are saturated with water. During the mid-season dry soil conditions can result in nitro-gen deficiencies. Heavy rainfall during the growing season can result in nitrogen leaching and hence inadequate nitrogen for the crops. Other factors such as flooding can also result in nitrogen losses.
Don’t Treat Your Soil Like Dirt
The nitrogen cycle is almost entirely biological (controlled by soil organisms), so it is important to maintain the soil biology that drives it. If there is no soil biology then there are no soil organisms, which means your soil is dead. If your soil is dead, then there will be no nitrogen cycle no matter how much fertilizer you use. You must think of your soil as “livestock” that needs to be “fed.” Producing a healthy, biologically active soil is the key to having enough nitrogen for crops.
Nitrogen and the Environment
The excessive application or misapplication of nitrogen can have a negative impact on the envi-ronment. Nitrogen can be lost to the environment in the following ways:
Leaching. Nitrate-N can leach easily as excess rainwater moves through soil to groundwater. It
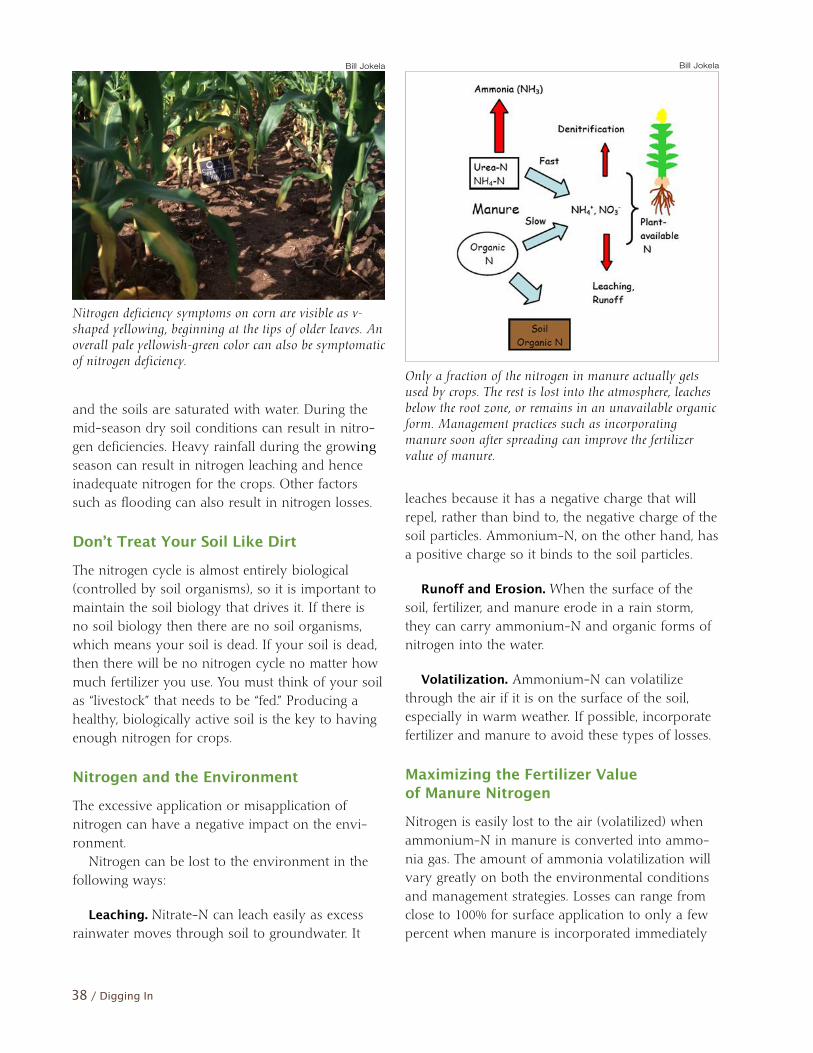
Only a fraction of the nitrogen in manure actually gets used by crops. The rest is lost into the atmosphere, leaches below the root zone, or remains in an unavailable organic form. Management practices such as incorporating manure soon after spreading can improve the fertilizer value of manure.
leaches because it has a negative charge that will repel, rather than bind to, the negative charge of the soil particles. Ammonium-N, on the other hand, has a positive charge so it binds to the soil particles.
Runoff and Erosion. When the surface of the soil, fertilizer, and manure erode in a rain storm, they can carry ammonium-N and organic forms of nitrogen into the water.
Volatilization. Ammonium-N can volatilize through the air if it is on the surface of the soil, especially in warm weather. If possible, incorporate fertilizer and manure to avoid these types of losses.
Maximizing the Fertilizer Value of Manure Nitrogen
Nitrogen is easily lost to the air (volatilized) when ammonium-N in manure is converted into ammo-nia gas. The amount of ammonia volatilization will vary greatly on both the environmental conditions and management strategies. Losses can range from close to 100% for surface application to only a few percent when manure is incorporated immediately
Nitrogen deficiency symptoms on corn are visible as v-shaped yellowing, beginning at the tips of older leaves. An overall pale yellowish-green color can also be symptomatic of nitrogen deficiency.
Bill Jokela Bill Jokela
Understanding Soil Nutrients / 39
into the soil. While we can’t control the weather, we can minimize N losses through various manure management strategies. If manure is incorporated into the soil, ammo-nium-N is brought into direct contact with soil organic matter and clay, which attracts ammonium-N and keeps it in the soil. Rapid incorporation of manure also reduces the chance for runoff and ero-sion into nearby waters. Therefore, the best practice to reduce N losses is to incorporate the manure immediately after spreading. The longer you wait to incorporate manure, the more nitrogen lost to the surrounding environment. The table on page 43 (“Ammonium-N availability from spring- or summer-applied manure,” from Table 15 Nutrient Recommendations for Field crops in Vermont) shows that immediate incorporation with standard tillage equipment or injection can increase N availability considerably. Generally, in the spring most farmers are rapidly incorporating the manure as soon as it is applied to corn fields. However, even a brief lag between manure application and incorporation can result in a 30% loss in ammonium-N. There are situations, such as on grass fields, where manure incorpo-ration is not possible. In these situations, where manure is primarily surface applied, ammonium-N losses can approach 100% if conditions are prime. Recently, there has been interest in alternative manure incorporation systems such as aerators and various injection systems that could be used on
both corn and hay ground. These systems can pro-vide rapid incorporation of manure with reduced or no soil tillage, thus keeping more N in the soil to be made available for plant uptake. There are many types of injection systems available but all work on the same general principle, slice the soil and drop down the manure. There is evidence that deep injection can effectively reduce ammonia losses on hay fields but the practice has also been shown to cause root damage and occasional yield reductions. Aerator systems poke holes in the soil (prior to, or at the time of, application) and most of the manure makes its way into the holes. These systems result in reduced nitrogen runoff and volatilization as compared to surface applied manure. Some studies have also documented yield increases as a result of increased nitrogen availability to the grass and alle-viation of compacted layers. These incorporation systems can also provide a host of other benefits. The advantages of using a rapid manure injection system include: fewer odors, ability to place nutrients directly into the seed-bed, and the reduction in nutrient loss via surface runoff. There are some potential drawbacks to the systems such as: they tend to be more expensive and may not be suitable for all soil types found in Vermont including steeply sloping ground or stony soils. Of course, like any new practice you implement, you must weigh all the advantages and disadvantages before deciding whether a manure injection system makes sense for your farm.
40 / Digging In
hat’s in your manure? Before starting this class, you should have submit-ted a manure sample for nutrient analysis at a testing lab. For informa-
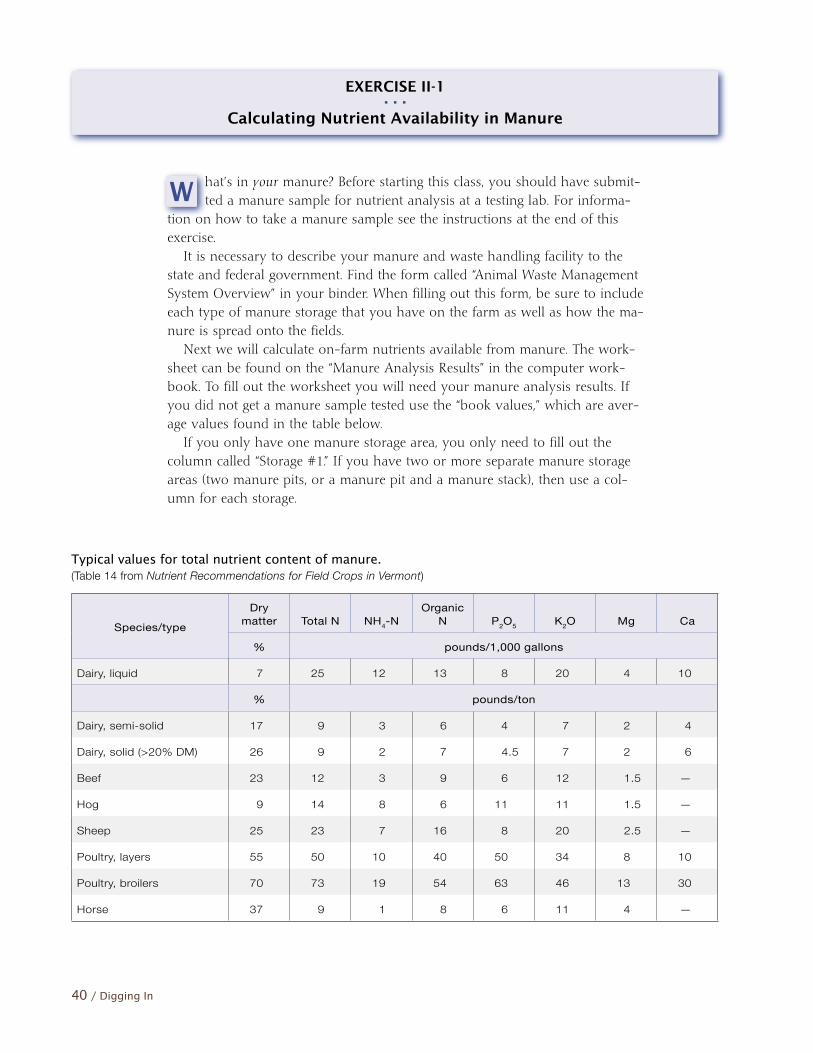
tion on how to take a manure sample see the instructions at the end of this exercise. It is necessary to describe your manure and waste handling facility to the state and federal government. Find the form called “Animal Waste Management System Overview” in your binder. When filling out this form, be sure to include each type of manure storage that you have on the farm as well as how the ma-nure is spread onto the fields. Next we will calculate on-farm nutrients available from manure. The work-sheet can be found on the “Manure Analysis Results” in the computer work-book. To fill out the worksheet you will need your manure analysis results. If you did not get a manure sample tested use the “book values,” which are aver-age values found in the table below. If you only have one manure storage area, you only need to fill out the column called “Storage #1.” If you have two or more separate manure storage areas (two manure pits, or a manure pit and a manure stack), then use a col-umn for each storage.
EXERCISE II-1. . .
Calculating Nutrient Availability in Manure
Typical values for total nutrient content of manure. (Table 14 from Nutrient Recommendations for Field Crops in Vermont)
Species/type
Dry matter Total N NH4-N
Organic N P2O5 K2O Mg Ca
% pounds/1,000 gallons
Dairy, liquid 7 25 12 13 8 20 4 10
% pounds/ton
Dairy, semi-solid 17 9 3 6 4 7 2 4
Dairy, solid (>20% DM) 26 9 2 7 4.5 7 2 6
Beef 23 12 3 9 6 12 1.5 —
Hog 9 14 8 6 11 11 1.5 —
Sheep 25 23 7 16 8 20 2.5 —
Poultry, layers 55 50 10 40 50 34 8 10
Poultry, broilers 70 73 19 54 63 46 13 30
Horse 37 9 1 8 6 11 4 —
W
Understanding Soil Nutrients / 41
(Exercise II-1 is continued on the next page)
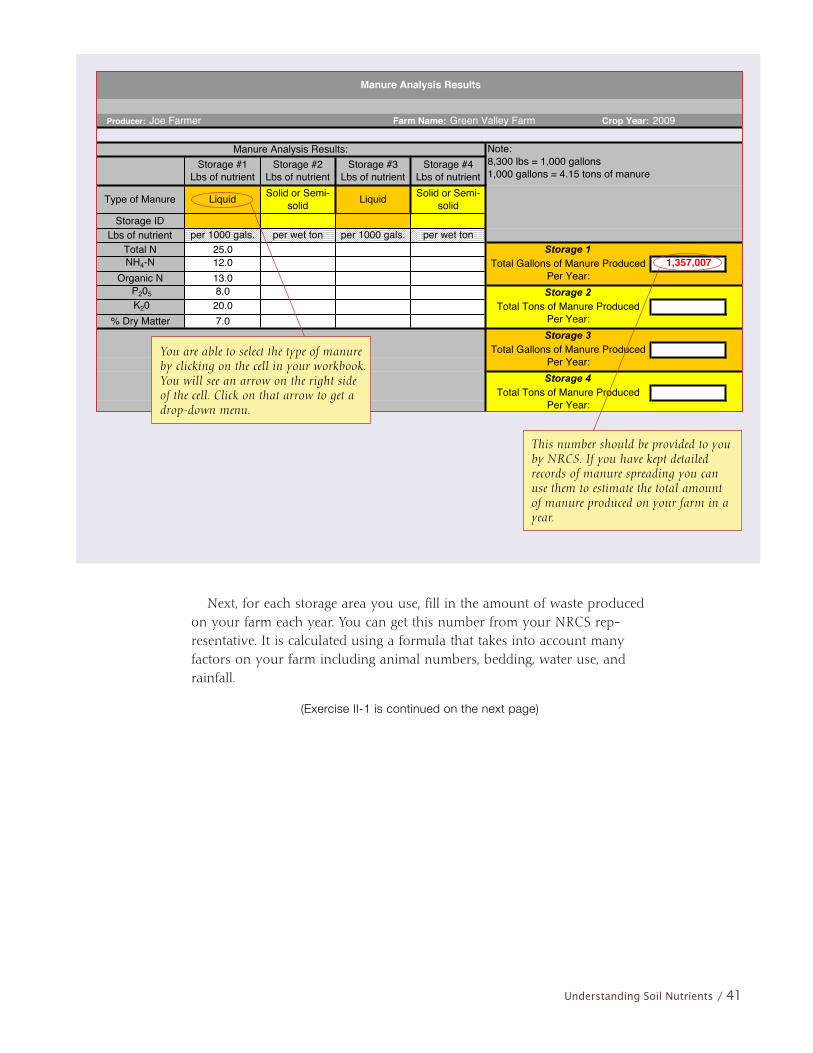
Next, for each storage area you use, fill in the amount of waste produced on your farm each year. You can get this number from your NRCS rep-resentative. It is calculated using a formula that takes into account many factors on your farm including animal numbers, bedding, water use, and rainfall.
1/6/2009 Nutrient Management Planning Workbook
Producer: Farm Name: Green Valley Farm
8.020.0
Total Tons of Manure Produced Per Year:
Storage 2 P205
K20% Dry Matter
Storage 4
Total Tons of Manure Produced Per Year:
Total Gallons of Manure Produced Per Year:
1,357,007
Storage 3
13.0
7.0
Joe Farmer
per 1000 gals.Total N
Storage #2Lbs of nutrient
Liquid
per 1000 gals.25.012.0
Storage ID
Storage #3Lbs of nutrient
Storage #4Lbs of nutrient
Type of Manure
Lbs of nutrient
Organic N
Solid or Semi-solid
Manure Analysis Results
2009Crop Year:
Manure Analysis Results:
NH4-N
Note:8,300 lbs = 1,000 gallons1,000 gallons = 4.15 tons of manure
Storage #1Lbs of nutrient
Solid or Semi-solid Liquid
Storage 1
per wet ton per wet ton
Total Gallons of Manure Produced Per Year:
You are able to select the type of manure by clicking on the cell in your workbook. You will see an arrow on the right side of the cell. Click on that arrow to get a drop-down menu.
This number should be provided to you by NRCS. If you have kept detailed records of manure spreading you can use them to estimate the total amount of manure produced on your farm in a year.
42 / Digging In
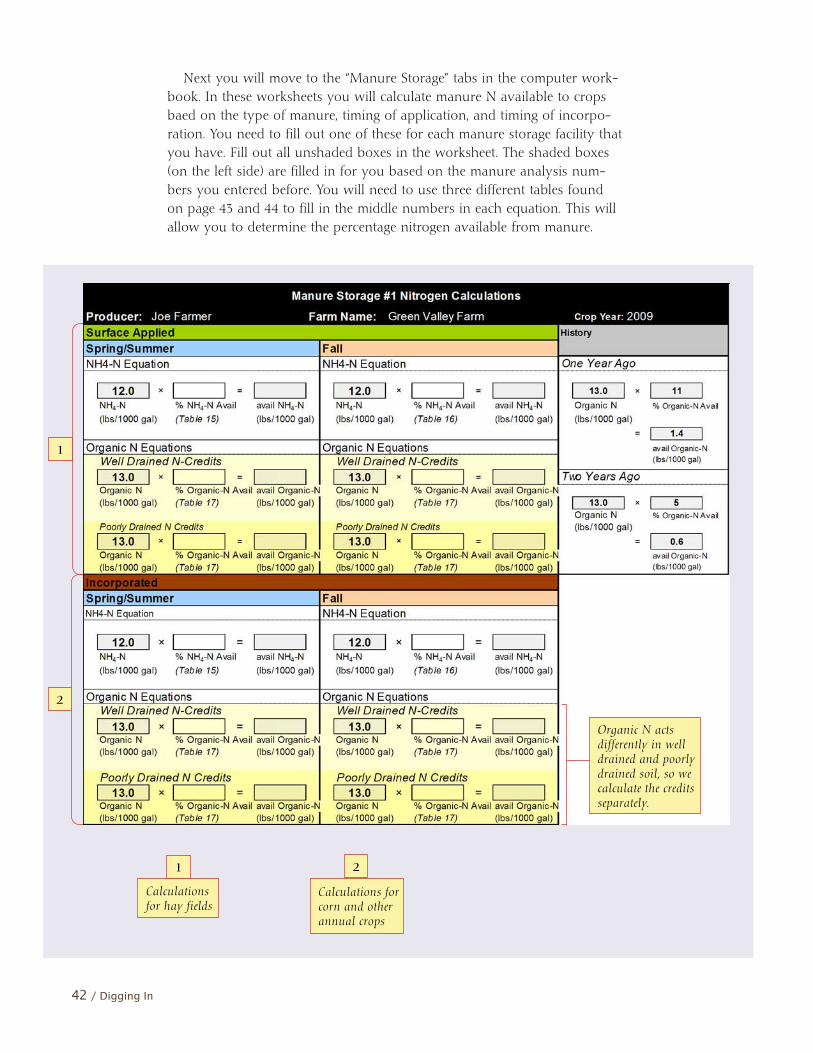
Organic N acts differently in well drained and poorly drained soil, so we calculate the credits separately.
Calculations for hay fields
Calculations for corn and other annual crops
1
2
1 2
Next you will move to the “Manure Storage” tabs in the computer work-book. In these worksheets you will calculate manure N available to crops baed on the type of manure, timing of application, and timing of incorpo-ration. You need to fill out one of these for each manure storage facility that you have. Fill out all unshaded boxes in the worksheet. The shaded boxes (on the left side) are filled in for you based on the manure analysis num-bers you entered before. You will need to use three different tables found on page 43 and 44 to fill in the middle numbers in each equation. This will allow you to determine the percentage nitrogen available from manure.
Understanding Soil Nutrients / 43
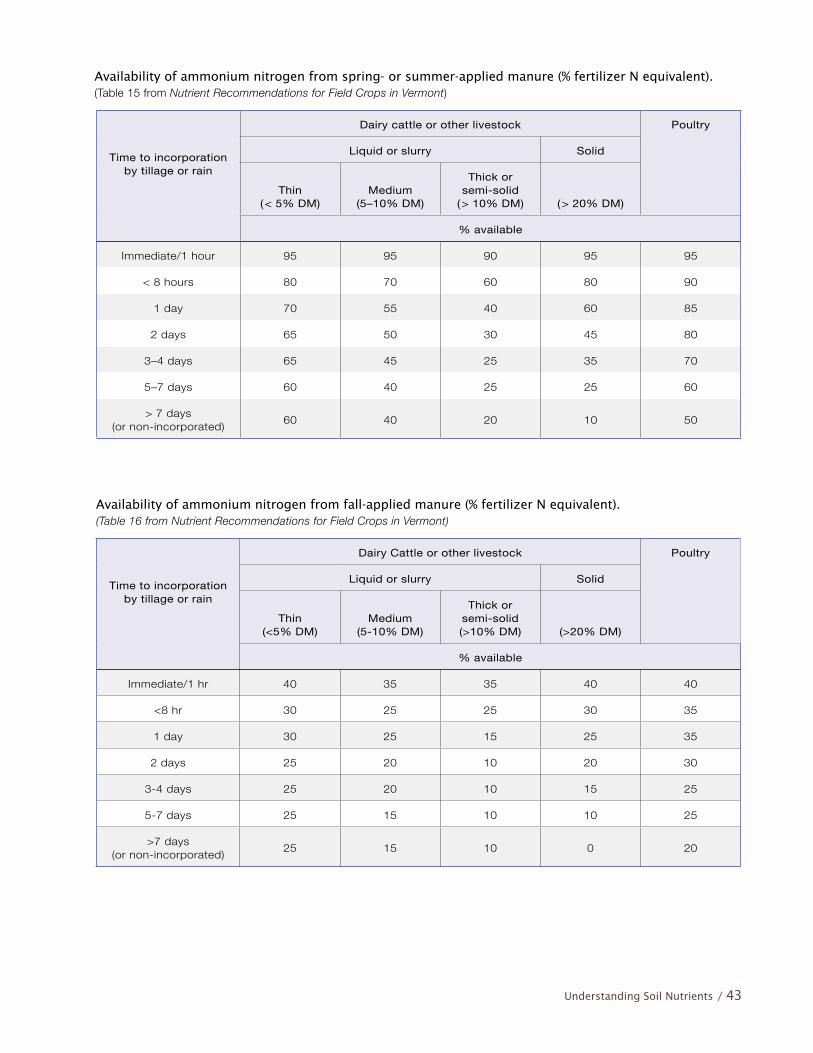
Time to incorporation by tillage or rain
Dairy cattle or other livestock Poultry
Liquid or slurry Solid
Thin (< 5% DM)
Medium (5–10% DM)
Thick or semi-solid
(> 10% DM) (> 20% DM)
% available
Immediate/1 hour 95 95 90 95 95
< 8 hours 80 70 60 80 90
1 day 70 55 40 60 85
2 days 65 50 30 45 80
3–4 days 65 45 25 35 70
5–7 days 60 40 25 25 60
> 7 days (or non-incorporated)
60 40 20 10 50
Availability of ammonium nitrogen from spring- or summer-applied manure (% fertilizer N equivalent).(Table 15 from Nutrient Recommendations for Field Crops in Vermont)
Availability of ammonium nitrogen from fall-applied manure (% fertilizer N equivalent). (Table 16 from Nutrient Recommendations for Field Crops in Vermont)
Time to incorporation by tillage or rain
Dairy Cattle or other livestock Poultry
Liquid or slurry Solid
Thin (<5% DM)
Medium (5-10% DM)
Thick or semi-solid (>10% DM) (>20% DM)
% available
Immediate/1 hr 40 35 35 40 40
<8 hr 30 25 25 30 35
1 day 30 25 15 25 35
2 days 25 20 10 20 30
3-4 days 25 20 10 15 25
5-7 days 25 15 10 10 25
>7 days (or non-incorporated)
25 15 10 0 20
44 / Digging In
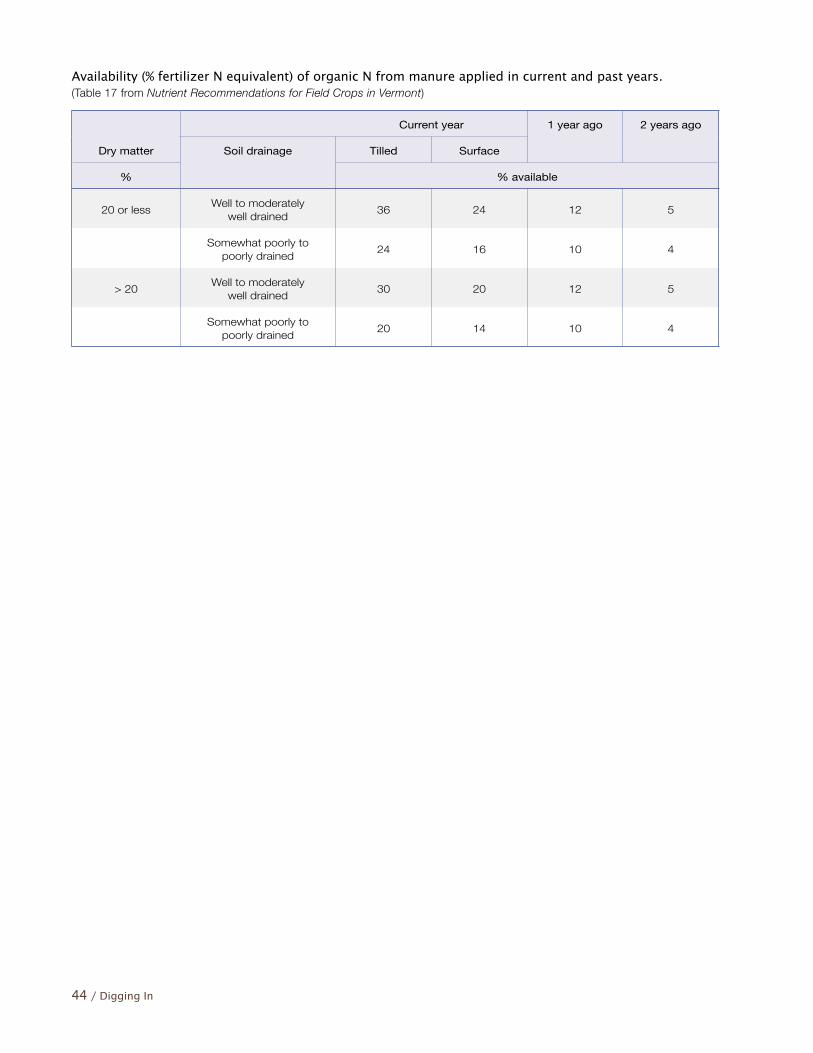
Availability (% fertilizer N equivalent) of organic N from manure applied in current and past years.(Table 17 from Nutrient Recommendations for Field Crops in Vermont)
Current year 1 year ago 2 years ago
Dry matter Soil drainage Tilled Surface
% % available
20 or lessWell to moderately
well drained36 24 12 5
Somewhat poorly to poorly drained
24 16 10 4
> 20Well to moderately
well drained30 20 12 5
Somewhat poorly to poorly drained
20 14 10 4
Understanding Soil Nutrients / 45
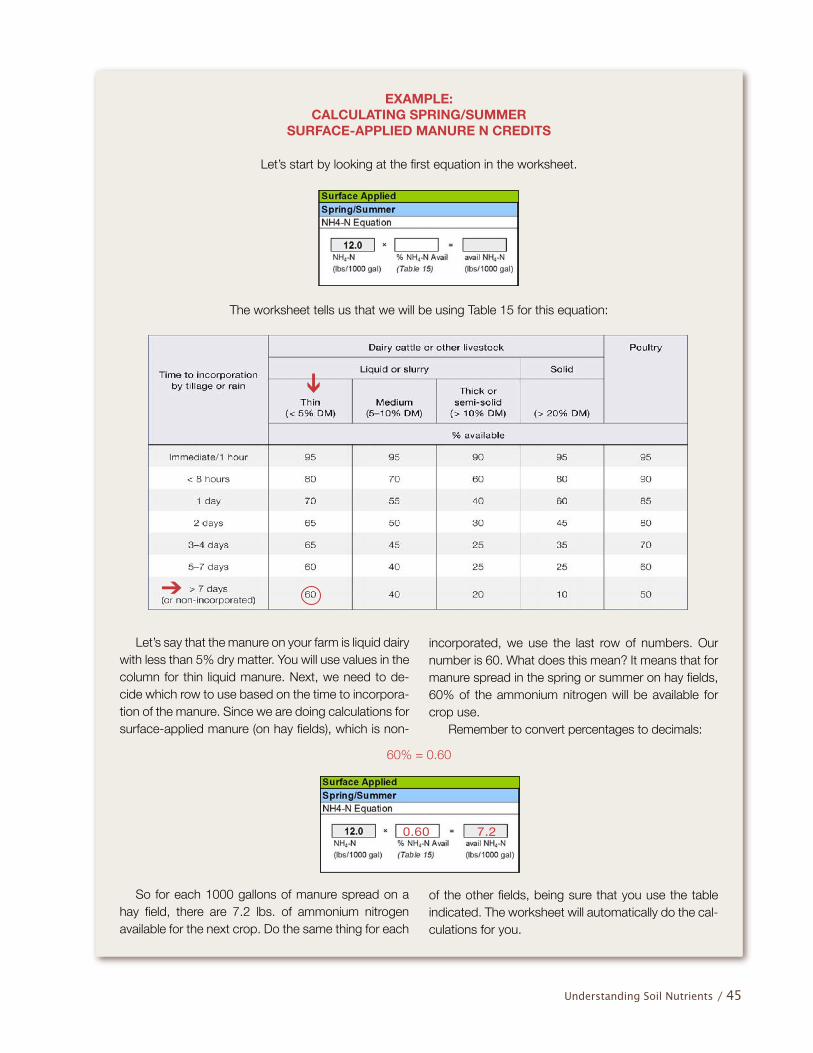
EXAMPLE: CALCULATING SPRING/SUMMER
SURFACE-APPLIED MANURE N CREDITS
Let’s start by looking at the first equation in the worksheet.
0.60 7.2
The worksheet tells us that we will be using Table 15 for this equation:
Let’s say that the manure on your farm is liquid dairy with less than 5% dry matter. You will use values in the column for thin liquid manure. Next, we need to de-cide which row to use based on the time to incorpora-tion of the manure. Since we are doing calculations for surface-applied manure (on hay fields), which is non-
60% = 0.60
incorporated, we use the last row of numbers. Our number is 60. What does this mean? It means that for manure spread in the spring or summer on hay fields, 60% of the ammonium nitrogen will be available for crop use.
Remember to convert percentages to decimals:
So for each 1000 gallons of manure spread on a hay field, there are 7.2 lbs. of ammonium nitrogen available for the next crop. Do the same thing for each
of the other fields, being sure that you use the table indicated. The worksheet will automatically do the cal-culations for you.
➔
➔
46 / Digging In
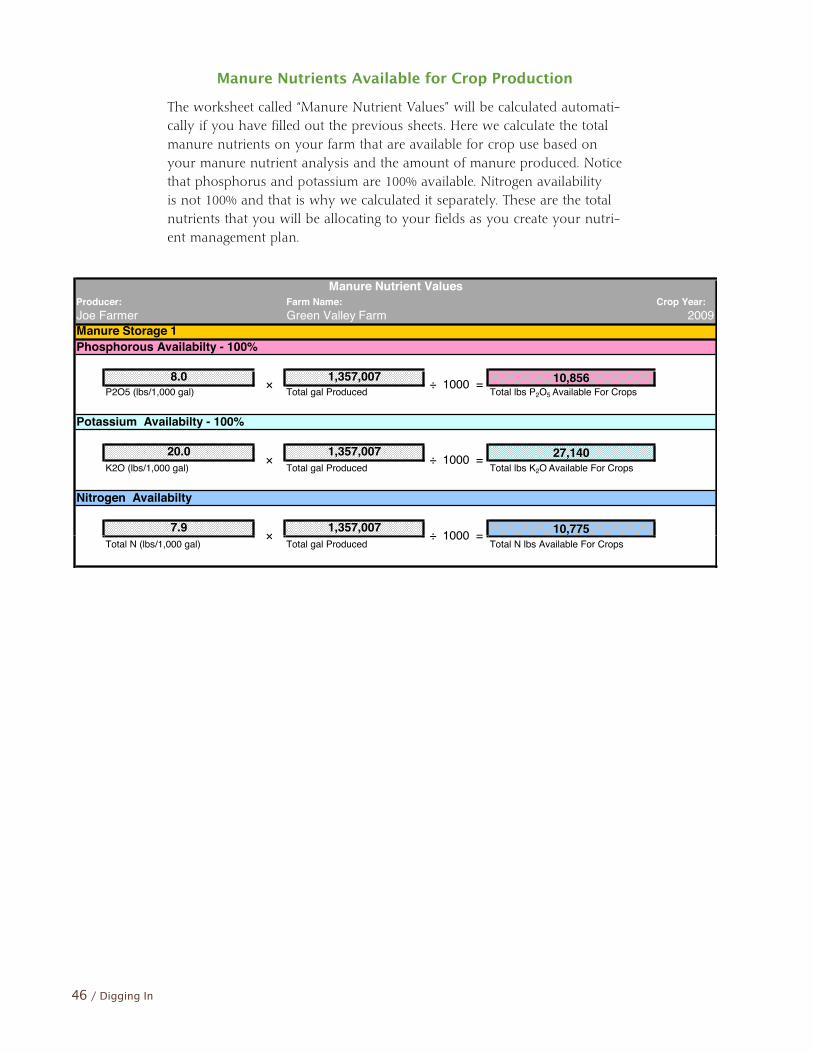
Manure Nutrients Available for Crop Production
The worksheet called “Manure Nutrient Values” will be calculated automati-cally if you have filled out the previous sheets. Here we calculate the total manure nutrients on your farm that are available for crop use based on your manure nutrient analysis and the amount of manure produced. Notice that phosphorus and potassium are 100% available. Nitrogen availability is not 100% and that is why we calculated it separately. These are the total nutrients that you will be allocating to your fields as you create your nutri-ent management plan.
4/6/2009 Nutrient Management Planning Workbook
Farm Name:
Nitrogen Availabilty
7.9 × 1,357,007 ÷ 1000 = 10,775
Manure Storage 1
K2O (lbs/1,000 gal) Total gal Produced
P2O5 (lbs/1,000 gal) Total gal Produced8.0 1,357,007× ÷ 1000 =
Phosphorous Availabilty - 100%
10,856
Potassium Availabilty - 100%
20.0 1,357,007 27,140×
Total lbs P2O5 Available For Crops
Total lbs K2O Available For Crops÷ 1000 =
Manure Nutrient ValuesProducer:Joe Farmer Green Valley Farm
Crop Year:2009
× 0
Total tons produced Total lbs P2O5 Available For Crops
Potassium Availabilty - 100%
= 00.0
Phosphorous Availabilty - 100%
0.0P2O5 (lbs/ton)
× 0 = 0
0Total N lbs Available For Crops
Total lbs K2O Available For Crops
Nitrogen Availabilty
K2O (lbs/ton) Total tons produced
0.0 × 0 =Total N (lbs/ton) Total tons produced
Manure Storage 2
×Total gal Produced
÷ 1000 =Total N (lbs/1,000 gal) Total N lbs Available For Crops
Understanding Soil Nutrients / 47
A field-by-field nutrient management program requires multiple components to maintain ad-
equate fertility for crop growth and development. Animal manure has long been used as a source of nutrients for crop growth. Standard nutrient values from manure like those obtained from the Nutri-ent Recommendations for Field Crops in Vermont booklet are reasonable average values, but an indi-vidual farm’s manure analyses can vary from those averages by 50 percent or more. Species, age of animal, feed rations, water use, bedding type, man-agement, and other factors make every farm’s ma-nure different. Because every livestock production and manure management system is unique, the best way to assess manure nutrients is by sampling and analyzing the manure at a laboratory. Accurate manure analyses are essential for proper nutrient management planning, but manure analyses are only as good as the sample taken. The 590 Stan-dard requires that a manure analysis be conducted for each storage facility every year.
How to Sample Liquid Storage
Agitate and thoroughly mix the manure before sampling. Make a dipper by fastening a cup to a broomstick or pole and take a sample or two from the tank spreader and place them in a pail. Do this for multiple loads as the storage is being emptied.
HOW TO SAMPLE MANURE FOR NUTRIENT ANALYSIS
How to Sample Non-Liquid Storage
Use a garden trowel and pail to collect a sample of manure from various spots on a load. Do this for rep-resentative loads as the storage is emptied.
How to Sample from Daily Spreading
Use a garden trowel and pail to collect a sample of manure from various spots on the spreader. Sam-ple the loads for two to three consecutive days. It is recommended to avoid large chunks or pieces of bedding and to select five to ten sub-samples from different places in the spreader.
Handling the Sample
Immediately after sampling the load, thoroughly mix the contents of the sampling pail, remove a small amount with a ladle and place it in a plastic jar, then cap it tightly and freeze immediately. Collect several sub-samples from different loads on different days and add each new sub-sample to the jar of frozen material and refreeze immediately. Repeat until you feel that you have a representative bulk sample. Be sure that the plastic jar is three-quarters full to allow room for expansion. Properly preparing the sample is very important to prevent ammonia loss. Wipe the container to remove any manure that may have spilled down the sides. The outside of the container should be clean prior to shipping. Secure the lid firmly and label with its name and date.
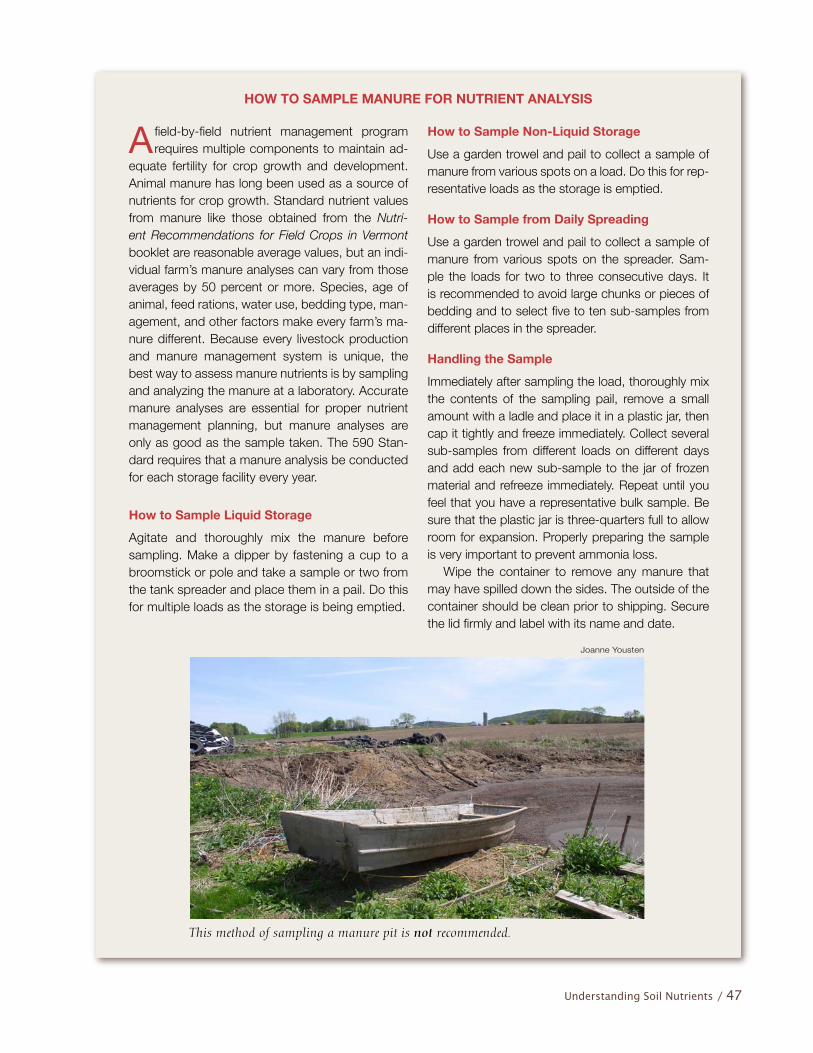
This method of sampling a manure pit is not recommended.
Joanne Yousten
48 / Digging In
LESSON II-3. . .The Phosphorus Cycle
Phosphorus (P) is an essential nutrient for plants and animals. In plants it plays a role in
energy transformation, photosynthesis, respiration, and cell growth. Adequate P is needed for early root formation and growth as well as for seed formation. Livestock also require P for proper growth. It is an essential component of bones and teeth. Most of the world’s soils are deficient in P, but excesses are seen in states like Vermont that have areas with a lot of animals, feed imported from other parts of the country, and manure. In general, the total amount of available phosphorus in most Vermont soils was once quite low, therefore it is ingrained in some farmers to add phosphorus to fields every year. Would anyone think of putting on a starter fertilizer that doesn’t contain P?
Forms of Phosphorus in the Soil
Phosphorus exists in many different forms in soil, including organic, soil solution, “bound,” and pri-mary mineral forms. Organic P is bound to carbon compounds in the soil. It was produced from a once living organism. Most of the organic-P in agri-cultural soils comes from livestock manure applica-tions or crop residues. In order for the organic-P to become plant available it must be released from the carbon bond by microorganisms. Soil solution P is the soluble inorganic form of P, also known as orthophosphates (H2PO4
- or HPO42-). This is the
form taken up by plants, but it is also the form that accounts for the smallest proportion of the total P in most soils. Bound P makes up a large proportion of the soil P and is unavailable to plants because it is chemically bound to soil particles. P forms insoluble compounds with different minerals in the soil such as iron (Fe), aluminum (Al), or manganese (Mn) in acidic soils, or calcium (Ca) in basic soils. Primary mineral P is unavailable in the form of rocks and minerals.
Phosphorus Cycle
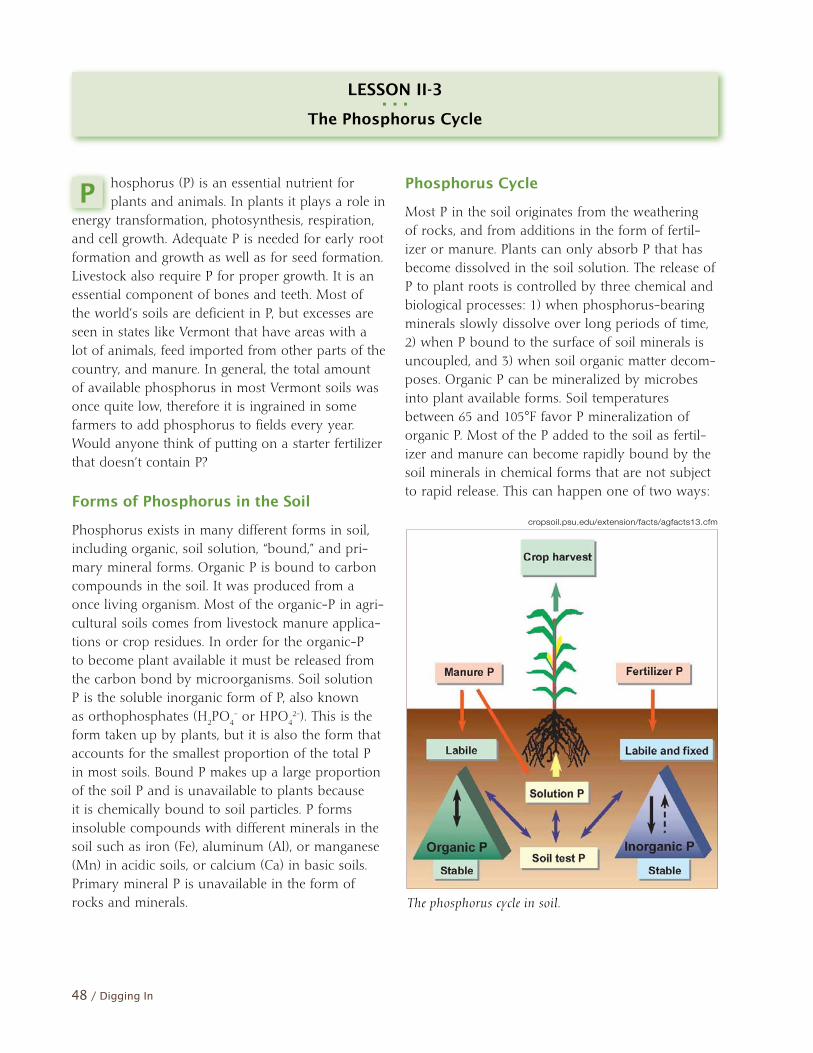
Most P in the soil originates from the weathering of rocks, and from additions in the form of fertil-izer or manure. Plants can only absorb P that has become dissolved in the soil solution. The release of P to plant roots is controlled by three chemical and biological processes: 1) when phosphorus-bearing minerals slowly dissolve over long periods of time, 2) when P bound to the surface of soil minerals is uncoupled, and 3) when soil organic matter decom-poses. Organic P can be mineralized by microbes into plant available forms. Soil temperatures between 65 and 105°F favor P mineralization of organic P. Most of the P added to the soil as fertil-izer and manure can become rapidly bound by the soil minerals in chemical forms that are not subject to rapid release. This can happen one of two ways:
The phosphorus cycle in soil.
cropsoil.psu.edu/extension/facts/agfacts13.cfm
Understanding Soil Nutrients / 49
• P reacts with Fe, Al, Mn or Ca (precipitation), or • P can be held by soil particles.
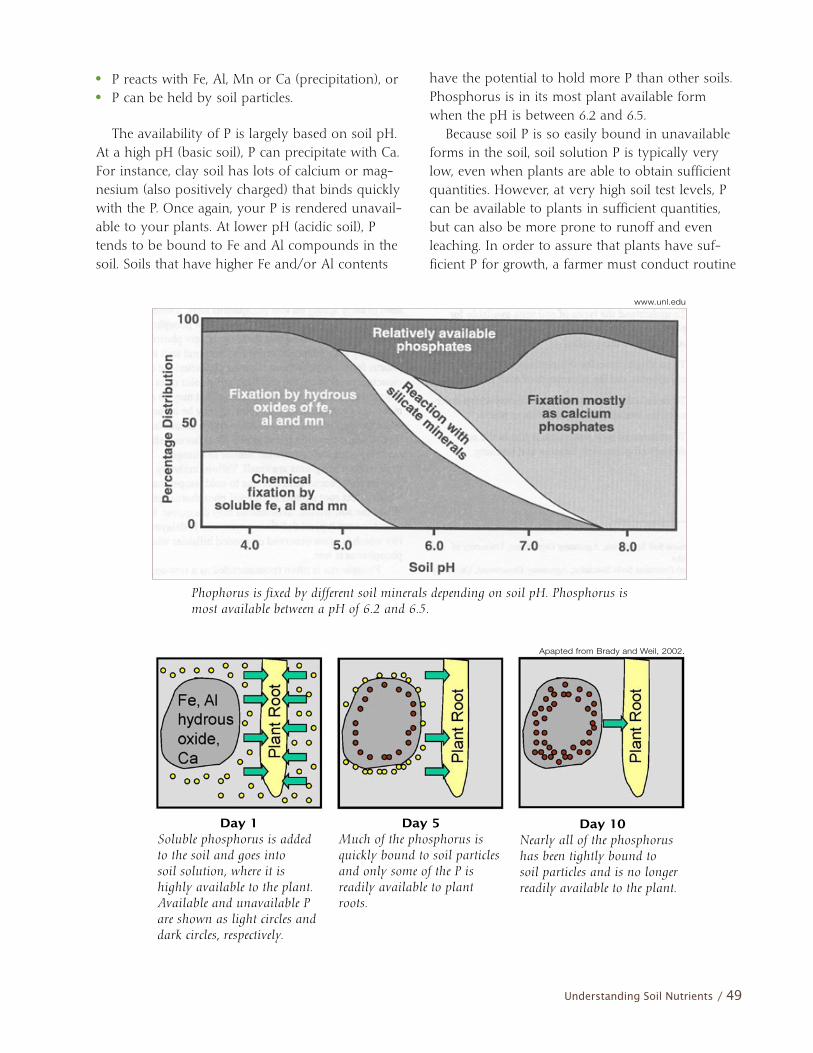
The availability of P is largely based on soil pH. At a high pH (basic soil), P can precipitate with Ca. For instance, clay soil has lots of calcium or mag-nesium (also positively charged) that binds quickly with the P. Once again, your P is rendered unavail-able to your plants. At lower pH (acidic soil), P tends to be bound to Fe and Al compounds in the soil. Soils that have higher Fe and/or Al contents
have the potential to hold more P than other soils. Phosphorus is in its most plant available form when the pH is between 6.2 and 6.5. Because soil P is so easily bound in unavailable forms in the soil, soil solution P is typically very low, even when plants are able to obtain sufficient quantities. However, at very high soil test levels, P can be available to plants in sufficient quantities, but can also be more prone to runoff and even leaching. In order to assure that plants have suf-ficient P for growth, a farmer must conduct routine
Phophorus is fixed by different soil minerals depending on soil pH. Phosphorus is most available between a pH of 6.2 and 6.5.
www.unl.edu
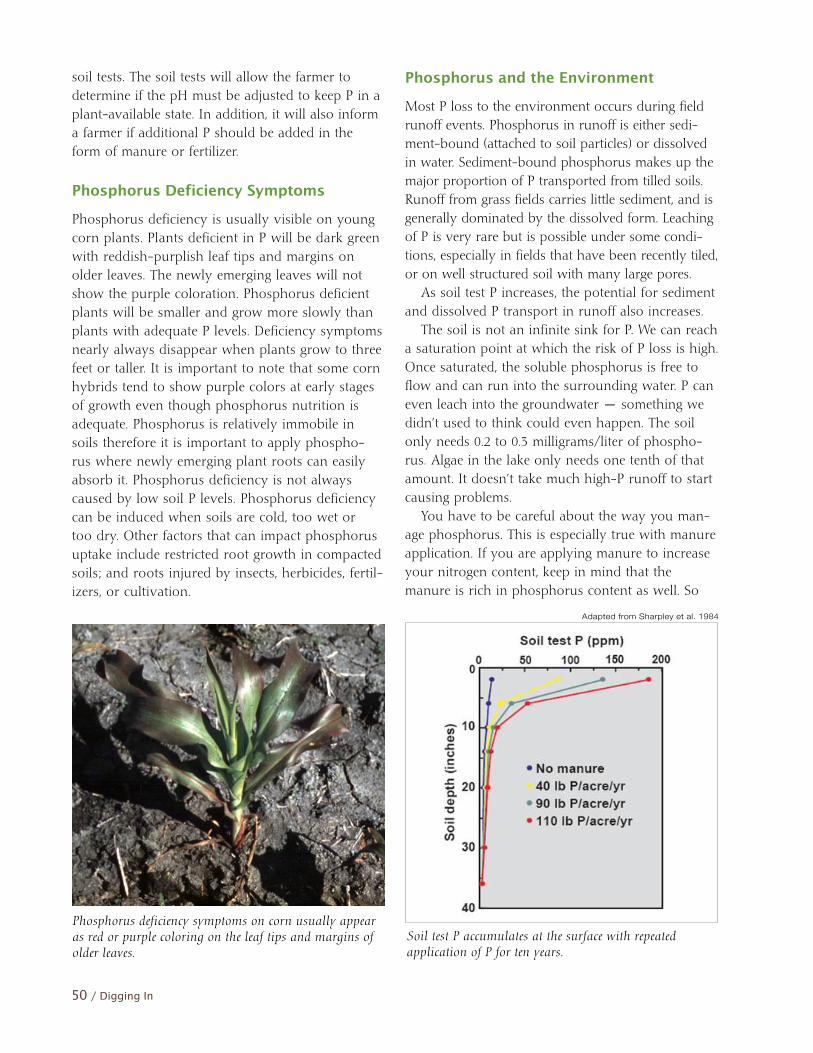
Day 10Nearly all of the phosphorus has been tightly bound to soil particles and is no longer readily available to the plant.
Day 1Soluble phosphorus is added to the soil and goes into soil solution, where it is highly available to the plant. Available and unavailable P are shown as light circles and dark circles, respectively.
Day 5 Much of the phosphorus is quickly bound to soil particles and only some of the P is readily available to plant roots.
Apapted from Brady and Weil, 2002.
50 / Digging In
soil tests. The soil tests will allow the farmer to determine if the pH must be adjusted to keep P in a plant-available state. In addition, it will also inform a farmer if additional P should be added in the form of manure or fertilizer.
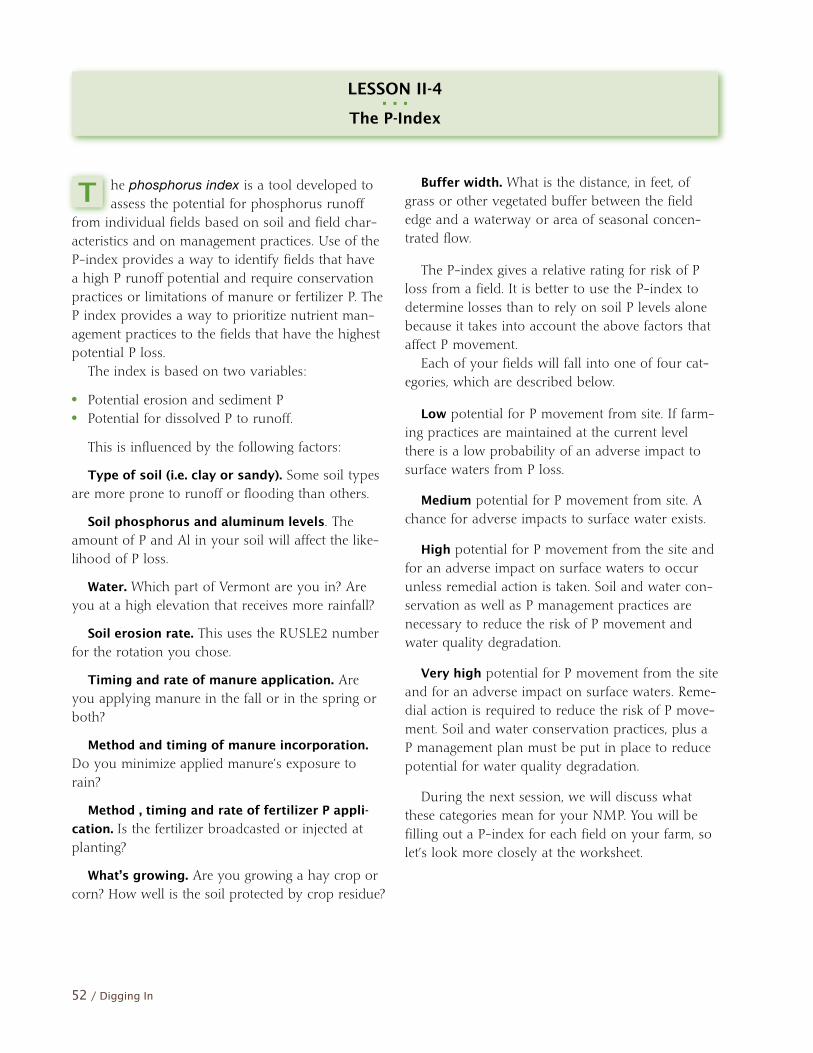
Phosphorus Deficiency Symptoms
Phosphorus deficiency is usually visible on young corn plants. Plants deficient in P will be dark green with reddish-purplish leaf tips and margins on older leaves. The newly emerging leaves will not show the purple coloration. Phosphorus deficient plants will be smaller and grow more slowly than plants with adequate P levels. Deficiency symptoms nearly always disappear when plants grow to three feet or taller. It is important to note that some corn hybrids tend to show purple colors at early stages of growth even though phosphorus nutrition is adequate. Phosphorus is relatively immobile in soils therefore it is important to apply phospho-rus where newly emerging plant roots can easily absorb it. Phosphorus deficiency is not always caused by low soil P levels. Phosphorus deficiency can be induced when soils are cold, too wet or too dry. Other factors that can impact phosphorus uptake include restricted root growth in compacted soils; and roots injured by insects, herbicides, fertil-izers, or cultivation.
Phosphorus and the Environment
Most P loss to the environment occurs during field runoff events. Phosphorus in runoff is either sedi-ment-bound (attached to soil particles) or dissolved in water. Sediment-bound phosphorus makes up the major proportion of P transported from tilled soils. Runoff from grass fields carries little sediment, and is generally dominated by the dissolved form. Leaching of P is very rare but is possible under some condi-tions, especially in fields that have been recently tiled, or on well structured soil with many large pores. As soil test P increases, the potential for sediment and dissolved P transport in runoff also increases. The soil is not an infinite sink for P. We can reach a saturation point at which the risk of P loss is high. Once saturated, the soluble phosphorus is free to flow and can run into the surrounding water. P can even leach into the groundwater — something we didn’t used to think could even happen. The soil only needs 0.2 to 0.3 milligrams/liter of phospho-rus. Algae in the lake only needs one tenth of that amount. It doesn’t take much high-P runoff to start causing problems. You have to be careful about the way you man-age phosphorus. This is especially true with manure application. If you are applying manure to increase your nitrogen content, keep in mind that the manure is rich in phosphorus content as well. So
Adapted from Sharpley et al. 1984
Soil test P accumulates at the surface with repeated application of P for ten years.
Phosphorus deficiency symptoms on corn usually appear as red or purple coloring on the leaf tips and margins of older leaves.

Understanding Soil Nutrients / 51
as you apply it to increase your nitrogen, you also increase your soil’s P. You could end up doubling your amount of P to reach the required amount of nitrogen. The problem with excess P is that it is much easier to build up than to use up after high levels are reached. One of the goals of our NMP is to reduce P losses from agriculture to surface waters. This goal can be reached by minimizing inputs of P in feed and fertilizer, consistent with modern dairy cow and crop management, and by balancing inputs with outputs in crop and animal products. The buildup of P to excessive levels in soils can occur when any P source, including commercial fertilizer and manure, is over-applied for a long period of time. The greatest concern is the addition of P to land from manure applications. In the Northeast, most animal operations are located in grain-deficient areas and require that grain for animal feed be imported. This type of production system represents a net import of nutri-ents into Vermont due to the combined inputs of P-enriched feed, dietary feed supplements, and fertilizer. Manure is then applied near the point of generation and most commonly within the bound-aries of the “home farm.” Primary outputs of P from these farms include crop and animal products that are removed and utilized off-farm. The flow of nutrients onto the farm is generally out of bal-ance with the flow of nutrients off the farm. Simply put, more P is entering the farm boundary than is
exiting in the form of salable products. The great-est problems with excess P occur on farms with relatively low acreage for the number of animals. In this situation, the amount of manure generated exceeds the needs of the land.
Phosphorus Movement and Pollution
Phosphorus moves in two ways:
• Runoff and erosion (the major forms of movement) • Leaching (less common)
There are two types of P that can erode or run off:
Sediment-bound Phosphorus. This is phospho-rus bound to soil. When soil erodes, the phospho-rus bound to that soil is moved into water. 80 to 90% of all P loss happens as a result of erosion. If you can greatly reduce erosion, you can signifi-cantly decrease P pollution. P is a limiting nutrient for algae just as nitrogen is the limiting nutrient for corn. (P can be a limiting nutrient for crops — although it is not as common as N limitation.) Algae cannot grow without phosphorus.
Dissolved phosphorus. This type of P moves freely in solutions such as water and is readily available. It is difficult to control runoff of dissolved P. The best management strategy is to make sure that it infiltrates into the ground immediately.
Sources of P for potential runoff include both the phosphorus added to the surface from manure and fertilizer as well as dissolved and sediment-bound phosphorus from the soil.
52 / Digging In
he phosphorus index is a tool developed to assess the potential for phosphorus runoff
from individual fields based on soil and field char-acteristics and on management practices. Use of the P-index provides a way to identify fields that have a high P runoff potential and require conservation practices or limitations of manure or fertilizer P. The P index provides a way to prioritize nutrient man-agement practices to the fields that have the highest potential P loss. The index is based on two variables:
• Potential erosion and sediment P• Potential for dissolved P to runoff.
This is influenced by the following factors:
Type of soil (i.e. clay or sandy). Some soil types are more prone to runoff or flooding than others.
Soil phosphorus and aluminum levels. The amount of P and Al in your soil will affect the like-lihood of P loss.
Water. Which part of Vermont are you in? Are you at a high elevation that receives more rainfall?
Soil erosion rate. This uses the RUSLE2 number for the rotation you chose.
Timing and rate of manure application. Are you applying manure in the fall or in the spring or both?
Method and timing of manure incorporation. Do you minimize applied manure’s exposure to rain?
Method , timing and rate of fertilizer P appli-
cation. Is the fertilizer broadcasted or injected at planting?
What’s growing. Are you growing a hay crop or corn? How well is the soil protected by crop residue?
LESSON II-4. . .The P-Index
T Buffer width. What is the distance, in feet, of grass or other vegetated buffer between the field edge and a waterway or area of seasonal concen-trated flow.
The P-index gives a relative rating for risk of P loss from a field. It is better to use the P-index to determine losses than to rely on soil P levels alone because it takes into account the above factors that affect P movement. Each of your fields will fall into one of four cat-egories, which are described below.
Low potential for P movement from site. If farm-ing practices are maintained at the current level there is a low probability of an adverse impact to surface waters from P loss.
Medium potential for P movement from site. A chance for adverse impacts to surface water exists.
High potential for P movement from the site and for an adverse impact on surface waters to occur unless remedial action is taken. Soil and water con-servation as well as P management practices are necessary to reduce the risk of P movement and water quality degradation.
Very high potential for P movement from the site and for an adverse impact on surface waters. Reme-dial action is required to reduce the risk of P move-ment. Soil and water conservation practices, plus a P management plan must be put in place to reduce potential for water quality degradation.
During the next session, we will discuss what these categories mean for your NMP. You will be filling out a P-index for each field on your farm, so let’s look more closely at the worksheet.
Understanding Soil Nutrients / 53
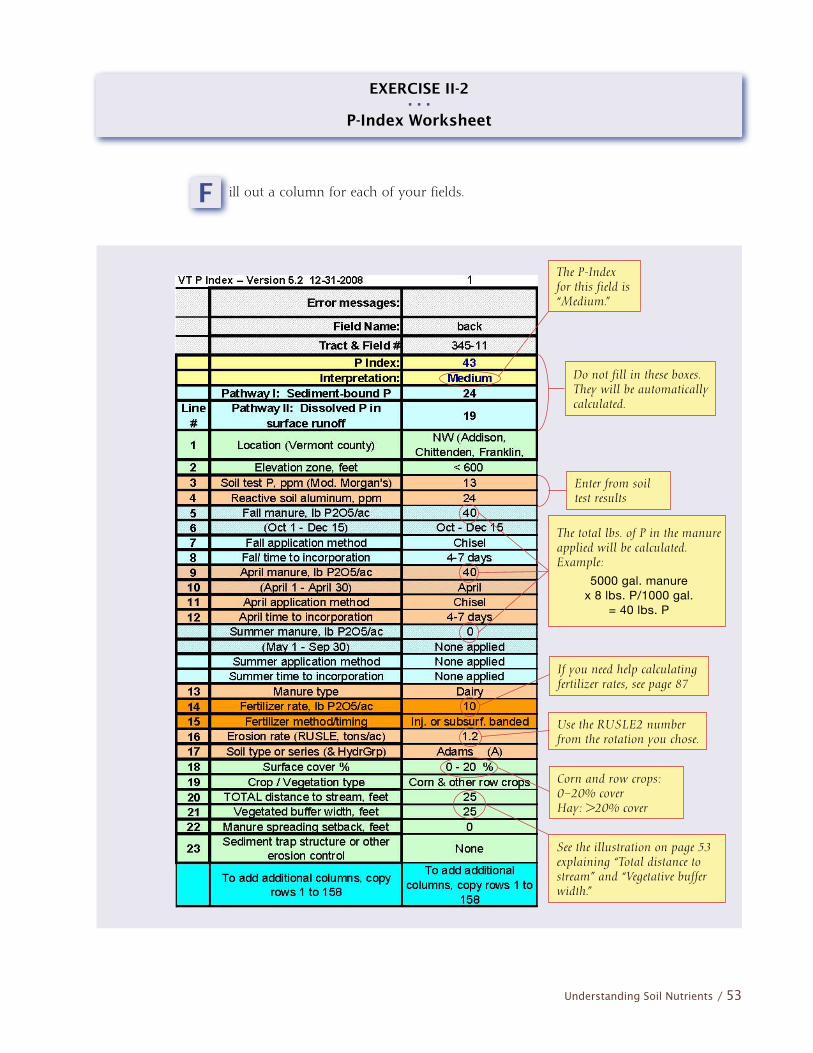
EXERCISE II-2. . .
P-Index Worksheet
F ill out a column for each of your fields.
The P-Index for this field is “Medium.”
Do not fill in these boxes. They will be automatically calculated.
Enter from soil test results
The total lbs. of P in the manure applied will be calculated.Example:
5000 gal. manure x 8 lbs. P/1000 gal.
= 40 lbs. P
Use the RUSLE2 number from the rotation you chose.
Corn and row crops: 0–20% coverHay: >20% cover
See the illustration on page 53 explaining “Total distance to stream” and “Vegetative buffer width.”
If you need help calculating fertilizer rates, see page 87
54 / Digging In
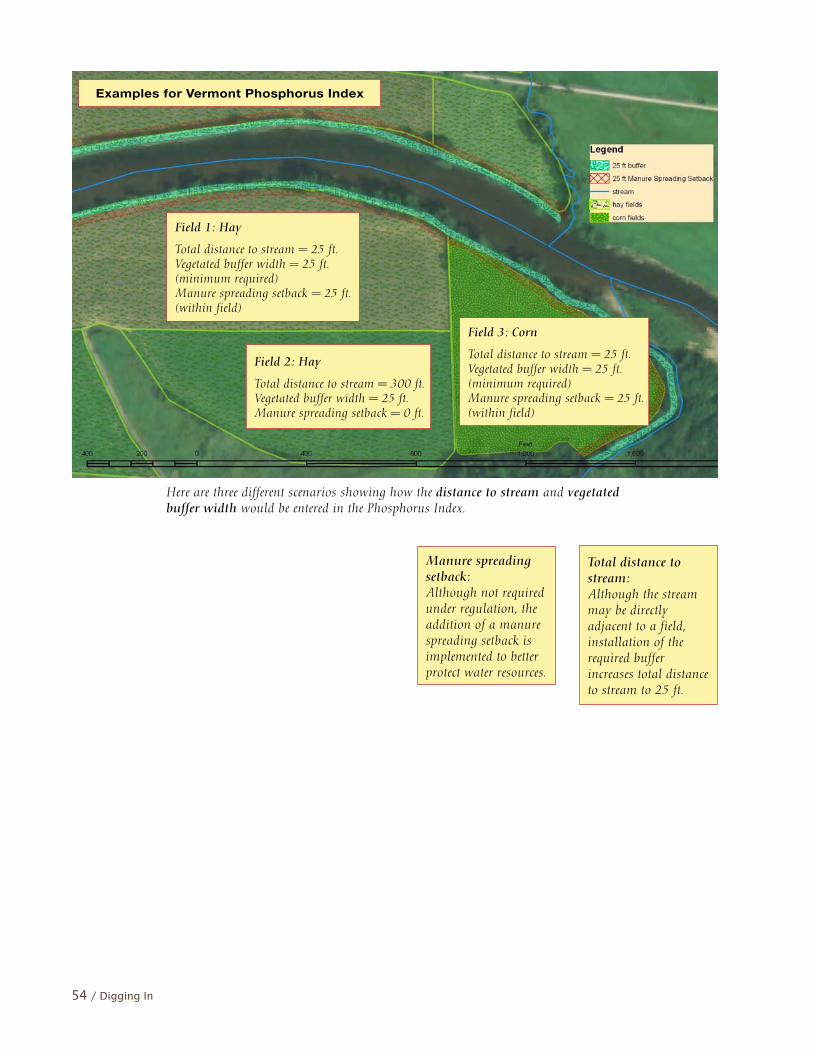
Here are three different scenarios showing how the distance to stream and vegetated buffer width would be entered in the Phosphorus Index.
Examples for Vermont Phosphorus Index
Field 1: Hay
Total distance to stream = 25 ft.Vegetated buffer width = 25 ft.(minimum required)Manure spreading setback = 25 ft.(within field)
Field 2: Hay
Total distance to stream = 300 ft. Vegetated buffer width = 25 ft. Manure spreading setback = 0 ft.
Field 3: Corn
Total distance to stream = 25 ft.Vegetated buffer width = 25 ft.(minimum required)Manure spreading setback = 25 ft.(within field)
Total distance to stream:Although the stream may be directly adjacent to a field, installation of the required buffer increases total distance to stream to 25 ft.
Manure spreading setback: Although not required under regulation, the addition of a manure spreading setback is implemented to better protect water resources.

Understanding Soil Nutrients / 55
ere is a list of items that you should have completed before you go on to the next session. Those items found in the computer workbook are
listed in blue.
EXERCISE II-3. . .
Checklist
H
SESSION I
❑ Farm information worksheet
❑ Maps (proximity, conservation plan, nitrate leaching, topo- graphic, environmental concerns, soils)
❑ Soil fact sheets
❑ Soil test results organized
❑ Soil test interpretation and planning strategy
❑ Soil test schedule
❑ RUSLE2 (with your crop rotation indicated)
❑ Field inventory
❑ Manure application schedule
SESSION II
❑ Animal waste system overview sheet
❑ Calculation of amount of manure produced
❑ Manure test for each storage
❑ Manure analysis worksheet
❑ Manure storage nitrogen calculations (one for each manure storage)
❑ Manure nutrient values
❑ P-index