evaluating optimal well placement in horizontal drilling
TRANSCRIPT
Journal of Geology and Mining Research Vol. 4(6) pp. 118-129, November 2012 Available online http://www.academicjournals.org/jgmr DOI: 10.5897/JGMR12.012 ISSN 2006 – 9766 ©2012 Academic Journals
Full Length Research Paper
Evaluating optimal well placement in horizontal drilling using geosteering: A case study of Agbada Field,
Niger Delta
Ichenwo, John Lander and Dosunmu Adewale
Department of Petroleum Engineering, University of Port Harcourt, Rivers State, Nigeria.
Accepted 2 February, 2012
This study focuses on the use of geosteering technology in the optimal placement of wellbore path in Agbada 61 reservoir formation, where geological or subsurface target is far less than 100 m and where conventional approach could not be applicable. This was achieved by the formulation of a predrilled formation model from existing nearby or offset well by invertion of the resistivity log use in Agbada well 61, to get a squared Rt (true resistivity) profile (together with dip angles, to populate the aforementioned formation model). Then this tool response was calculated along the designed well path in stated formation model derived (that is, D7 sand). It was observed that exploitation of the D7 reservoir by using a slant well as advised by the operator would have placed the well path in the water zone but a horizontal well would exploit D7 reservoir sandstone optimally by placing the well path 10.7 ft away from the pseudo-water contact. Key words: Geosteering, horizontal drilling, offset well, true resistivity.
INTRODUCTION In conventional deviated drilling, the well path is steered according to a predetermined geometric plan defined by rigid boundaries and well plan and also drilled with conventional steering assemblies. The objective is to follow the line as closely as possible. Geosteering is a departure from this convention because it involves the use of logging while drilling (LWD) data to help place the horizontal wellbore in the proper position when the geological marker is ill defined, target tolerances are tight, or the geology is so complicated as to make conventional deviated drilling impractical (Al-Mutari et al., 2009).
One of the major problems when drilling horizontal wells in thin formations is to establish the well as horizontal in the objective formation. It is often the case that despite the best efforts of the well site personnel, the well becomes horizontal immediately above or below the target in the reservoir (Peach and Kloss, 1994). Geosteering enables the geological marker above the reservoir to be recognized and the final build to horizontal *Corresponding author. E-mail: [email protected].
to be adjusted accordingly. Typically, gamma ray and resistivity tools are used to identify maker formations above the producing formation.
Geosteering refers to those activities designed to place the wellbore in a predetermined location, that location being defined by both its spatial coordinates, in three dimensions and by its position in the geological column. Proper geosteering will optimize wellbore placement in the productive reservoir, maximizing both drilling efficiency and hydrocarbon production. Early production, as well as the ultimate oil and gas recovery, from a reservoir often depends on the timeliness and the Geosteering decisions. Exiting the reservoir during drilling, results in costly and non-productive interval. Even remaining within the reservoir, but in a non-production location eventually leads to early water break through and leaves valuable oil behind. In recent years, the petroleum industry is looking for ways of detecting bed boundaries early so as to act on a timely fashion and also to know the direction of the conductive bed to prevent early exit from the reservoir (Omeragic et al., 2005).
Approaching the target is also a tough phase in the operation because the target’s exact position is never really known as there are several geological uncertainties

that mean the reservoir may be located higher or lower than expected. This may not be of enormous importance for a deviated or vertical well, but accuracy is crucial for a horizontal well.
STATEMENT OF PROBLEM It was intended to drill a lateral well to a location west of the surface location in the D7.0 target sand. A pilot hole would be drilled to determine formation top and fluid contacts and then sidetracked to land in the lower D7.0 target. A Formation Junction was then set immediately at 72° inclination with 7” liner continuing from one leg of the junction to the D7.0 sand. The lateral would kick-off in 6” hole from the formation junction and 7” liner shoe.
Laterally, D7.0 was planned to land 26/27 ft TVD below the sand top and continues at 89.8° along an azimuth of 287° to a total depth close to the top of the sand. The drain hole was initially targeted at the lower lobe of the upper sand at the heel of the well, and then slowly trans-verses into the upper lobe. The planned length of the drain hole was 1500 ft.
A 12¼” pilot hole/main hole was drilled to a total depth of 9568 ftah (7471 ft SS) to locations close to the proposed landing targets. It was designed to serve as a build section for each of the laterals, thereby minimizing the amount of hole to be plugged back. After running pipe conveyed wireline logs the hole was under-reamed to 14¾” from the shoe to 7307 ftah and to 17½” from 7307 ftah down to 7415 ftah in preparation for running the FORM Junction.
Based on the pilot hole evaluation the drain hole posi-tion in the D4.0 sand was adjusted upwards by 16 ft TVD to 6774 ft SS. The D7.0 landing was not changed. At this point it was decided to sidetrack 12¼” hole and land the well in the D7.0 sand before running casing.
The pilot hole was plugged back and sidetracked from 8281 ftah at approximately 60° inclination using a 12¼” PDC bit and a 2.4° AKO setting on the motor. Once the sidetrack had been kicked-off, build rates of 5.4 to 8.9° were used to land the well. The well was landed 1 ft TVD higher then prognoses at 7314 ft SS (8857 ftah). The formation junction was set with the 7” liner shoe at 8857 ftah. The 7” liner shoe was drilled with a steerable assembly comprising of 4¾” Mach 1XL motor and 4¾” MPR tool. A 6” PDC bit was used in conjunction with a thruster at the top of the BHA to improve sliding. The drain hole was proposed to be slanted and drilled within a +/-3 ft TVD window of 7312 ft to 7318 ft SS but due to stalling mud motor and erratic tool face there was difficulty sliding hence the angle was inching up in rotary mode. The WOB was decreased to between 0-2 Klb and time drilled with the aim of dropping the angle but the angle kept on creeping up hence it was decided to stop drilling to avoid hitting the roof.
The XL motor and thruster provided good directional control in general, the only exception being deflections
Ichenwo and Adewale 119 from the line when the mud motor was stalling while sliding and tool face that was erratic. The final total depth (TD) was 10162’ MD, 91.85 and 291.0° Azi, 7310’ SS and 3704’ vertical section. Altogether a total length of 1305 feet of produceable sand was drilled through the pay zone from the casing shoe to TD at 10162 ftah.
The 4.5’’ liner was inadvertently dropped in hole while running in. All attempts to fish the liner were unsuccessful. A window was milled in the casing and an open-hole sidetrack was attempted. The well successfully kicked off from 8890 ft and an azimuthal turn was required to steer the well away from the fish. Final TD was 10359 ft MD, 90.0° Inc, 288.2°Az, 7316’ SS and 3913’ VS. A total of 1502 ft of produceable sand was drilled.
The purpose of this work is to evaluate a multilateral well drill onshore Niger Delta with D7.0 sand a target and design a procedure for accurate well placement and remain within the sweet spot (reservoir) using real-time resistivity, gamma and inclination data, thereby achieving optimal production of hydrocarbon from the reservoir. METHODS OF STUDY
Drilling, trajectory, and petro-physical measurements were the three types of data used in geo-steering well 61. The largest source of data uncertainty that affected the wellbore location was the depth control. The best way that was used to deal with this depth problem was to investigate the quality of offset wells before starting the project (Sclumberger, 1995).
Problems with petro-physical data were also compared. Several different resistivity devices were used. They were compared to each other and to wire-line resistivity measurements. This was com-pounded by the effect of anisotropy at high angle and the degree of invasion at the time when this measurement was taken. Modelling helps to reduce this confusion. The magnitude of anisotropy was not known until after the formation was drilled. This caused signi-ficant error in the model. Before conducting the pre-drill geo-steering analysis, the true resistivity, dip angle and the lithology need to be determined (Burgess et. al., 1988). The true resistivity and dip angle need to be to determine from the actual resistivity tool response (Bittar et al., 2007; Bittar, 2002).
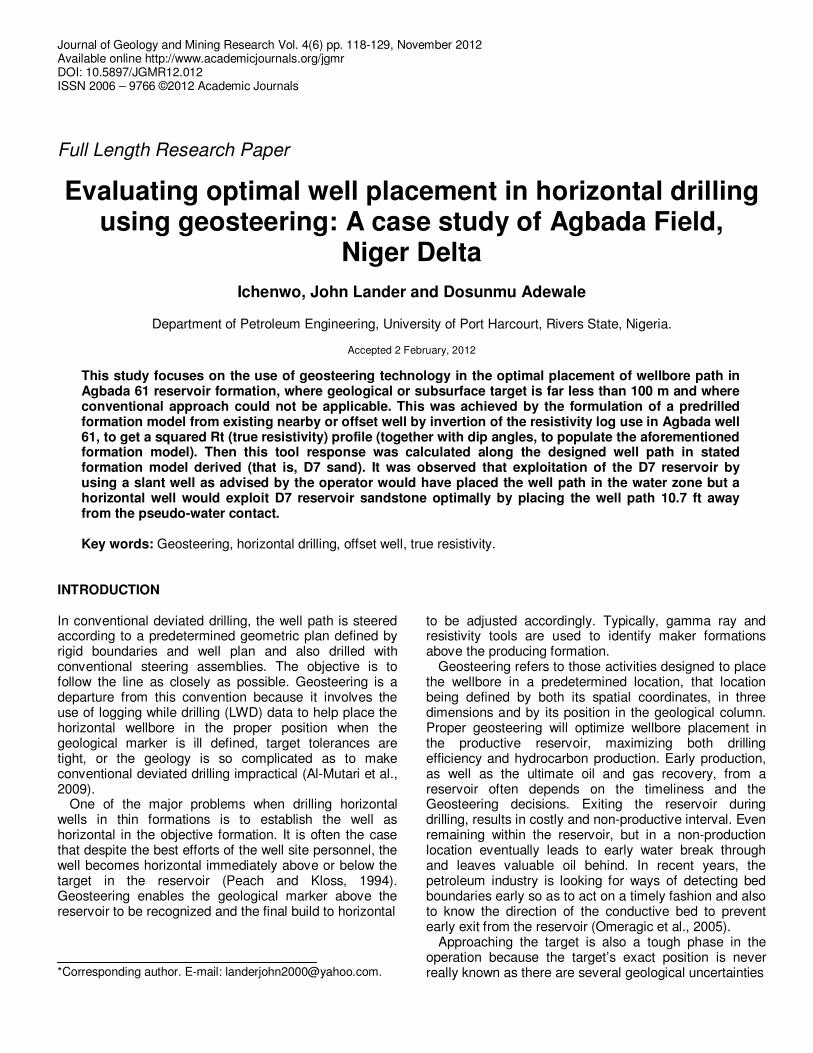
Estimates of the various lithologies are determined from the gamma ray log data, using Landers geo-steering software (Figure 1) and the flow chart for the extraction format is shown in Figure 2.
RESULTS AND DISCUSSION
Geosteering evaluation
Pre-well model was prepared using offset wire-line data from well 36, 51 and 58. Final models for both laterals were generated from the pilot hole MWD data (Table 1). Due to the high-hole inclination and formation dip the pilot hole data was converted to True stratigraphic thickness (TST) prior to modelling.
Lateral D7.0 build and land
The top D7.0 sand observed after sidetracking from the
120 J. Geol. Min. Res.
Figure 1. Lander geosteering software.
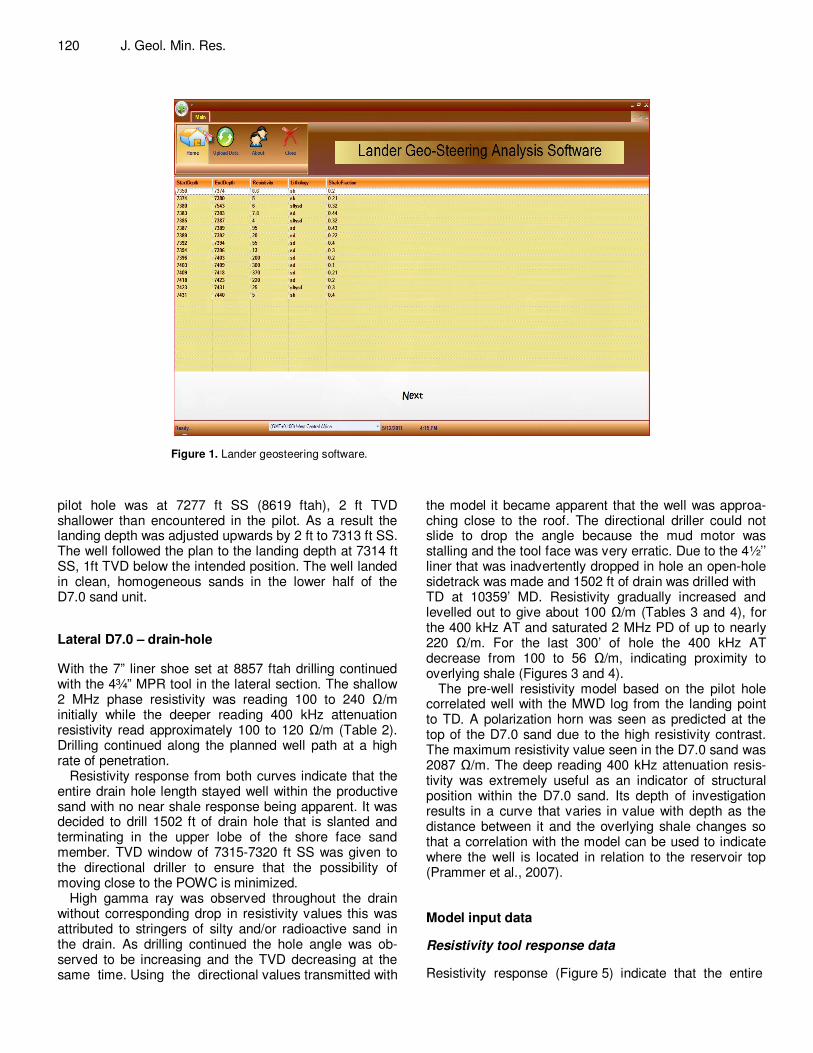
pilot hole was at 7277 ft SS (8619 ftah), 2 ft TVD shallower than encountered in the pilot. As a result the landing depth was adjusted upwards by 2 ft to 7313 ft SS. The well followed the plan to the landing depth at 7314 ft SS, 1ft TVD below the intended position. The well landed in clean, homogeneous sands in the lower half of the D7.0 sand unit.
Lateral D7.0 – drain-hole
With the 7” liner shoe set at 8857 ftah drilling continued with the 4¾” MPR tool in the lateral section. The shallow 2 MHz phase resistivity was reading 100 to 240 Ω/m initially while the deeper reading 400 kHz attenuation resistivity read approximately 100 to 120 Ω/m (Table 2). Drilling continued along the planned well path at a high rate of penetration.
Resistivity response from both curves indicate that the entire drain hole length stayed well within the productive sand with no near shale response being apparent. It was decided to drill 1502 ft of drain hole that is slanted and terminating in the upper lobe of the shore face sand member. TVD window of 7315-7320 ft SS was given to the directional driller to ensure that the possibility of moving close to the POWC is minimized.
High gamma ray was observed throughout the drain without corresponding drop in resistivity values this was attributed to stringers of silty and/or radioactive sand in the drain. As drilling continued the hole angle was ob-served to be increasing and the TVD decreasing at the same time. Using the directional values transmitted with
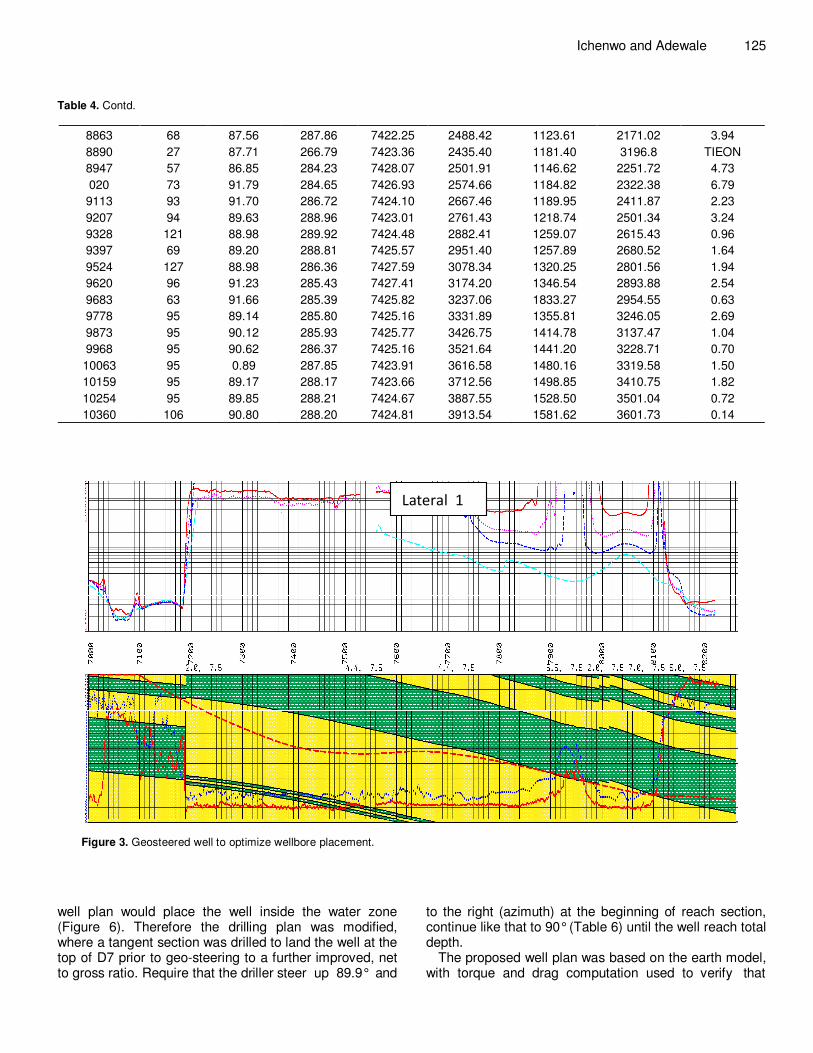
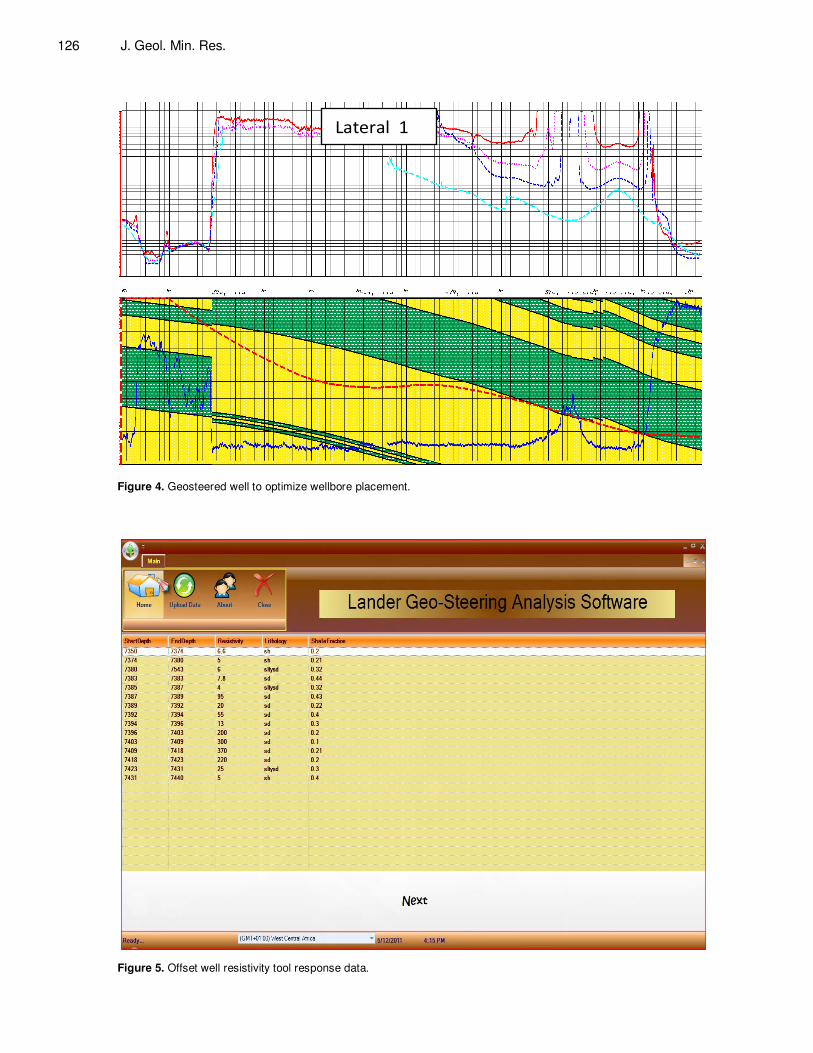
the model it became apparent that the well was approa-ching close to the roof. The directional driller could not slide to drop the angle because the mud motor was stalling and the tool face was very erratic. Due to the 4½’’ liner that was inadvertently dropped in hole an open-hole sidetrack was made and 1502 ft of drain was drilled with TD at 10359’ MD. Resistivity gradually increased and levelled out to give about 100 Ω/m (Tables 3 and 4), for the 400 kHz AT and saturated 2 MHz PD of up to nearly 220 Ω/m. For the last 300’ of hole the 400 kHz AT decrease from 100 to 56 Ω/m, indicating proximity to overlying shale (Figures 3 and 4).
The pre-well resistivity model based on the pilot hole correlated well with the MWD log from the landing point to TD. A polarization horn was seen as predicted at the top of the D7.0 sand due to the high resistivity contrast. The maximum resistivity value seen in the D7.0 sand was 2087 Ω/m. The deep reading 400 kHz attenuation resis-tivity was extremely useful as an indicator of structural position within the D7.0 sand. Its depth of investigation results in a curve that varies in value with depth as the distance between it and the overlying shale changes so that a correlation with the model can be used to indicate where the well is located in relation to the reservoir top (Prammer et al., 2007). Model input data
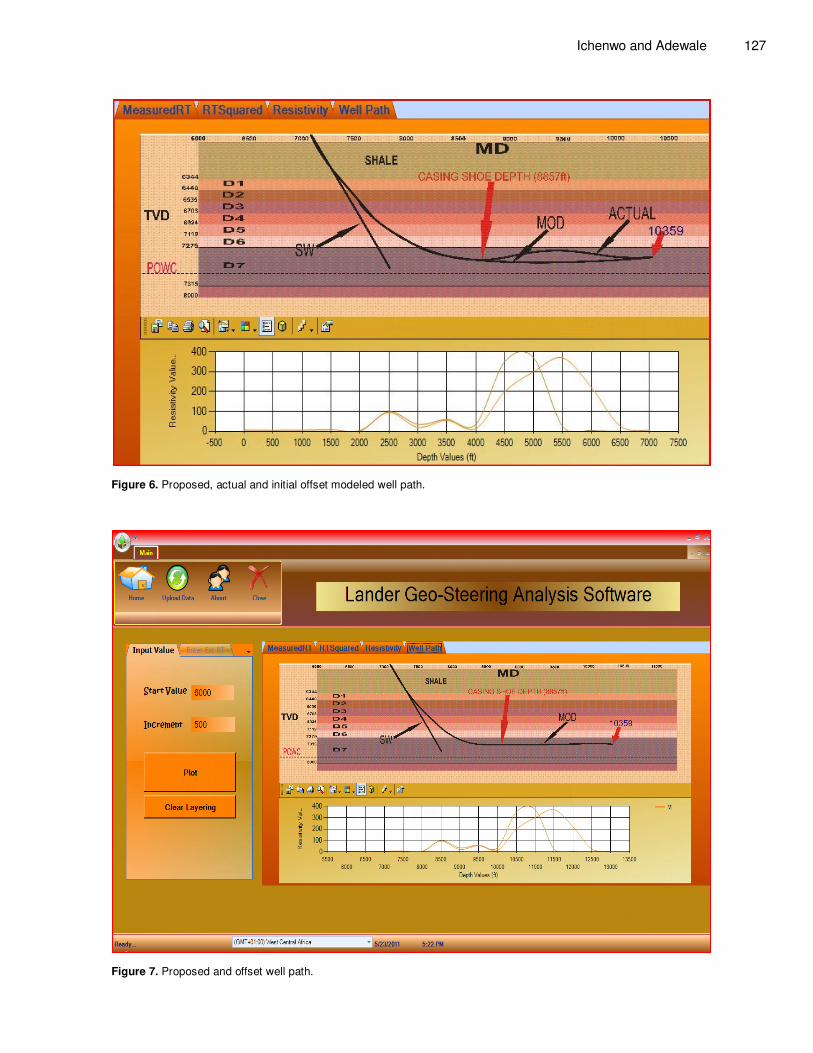
Resistivity tool response data
Resistivity response (Figure 5) indicate that the entire

Ichenwo and Adewale 121
Dip and formation
Properties
Adjust
du, dv
Consistency
?
(TVD, MD)
(TVD, MD)
3D
Validation
U uk-1
+du
U uk-1
+du
Layered model
Forward model (Rt, Di, Log)
Feature
Extraction
(u0, v
0)
(Log)
No
Yes
Figure 2. Flow chart for extraction format.
Table 1. Pilot hole / main hole formation tops.
Formation top Pilot hole/main hole Different Prognosed tops
D1.0 MD TVD SS +/- TVD SS
D2.0 6610 6452 6344
D3.0 6916 6643 6535
D4.0 7283 6811 6703 -32 6843 6735
D5.0 7867 7032 6924
D6.0 8230 7219 7111
D7.0 8634 7387 7279 +29 7358 7250
drain hole length stayed well within the productive sand with no near shale response being apparent. It was decided to drill 1502 ft of drain hole and terminating in the D7. A TVD window of 7276-7282 (that is, ± 3 ft) instead of the ± 5 ft (Table 5) that was given to the directional driller to ensure that the possibility of removing close to
the POWC is minimized. Low gamma ray was observed throughout the drain length without corresponding drop in resistivity values, thus was attributed to clean sand in the drain hole section.
The well landed 35 ft the top of D7 sand. It was evident from the correlation at landing that following the original
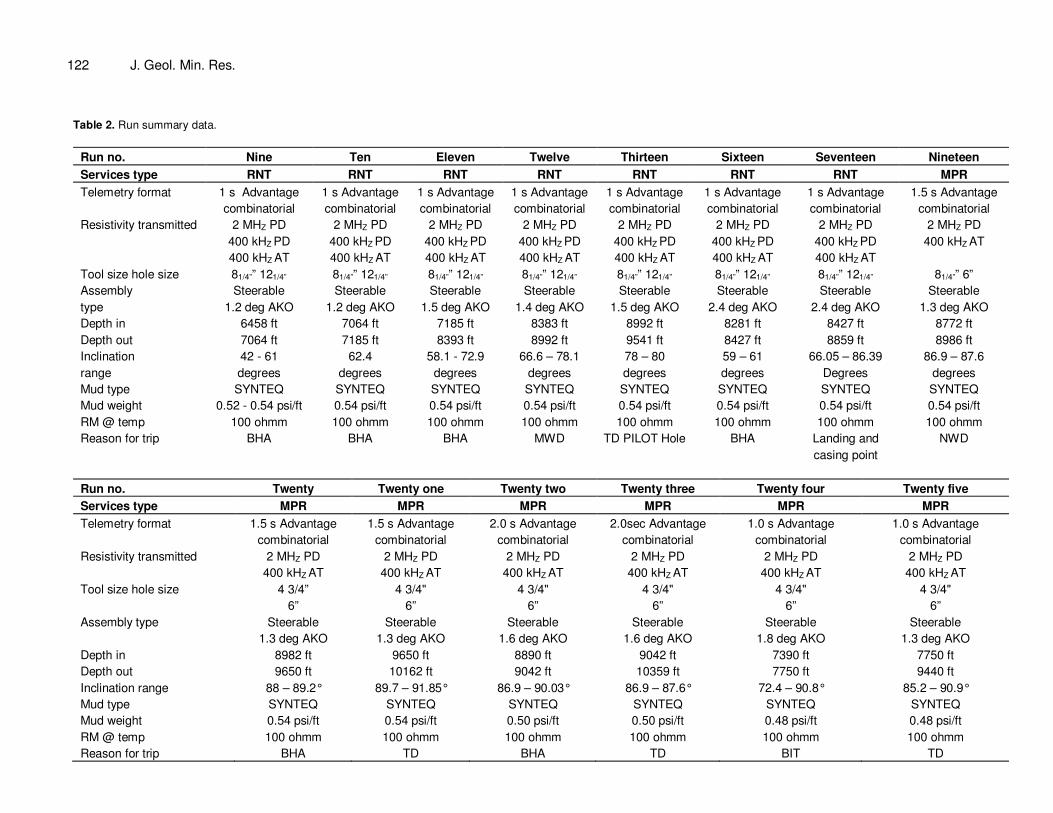
122 J. Geol. Min. Res. Table 2. Run summary data.
Run no. Nine Ten Eleven Twelve Thirteen Sixteen Seventeen Nineteen
Services type RNT RNT RNT RNT RNT RNT RNT MPR
Telemetry format 1 s Advantage
combinatorial
1 s Advantage
combinatorial
1 s Advantage
combinatorial
1 s Advantage
combinatorial
1 s Advantage
combinatorial
1 s Advantage
combinatorial
1 s Advantage
combinatorial
1.5 s Advantage
combinatorial
Resistivity transmitted 2 MHZ PD
400 kHZ PD
400 kHZ AT
2 MHZ PD
400 kHZ PD
400 kHZ AT
2 MHZ PD
400 kHZ PD
400 kHZ AT
2 MHZ PD
400 kHZ PD
400 kHZ AT
2 MHZ PD
400 kHZ PD
400 kHZ AT
2 MHZ PD
400 kHZ PD
400 kHZ AT
2 MHZ PD
400 kHZ PD
400 kHZ AT
2 MHZ PD
400 kHZ AT
Tool size hole size 81/4”” 121/4” 81/4”” 121/4” 81/4”” 121/4” 81/4”” 121/4” 81/4”” 121/4” 81/4”” 121/4” 81/4”” 121/4” 81/4”” 6”
Assembly
type
Steerable
1.2 deg AKO
Steerable
1.2 deg AKO
Steerable
1.5 deg AKO
Steerable
1.4 deg AKO
Steerable
1.5 deg AKO
Steerable
2.4 deg AKO
Steerable
2.4 deg AKO
Steerable
1.3 deg AKO
Depth in 6458 ft 7064 ft 7185 ft 8383 ft 8992 ft 8281 ft 8427 ft 8772 ft
Depth out 7064 ft 7185 ft 8393 ft 8992 ft 9541 ft 8427 ft 8859 ft 8986 ft
Inclination
range
42 - 61
degrees
62.4
degrees
58.1 - 72.9
degrees
66.6 – 78.1
degrees
78 – 80
degrees
59 – 61
degrees
66.05 – 86.39
Degrees
86.9 – 87.6
degrees
Mud type SYNTEQ SYNTEQ SYNTEQ SYNTEQ SYNTEQ SYNTEQ SYNTEQ SYNTEQ
Mud weight 0.52 - 0.54 psi/ft 0.54 psi/ft 0.54 psi/ft 0.54 psi/ft 0.54 psi/ft 0.54 psi/ft 0.54 psi/ft 0.54 psi/ft
RM @ temp 100 ohmm 100 ohmm 100 ohmm 100 ohmm 100 ohmm 100 ohmm 100 ohmm 100 ohmm
Reason for trip BHA BHA BHA MWD TD PILOT Hole BHA Landing and
casing point
NWD
Run no. Twenty Twenty one Twenty two Twenty three Twenty four Twenty five
Services type MPR MPR MPR MPR MPR MPR
Telemetry format 1.5 s Advantage
combinatorial
1.5 s Advantage
combinatorial
2.0 s Advantage
combinatorial
2.0sec Advantage
combinatorial
1.0 s Advantage
combinatorial
1.0 s Advantage
combinatorial
Resistivity transmitted 2 MHZ PD
400 kHZ AT
2 MHZ PD
400 kHZ AT
2 MHZ PD
400 kHZ AT
2 MHZ PD
400 kHZ AT
2 MHZ PD
400 kHZ AT
2 MHZ PD
400 kHZ AT
Tool size hole size 4 3/4”
6”
4 3/4"
6”
4 3/4"
6”
4 3/4"
6”
4 3/4"
6”
4 3/4"
6”
Assembly type Steerable
1.3 deg AKO
Steerable
1.3 deg AKO
Steerable
1.6 deg AKO
Steerable
1.6 deg AKO
Steerable
1.8 deg AKO
Steerable
1.3 deg AKO
Depth in 8982 ft 9650 ft 8890 ft 9042 ft 7390 ft 7750 ft
Depth out 9650 ft 10162 ft 9042 ft 10359 ft 7750 ft 9440 ft
Inclination range 88 – 89.2° 89.7 – 91.85° 86.9 – 90.03° 86.9 – 87.6° 72.4 – 90.8° 85.2 – 90.9°
Mud type SYNTEQ SYNTEQ SYNTEQ SYNTEQ SYNTEQ SYNTEQ
Mud weight 0.54 psi/ft 0.54 psi/ft 0.50 psi/ft 0.50 psi/ft 0.48 psi/ft 0.48 psi/ft
RM @ temp 100 ohmm 100 ohmm 100 ohmm 100 ohmm 100 ohmm 100 ohmm
Reason for trip BHA TD BHA TD BIT TD
Ichenwo and Adewale 123
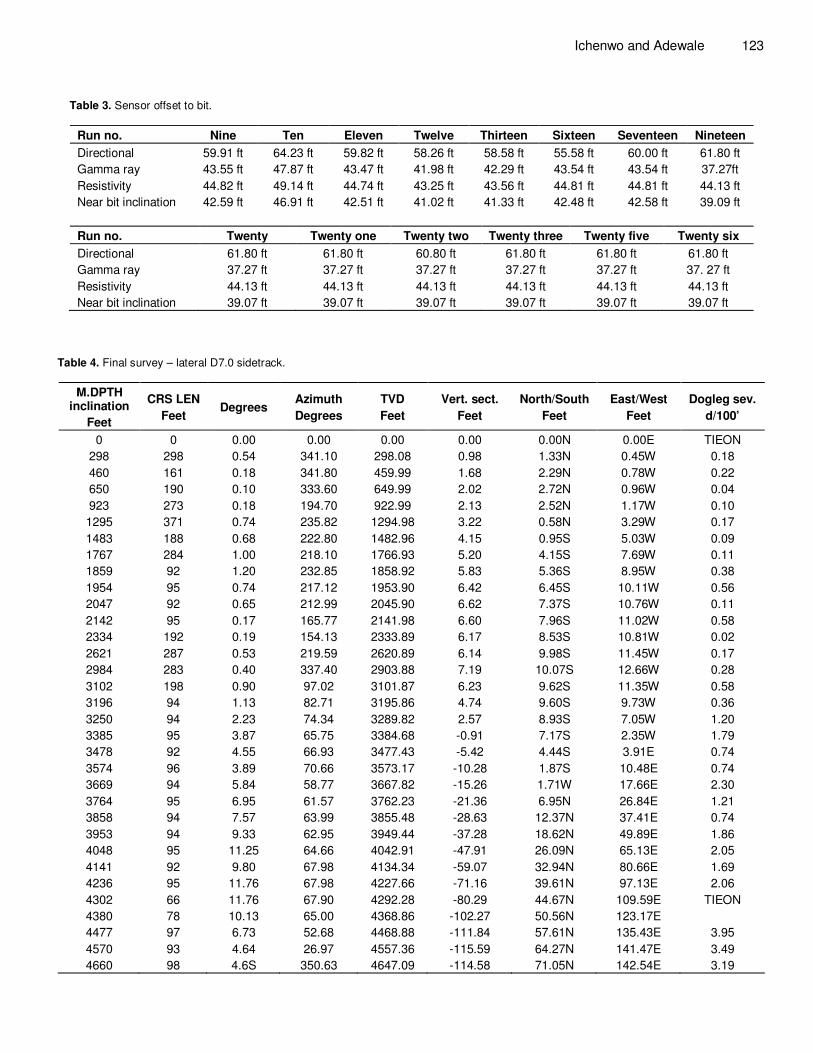
Table 3. Sensor offset to bit.
Run no. Nine Ten Eleven Twelve Thirteen Sixteen Seventeen Nineteen
Directional 59.91 ft 64.23 ft 59.82 ft 58.26 ft 58.58 ft 55.58 ft 60.00 ft 61.80 ft
Gamma ray 43.55 ft 47.87 ft 43.47 ft 41.98 ft 42.29 ft 43.54 ft 43.54 ft 37.27ft
Resistivity 44.82 ft 49.14 ft 44.74 ft 43.25 ft 43.56 ft 44.81 ft 44.81 ft 44.13 ft
Near bit inclination 42.59 ft 46.91 ft 42.51 ft 41.02 ft 41.33 ft 42.48 ft 42.58 ft 39.09 ft
Run no. Twenty Twenty one Twenty two Twenty three Twenty five Twenty six
Directional 61.80 ft 61.80 ft 60.80 ft 61.80 ft 61.80 ft 61.80 ft
Gamma ray 37.27 ft 37.27 ft 37.27 ft 37.27 ft 37.27 ft 37. 27 ft
Resistivity 44.13 ft 44.13 ft 44.13 ft 44.13 ft 44.13 ft 44.13 ft
Near bit inclination 39.07 ft 39.07 ft 39.07 ft 39.07 ft 39.07 ft 39.07 ft
Table 4. Final survey – lateral D7.0 sidetrack.
M.DPTH inclination
Feet
CRS LEN
Feet Degrees
Azimuth
Degrees
TVD
Feet
Vert. sect.
Feet
North/South
Feet
East/West
Feet
Dogleg sev.
d/100’
0 0 0.00 0.00 0.00 0.00 0.00N 0.00E TIEON
298 298 0.54 341.10 298.08 0.98 1.33N 0.45W 0.18
460 161 0.18 341.80 459.99 1.68 2.29N 0.78W 0.22
650 190 0.10 333.60 649.99 2.02 2.72N 0.96W 0.04
923 273 0.18 194.70 922.99 2.13 2.52N 1.17W 0.10
1295 371 0.74 235.82 1294.98 3.22 0.58N 3.29W 0.17
1483 188 0.68 222.80 1482.96 4.15 0.95S 5.03W 0.09
1767 284 1.00 218.10 1766.93 5.20 4.15S 7.69W 0.11
1859 92 1.20 232.85 1858.92 5.83 5.36S 8.95W 0.38
1954 95 0.74 217.12 1953.90 6.42 6.45S 10.11W 0.56
2047 92 0.65 212.99 2045.90 6.62 7.37S 10.76W 0.11
2142 95 0.17 165.77 2141.98 6.60 7.96S 11.02W 0.58
2334 192 0.19 154.13 2333.89 6.17 8.53S 10.81W 0.02
2621 287 0.53 219.59 2620.89 6.14 9.98S 11.45W 0.17
2984 283 0.40 337.40 2903.88 7.19 10.07S 12.66W 0.28
3102 198 0.90 97.02 3101.87 6.23 9.62S 11.35W 0.58
3196 94 1.13 82.71 3195.86 4.74 9.60S 9.73W 0.36
3250 94 2.23 74.34 3289.82 2.57 8.93S 7.05W 1.20
3385 95 3.87 65.75 3384.68 -0.91 7.17S 2.35W 1.79
3478 92 4.55 66.93 3477.43 -5.42 4.44S 3.91E 0.74
3574 96 3.89 70.66 3573.17 -10.28 1.87S 10.48E 0.74
3669 94 5.84 58.77 3667.82 -15.26 1.71W 17.66E 2.30
3764 95 6.95 61.57 3762.23 -21.36 6.95N 26.84E 1.21
3858 94 7.57 63.99 3855.48 -28.63 12.37N 37.41E 0.74
3953 94 9.33 62.95 3949.44 -37.28 18.62N 49.89E 1.86
4048 95 11.25 64.66 4042.91 -47.91 26.09N 65.13E 2.05
4141 92 9.80 67.98 4134.34 -59.07 32.94N 80.66E 1.69
4236 95 11.76 67.98 4227.66 -71.16 39.61N 97.13E 2.06
4302 66 11.76 67.90 4292.28 -80.29 44.67N 109.59E TIEON
4380 78 10.13 65.00 4368.86 -102.27 50.56N 123.17E
4477 97 6.73 52.68 4468.88 -111.84 57.61N 135.43E 3.95
4570 93 4.64 26.97 4557.36 -115.59 64.27N 141.47E 3.49
4660 98 4.6S 350.63 4647.09 -114.58 71.05N 142.54E 3.19

124 J. Geol. Min. Res. Table 4. Contd.
4764 104 3.92 325.95 4750.81 -109.92 78.07N 139.87E 1.84
4852 88 2.77 271.97 4838.68 -105.52 80.63N 136.06E 3.65
4947 95 3.85 266.50 4933.56 -100.95 80.55N 131.25E 0.41
5043 96 3.27 268.85 5029.41 -95.96 80.30N 125.96E 0.25
5139 96 3.86 289.84 5125.23 -90.17 81.26N 120.17E 1.48
5232 93 4.32 293.38 5217.99 -83.56 83.67N 114.00E 0.60
5325 93 5.45 294.23 5310.69 -75.69 86.87N 106.75E 1.22
5423 5423 8.39 299.81 5483.64 395.01 197.03N 343.9SW 0.15
5520 97 11.13 302.33 5499.23 411.35 205.55N 357.9SW 2.86
5615 95 12.15 301.71 5592.27 430.38 215.72N 374.21W 1.03
5710 95 13.49 304.14 5684.92 451.25 227.19N 391.88W 1.52
5885 95 15.38 307.39 5776.90 474.51 241.06N 411.07W 2.16
5981 96 21.34 309.65 5867.83 524.26 268.21N 434.9W 6.77
5996 95 26.17 309.34 5954.68 541.69 284.78N 464.78W 4.56
6091 95 29.47 307.22 6038.61 584.86 312.20N 499.6W 3.63
6184 93 32.12 303.25 6118.50 631.71 338.60N 538.5W 3.59
6278 94 34.84 300.37 6196.92 683.20 305.88N 582.58W 3.35
6374 96 38.17 299.61 6274.05 740.00 395.41N 632.04W 3.50
6470 96 41.93 298.88 6347.53 881.69 425.56N 685.94W 3.95
6567 97 44.99 298.50 6417.93 868.27 457.57N 744.47W 3.16
6662 95 47.77 297.94 6483.46 936.94 498.08N 805.07W 2.96
6757 95 50.95 297.71 6545.32 1008.94 523.72N 868.82W 3.35
6848 91 54.30 298.05 6600.24 1081.39 557.65N 932.94W 4.24
6944 95 58.02 295.69 6653.34 1161.22 595.65N 1003.29W 3.40
7033 89 61.00 298.71 6692.49 1237.75 632.48N 1070.55W 3.35
7155 82 62.40 299.26 6737.37 1309.78 687.46N 113.78W 1.81
7235 119 66.62 300.30 6789.08 1417.71 721.27N 1227.65W 3.52
7340 105 71.92 301.13 6826.15 1515.41 771.42N 1312.07W 5.10
7435 96 72.98 300.72 6855.17 1888.45 818.44N 1990.58W 1.10
3531 94 70.64 301.11 6884.96 1695.18 884.78N 1467.96W 2.51
7625 94 67.16 299.71 6918.87 1783.46 909.16N 1543.55W 3.58
7720 94 63.70 296.22 6958.38 1869.71 949.69N 1619.81W 4.94
7816 96 61.46 289.52 7002.63 1954.79 982.83N 1698.24W 6.62
7909 92 60.15 288.39 7047.99 2035.51 1000.21N 1775.02W 1.76
8006 97 58.83 286.47 7097.24 2118.32 1834.24N 1856.74W 2.18
8101 95 59.11 285.27 7145.21 2198.67 1850.50N 1933.04W 1.12
8195 94 58.14 287.30 7195.15 2277.97 1079.00N 2010.07W 2.11
8286 91 59.47 287.37 7245.57 1912.05 997.51N 1644.17W TIEON
8358 72 61.07 286.84 7282.27 1930.55 1815.90N 1703.93W 2.31
8453 95 66.05 283.83 7324.57 2015.51 1838.34N 1785.93W 5.96
8553 100 68.75 278.76 7363.01 2187.24 1856.37N 1876.43W 5.41
8648 95 73.87 281.64 7393.44 2183.47 1872.33N 1984.60W 6.10
8707 89 81.39 283.32 7412.49 2283.80 1891.12N 2249.77W 8.65
8795 58 86.39 284.65 7418.66 2340.55 1105.06N 2105.71W 8.92
8863 68 87.56 287.06 7422.25 2408.42 1123.61N 2171.02W 3.94
8286 8286 59.47 287.37 7246.57 1912.05 997.51 1644 TIEON
8358 72 61.07 286.84 7282.27 1930.55 1815.90 1703.90 2.31
8453 95 66.05 283.83 7324.57 2015.51 1838.34 1785.93 5.96
8553 100 68.05 278.76 7363.01 2487.24 1856.37 1876.43 5.41
8648 95 73.87 281.64 7393.44 2196.47 1872.33 1964.9 6.10
8737 89 81.39 283.362 7412.49 2283.00 1891.12 2846.77 8.65
8795 58 8639 284.65 7418.66 2340.55 1105.06 2105.71 8.92
Ichenwo and Adewale 125 Table 4. Contd.
8863 68 87.56 287.86 7422.25 2488.42 1123.61 2171.02 3.94
8890 27 87.71 266.79 7423.36 2435.40 1181.40 3196.8 TIEON
8947 57 86.85 284.23 7428.07 2501.91 1146.62 2251.72 4.73
020 73 91.79 284.65 7426.93 2574.66 1184.82 2322.38 6.79
9113 93 91.70 286.72 7424.10 2667.46 1189.95 2411.87 2.23
9207 94 89.63 288.96 7423.01 2761.43 1218.74 2501.34 3.24
9328 121 88.98 289.92 7424.48 2882.41 1259.07 2615.43 0.96
9397 69 89.20 288.81 7425.57 2951.40 1257.89 2680.52 1.64
9524 127 88.98 286.36 7427.59 3078.34 1320.25 2801.56 1.94
9620 96 91.23 285.43 7427.41 3174.20 1346.54 2893.88 2.54
9683 63 91.66 285.39 7425.82 3237.06 1833.27 2954.55 0.63
9778 95 89.14 285.80 7425.16 3331.89 1355.81 3246.05 2.69
9873 95 90.12 285.93 7425.77 3426.75 1414.78 3137.47 1.04
9968 95 90.62 286.37 7425.16 3521.64 1441.20 3228.71 0.70
10063 95 0.89 287.85 7423.91 3616.58 1480.16 3319.58 1.50
10159 95 89.17 288.17 7423.66 3712.56 1498.85 3410.75 1.82
10254 95 89.85 288.21 7424.67 3887.55 1528.50 3501.04 0.72
10360 106 90.80 288.20 7424.81 3913.54 1581.62 3601.73 0.14
Lateral 1
Figure 3. Geosteered well to optimize wellbore placement.
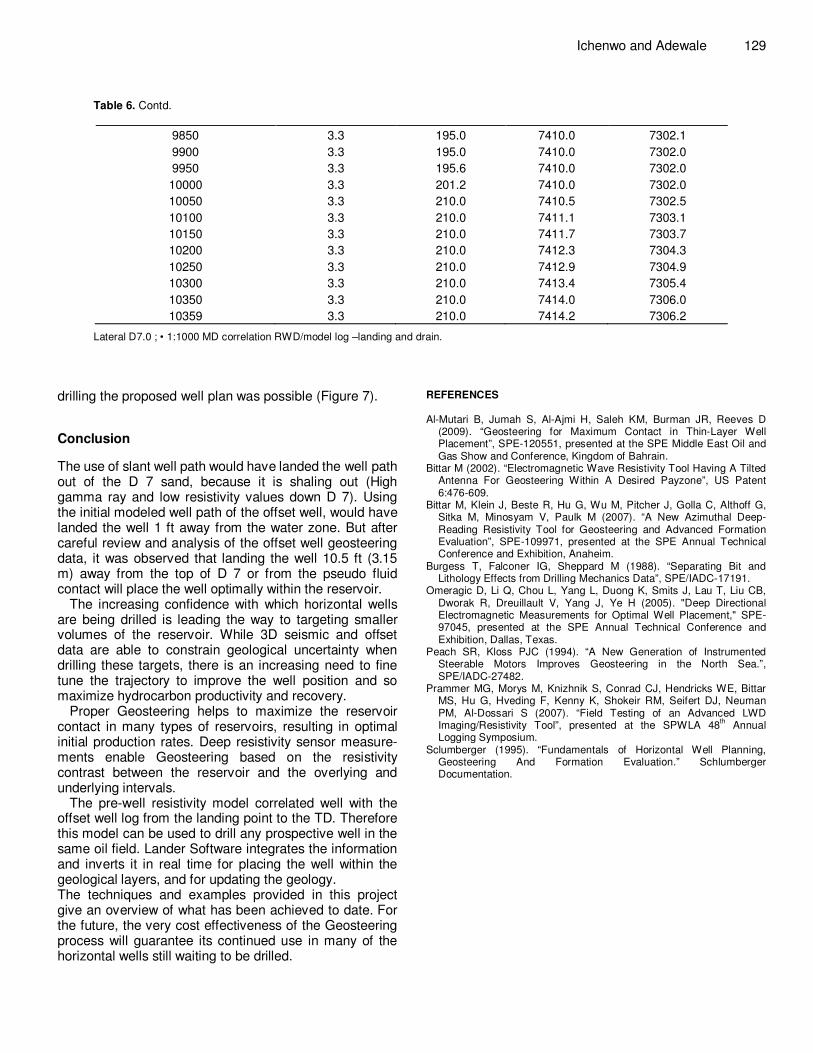
well plan would place the well inside the water zone (Figure 6). Therefore the drilling plan was modified, where a tangent section was drilled to land the well at the top of D7 prior to geo-steering to a further improved, net to gross ratio. Require that the driller steer up 89.9° and
to the right (azimuth) at the beginning of reach section, continue like that to 90° (Table 6) until the well reach total depth.
The proposed well plan was based on the earth model, with torque and drag computation used to verify that
126 J. Geol. Min. Res.
Lateral 1
Figure 4. Geosteered well to optimize wellbore placement.
Figure 5. Offset well resistivity tool response data.
Ichenwo and Adewale 127
Figure 6. Proposed, actual and initial offset modeled well path.
Figure 7. Proposed and offset well path.

128 J. Geol. Min. Res.
Table 5. Final resistivity profile – lateral D7.0.
Profile based on well 61 pilot hole MWD Log
Start depth Ftss End depth fitness RTohm m Lithology
7350 7374 6.6 sh
7374 7380 5 sh
7380 7383 6 slty sd
7383 7385 7.8 sd
7385 7387 4 sltst
7387 7389 95 sd
7389 7392 20 sd
7392 7394 55 sd
7394 7396 13 sd
7396 7403 200 Sd
7403 7409 300 Sd
7409 7418 370 Sd
7418 7423 220 Sd
7423 7431 25 Slty sd
7431 7400 5 Sh
Table 6. Final formation dip breakdown.
These estimated bed dips for the D7.0 sand unit were derived real-time from
the geosteering model. Measured depth (ftah)
Formation dip (degree)
Dip Azimuth (degrees)
Reservoir top (ft TVD)
Reservoir top (ftss)
8500 4.5 275.0 7376.4 7268.4
8550 4.5 275.0 7380.1 7272.1
8600 4.5 275.0 7383.8 7275.8
8650 4.3 264.0 7387.4 7279.4
8700 4.1 249.1 7390.6 7282.6
8750 3.9 235.6 7393.2 7285.2
8800 3.8 232.7 7395.3 7287.3
8850 3.8 229.8 7397.3 7289.3
8900 3.7 227.0 7399.0 7291.0
8950 3.6 224.1 7400.6 7292.6
9000 3.6 221.2 7402.1 7294.1
9050 3.5 218.3 7403.4 7295.4
9100 3.4 215.4 7404.4 7296.4
9150 3.4 212.5 7405.3 7297.3
9200 3.3 210.0 7405.9 7297.9
9250 3.3 210.0 7406.5 7298.5
9300 3.3 210.0 7407.0 7299.0
9350 3.3 210.0 7408.1 7300.1
9400 3.3 210.0 7408.7 7300.7
9450 3.3 210.0 7409.3 7301.3
9500 3.3 210.0 7410.0 7302.0
9550 3.3 208.3 7410.2 7302.2
9600 3.3 195.0 7410.2 7302.2
9650 3.3 195.0 7410.2 7302.2
9700 3.3 195.0 7410.1 7302.1
9750 3.3 195.0 7410.1 7302.1
9800 3.3 195.0 7410.1 7302.1
Ichenwo and Adewale 129
Table 6. Contd.
9850 3.3 195.0 7410.0 7302.1
9900 3.3 195.0 7410.0 7302.0
9950 3.3 195.6 7410.0 7302.0
10000 3.3 201.2 7410.0 7302.0
10050 3.3 210.0 7410.5 7302.5
10100 3.3 210.0 7411.1 7303.1
10150 3.3 210.0 7411.7 7303.7
10200 3.3 210.0 7412.3 7304.3
10250 3.3 210.0 7412.9 7304.9
10300 3.3 210.0 7413.4 7305.4
10350 3.3 210.0 7414.0 7306.0
10359 3.3 210.0 7414.2 7306.2
Lateral D7.0 ; • 1:1000 MD correlation RWD/model log –landing and drain. drilling the proposed well plan was possible (Figure 7).
Conclusion
The use of slant well path would have landed the well path
out of the D 7 sand, because it is shaling out (High gamma ray and low resistivity values down D 7). Using the initial modeled well path of the offset well, would have landed the well 1 ft away from the water zone. But after careful review and analysis of the offset well geosteering data, it was observed that landing the well 10.5 ft (3.15 m) away from the top of D 7 or from the pseudo fluid contact will place the well optimally within the reservoir.
The increasing confidence with which horizontal wells are being drilled is leading the way to targeting smaller volumes of the reservoir. While 3D seismic and offset data are able to constrain geological uncertainty when drilling these targets, there is an increasing need to fine tune the trajectory to improve the well position and so maximize hydrocarbon productivity and recovery.
Proper Geosteering helps to maximize the reservoir contact in many types of reservoirs, resulting in optimal initial production rates. Deep resistivity sensor measure-ments enable Geosteering based on the resistivity contrast between the reservoir and the overlying and underlying intervals.
The pre-well resistivity model correlated well with the offset well log from the landing point to the TD. Therefore this model can be used to drill any prospective well in the same oil field. Lander Software integrates the information and inverts it in real time for placing the well within the geological layers, and for updating the geology. The techniques and examples provided in this project give an overview of what has been achieved to date. For the future, the very cost effectiveness of the Geosteering process will guarantee its continued use in many of the horizontal wells still waiting to be drilled.
REFERENCES Al-Mutari B, Jumah S, Al-Ajmi H, Saleh KM, Burman JR, Reeves D
(2009). “Geosteering for Maximum Contact in Thin-Layer Well Placement”, SPE-120551, presented at the SPE Middle East Oil and Gas Show and Conference, Kingdom of Bahrain.
Bittar M (2002). “Electromagnetic Wave Resistivity Tool Having A Tilted Antenna For Geosteering Within A Desired Payzone”, US Patent 6:476-609.
Bittar M, Klein J, Beste R, Hu G, Wu M, Pitcher J, Golla C, Althoff G, Sitka M, Minosyam V, Paulk M (2007). “A New Azimuthal Deep-Reading Resistivity Tool for Geosteering and Advanced Formation Evaluation”, SPE-109971, presented at the SPE Annual Technical Conference and Exhibition, Anaheim.
Burgess T, Falconer IG, Sheppard M (1988). “Separating Bit and Lithology Effects from Drilling Mechanics Data”, SPE/IADC-17191.
Omeragic D, Li Q, Chou L, Yang L, Duong K, Smits J, Lau T, Liu CB, Dworak R, Dreuillault V, Yang J, Ye H (2005). "Deep Directional Electromagnetic Measurements for Optimal Well Placement," SPE-97045, presented at the SPE Annual Technical Conference and Exhibition, Dallas, Texas.
Peach SR, Kloss PJC (1994). “A New Generation of Instrumented Steerable Motors Improves Geosteering in the North Sea.”, SPE/IADC-27482.
Prammer MG, Morys M, Knizhnik S, Conrad CJ, Hendricks WE, Bittar MS, Hu G, Hveding F, Kenny K, Shokeir RM, Seifert DJ, Neuman PM, Al-Dossari S (2007). “Field Testing of an Advanced LWD Imaging/Resistivity Tool”, presented at the SPWLA 48
th Annual
Logging Symposium. Sclumberger (1995). “Fundamentals of Horizontal Well Planning,
Geosteering And Formation Evaluation.” Schlumberger Documentation.