europe and central asia (eca) affected capital...
TRANSCRIPT

A U S T R I A
C Z E C H R E P U B L I C
H U N G A R Y
P O L A N D
R O M A N I A
U K R A I N E
Banska Bystrica
Bratislava
Kosice
Nitra
Presov
Trencin
Trnava
Zilna
Bratislava
107.6 8.4 9 9.8
GDP (billions of $)
FLOOD
EARTHQUAKE
Negligible
75
1
Annual Average of Affected GDP (%)
There is a high correlation(r=0.95) between the
population and GDP of a province.
TOP AFFECTED PROVINCES
FLOOD EARTHQUAKEANNUAL AVERAGE OF AFFECTED GDP (%)
ANNUAL AVERAGE OF AFFECTED GDP (%)
TrnavaZilnaNitraBanska BystricaTrencinKosiceBratislavaPresov
75544221
BratislavaNitraTrnavaKosiceTrencinPresovBanska BystricaZilna
11100000
The Slovak Republic’s popula-tion and economy are exposed to earthquakes and floods,
with floods posing the greater risk. The model results for present-day risk shown in this risk profile are based on population and gross do-mestic product (GDP) estimates for 2015. The estimated damage caused by historical events is inflated to 2015 US dollars.
Just over half of the Slovak Republic’s population lives in urban environ-ments. The country’s GDP was ap-proximately US$86.4 billion in 2015, with more than 60 percent derived
Slovak Republic
EUROPE AND CENTRAL ASIA (ECA) RISK PROFILES
GDP $86.4 billion*
Population 5.4 million*
AFFECTED BY 100-YEAR FLOOD
AFFECTED BY 250-YEAR EARTHQUAKE
CAPITAL LOSS FROM 250-YEAR EARTHQUAKE
$10 billion (16%)
800,000 (15%)
$20 billion (20%)
700,000 (13%)
$2 billion (2%)
3 (<1%)
*2015 estimates
from services, most of the remainder generated by industry, and agricul-ture making a small contribution. The Slovak Republic’s per capita GDP was $16,000.
This map displays GDP by province in the Slovak Republic, with greater color saturation indicating greater GDP within a province. The blue cir-cles indicate the risk of experiencing floods and the orange circles the risk of earthquakes in terms of normal-ized annual average of affected GDP. The largest circles represent the greatest normalized risk. The risk is
estimated using flood and earthquake risk models.
The table displays the provinces at greatest normalized risk for each peril. In relative terms, as shown in the table, the province at greatest risk of floods is Trnava, and the one at greatest risk of earthquakes is Bratislava. In absolute terms, the province at greatest risk of floods is Trnava, and the one at greatest risk of earthquakes is Bratislava.
23
103
A U S T R I A
C Z E C H R E P U B L I C
H U N G A R Y
P O L A N D
R O M A N I A
U K R A I N E
Banska Bystrica
Bratislava
Kosice
Nitra
Presov
Trencin
Trnava
Zilna
BratislavaA U S T R I A
C Z E C H R E P U B L I C
H U N G A R Y
P O L A N D
R O M A N I A
U K R A I N E
Banska Bystrica
Bratislava
Kosice
Nitra
Presov
Trencin
Trnava
Zilna
Bratislava
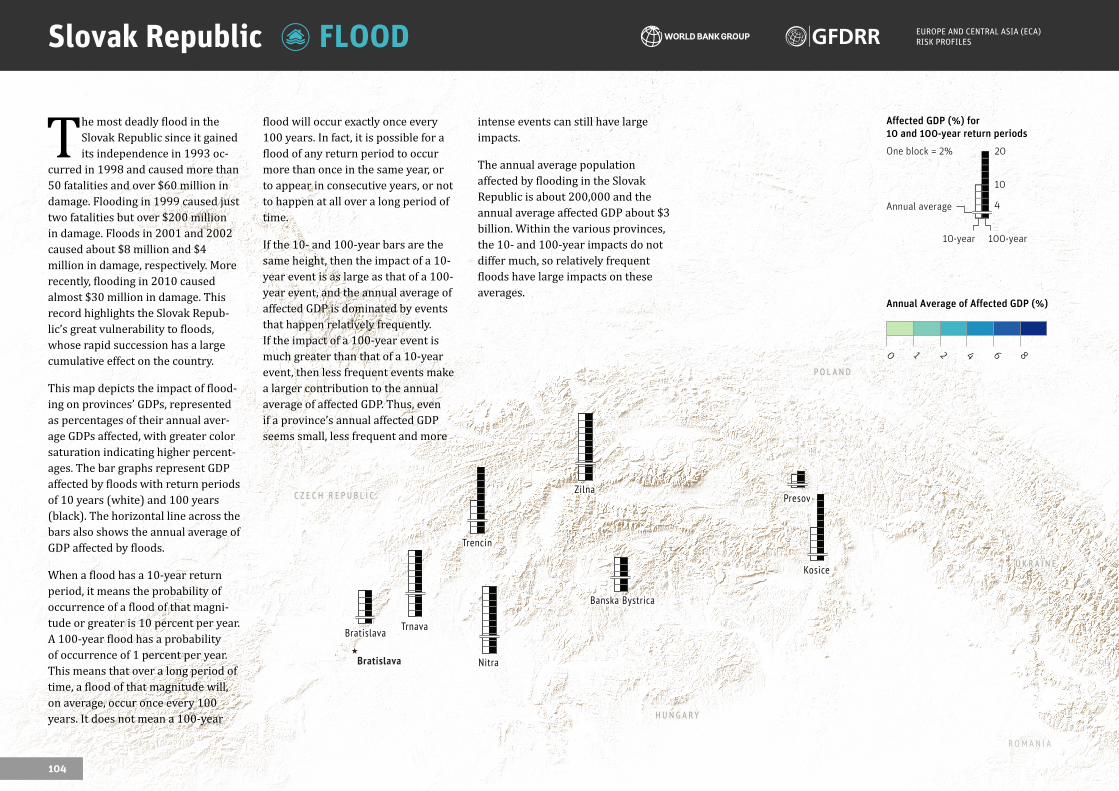
The most deadly flood in the Slovak Republic since it gained its independence in 1993 oc-
curred in 1998 and caused more than 50 fatalities and over $60 million in damage. Flooding in 1999 caused just two fatalities but over $200 million in damage. Floods in 2001 and 2002 caused about $8 million and $4 million in damage, respectively. More recently, flooding in 2010 caused almost $30 million in damage. This record highlights the Slovak Repub-lic’s great vulnerability to floods, whose rapid succession has a large cumulative effect on the country.
This map depicts the impact of flood-ing on provinces’ GDPs, represented as percentages of their annual aver-age GDPs affected, with greater color saturation indicating higher percent-ages. The bar graphs represent GDP affected by floods with return periods of 10 years (white) and 100 years (black). The horizontal line across the bars also shows the annual average of GDP affected by floods.
When a flood has a 10-year return period, it means the probability of occurrence of a flood of that magni-tude or greater is 10 percent per year. A 100-year flood has a probability of occurrence of 1 percent per year. This means that over a long period of time, a flood of that magnitude will, on average, occur once every 100 years. It does not mean a 100-year
EUROPE AND CENTRAL ASIA (ECA) RISK PROFILESFLOODSlovak Republic
0 1 2 4 8
Annual Average of Affected GDP (%)
6
20
10
4
Affected GDP (%) for
10 and 100-year return periods
Annual average
10-year 100-year
One block = 2%
flood will occur exactly once every 100 years. In fact, it is possible for a flood of any return period to occur more than once in the same year, or to appear in consecutive years, or not to happen at all over a long period of time.
If the 10- and 100-year bars are the same height, then the impact of a 10-year event is as large as that of a 100-year event, and the annual average of affected GDP is dominated by events that happen relatively frequently. If the impact of a 100-year event is much greater than that of a 10-year event, then less frequent events make a larger contribution to the annual average of affected GDP. Thus, even if a province’s annual affected GDP seems small, less frequent and more
intense events can still have large impacts.
The annual average population affected by flooding in the Slovak Republic is about 200,000 and the annual average affected GDP about $3 billion. Within the various provinces, the 10- and 100-year impacts do not differ much, so relatively frequent floods have large impacts on these averages.
104

A U S T R I A
C Z E C H R E P U B L I C
H U N G A R Y
P O L A N D
R O M A N I A
U K R A I N E
Banska Bystrica
Bratislava
Kosice
Nitra
Presov
Trencin
Trnava
Zilna
Bratislava
EUROPE AND CENTRAL ASIA (ECA) RISK PROFILESEARTHQUAKE
0 1 2 4 8
Annual Average of Affected GDP (%)
6
10
5
2
Affected GDP (%) for
10 and 100-year return periods
Annual average
10-year 100-year
One block = 1%The most significant earthquake since 1900 to affect the Slovak Republic occurred in 1906,
while one of the earliest known occurred in 1443, near Banska Stiavnica.
This map depicts the impact of earthquakes on provinces’ GDPs, represented as percentages of their annual average GDPs affected, with greater color saturation indicating higher percentages. The bar graphs represent GDP affected by earth-quakes with return periods of 10 years (white) and 100 years (black). The horizontal line across the bars also shows the annual average of GDP affected by earthquakes.
When an earthquake has a 10-year return period, it means the probabil-ity of occurrence of an earthquake of that magnitude or greater is 10 percent per year. A 100-year earth-quake has a probability of occurrence of 1 percent per year. This means that over a long period of time, an earthquake of that magnitude will, on average, occur once every 100 years. It does not mean a 100-year earth-quake will occur exactly once every 100 years. In fact, it is possible for an earthquake of any return period to occur more than once in the same year, or to appear in consecutive years, or not to happen at all over a long period of time.
If the 10- and 100-year bars are the same height, then the impact of a 10-year event is as large as that of a 100-year event, and the annual average of affected GDP is dominated by events that happen relatively frequently. If the impact of a 100-year event is much greater than that of a 10-year event, then less frequent events make larger contributions to the annual av-erage of affected GDP. Thus, even if a province’s annual affected GDP seems small, less frequent and more intense events can still have large impacts.
The annual average population affected by earthquakes in the Slovak Republic is about 20,000 and the annual average affected GDP about $400 million. The annual averages of fatalities and capital losses caused
by earthquakes are about one and about $50 million, respectively. The fatalities and capital losses caused by more intense, less frequent events can be substantially larger than the annual averages. For example, an earthquake with a 0.4 percent annual probability of occurrence (a 250-year return period event) could cause about $2 billion in capital loss (about 2 percent of GDP).
105
A U S T R I A
C Z E C H R E P U B L I C
H U N G A R Y
P O L A N D
R O M A N I A
U K R A I N E
Banska Bystrica
Bratislava
Kosice
Nitra
Presov
Trencin
Trnava
Zilna
Bratislava
Slovak Republic

A U S T R I A
C R O A T I A
H U N G A R Y
Gorenjska
Goriska
Jugovzodna Slovenija
Koroska
Notranjsko-kraska
Obalno-kraska
Osrednjeslovenska
Podravska
Pomurska
Savinjska
Spodnjeposavska
ZasavskaLjubljana
A D R I A T I C S E A
The rose diagrams show the provinces with the potential for greatest annual average capital losses and highest
annual average numbers of fatalities, as determined using an earthquake risk model. The potential for greatest capital loss occurs in Bratislava, which is not surprising, given the economic importance of the province.
EUROPE AND CENTRAL ASIA (ECA) RISK PROFILESSlovak Republic
EARTHQUAKEEXCEEDANCE PROBABILITY CURVE, 2015 AND 2080
FLOODEXCEEDANCE PROBABILITY CURVE, 2015 AND 2080 The exceedance probability curves display the GDP
affected by, respectively, floods and earthquakes for varying probabilities of occurrence. Values for two different time periods are shown. A solid line depicts the affected GDP for 2015 conditions. A diagonally striped band depicts the range of affected GDP based on a selection of climate and socioeconomic scenarios for 2080. For example, if the Slovak Republic had experienced a 100-year return period flood event in 2015, the affected GDP would have been an estimated $10 billion. In 2080, however, the affected GDP from the same type of event would range from about $20 billion to about $70 billion. If the Slovak Republic had experienced a 250-year earthquake event in 2015, the af-fected GDP would have been about $20 billion. In 2080, the affected GDP from the same type of event would range from about $30 billion to about $100 billion, due to population growth, urbanization, and the increase in exposed assets.
All historical data on floods and earthquakes are from, respectively, D. Guha-Sapir, R. Below, and Ph. Hoyois, EM-DAT: International Disaster Database (Université Catholique de Louvain, Brussels, Belgium), www.emdat.be, and J. Daniell and A. Schaefer, “Eastern Europe and Central Asia Region Earthquake Risk Assessment Country and Province Profiling,” final report to GFDRR, 2014. Damage estimates for all historical events have been inflated to 2013 US$. More information on the data and context can be found in the full publication, Europe and Central Asia Country Risk Profiles for Floods and Earthquakes, at www.gfdrr.org/publications, or by contacting Joaquin Toro ([email protected]) or Dr. Alanna Simpson ([email protected]). Please see the full publication for the complete disclaimer and limitations on methodology. Although GFDRR makes reasonable efforts to ensure all the information presented in this document is correct, its accuracy and integrity cannot be guaranteed.
Aff
ecte
d G
DP
(b
illi
on
s o
f $
)
EARTHQUAKEANNUAL AVERAGE FATALITIES
EARTHQUAKEANNUAL AVERAGE CAPITAL LOSS ($)
Return period (years)
Probability (%)
10
10
250
0.4
50
2
100
1
40
20
60
80
120
100
2080
2015
Return period (years)
Probability (%)
10
10
250
0.4
50
2
100
1
20
10
30
40
80
50
60
70
2080
2015
Trnava 7Br
atis
lava
20
Banska Bystrica2
Zilna 2
Presov 3
Tren
cin
3 Kosice 6
Nitra 7
Nitra 0
Kosi
ce 0
Banska Bystrica 0
Trencin 0
Presov 0
Trna
va 0
Zilna 0
Bratislava 0
106