equality of educational opportunity - michigan state...
TRANSCRIPT

uu
uu
uu
uu
uu
uu
uu
uu
uu
Equality of Educational Opportunity:
A Myth or Reality in U.S. Schooling

uu
uu
uu
uu
uu
uu
uu
uu
uu
Equality of Educational Opportunity:
A Myth or Reality in U.S. Schooling
William H. SchmidtLeland S. Cogan
Richard T. HouangMichigan State University
Curtis McKnightUniversity of Oklahoma


i
u u u u u u u u u u u u u u u u u u u u u u u u u u u u u
A Myth or Reality in U.S. Schooling
ABSTRACT
To explore whether equality of educational opportunities is a reality in US eighth grade mathematics classrooms, this paper utilizes data from US states and districts that participated in the 1999 TIMSS-R study. Analyses explore the relationship between classroom coverage of specific mathematics content and student achievement as measured by the TIMSS-R international mathematics scaled score. District/state level SES indicators demonstrated significant relationships with both the dependent variable of interest, mathematics achievement, and the classroom level measure of content coverage. A 3-level model demonstrated a significant effect of classroom content coverage on student achievement while controlling for student background at the student level and SES at all three levels, documenting significant differences in mathematics learning opportunities among US eighth grade classrooms.

Equality of Educational Opportunity
ii
u u u u u u u u u u u u u u u u u u u u u u u u u u u u u

1
u u u u u u u u u u u u u u u u u u u u u u u u u u u u u
A Myth or Reality in U.S. Schooling
TABLE OF CONTENTS
I Introduction . . . . . . . . . . . . . . . . . . . . . . . . .3
II Background. . . . . . . . . . . . . . . . . . . . . . . . . .5
III The Study .. .. .. .. .. .. .. .. .. .. .. .. .. .. .. .. .. .. .. .. .. .. .. .. .. .. .. .8
IV Results . . . . . . . . . . . . . . . . . . . . . . . . . . . . . 12
V Discussion. . . . . . . . . . . . . . . . . . . . . . . . . . . 26
VI References . . . . . . . . . . . . . . . . . . . . . . . . . 28
VII Endnotes. . . . . . . . . . . . . . . . . . . . . . . . . . . . 32

Equality of Educational Opportunity
2
u u u u u u u u u u u u u u u u u u u u u u u u u u u u u
Sometimes differences yield equivalent results. Sometimes, however, differences make a difference. This paper explores whether the
differences across states and districts in eighth grade opportunities to learn various mathematics content represent equivalent expressions of eighth grade mathematics or different opportunities leading to different eighth grade mathematics learning.
We use the term “opportunity to learn,” (OTL) or “educational opportunity” specifically with reference to content coverage in the narrow curricular sense in which the concept was originally developed by Carroll (1962, 1963) and the IEA international studies (McDonnell, 1995). Sociologists and others, such as Gamoran (1987), have broadened the concept of opportunity to include characteristics of the context in which the content coverage occurs that impact the opportunity differently for different groups of children, ideas that are described more fully in the next section, but this paper focuses on content as the focal aspect of OTL.
Schooling at times has been regarded as “the great equalizer” in American society. Because of schooling, ability may triumph over circumstance, and this would be the predominant result if US public schools provided equality in content coverage. Any student willing to work hard and take advantage of the opportunities to learn surely would have the chance to go as far as his or her talent would allow, regardless of family origins and socio-economic status. A false conclusion is sometimes expressed that the lack of success in schooling must be due to a student’s lack of talent, hard work, perseverance or some mixture of these.
The storied triumph of talent and effort appears to be close to the individualism that is so much a part of the American fabled character. Failure is individual — a lack of effort, talent, motivation, application or perseverance; not a lack of opportunity. This storied triumph of the individual adds poignancy and importance to determining whether equal education opportunities are myth or realities in US schooling. The extreme form of this individual triumph fable is seen in those that carry the assumption of equal educational opportunities to the point that unequal educational outcomes can only be explained by an unfortunate but unavoidable distribution of natural abilities that necessarily relegates some to the low end of the distribution (Herrnstein & Murray, 1994).
Is equal content coverage a reality as well as a common assumption or is it a satisfying myth that eases the national conscience? If such equality is a reality, then many will argue that no one – except, perhaps, the individual student – can be blamed for disparate outcomes — not officials, not policy-makers, not the schools and not the citizens. Still many would argue that the effect of poverty must be taken into account. On the other hand, if such equality is a myth, then all must share in the success or failure of individual students. No longer can a satisfying myth ease the collective American conscience about the outcomes of US schooling.

3
u u u u u u u u u u u u u u u u u u u u u u u u u u u u u
A Myth or Reality in U.S. Schooling
It is, therefore, important to determine whether equal opportunities to learn are a reality. This is the focus of this paper. The provision of equal content coverage is made more complicated by the fact that the US educational system is, indeed, not one system but is defined by at least the fifty different states each with its own set of content standards. Additionally, even with the presence of well-defined state standards and, more recently, the increasing presence of corresponding state assessments, local districts still maintain de facto control of curriculum within their districts. One way in which districts maintain their curricular control is the choice of the textbook series they adopt. While some states, to varying degrees, maintain some control on the range of textbook series that may be adopted by districts, the districts themselves in most states control the final adoption and always control the selection of content to be covered and emphasized from within adopted textbooks.
The American educational governance system is a system of shared responsibility (Elmore, 1993). This system of shared responsibility creates what one might term a form of “aggregate individualism,” that is, a group that behaves and makes decisions in a decidedly individualistic manner, each community individually acting and making decisions believing that it and it alone (its authorities, its parents and its citizens) is ultimately responsible for the children of its own community. Communities, and the schools that are their loci for educational practice, act and make content coverage as well as other decisions accordingly. This injects yet another form of American individualism into questions of educational equality and opportunity in US education. Given the structure of the US system there are two such types of communities in which such aggregate individualism occurs – states and local school districts. NCLB legislation and the resulting control mechanisms have attempted, at best, to constrain these community choices to meet some common standard of quality. However, they do not typically have the legal authority necessary to enforce those constraints except incidentally through rewards, punishment and the manipulation of public perceptions.
Thus, two types of the American individualism are at work within US education — the individualism of student talent and perseverance and the collective individualism of states and locally controlled community-based school districts. Do these two sources of individualism work together or at cross-purposes? It seems that the two types of individualism often operate at odds with each other and at cross-purposes. The collective individualism of state and district control as it affects curriculum content and emphasis is, in effect, one of the greatest threats to the assumption of equality in content coverage (OTL). State and local control constrains the educational opportunities of students educated under that control and thus creates differences across such entities in OTL. This impact on content coverage (OTL) is probably most pronounced at the local district level. This is due in part to the long tradition in the U.S. of local school control as well as the closeness of the district and its leadership to the day-to-day instructional activities of teachers, including their selection of textbooks.
Equality of Educational Opportunity
4
u u u u u u u u u u u u u u u u u u u u u u u u u u u u u
Leaving the choice of content coverage to individual local districts, with at best indirect and more global state controls, makes it possible and even probable that the fable of American individualism — that talent and hard work prevail over family origins and socio-economic status — is unwarranted and inoperable. American children simply are not likely to have equal educational opportunities as defined at the most basic level of equivalent content coverage. It is therefore highly questionable and even unfair to assume that differences in student achievement and learning are the sole result of differences in individual student efforts and abilities. Asserting that those who do not achieve at prescribed levels fail to do so because they cannot or do not take advantage of the opportunities afforded them is, at best, to mistake part of the story for the whole. The explanation for differences in individual student outcomes must also include the limitations and differences of opportunity introduced by the collective entities (districts/states) to which they belong. This belonging is not by their own choice but is determined by socio-economic factors, housing patterns, community structures, parental decisions, and many other factors that have one thing in common — they are all beyond the control of individual students. Choices are made. They determine indirectly which opportunities will and will not be provided to individual students — and those students have no say whatever about those choices. To then attribute achievement differences solely to differences in student efforts and abilities is grossly unfair and simple-minded. At its simplest this ignores the relationship of content coverage and achievement. This study uniquely addresses this issue by studying the variation in content coverage across a set of districts and states and relating it to cross-district/state variation in achievement.

5
u u u u u u u u u u u u u u u u u u u u u u u u u u u u u
A Myth or Reality in U.S. Schooling
BACKGROUND
The argument sketched above requires a more careful development before turning to the empirical results. First, we provide more complete definitions for the notions of “opportunity to learn” or “educational opportunity.”1
The opportunity to learn (OTL) concept originated in the early sixties with the work of John B. Carroll (Carroll, 1962, 1963). Although many ideas and arguments centering on educational opportunity had underpinned educational research prior to this time, it was Carroll’s work that gave OTL a specific theoretical meaning. Carroll’s model argued that an individual cannot learn a task if he or she is not allowed enough time to do so. Carroll thus introduced OTL as a measurable concept that represented allocated learning time.
Wiley and Harnischfeger (Wiley & Harnischfeger, 1974; Harnischfeger & Wiley, 1978) argued that school learning only takes place through pupils’ pursuits. Put differently, one could not frame school inputs as directly affecting school achievement as Coleman (Coleman et al., 1966) and Jencks (Jenks et al., 1972) had done. Rather, inputs could affect achievement only to the extent that they affected the amount of time students spent engaged in learning. Some of the work that went in to developing Wiley and Harnischfeger’s notion of OTL was done in collaboration with the project staff of the Beginning Teacher Evaluation Study (Berliner, 1990).
Another body of research developed OTL somewhat independently from Carroll. Specifically, the International Study of Achievement in Mathematics (later called FIMS) framed OTL as a content coverage variable without specific regards to allocated time. FIMS set out to measure the “productivity of school systems” by examining the efficacy of various school inputs on achievement scores (Husén, 1967a). In doing so, however, FIMS’ researchers realized that “one of the factors which may influence scores on the achievement examination was whether or not the students had an opportunity to study a particular topic or learn how to solve a particular type of problem presented by the test” (Husén, 1967b). This work was furthered in the Second International Mathematics Study (SIMS) where one of the main objectives centered on the curriculum. Specifically, it was to focus “on the content of what is being taught, the relative importance given to various aspects of mathematics, and the student achievement relative to these priorities and content…” (Travers & Westbury, 1989, quoting Wilson). OTL defined as content coverage was also a central focus of the Third International Mathematics and Science Study (TIMSS) (Author, 1997b; Author, 1996; Author, 2001b).
Concerns with variation in students’ learning opportunities have hardly been unique to the work of Carroll and the subsequent refinements or the IEA studies. A growing body of sociological research had similarly examined the effects of curricular differentiation on achievement measures.

Equality of Educational Opportunity
6
u u u u u u u u u u u u u u u u u u u u u u u u u u u u u
Partly influenced by the work of Wiley and Harnischfeger and partly in response to Jencks and Coleman, some argued that the effects of schools could only be understood through the process of schooling (Barr & Dreeben, 1983; Bidwell & Kasarda, 1980; Sørensen & Hallinan, 1977, 1986). As Bidwell & Kasarda (1980) put it, the “failure [of school effects research] is the confusion of school, an organization, with schooling, a process that individual students experience… schooling, which is comprised of acts by students and teachers, is conditioned by the social organization of classrooms, curricular tracks, and other instructional units within schools” (pg. 402, emphasis in original). Put differently, student achievement can only be affected through schooling, and thus schools affect achievement only through the opportunities-to-learn they provide students. This is not to ignore the fact that students can and do learn outside of schools. Rather the point here is to identify the primary and central purpose and activity of schools: the provision of learning experiences for students from which they may gain knowledge, expertise and understanding.
Although not the focus of this paper, tracking provides students in the same school with different opportunities. Researchers have identified three different kinds of mechanisms that may produce the effects of tracking: social, institutional, and instructional (Gamoran & Berends, 1987; Lucas, 1999). Perhaps the most salient instructional aspect of tracking, and the one most closely resembling OTL as defined by the IEA studies and Carroll and others, is the fact that tracking differentiates students’ coursework. Many studies, however, have found that it is precisely because students take different courses that tracking is associated with increasing achievement inequality (Gamoran, 1987; Gamoran, Porter, Smithson, & White, 1997; Ma & Willms, 1999; Rock & Pollack, 1995; Schneider, Swanson, & Riegle-Crumb, 1998; Stevenson, Schiller, & Schneider, 1994). These different courses provide students with different opportunities to learn specific mathematics content.
It is in this sense that “opportunity” is used in this paper — the encountering of an experience in a classroom to study and learn particular mathematics topics. Specific mathematics content is the defining element of an educational opportunity in mathematics. Overall, sociologists developed opportunity to learn into a concept not unlike that found in the IEA studies or originating with Carroll. Sociologists, however, also attached other instructional effects — such as teacher quality and teaching methods — that “qualified” the provision of OTL. Here core mathematical content in educational opportunities is separated from other “qualifying” aspects associated with the delivery of those opportunities such as those listed above that may enhance or limit opportunities. The concept employed here is that if the instructional delivery is not fully effective due to such qualifying factors then the impact of the coverage on achievement will be reduced.
We define effectiveness in percentage or proportionate terms (symbolically represented by λ). We symbolically represent the actual coverage or amount of coverage by x. In these terms, the effective amount covered is the product λx. Thus if achievement is symbolized by y, the model

7
u u u u u u u u u u u u u u u u u u u u u u u u u u u u u
A Myth or Reality in U.S. Schooling
represents the relationship as y = f(λx), where f is a monotonic function. Here we assume that f(0) = 0, i.e., nothing is learned or achieved if there is no effective content coverage. Note that λx = 0 if either x = 0 or λ = 0. There is no effective coverage (a) if there is no actual coverage or (b) if coverage is ineffective. Obviously, in this case there can be no learning or achievement, i.e.,
x = 0 or λ = 0 implies y = 0.
Thus, achievement is an interactive function of the actual content covered and delivery effectiveness. This allows a more precise definition of “equal educational opportunity” as it relates to learning, for without equality in content coverage there can be no equality in opportunity related to that content no matter the equality of resources associated with the opportunity.
Other factors such as resources and money also help to define the educational opportunities of students but ultimately learning a specific content (here mathematics and even specific contents within mathematics) is the goal. The mathematics itself is at the heart of the opportunity to learn and thus is a very salient component in examining equality of educational opportunity.
The lack of focus on content in many studies of equality of educational opportunity is unfortunate. These studies give the impression that the focus of investigation in educational opportunity is on these non-content aspects of opportunity as ends in themselves. While such studies may contribute to policy that is useful by providing some level of generalization across different contents, some level of specificity is also necessary. It is the contention of this paper that very specific differences in content have an impact on equality of educational opportunity and whether it is attained. If one wishes to see if the “playing field” is level for all students, specificity is necessary. From a sufficient distance (level of abstraction), the playing field may look level even if it is not.
For example, suppose that solving linear equations (the simplest kinds of equations familiar from a first course in algebra and even before) is a learning content goal at eighth grade. Suppose that it is something that all children should know. If so, then exposure to this part of mathematics is central to providing equal educational opportunity for all eighth grade students in mathematics. All of the attendant resources are there to support the learning of how to solve linear equations and not as ends in themselves. If the best of teachers in well financed and resource-heavy districts don’t provide all of their students with opportunities to learn how to solve linear equations, then equal educational opportunities are not being provided even though all students are studying mathematics. Unfortunately, much is said about equity in these attendant characteristics of opportunity to learn such as teacher quality and school financing but little about the role of specific contents.
Equality of Educational Opportunity
8
u u u u u u u u u u u u u u u u u u u u u u u u u u u u u
THE STUDY
This study focuses on equality of content coverage across two organizational entities, i.e., districts and states. It examines the consistency of educational opportunities with respect to specific mathematics topics together with the associated student academic achievement. It ultimately examines the consequences of the US system of shared decision making in terms of curriculum – permitting states and districts to define specific content coverage in mathematics. To explore this, 13 districts and 9 states that replicated the TIMSS mathematics study in 1999 are used. The data are totally unique and provide the only current opportunity to explore this issue across a broad range of districts that, although not a random sample, are national in scope. To have the same information on nine states including curriculum and achievement data is another way this study is unique. The investigation focuses on cross-district/state differences, not within-district/state differences. Such differences in the coverage of mathematics content within districts or states have been extensively explored as they relate to socio-economic status and to overall achievement (as discussed above).
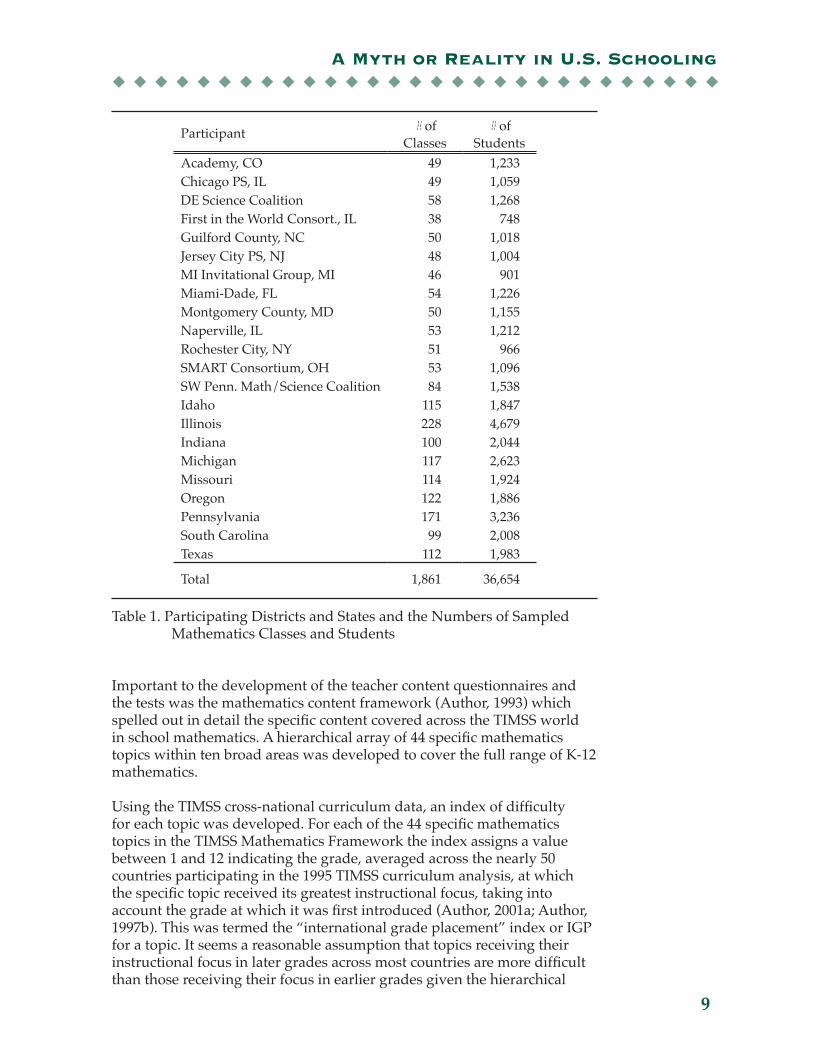
In 1999, the tests and methods of TIMSS (the Third International Mathematics and Science Study) became available to states and districts as a means to benchmark the mathematics achievement of their eighth grade students. In one of the first outcomes from this availability, 13 school districts or consortia of districts and 14 states opted on a voluntary basis to participate in an investigation of educational opportunity and achievement using the TIMSS materials. Districts and states that chose to participate bore the cost of that participation and thus participation was voluntary. The districts and states that chose to participate and that are included in this study are shown in Table 1.
As part of their participation, each entity sampled its eighth grade classes at a level intensive enough to generate acceptable levels of precision in the resulting estimates. Schools were sampled with probabilities proportional to size and, once sampled, a systematic random sample of two eighth grade classrooms was drawn.
Students in the selected classrooms were administered the TIMSS test, which included both mathematics and science items. This investigation focuses only on the mathematics results. The TIMSS eighth grade achievement test in mathematics included eight forms and around 150 items. Test administration involved a matrix sampling approach and forms were randomly assigned to students within classrooms. The internationally-scaled total test score in eighth grade mathematics for TIMSS-R was used as the dependent variable in the following analyses.
9
u u u u u u u u u u u u u u u u u u u u u u u u u u u u u
A Myth or Reality in U.S. Schooling
Participant # of Classes
# of Students
Academy, CO 49 1,233Chicago PS, IL 49 1,059DE Science Coalition 58 1,268First in the World Consort., IL 38 748Guilford County, NC 50 1,018Jersey City PS, NJ 48 1,004MI Invitational Group, MI 46 901Miami-Dade, FL 54 1,226Montgomery County, MD 50 1,155Naperville, IL 53 1,212Rochester City, NY 51 966SMART Consortium, OH 53 1,096SW Penn. Math/Science Coalition 84 1,538Idaho 115 1,847Illinois 228 4,679Indiana 100 2,044Michigan 117 2,623Missouri 114 1,924Oregon 122 1,886Pennsylvania 171 3,236South Carolina 99 2,008Texas 112 1,983
Total 1,861 36,654
Table 1. Participating Districts and States and the Numbers of Sampled Mathematics Classes and Students
Important to the development of the teacher content questionnaires and the tests was the mathematics content framework (Author, 1993) which spelled out in detail the specific content covered across the TIMSS world in school mathematics. A hierarchical array of 44 specific mathematics topics within ten broad areas was developed to cover the full range of K-12 mathematics.
Using the TIMSS cross-national curriculum data, an index of difficulty for each topic was developed. For each of the 44 specific mathematics topics in the TIMSS Mathematics Framework the index assigns a value between 1 and 12 indicating the grade, averaged across the nearly 50 countries participating in the 1995 TIMSS curriculum analysis, at which the specific topic received its greatest instructional focus, taking into account the grade at which it was first introduced (Author, 2001a; Author, 1997b). This was termed the “international grade placement” index or IGP for a topic. It seems a reasonable assumption that topics receiving their instructional focus in later grades across most countries are more difficult than those receiving their focus in earlier grades given the hierarchical

Equality of Educational Opportunity
10
u u u u u u u u u u u u u u u u u u u u u u u u u u u u u
nature of school mathematics. Thus, the IGP provides an indication of the rigor or conceptual complexity for each topic, at least in terms of school mathematics — one that was developed empirically based on data from nearly 50 countries rather than a priori. This empirically derived indication of topic rigor has been found to have strong face validity as well as construct validity (Achieve, 2004).
These empirically derived International Grade Placements (IGP) for each of the 44 topics in the TIMSS Mathematics Framework topics were used as weights to estimate the content difficulty of the delivered curriculum as reported by the teachers. The data came from the teacher questionnaire in which they indicated the number of periods of coverage associated with each of a set of topics (“taught before this year,” “taught 1-5 periods,” “taught more than 5 periods”). Each of the 34 teacher questionnaire topics contained one or more of the 44 mathematics framework topics. The proportion of the school year’s instruction in each of the 34 topics was calculated from the questionnaire, creating a profile of mathematics content coverage for the classroom of students the teacher taught.
These estimated teacher content profiles were then weighted by the corresponding IGP values and summed across all topics. This produced a single value that was an estimate of the rigor or content-related difficulty of the implemented mathematics curriculum for each teacher as illustrated in the following equation.
( )∑ ×=34
iiiclass cIGPforTopipicnTimeforToInstructioIGP
Thus the weighted content coverage index is a multi-faceted measure that is based on three distinct aspects of OTL: 1) the mathematics content itself (topic coverage – yes/no), 2) instruction time for each topic, and 3) rigor or content difficulty (as estimated from international curriculum data). Therefore the IGP measure of the mathematics taught in the classroom is a measure of content-specific OTL defined at the classroom level which can be unambiguously related to classroom achievement. The metric of the index is defined in terms of grade levels and as a result is directly interpretable. Both classroom variables — achievement and content-specific OTL — could then be aggregated to the district or state level and used to explore cross-district/state issues of equality of opportunity and its relationship to achievement. Achievement was estimated at the individual student level using IRT methods and then correspondingly aggregated to the classroom and district levels.
The social class and background of the students were the other major independent variables defined at the student level and included in these analyses. These measures included age, gender, racial/ethnic group, whether English was spoken in the home, education-related possessions in the home (e.g., computer, dictionary, etc.), other possessions in the home, number of cars in the family, parental education level, number of adults in the home, number of books in the home (estimated by students), percent of
11
u u u u u u u u u u u u u u u u u u u u u u u u u u u u u
A Myth or Reality in U.S. Schooling
time students reported reading books, and the students’ self-defined level of educational expectation. The racial/ethnic variable was defined at five levels (using dummy variables). These included white, black, Hispanic, Native American, Asian and other. All of these variables were also aggregated to the classroom level.
Since the focus of these analyses is on OTL provided at eighth grade, it is desirable to measure what is learned in the eighth grade rather than achievement status at the end of eighth grade. To measure learning or gain in any one year such as eighth grade requires a pre-test/post-test longitudinal design at the student level. This a particularly costly design for large scale assessments so the 1995 TIMSS employed a cohort longitudinal design in which both seventh and eighth grade classrooms in the same schools were tested so that, given several reasonable assumptions, seventh grade classroom achievement could serve as a surrogate pretest for eighth grade achievement (Author, 2001b). This method was used successfully in the original 1995 TIMSS study but in the 1999 TIMSS-R study only eighth grade classrooms were sampled so no seventh grade achievement estimates were available. Using the relationships found in the original 1995 TIMSS work between seventh and eighth grade achievement, the 1999 seventh grade achievement was imputed based on the 1999 eighth grade results. This was possible since the achievement results in 1995 and 1999 were based on the same scale sharing many common items. This imputation could be done only at the classroom level.
Two other classroom level variables were defined for these analyses. Teachers were asked to indicate how well prepared they were to teach each of 25 mathematics topics. The number of topics for which a teacher felt well prepared to teach was tabulated. This index, although based on self report, was used as an estimate of teacher content knowledge. The second variable indicated the percent of students in the district or state who were in eighth grade mathematics classes which focused primarily on algebra and geometry. The only additional variable used in these analyses was a district/state-level indicator of economic status — the percent of students that were eligible for a free or reduced-price lunch.

Equality of Educational Opportunity
12
u u u u u u u u u u u u u u u u u u u u u u u u u u u u u
RESULTS
The analysis proceeded in two directions. First, district level data were used to examine the two issues of equality in terms of opportunity to learn and the relationship of OTL to student achievement. The second direction, using both the district and state level data, focused on exploring the nature of that relationship.
District.level.variation.in.OTL.
In this section we examine the concept of “aggregate individualism” as it relates to the specification of content coverage at the local district or community level. We believe it is an important issue to study separately from the combined study of both states and districts-this in spite of the limited number of districts (13) available for such an analysis. Its importance derives from a strong and long standing tradition in the U.S. of local control of the curriculum. Such control can derive either directly from the formal specification of district standards or from the creation of an informal set of expectations through the shared experiences and professional interactions among teachers within the district, including professional development activities. Additionally, it can result from the selection and use of a common textbook series, which often has the effect of serving as the de facto district curriculum. Because of this prominent and influential role we felt it important to understand the issue of equality in content coverage and its relationship to achievement at the district level as distinct from both levels combined.
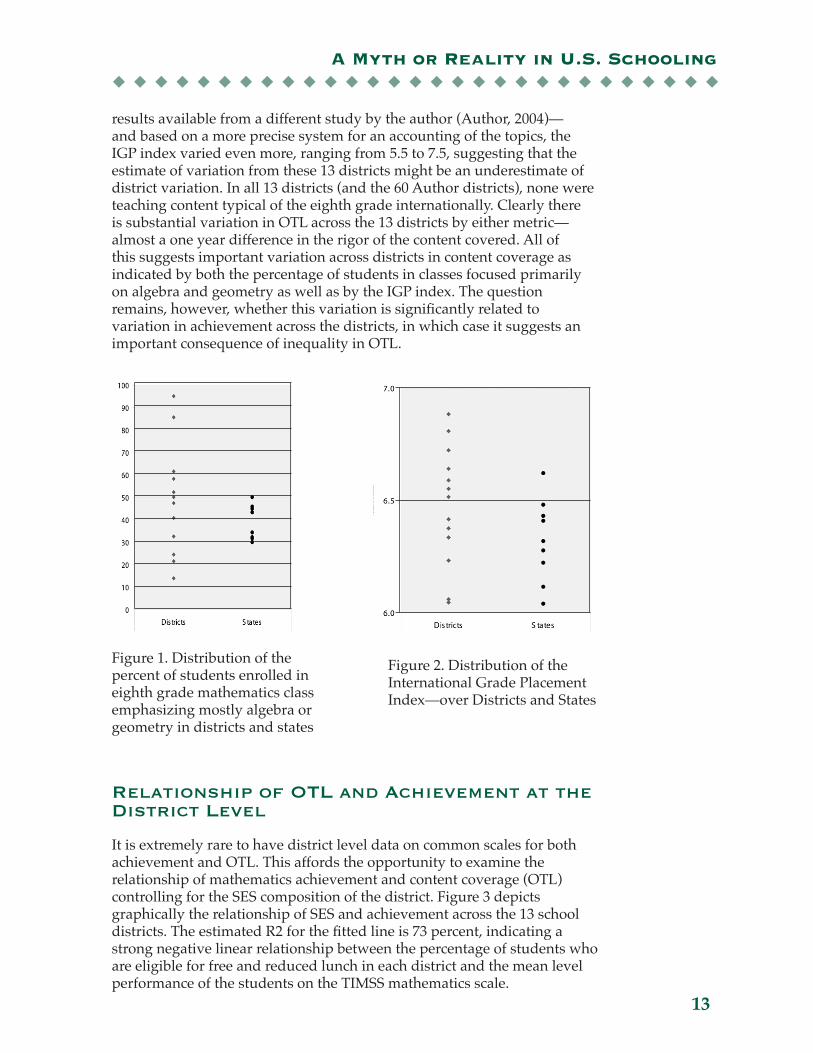
Given the structure of U.S. education, the practice of shared responsibility and the presence of aggregate individualism, it would be reasonable to expect that opportunities to learn will vary across individual districts. Such was the case. One indicator used to characterize the variation was the percentage of eighth grade students in the district who are in mathematics classes focusing mainly on the coverage of algebra and geometry. Internationally this is the focus of eighth grade in virtually all of the countries – except the U.S. – studied in TIMSS (Author, 1997b) and is especially the case for the highest achieving countries (Author, 2001b). That percentage ranges across the districts from 14 percent in one district to 95 percent in another (see Figure 1, which includes state level data as well). This variation in OTL is further supported by examining the variation in the IGP index across districts. The IGP index varied from 6.05 to 6.88 - almost one complete grade level difference across the districts. This implies that in some districts eighth grade teachers on average are teaching content typically found at the end of fifth or the beginning of sixth grade internationally, while in other districts the content comes closer to that found at the end of sixth or the beginning of seventh grade (see Figure 2, which also includes results for the 9 states referred to later in the paper). On a much larger sample of over 60 districts from Michigan and Ohio—
13
u u u u u u u u u u u u u u u u u u u u u u u u u u u u u
A Myth or Reality in U.S. Schooling
results available from a different study by the author (Author, 2004)—and based on a more precise system for an accounting of the topics, the IGP index varied even more, ranging from 5.5 to 7.5, suggesting that the estimate of variation from these 13 districts might be an underestimate of district variation. In all 13 districts (and the 60 Author districts), none were teaching content typical of the eighth grade internationally. Clearly there is substantial variation in OTL across the 13 districts by either metric— almost a one year difference in the rigor of the content covered. All of this suggests important variation across districts in content coverage as indicated by both the percentage of students in classes focused primarily on algebra and geometry as well as by the IGP index. The question remains, however, whether this variation is significantly related to variation in achievement across the districts, in which case it suggests an important consequence of inequality in OTL.
Relationship.of.OTL.and.Achievement.at.the.District.Level
It is extremely rare to have district level data on common scales for both achievement and OTL. This affords the opportunity to examine the relationship of mathematics achievement and content coverage (OTL) controlling for the SES composition of the district. Figure 3 depicts graphically the relationship of SES and achievement across the 13 school districts. The estimated R2 for the fitted line is 73 percent, indicating a strong negative linear relationship between the percentage of students who are eligible for free and reduced lunch in each district and the mean level performance of the students on the TIMSS mathematics scale.
Figure 1. Distribution of the percent of students enrolled in eighth grade mathematics class emphasizing mostly algebra or geometry in districts and states
Figure 2. Distribution of the International Grade Placement Index—over Districts and States

Equality of Educational Opportunity
14
u u u u u u u u u u u u u u u u u u u u u u u u u u u u u
Figure 3. Scatterplot of the Percentage of Students Eligible for Free and Reduced-Price Lunch and Mean Achievement for 13 Districts
Put another way, these data show that the higher the average SES of a district, the higher the eighth grade mathematics achievement. This is consistent with previous findings related to the relationship of SES to achievement such as reported by Coleman et al. (1966), and has led some to hypothesize that SES has a greater impact on achievement than does schooling itself. For a review of the literature as to which is the dominant influence on student achievement—SES or schooling—see Suter (2000) and Floden (2002). The pattern found in Figure 3 was also found for other SES indicators available in the data, such as the percent of students in the district with at least one college-educated parent.
Figure 4. Scatterplot of IGP and Mean Achievement for 13 Districts
Figure 4 presents data that challenge the notion that the dominant factor influencing achievement is SES. It supports the schooling hypothesis. The
0 20 40 60 80 10010 30 50 70 90400
450
500
550
600
% of Free and Reduced Lunch Students
Achi
evem
ent
6.0 7.06.96.86.76.66.56.46.36.26.1400
500
600
450
550
IGP
Achievem
ent

15
u u u u u u u u u u u u u u u u u u u u u u u u u u u u u
A Myth or Reality in U.S. Schooling
indicator here is a measure of the level of demand of the implemented curriculum (IGP) averaged across a sample of eighth grade classrooms in the district. Those districts that had a higher average value on the IGP index also had a correspondingly higher mean achievement (R2= 67 percent). Given the hierarchal nature of mathematics and the way in which the IGP index was constructed, it represents a cumulative measure of content coverage up to the eighth grade. As such the achievement measure, as a measure of status, is appropriate as the dependent variable.
To test the effect of OTL on achievement controlling for SES, both variables were included in the same district level regression model. Both were significantly related to achievement (R2 = 82 percent; p < .0002). The estimated regression coefficients for the three analyses and their standard errors are summarized in Table 2. A one-grade-level increase in the level of demand of the district curriculum results in more than a one and-a-third standard deviation increase in the IRT scaled score; even after controlling for district-level SES, that effect size is estimated at around three-fourths of a standard deviation.
Table 2. Estimated Regression Coefficients for the District Level Analyses
Relationship.of.SES.and.OTL
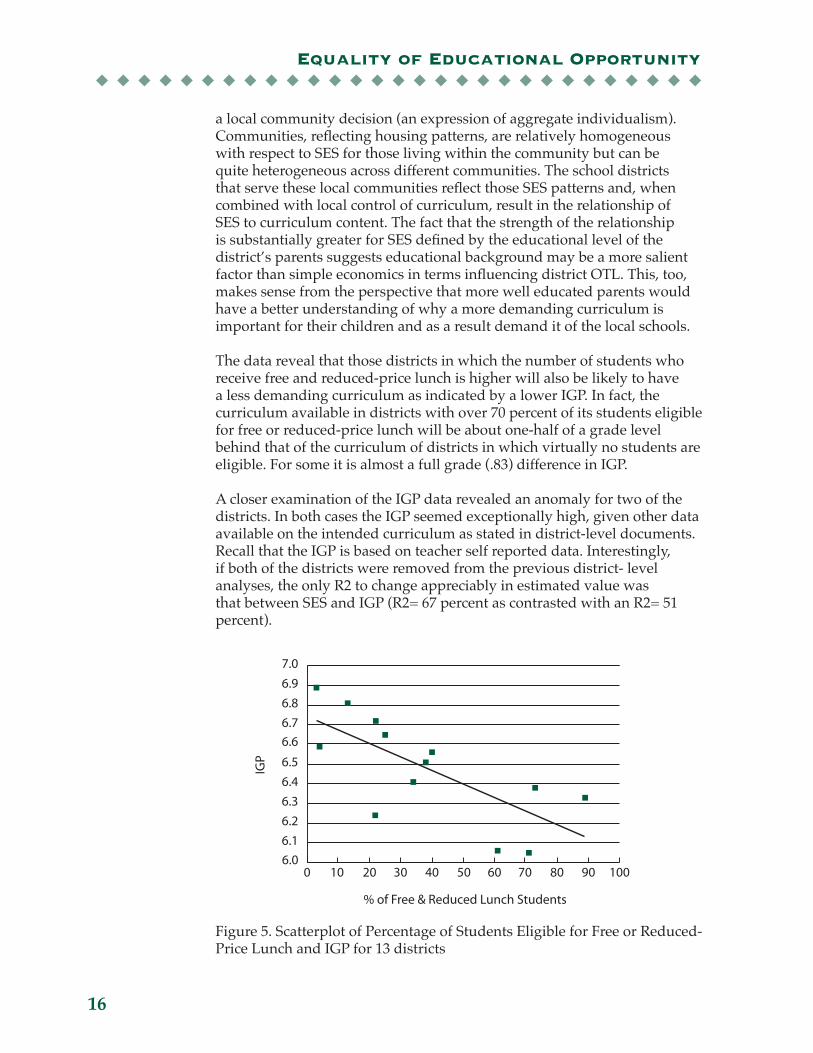
In a previous section we reported substantial variation in OTL across the districts. The question here is: is this variation related to SES? The analysis examining the relationship of SES and IGP (see Figure 5) focuses on the equality issue.
There is a moderately strong negative linear relationship between SES (as measured by percent receiving free and reduced price lunch) and OTL (R2 = 51 percent). For SES defined as the percentage of parents in the district that are college-educated, the estimated linear relationship was even stronger (R2 = 74 percent). The estimated coefficient for SES was 2.4 (p < .0002). These relationships taken together reflect the fact that in the US, under a distributed leadership model, curriculum content becomes
Model with Predictors
With % of students receiving Free and
Reduced-price LunchWith Average IGP
With % of students receiving Free and
Reduced-price Lunch and Average IGP
Statistics Coef Std. Error p Coef Std.
Error P Coef Std. Error p
Intercept 556 11.59 <.01 -380 187.76 > 0.05 79.2 218.59 0.72IGP 136.63 28.97 <.01 70.80 32.42 0.05LUNCH -1.36 0.25 <.01 -0.88 0.31 <.05R-Square 0.7290 <.01 0.6690 <.01 0.8165 <.01Root(MSE) 23.98 26.50 20.70
Equality of Educational Opportunity
16
u u u u u u u u u u u u u u u u u u u u u u u u u u u u u
a local community decision (an expression of aggregate individualism). Communities, reflecting housing patterns, are relatively homogeneous with respect to SES for those living within the community but can be quite heterogeneous across different communities. The school districts that serve these local communities reflect those SES patterns and, when combined with local control of curriculum, result in the relationship of SES to curriculum content. The fact that the strength of the relationship is substantially greater for SES defined by the educational level of the district’s parents suggests educational background may be a more salient factor than simple economics in terms influencing district OTL. This, too, makes sense from the perspective that more well educated parents would have a better understanding of why a more demanding curriculum is important for their children and as a result demand it of the local schools.
The data reveal that those districts in which the number of students who receive free and reduced-price lunch is higher will also be likely to have a less demanding curriculum as indicated by a lower IGP. In fact, the curriculum available in districts with over 70 percent of its students eligible for free or reduced-price lunch will be about one-half of a grade level behind that of the curriculum of districts in which virtually no students are eligible. For some it is almost a full grade (.83) difference in IGP.
A closer examination of the IGP data revealed an anomaly for two of the districts. In both cases the IGP seemed exceptionally high, given other data available on the intended curriculum as stated in district-level documents. Recall that the IGP is based on teacher self reported data. Interestingly, if both of the districts were removed from the previous district- level analyses, the only R2 to change appreciably in estimated value was that between SES and IGP (R2= 67 percent as contrasted with an R2= 51 percent).
Figure 5. Scatterplot of Percentage of Students Eligible for Free or Reduced-Price Lunch and IGP for 13 districts
0 20 40 60 80 10010 30 50 70 906.0
7.0
8
6.96.86.76.6
6.56.46.36.26.1
% of Free & Reduced Lunch Students
IGP

17
u u u u u u u u u u u u u u u u u u u u u u u u u u u u u
A Myth or Reality in U.S. Schooling
These results have potentially profound policy implications. The realization of the fundamental vision of NCLB rests on the assumption that content coverage is the same for all children. Otherwise, why would we expect that all children can achieve proficiency, for if some are not taught essential topics in their schooling, why would we believe they will learn it as well as those who are exposed to that content? These data reveal that such an assumption is not warranted, at least for these 13 districts.
One hypothesis that summarizes the issue conceptually is given in Figure 6. It suggests that both SES and curricular content play a role in mathematics achievement at the district level. The fact that SES and curricular content are related to achievement is not surprising and has been studied in various ways with various types of data. Data from TIMSS also support this relationship, although no data are available on comparable district-like units within other countries (Author, 2001b). However, what is unique to the US is the estimated strong relationship between SES and OTL. When national or regional standards are in place, as they typically are in other countries, that linkage is essentially minimized if not eliminated (See Author, 2001b-Chapter 4).
Figure 6. Conceptual Model relating SES, Curriculum and Learning at the District Level
The implication of this model is that SES in the US would have a stronger relationship to achievement since it has both a direct effect and, an indirect effect through its impact on curricular content (with the indirect effect absent elsewhere or at least minimized when national or regional standards are in place). In fact, this is the case. Using the 1995 TIMSS data, the estimate of the correlation of SES and achievement at the student level for the US surpasses that of 32 of the 40 countries on which such data were available. This raises the issue of equality given that the lower the income
Content Coverage
SES
Student Learning
Equality of Educational Opportunity
18
u u u u u u u u u u u u u u u u u u u u u u u u u u u u u
level composition of a district, the more likely it is that content coverage will be less demanding and, as we have demonstrated, the more likely it is that the average mathematics achievement of eighth graders in that district will also be lower.
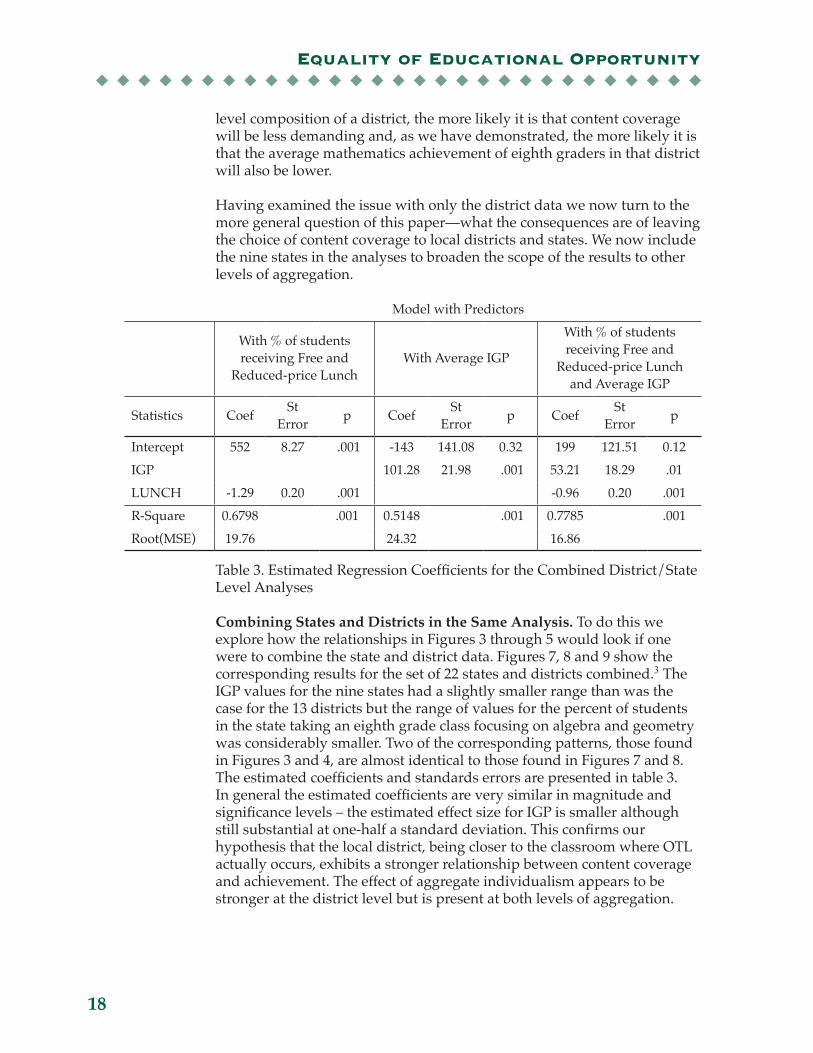
Having examined the issue with only the district data we now turn to the more general question of this paper—what the consequences are of leaving the choice of content coverage to local districts and states. We now include the nine states in the analyses to broaden the scope of the results to other levels of aggregation.
Table 3. Estimated Regression Coefficients for the Combined District/State Level Analyses
Combining States and Districts in the Same Analysis. To do this we explore how the relationships in Figures 3 through 5 would look if one were to combine the state and district data. Figures 7, 8 and 9 show the corresponding results for the set of 22 states and districts combined.3 The IGP values for the nine states had a slightly smaller range than was the case for the 13 districts but the range of values for the percent of students in the state taking an eighth grade class focusing on algebra and geometry was considerably smaller. Two of the corresponding patterns, those found in Figures 3 and 4, are almost identical to those found in Figures 7 and 8. The estimated coefficients and standards errors are presented in table 3. In general the estimated coefficients are very similar in magnitude and significance levels – the estimated effect size for IGP is smaller although still substantial at one-half a standard deviation. This confirms our hypothesis that the local district, being closer to the classroom where OTL actually occurs, exhibits a stronger relationship between content coverage and achievement. The effect of aggregate individualism appears to be stronger at the district level but is present at both levels of aggregation.
Model with Predictors
With % of students receiving Free and
Reduced-price LunchWith Average IGP
With % of students receiving Free and
Reduced-price Lunch and Average IGP
Statistics Coef St Error p Coef St
Error p Coef St Error p
Intercept 552 8.27 .001 -143 141.08 0.32 199 121.51 0.12IGP 101.28 21.98 .001 53.21 18.29 .01LUNCH -1.29 0.20 .001 -0.96 0.20 .001R-Square 0.6798 .001 0.5148 .001 0.7785 .001Root(MSE) 19.76 24.32 16.86

19
u u u u u u u u u u u u u u u u u u u u u u u u u u u u u
A Myth or Reality in U.S. Schooling
Figure 7. Scatterplot of the Percentage of Students Eligible for Free or Reduced-Price Lunch and Mean Achievement for 22 States and Districts
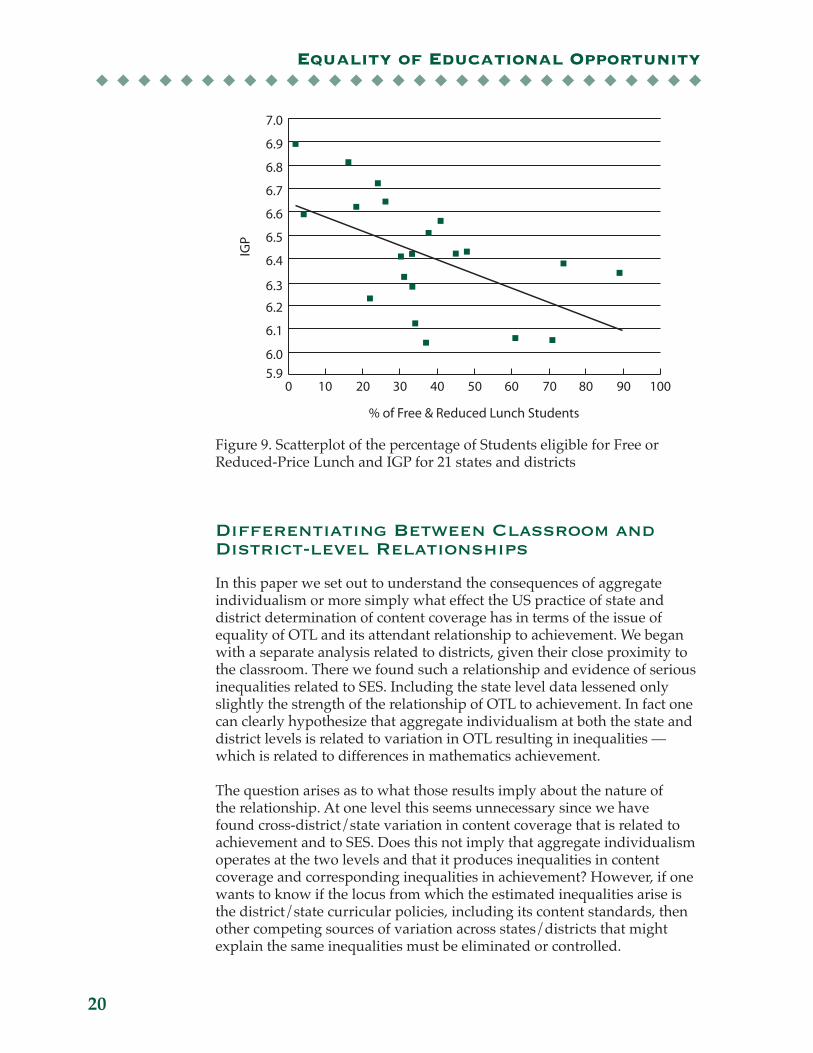
In Figure 9, the estimated R² is 31 percent compared to 51 percent for Figure 5. If the same two questionable districts are removed, the estimated R² becomes 46 percent. The weaker relationship between SES and IGP is understandable given that states are made up of many districts and the fact that state level SES is less variable than SES defined at the district level. As a result, many of the states have similar SES characteristics but still vary in the level of demand of their content coverage, thus weakening the overall linear relationship.
Figure 8. Scatterplot of IGP and Mean Achievement for 22 States and Districts
0 20 40 60 80 10010 30 50 70 90400
500
600
550
450
% of Free & Reduced Lunch Students
Achi
evem
ent
6.0 7.06.96.86.76.66.56.46.36.26.1400
500
600
450
550
IGP
Achievem
ent
Equality of Educational Opportunity
20
u u u u u u u u u u u u u u u u u u u u u u u u u u u u u
Figure 9. Scatterplot of the percentage of Students eligible for Free or Reduced-Price Lunch and IGP for 21 states and districts
Differentiating.Between.Classroom.and.District-level.Relationships
In this paper we set out to understand the consequences of aggregate individualism or more simply what effect the US practice of state and district determination of content coverage has in terms of the issue of equality of OTL and its attendant relationship to achievement. We began with a separate analysis related to districts, given their close proximity to the classroom. There we found such a relationship and evidence of serious inequalities related to SES. Including the state level data lessened only slightly the strength of the relationship of OTL to achievement. In fact one can clearly hypothesize that aggregate individualism at both the state and district levels is related to variation in OTL resulting in inequalities — which is related to differences in mathematics achievement.
The question arises as to what those results imply about the nature of the relationship. At one level this seems unnecessary since we have found cross-district/state variation in content coverage that is related to achievement and to SES. Does this not imply that aggregate individualism operates at the two levels and that it produces inequalities in content coverage and corresponding inequalities in achievement? However, if one wants to know if the locus from which the estimated inequalities arise is the district/state curricular policies, including its content standards, then other competing sources of variation across states/districts that might explain the same inequalities must be eliminated or controlled.
0 20 40 60 80 10010 30 50 70 90
6.05.9
7.0
8
6.1
6.2
6.3
6.4
6.5
6.6
6.7
6.8
6.9
% of Free & Reduced Lunch Students
IGP

21
u u u u u u u u u u u u u u u u u u u u u u u u u u u u u
A Myth or Reality in U.S. Schooling
Teachers also make judgments about what to teach. Teachers bring different levels of mathematics knowledge to the classroom and make independent judgments about what they think should be covered, for how much time and in what order. This can be done even in the presence of district or state standards. The presence of teacher autonomy and their role as brokers of content is well recognized (Author, 1983).
Since teachers – their content knowledge and their content-judgments about coverage – are variable, how they end up distributed across different states or districts can produce such inequalities. Even if the allocation process were random, which is not the case, the result would be cross-district/state variation in OTL and the related variation in achievement.
The IGP index is defined at the individual teacher level and was aggregated to the district (or state) level. To interpret the average IGP solely as an indicator of the district/state content standards makes the assumption that the within district variation across teachers is reasonably small compared to that of the cross-district variation and is mainly the result of implementation differences. Instead of making such an assumption, data are available to estimate the teacher variation in content coverage and its effect on achievement and, as a result, to adjust for it in the statistical model. This permits an estimate of the aggregate unit impact on achievement that is less biased. In other words, the variation across teachers in IGP represents a potential source of selection bias and must be accounted for in order to interpret the estimated district relationship to achievement reported in Tables 2 and 3 as indicative of differences across districts/states in curricular policy.
In effect we are suggesting the following: If all teachers were the same in all respects related to teaching mathematics including content coverage, then what we have found would not have occurred. There would be no variation in OTL. This is not the case and as a result we have the situation where both types of variation exist – variation in district/state content standards and variation in teachers – both of which contribute to the observed relationships described in Figures 1-8. The policy implications could be quite different depending on which sources of variation are present and in what amounts.
Aggregate individualism, the focus of this paper, can only be believed to exist if it is present even after controlling for the teacher variation just discussed. This is important since aggregate individualism is about the variation in decision making made at the district/state level and its relationship to inequality in OTL and achievement – a situation related to the structure of the educational system and the absence of national standards. On the other hand, inequalities related to the unequal distribution of teachers to districts or states is a consequence of different policies such as funding inequalities related to teacher hiring and not to the specification of content standards either formally or informally. To disentangle the relationships, an analysis of the relationship of SES and OTL to achievement was done at both the classroom and district levels using a multi-level linear model.4

Equality of Educational Opportunity
22
u u u u u u u u u u u u u u u u u u u u u u u u u u u u u
Multi-Level Analysis on combined District/State Data. The three-level HLM model for these data is given as follows:
Level -1 Student (within classroom) Model
Y = P0 + P1(AGE) + P2(SEX) + P3(CAUCASIAN) + P4(BLACK) + P5(HISPANIC) + P6(ASIAN) + P7(AM.INDIAN) + P8(ENGLISH) + P9(#ED_POSSESSIONS) + P10(#RECREATIONAL_POSSESSIONS) + P11(#CARS) + P12(PARENT_EDUCATION) + P13(ED_EXPECTATIONS) + P14(#ADULTS) + P15(#BOOKS) + P16(PERCENT_TIME_READING_BOOKS) + ε
Level -2 Teacher/Classroom Model
P0 + B00 + B01(AGE) + B02(CAUCASION) + B3(BLACK) + B4(ASIAN) + B5(ENGLISH) + B6(#CARS?) + B07(PARENT_EDUCATION) + B08(EDUCATON_EXPECTATIONS) + B09(#BOOKS) + B010(PERCENT_TIME_READING_BOOKS) + B011(#TOPICS_PREPARED_TO_TEACH) + B012(CLASSROOM_IGP) B013(ESTIMATED_GRADE7_PRETEST) R0
Level -3 District/State Model
β00 = G00 + G001(PERCENT_FREE/REDUCED_LUNCH) + G002(MEAN_CLASSROOM_IGP) + U00
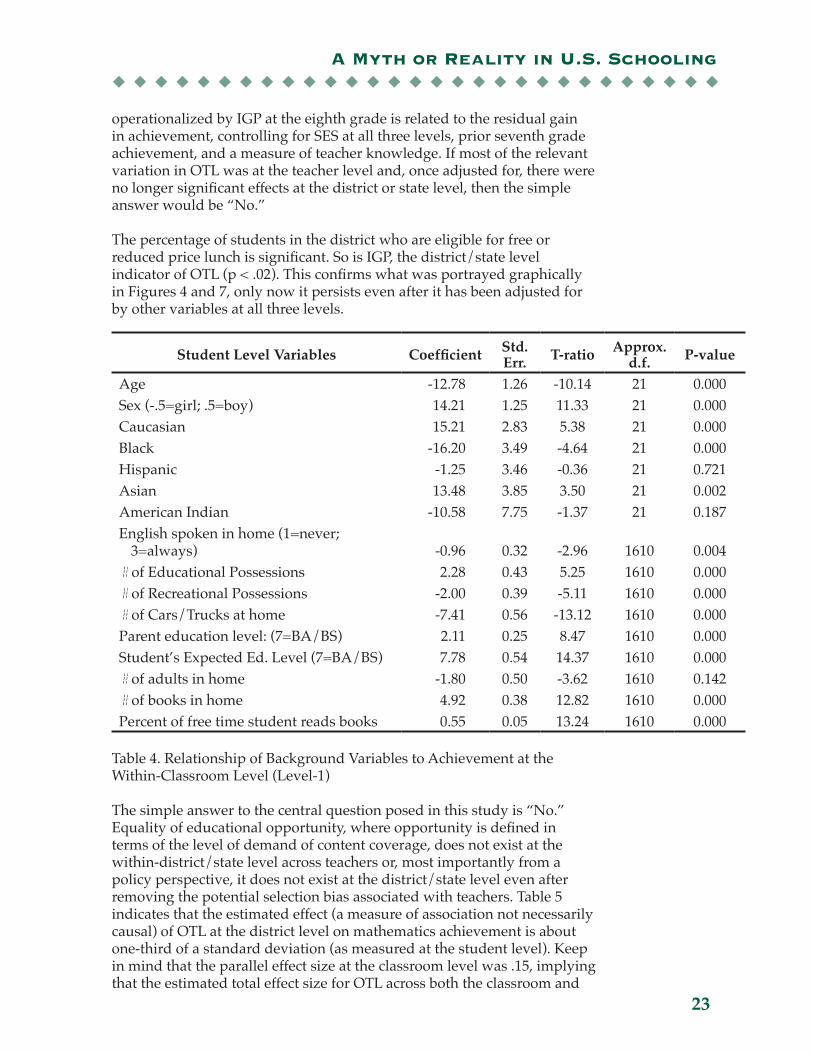
Table 4 shows the individual background variables related to mathematics achievement. These are mostly SES-related variables and are significantly related to achievement at the level-1 within-classroom (student) level. Table 5 gives the results for the analysis at the classroom and district levels.
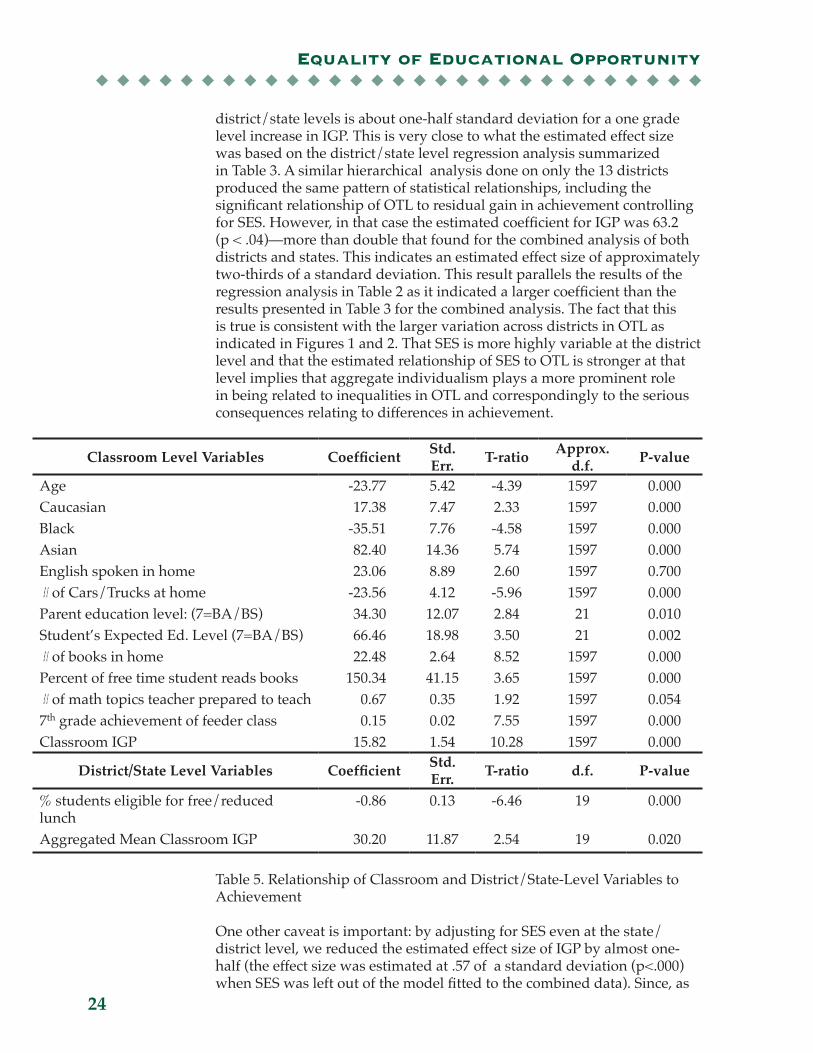
At the classroom level, aggregate measures of SES were included and found to be statistically significantly related to achievement. This was also true for the surrogate pre-test measure of seventh grade achievement for the appropriate feeder classes. Controlling for SES and prior achievement, the IGP measure was significant (p < .0001). The coefficient indicated that for a one-grade level difference in IGP the increase in mean achievement at the classroom level was .15 of a standard deviation. The other classroom (teacher) level variable included was intended as a measure of teacher content knowledge. The estimated coefficient was also significant (p < .05) although quite small relative to the IGP index.
This indicated that the level of demand associated with curriculum was related to the residual gain in mathematics achievement at the classroom level, even after controlling for the social class background both of individual students within classroom and of the class as a whole, and for teacher subject matter knowledge. The same pattern of relationships existed when the same model was fitted to the data consisting only of the 13 districts.
Finally, Table 5 also presents the results related to the focus of this paper— the question of whether the cross-district/state variation in OTL as
23
u u u u u u u u u u u u u u u u u u u u u u u u u u u u u
A Myth or Reality in U.S. Schooling
operationalized by IGP at the eighth grade is related to the residual gain in achievement, controlling for SES at all three levels, prior seventh grade achievement, and a measure of teacher knowledge. If most of the relevant variation in OTL was at the teacher level and, once adjusted for, there were no longer significant effects at the district or state level, then the simple answer would be “No.”
The percentage of students in the district who are eligible for free or reduced price lunch is significant. So is IGP, the district/state level indicator of OTL (p < .02). This confirms what was portrayed graphically in Figures 4 and 7, only now it persists even after it has been adjusted for by other variables at all three levels.
Table 4. Relationship of Background Variables to Achievement at the Within-Classroom Level (Level-1)
The simple answer to the central question posed in this study is “No.” Equality of educational opportunity, where opportunity is defined in terms of the level of demand of content coverage, does not exist at the within-district/state level across teachers or, most importantly from a policy perspective, it does not exist at the district/state level even after removing the potential selection bias associated with teachers. Table 5 indicates that the estimated effect (a measure of association not necessarily causal) of OTL at the district level on mathematics achievement is about one-third of a standard deviation (as measured at the student level). Keep in mind that the parallel effect size at the classroom level was .15, implying that the estimated total effect size for OTL across both the classroom and
Student Level Variables Coefficient Std. Err. T-ratio Approx.
d.f. P-value
Age -12.78 1.26 -10.14 21 0.000Sex (-.5=girl; .5=boy) 14.21 1.25 11.33 21 0.000Caucasian 15.21 2.83 5.38 21 0.000Black -16.20 3.49 -4.64 21 0.000Hispanic -1.25 3.46 -0.36 21 0.721Asian 13.48 3.85 3.50 21 0.002American Indian -10.58 7.75 -1.37 21 0.187English spoken in home (1=never;
3=always) -0.96 0.32 -2.96 1610 0.004# of Educational Possessions 2.28 0.43 5.25 1610 0.000# of Recreational Possessions -2.00 0.39 -5.11 1610 0.000# of Cars/Trucks at home -7.41 0.56 -13.12 1610 0.000Parent education level: (7=BA/BS) 2.11 0.25 8.47 1610 0.000Student’s Expected Ed. Level (7=BA/BS) 7.78 0.54 14.37 1610 0.000# of adults in home -1.80 0.50 -3.62 1610 0.142# of books in home 4.92 0.38 12.82 1610 0.000Percent of free time student reads books 0.55 0.05 13.24 1610 0.000
Equality of Educational Opportunity
24
u u u u u u u u u u u u u u u u u u u u u u u u u u u u u
district/state levels is about one-half standard deviation for a one grade level increase in IGP. This is very close to what the estimated effect size was based on the district/state level regression analysis summarized in Table 3. A similar hierarchical analysis done on only the 13 districts produced the same pattern of statistical relationships, including the significant relationship of OTL to residual gain in achievement controlling for SES. However, in that case the estimated coefficient for IGP was 63.2 (p < .04)—more than double that found for the combined analysis of both districts and states. This indicates an estimated effect size of approximately two-thirds of a standard deviation. This result parallels the results of the regression analysis in Table 2 as it indicated a larger coefficient than the results presented in Table 3 for the combined analysis. The fact that this is true is consistent with the larger variation across districts in OTL as indicated in Figures 1 and 2. That SES is more highly variable at the district level and that the estimated relationship of SES to OTL is stronger at that level implies that aggregate individualism plays a more prominent role in being related to inequalities in OTL and correspondingly to the serious consequences relating to differences in achievement.
Table 5. Relationship of Classroom and District/State-Level Variables to Achievement
One other caveat is important: by adjusting for SES even at the state/district level, we reduced the estimated effect size of IGP by almost one-half (the effect size was estimated at .57 of a standard deviation (p<.000) when SES was left out of the model fitted to the combined data). Since, as
Classroom Level Variables Coefficient Std. Err. T-ratio Approx.
d.f. P-value
Age -23.77 5.42 -4.39 1597 0.000Caucasian 17.38 7.47 2.33 1597 0.000Black -35.51 7.76 -4.58 1597 0.000Asian 82.40 14.36 5.74 1597 0.000English spoken in home 23.06 8.89 2.60 1597 0.700# of Cars/Trucks at home -23.56 4.12 -5.96 1597 0.000Parent education level: (7=BA/BS) 34.30 12.07 2.84 21 0.010Student’s Expected Ed. Level (7=BA/BS) 66.46 18.98 3.50 21 0.002# of books in home 22.48 2.64 8.52 1597 0.000Percent of free time student reads books 150.34 41.15 3.65 1597 0.000# of math topics teacher prepared to teach 0.67 0.35 1.92 1597 0.0547th grade achievement of feeder class 0.15 0.02 7.55 1597 0.000Classroom IGP 15.82 1.54 10.28 1597 0.000
District/State Level Variables Coefficient Std. Err. T-ratio d.f. P-value
% students eligible for free/reduced lunch
-0.86 0.13 -6.46 19 0.000
Aggregated Mean Classroom IGP 30.20 11.87 2.54 19 0.020

25
u u u u u u u u u u u u u u u u u u u u u u u u u u u u u
A Myth or Reality in U.S. Schooling
we demonstrated earlier in the paper, SES is related to IGP at the aggregate level, removing it in the analysis may unnecessarily be reducing the magnitude of the estimated effect.
Recall that, for these districts and states, the typical eighth grade IGP is equal to that of the sixth grade internationally. Most other TIMSS countries are two grade levels ahead of this in terms of the level of demand of their curricula. This implies that a two grade-level boost in curriculum content difficulty would only bring these districts/states in line with where most other nations already are in content coverage. In this case, the estimated increase in residual achievement gain would be anywhere from about two-thirds to one-and-one-third of a standard deviation at the combined or district level related to the two grade level increase in IGP after controlling for prior achievement, teacher knowledge and SES.
The variation in OTL across districts and states is related to a sizeable difference in achievement. In the NCLB era such variation raises the specter of inequality of opportunity, especially given the relationship of SES to OTL. It also suggests one factor that works to counter the goal of NCLB—a gap in content coverage.

Equality of Educational Opportunity
26
u u u u u u u u u u u u u u u u u u u u u u u u u u u u u
DISCUSSION
Most nations believe it is their responsibility to set public policy that requires equal educational opportunities for all children. For the vast majority of countries participating in the 1995 TIMSS, intended mathematics content coverage is typically the same for their students through what we would call “middle school.” Even in countries that appear to be creating different “tracks,” the reality is that basic content is covered by all with advanced students studying the same topics more deeply (Author, 2001b). The concomitant variation in student achievement is thus more likely to be a matter of individual student ability and effort combined with differences in teacher quality rather than public policy that supports and encourages regional or local differences in OTL – that is, teaching different groups of students substantively different mathematics topics.
Sadly, this is not the case for the U.S. districts and states represented in the 1999 TIMSS Benchmarking study reported here. Overall, U.S. students are exposed to a less difficult school mathematics curriculum that places them at a disadvantage when compared to the students in many other countries of the world. Even more sadly, mathematics learning opportunities related to content coverage are deeply affected by which of the 13 local school districts or nine states in which a student lives and goes to school. In those districts where a large percentage of students are of low SES, the content coverage is typically less demanding. Such variation in OTL, however, is also true for typical students even after social class and student background are accounted for. Differences in mathematics achievement are not simply the result of differences in student ability and effort. They are also matters of chance or the consequence of other societal factors such as poverty and housing patterns, which influence where a student happens to attend school.
The analyses here have shown that specificity in analysis of OTL reveals inequalities that might not otherwise be obvious. All of these districts provide opportunities to learn mathematics, but the specifics as to which topics and how demanding they are play a substantively important role in a student’s learning opportunity, which varies by district. Upon close examination, the “playing field” for US mathematics students is not “smooth.” It is very rough and shows constant small differences from topic to topic in coverage. Above all, the playing field is not level. The consequences are clear – less opportunity to learn challenging mathematics corresponds to lower achievement. These analyses suggest one hypotheses: variation that in OTL helps to explain persistent achievement gaps. It also lays bare perhaps the single greatest threat to achieving the vision of NCLB.
If these results for the included districts and states hold more generally, the US is not a country of educational equality, providing equal educational

27
u u u u u u u u u u u u u u u u u u u u u u u u u u u u u
A Myth or Reality in U.S. Schooling
opportunities to its students. This is true not only in the content coverage that is provided to the poor or to minority and disadvantaged students. Any student in the US can be disadvantaged simply due to differences in the difficulty and challenge of the mathematics curriculum that depends on the district in which they happen to attend school. In school mathematics at least, the US is sadly not the “land of opportunity” for any student, regardless of wealth or social class. It is the land of the lucky few and the unlucky many in which educational opportunity depends on the fluke of (or on other societal factors) which school district a student attends. It depends on factors that cannot be wholly overcome by student ability and effort. In fact “aggregate individualism” does exist and seems to work against the individualism which is part of the American dream. For establishing policies to ensure equal educational opportunities, this is the worse sort of “playing field.” How it tilts depends on exactly where one stands.

Equality of Educational Opportunity
28
u u u u u u u u u u u u u u u u u u u u u u u u u u u u u
REFERENCES
Achieve. (2004). Do Graduation Tests Measure Up? A Closer Look at State High School Exit Exams (A Report from The American Diploma Project). Washington, D.C.: Achieve, Inc.
Barr, R., & Dreeben, R. (1983). How schools work. Chicago University of Chicago Press.
Berliner, D. C. (1990). What’s all the fuss about instructional time? In M. Ben-Peretz & R. Bromme (Eds.), The nature of time in schools. New York: Teachers College Press.
Bidwell, C. E., & Kasarda, J. D. (1980). Conceptualizing and measuring the effects of school and schooling. American Journal of Education, 88, 401-430.
Carroll, J. B. (1962). The prediction of success in intensive foreign language training. In R. Glaser (Ed.), Training research and education (pp. 87-136). Pittsburgh: University of Pittsburgh Press.
Carroll, J. B. (1963). A model of school learning. Teachers College Record, 64(8), 723-733.
Cogan, L. S., Schmidt, W. H., & Wiley, D. E. (2001). Who Takes What Math and in Which Track? Using TIMSS to Characterize U.S. Students’ Eighth-Grade Mathematics Learning Opportunities. Educational Evaluation and Policy Analysis, 23(4), 323-341.
Coleman, J. S., Campbell, E. Q., Hobson, C. J., McPartland, J., Mood, A. M., Weinfeld, F. D., et al. (1966). Equality of educational opportunity. Washington, D.C.: National Center for Educational Statistics.
Elmore, R. F. (1993). Systemic educational policy: a conceptual framework. In S. H. Fuhrman (Ed.), Designing coherent education policy: improving the system. San Francisco: Jossey-Bass.
Feldman, S. (2001). Closing the Achievement Gap. American Educator 25(3): 7-9.
Fernandez, R. (2001). Sorting, Education and Inequality. NBER Working Paper Series. Massachusetts, National Bureau of Economic Research, Cambridge, MA.: 52.
Floden, R.E. (2002). The measurement of opportunity to learn. In A.C. Porter & A. Gamoran (Eds.), Methodological advances in cross-national surveys of educational achievement (pp. 231-266). Washington, DC: National Academy Press.
Gamoran, A. (1987). The stratification of high school learning opportunities. Sociology of Education, 60(3), 135-155.
Gamoran, A. (1992). The Variable Effects of High School Tracking. American Sociological Review 57(6): 812-28.
Gamoran, A., Porter, A. C., Smithson, J., & White, P. A. (1997). Upgrading high school mathematics instruction: improving learning opportunities for low-achieving, low-income youth. Educational Evaluation and Policy Analysis, 19(4), 325-338.
Gamoran, A., M. Weinstein, et al. (1995). Differentiation and Opportunity in Restructured Schools. Wisconsin: 34.
Harnischfeger, A., & Wiley, D. E. (1978). Conceptual Issues in Models of School Learning. Journal of Curriculum Studies, 10(3), 215 - 231.

29
u u u u u u u u u u u u u u u u u u u u u u u u u u u u u
A Myth or Reality in U.S. Schooling
Herrnstein, R. J., & Murray, C. (1994). The bell curve: intelligence and class structure in American life. New York: The Free Press.
Husén, T. (Ed.). (1967a). International Study of Achievement in Mathematics (Vol. 1). New York: Wiley.
Husén, T. (Ed.). (1967b). International Study of Achievement in Mathematics (Vol. 2). New York: Wiley.
Kohn, L., S., Institute for Public Policy and Management, Washington University, et al. (1996). Priority Shift: The Fate of Mandatory Busing for School Desegregation in Seattle and the Nation. Washington University, Seattle.
Lord, F.M. (1980). Applications of item response theory to practical testing problems. New Jersey: Lawrence Erlbaum Associates, Inc.
Loveless, T. (1999). Will Tracking Reform Promote Social Equity? Educational Leadership, 56(7): 28-32.
Loveless, T. and Kennedy School of Government. (1994). The Influence of Subject Areas on Middle School Tracking Policies. Faculty Research Working Paper Series R94-19. Cambridge MA: Harvard University.
Lucas, S. R. (1999). Tracking Inequality: Stratification and Mobility in American High Schools. Sociology of Education Series. New York: Teachers College Press.
Lucas, S. R. and M. Berends (2002). Sociodemographic Diversity, Correlated Achievement, and De Facto Tracking. Sociology of Education 75(4): 328-48.
Lucas, S. R. and A. D. Good (2001). Race, Class, and Tournament Track Mobility. Sociology of Education 74(2): 139-56.
Ma, L. (1999). Knowing and teaching elementary mathematics: teachers’ understanding of fundamental mathematics in China and the United States. Mahwah, NJ: Lawrence Erlbaum Associates.
Ma, X., & Willms, J. D. (1999). Dropping out of advanced mathematics: How much do students and schools contribute to the problem? Educational Evaluation and Policy Analysis, 21(4), 365-383.
McMurrer, D. P., I. V. Sawhill, et al. (1997). The Declining Importance of Class. Washington, D.C., Urban Institute.
Mitchell, R. E. and D. E. Mitchell (2005). Student Segregation and Achievement Tracking in Year-Round Schools. Teachers College Record 107(4): 529-562.
Murphy, J. and P. Hallinger (1989). Equity as Access to Learning: Curricular and Instructional Treatment Differences. Journal of Curriculum Studies 21(2): 129-49.
Newmann, F. M., B. Smith, et al. (2001). Instructional Program Coherence: What It Is and Why It Should Guide School Improvement Policy. Educational Evaluation and Policy Analysis 23(4): 297-321.
Oakes, J. (1982). The Reproduction of Inequity: The Content of Secondary School Tracking. Urban Review 14(2): 107-20.
Oakes, J. (1986a). Keeping Track, Part 1: The Policy and Practice of Curriculum Inequality. Phi Delta Kappan 68 (1): 12-17.
Oakes, J. (1986b). Keeping Track, Part 2: Curriculum Inequality and School Reform. Phi Delta Kappan 68(2): 148-54.

Equality of Educational Opportunity
30
u u u u u u u u u u u u u u u u u u u u u u u u u u u u u
Oakes, J. (1988). Tracking: Can Schools Take a Different Route? NEA Today 6(6): 41-47.
Oakes, J. and RAND Corporation. (1987). Tracking in Secondary Schools: A Contextual Perspective. Santa Monica, CA: The RAND Corporation.
Oakes, J. and et al. (1997). Detracking: The Social Construction of Ability, Cultural Politics, and Resistance to Reform. Teachers College Record 98(3): 482-510.
Resnick, L. B. and M. Harwell (2000). Instructional Variation and Student Achievement in a Standards-Based Education District, CRESST/University of Pittsburgh.
Robitaille, D. F., Schmidt, W. H., Raizen, S., McKnight, C., Britton, E., & Nicol, C. (1993). Curriculum Frameworks for Mathematics and Science. Vancouver: Pacific Educational Press.
Rock, D. A., & Pollack, J. M. (1995). Mathematics Course-Taking and Gains in Mathematics Achievement (NCES Report 99-714). Washington DC: National Center for Education Statistics.
Rossell, C. H. E., D. J. E. Armor, et al. (2002). School Desegregation in the 21st Century. Westport, CT: Praeger Publishers.
Rothstein, R., Economic Policy Institute., et al. (2004). Class and Schools : Using Social, Economic, and Educational Reform to Close the Black-White Achievement Gap. Washington, D.C., Economic Policy Institute.
Schmidt, W.H., & Maier, A. (2009). Opportunity to Learn. In Sykes, G., Schneider, B., & Plank, D.N (Eds.), Handbook of Educational Policy (p. 541-559). New York, NY: Routledge.
Schmidt, W. H., McKnight, C., & Raizen, S. (1997). A Splintered Vision: An Investigation of U.S. Science and Mathematics Education. Dordrecht/Boston/London: Kluwer.
Schmidt, W. H., McKnight, C. C., Houang, R. T., Wang, H. A., Wiley, D. E., Cogan, L. S., et al. (2001). Why Schools Matter: A Cross-National Comparison of Curriculum and Learning. San Francisco: Jossey-Bass.
Schmidt, W. H., McKnight, C., Valverde, G. A., Houang, R. T., & Wiley, D. E. (1997). Many Visions, Many Aims, Volume I: A Cross-National Investigation of Curricular Intentions in School Mathematics. Dordrecht/Boston/London: Kluwer.
Schmidt, W. H., Wang, H. A., & McKnight, C. C. (2005). Curriculum Coherence: An Examination of US Mathematics and Science Content Standards From An International Perspective. Journal of Curriculum Studies, 37(5), 525-529.
Schwille, J., Porter, A., Belli, G., Floden, R., Freeman, D., Knappen, L., et al. (1983). Teachers as policy brokers in the content of elementary school mathematics. In L. S. Shulman & G. Sykes (Eds.), Handbook of Teaching and Policy (pp. 370-391). New York: Longman.
Slavin, R. E. and N. L. Karweit (1985). Effects of Whole Class, Ability Grouped, and Individualized-Instruction on Mathematics Achievement. American Educational Research Journal 22(3): 351-367.
Sorensen, A. B. (1970). Organizational Differentiation of Students and Educational Opportunity. Sociology of Education 43, 4, 355-376, Fall 1970.
Sørensen, A. B., & Hallinan, M. T. (1977). A Reconceptualization of School Effects. Sociology of Education, 50(4), 273-289.
31
u u u u u u u u u u u u u u u u u u u u u u u u u u u u u
A Myth or Reality in U.S. Schooling
Sørensen, A. B., & Hallinan, M. T. (1986). Effects of Ability Grouping on Growth in Academic Achievement. American Educational Research Journal, 23(4), 519-542.
Southern Regional Council (1999). Promoting Educational Success Forty-Five Years after Brown. Special Issue on Education. Georgia, Southern Regional Council, Atlanta, GA.: 37.
Stevenson, D. L., Schiller, K. S., & Schneider, B. (1994). Sequences of Opportunities of Learning. Sociology of Education, 67, 184-198.
Stipek, D. J. and R. H. Ryan (1997). Economically Disadvantaged Preschoolers: Ready to Learn but Further to Go. Developmental Psychology 33(4): 711-23.
Strum, P. (2002). Introduction. Brown v. Board: Its Impact on Education, and What it Left Undone, African-American Studies at the Woodrow Wilson Center.
Suter, L. E. (2000). Is Student Achievement Immutable? Evidence from International Studies on Schooling and Student Achievement. Review of Educational Research, 70(4), 529-545.
Travers, K. J., & Westbury, I. (1989). The IEA study of mathematics I: analysis of mathematics curricula (Vol. 1). Oxford, England: Pergamon Press.
U.S. Census Bureau (2005). Brown V. Board of Education: 50th Anniversary. 2005.
Walker, L. H. (2004, Summer). Brown after 50 Years: Looking for Equality and Raising Expectations. New Coalition News & Views.
Wiley, D. E., & Harnischfeger, A. (1974). Explosion of a Myth: Quantity of Schooling and Exposure to Instruction, Major Educational Vehicles, Educational Researcher, 3(4), 7-12.
Willie, C. V. (1988). The Intended and Unintended Benefits of School Desegregation. Urban League Review, 11(1): 127-35.
Willie, C.V. and S. S. Willie (2005). Black, White, and Brown: The Transformation of Public Education in America. Teachers College Record 107(3): 475-495.
Woessmann, L. (2004). How Equal Are Educational Opportunities? Family Background and Student Achievement in Europe and the United States. CESIFO Working Paper No. 1162.
Zimmer, R. (2003). A New Twist in the Educational Tracking Debate. Economics of Education Review 22(3): 307-315.
Equality of Educational Opportunity
32
u u u u u u u u u u u u u u u u u u u u u u u u u u u u u
ENDNOTES
1 William H. Schmidt has written a chapter in The Handbook of Education Policy Research, AERA-Sponsored Handbook, Section V. — Opportunity to Learn — (2009). What follows is drawn from that work.
2 Seventh and eighth grade data were available in the 1995 TIMSS representing parallel cohorts providing longitudinal data only at the classroom level rather than the individual level. A class-level analysis of “quasi-gains” was possible if seventh grade class scores comparable to eighth grade class scores could be estimated. We accomplished this by performing a regression with the dependent variable as mean achievement in eighth grade classes. Independent variables consisted of (a) a SES control composite, (b) the estimate of a comparable seventh grade class sub-score, and (c) selected class-level variables from the teacher file. The analysis proceeded as follows: i) A pooled within-class regression was performed (deviated achievement score regressed on deviated SES data); ii) We calculated predicted achievement values based on the undeviated SES values. These were aggregated to the class level to yield the SES control composite; iii) A “feeder” seventh grade class type was determined for the eighth grade class that produced the independent variable; iv) The appropriate “feeder” class type actually depended on the offerings at the target school: 7th grade regular leading to an 8th grade regular or an 8th grade pre-algebra or an 8th grade algebra class; or a 7th grade pre-algebra class leading to an 8th grade algebra class. An eighth grade class level regression analysis was performed using the SES composite, the imputed seventh grade class mean, and the instructional variables. The SES composite had been derived from the first, within-class stage described above. These regression estimates were then employed to impute the appropriate 7th grade feeder class score for the 1999 TIMSS 8th grade classrooms as no 7th grade data was collected. A full technical description of the 1995 imputation can be found in Author, 2001.
3 The number of states is essentially too small to warrant a separate analysis.
4 Combining states and districts is also more desirable from a methodological point of view. We only have data on a small number of districts (13). This greatly reduces the power for analysis done at the district level. By including the group of states that participated in the same 1999 TIMSS Benchmarking study we have 22 “aggregate individual units,” recognizing that states operate in the same fashion, each individually defining its standards. States are essentially aggregates of districts and differ from consortia of districts only by being much larger aggregates. We did both analyses, using the combined sample as well as the sample of districts only.

The Education Policy Center at Michigan State UniversityCollege of Education, 201 Erickson Hall, East Lansing, MIchigan 48824-1034
Phone: (517) 355-4494 • Fax: (517) 432-6202
www.epc.msu.edu