environmental impacts of technological change in
TRANSCRIPT
University of Plymouth
PEARL https://pearl.plymouth.ac.uk
Faculty of Science and Engineering School of Geography, Earth and Environmental Sciences
2005-01-01
Environmental impacts of technological
change in Bangladesh agriculture:
farmers' perceptions, determinants, and
effects on resource allocation decisions
Rahman, S
http://hdl.handle.net/10026.1/4030
Agricultural Economics
All content in PEARL is protected by copyright law. Author manuscripts are made available in accordance with
publisher policies. Please cite only the published version using the details provided on the item record or
document. In the absence of an open licence (e.g. Creative Commons), permissions for further reuse of content
should be sought from the publisher or author.

1
Environmental impacts of technological change in Bangladesh agriculture:
farmers’ perceptions, determinants and effects on resource allocation
decisions
Sanzidur Rahman
School of Geography Faculty of Social Science and Business University of Plymouth Drake Circus, Plymouth, PL4 8AA Phone: +44-1752-238411, Fax:+44-1752-233054 E-mail: [email protected]
Abstract
The paper measures the impact of modern technology adoption in raising farmers’
environmental awareness and the impacts of farmers’ environmental awareness on resource
use by utilizing survey data from 21 villages in three agro-ecological regions of Bangladesh.
The econometric analysis is based on the application of a Tobit model explaining farmers’
environmental awareness in the first stage and a profit function examining environmental
awareness and resource use relationships in the second stage. Results reveal that ‘level’ and
‘duration’ of involvement with modern technology raises farmers’ environmental awareness,
and that farmers’ environmental awareness reduces resource use including chemicals.
Farmers, who are aware of the adverse environmental impacts of modern agricultural
technology use lower amounts of all inputs in order to avoid further environmental damage.
Therefore, efforts to raise farmers’ environmental awareness is expected to enhance
intangible benefits accruing from a relatively less chemical intensive environment.
Key Words: Technological change, environmental impacts, farmers’ awareness, resource allocation decisions, Bangladesh
JEL classification: Q12, O33, C31
Submitted 8.08.02 Revised received 9.18.03 Accepted 1.28.04
2
1. Introduction
The twentieth century experienced a major breakthrough in agricultural history owing
to the development of high yielding varieties (HYV) of wheat and rice during 1950s and
1960s, which are highly responsive to inorganic fertilizers, pesticides, effective soil
management and water control. The high returns (reportedly) associated with the adoption of
these new varieties of rice and wheat (and maize to some extent) led to their rapid diffusion
in countries of Asia and Latin America (much later in Africa) consequently leading to a
dramatic increase in food production. The spread of this technology package, popularly
coined as the ‘Green Revolution’ (GR), has been fastest of all in the history of technological
innovations in agriculture and acclaimed as the most successful achievement in international
development efforts that transformed lives of millions of the rural poor (Lipton and
Longhurst, 1989; Wolf, 1986; Hayami and Ruttan; 1985).
There is a very large body of literature on the GR covering several dimensions of this
complex technology package. Most of the evaluations (earlier as well as later ones) largely
concentrate on the impacts of GR on agricultural productivity, economic growth,
employment, income, equity (distribution of income) and poverty, with mixed results (e.g.,
Griffin, 1974; Mellor, 1978; Hayami and Ruttan, 1985; Lipton and Longhurst, 1989; Hossain,
1989; Hossain et al., 1990; Alauddin and Tisdell, 1991; Hazell and Ramasamy, 1991; Eicher,
1995; Freebairn, 1995; Rahman, 1999; Das, 2002).
Agriculture is characterized by its environmental, behavioral and policy aspects, and
environmental problems of agriculture largely stem from phenomena associated with
agricultural development. Though there are early indications of the need to incorporate an
environmental dimension in evaluating technological change (Bowonder, 1979; 1981;
Clapham, 1980), the delayed consequences of GR on the environment and the question of
sustainable agricultural growth have received priority only recently (Brown, 1988; Redclift,

3
1989; Shiva, 1991; Alauddin and Tisdell, 1991; Antle and Pingali, 1994; Pimentel, 1996;
Singh, 2000). For example, Singh (2000) attributes widespread adoption of GR as a cause of
significant soil degradation in Haryana state of India, although Bowonder (1979 and 1981)
cautioned on potential adverse ecological outcomes two decades ago. Pimentel (1996) clearly
indicates that the extensive use of fertilizers and pesticides to support the GR has caused
serious public health and environmental problems and chemical pollution costs of an
estimated 100 billion US$ each year in public health and environmental damages worldwide.
Antle and Pingali (1994), in their case study in Philippines, conclude that pesticide use
(apparently to support the GR) has an adverse impact on farmer health, and that impairment
of farmer health reduces productivity. Shiva (1991) in her analysis of agricultural
transformation in Indian Punjab concludes that GR produced scarcity and not abundance by
reducing availability of fertile land and genetic diversity of crops. Redclift (1989) examines
issues of environmental degradation in rural areas of Latin America and notes that it is
closely related to agricultural modernization, the GR.
Similarly, in Bangladesh, historical analysis reveals that productivity from GR is
declining and now poses a threat to the sustainability of economic development (Alauddin
and Tisdell, 1991; Rahman, 2002; Coelli et al., 2003). The nation, historically being a food
deficit country with an extremely unfavorable land-man ratio, opted to pursue a policy of
continued agricultural growth through widespread diffusion of GR technology with
corresponding support of the provision of modern inputs, such as chemical fertilizers,
pesticides, irrigation, credit, product procurement, storage and marketing facilities over the
past four decades. As a result, land use intensity increased sharply to 174.7% in 1998/99 from
its initial level of 143.9% in 1968/69 (Alauddin and Tisdell, 1991; BBS, 2001) with
corresponding increases in input use rates (Rahman and Thapa, 1999). While total rice output
of the nation grew at an annual rate of 2.2% during 1965–1987, it fell to 1.1% during 1988–

4
1997 (Otsuka, 2000). In fact, the yield of modern rice steadily declined from 3.6 mt/ha in
1968/69 to 2.4 mt/ha in 1993/94, for an estimated annual rate of decline of 1.2% (Rahman,
2002). Also, total factor productivity (TFP) of Bangladesh crop agriculture (dominated by
rice production) declined at an annual rate of 0.23% over the period 1960/61 – 1991/92
(Coelli et al., 2003), thereby confirming the notion of falling productivity of GR technology.
The observed increase in total rice output is due to a shift from traditional to modern rice
varieties, as the modern varieties are still capable of producing nearly twice the yield of the
traditional varieties. For example, the average yield of modern rice is estimated at 2.4 mt/ha
as compared to only 1.2 mt/ha for traditional rice during 1992–94 (Rahman and Thapa,
1999). Furthermore, such intensive monoculture of GR rice led to displacement of land under
low productive non-rice crops such as pulses, oilseeds, spices and vegetables, leading to the
erosion of crop diversity, thereby endangering sustainability of crop-based agricultural
production systems (Husain et al., 2001). Also, it is believed that the soil fertility level, which
is the key to maintaining land productivity, seems to be declining in Bangladesh, as evident
from actual soil test results of 460 soil samples from 43 profiles from same locations between
1967 and 1995 (Ali et al., 1997). In fact, production of food crops in Bangladesh takes up an
estimated 0.93 million tons of nutrients (NPK and S) from the soil (Baanante et al., 1993).
The chemical intensive nature of this GR technology coupled with high cropping intensity
and practice of rice monoculture without proper measures to replenish soil fertility is a source
of concern for the environment and the sustainability of food production.
Inspired by the need to explore the environmental dimension of the GR given the
abundance of adoption – perception studies on the link between farmers’ perceptions and soil
conservation decisions, Rahman and Thapa (1999) set out to examine one of the least
touched- upon issues related to the diffusion of this modern agricultural technology, which is
the question whether farmers are aware of any adverse environmental impacts associated with
5
the GR. They conclude that farmers’ are well aware of the adverse environmental impacts of
the GR, although their awareness is confined to visible impacts such as soil fertility, fish
catches and health effects. Rahman (2003) extends the analysis to identify factors explaining
farmers’ environmental awareness and concludes that the level and duration of involvement
with the modern technology directly influence awareness of its adverse effects in addition to
other socio-economic factors, such as education and extension contacts. Given this backdrop,
the present study further extends the issue by explicitly examining the link between farmers’
environmental awareness and resource allocation decisions. The importance arises because
sustainability of agricultural production depends largely on actions of farmers and their
ability to make decisions given the level of knowledge and information available to them.
The empirical approach is based on a two-step procedure. The first step is to explain the
environmental awareness of the farmers with the personal characteristics of the farmers and
their extent of involvement with the technology1. This model generates estimates of farmers’
environmental awareness. The second step is to include estimated farmers’ awareness as an
explanatory variable in a profit function to estimate its effect on resource allocation
decisions2. The next section describes the methodology and data. Section three provides the
results and the final section concludes.
2. Methodology
2.1. Data and the study area
Primary data for the study pertains to an intensive farm survey of rice producers
conducted during February to April 1997 in three agro-ecological regions of Bangladesh.
Samples were collected from eight villages of the Jamalpur Sadar sub-district of Jamalpur,
representing wet agro-ecology, six villages of the Manirampur sub-district of Jessore,
representing dry agro-ecology, and seven villages of the Matlab sub-district of Chandpur,
6
representing wet agro-ecology in an agriculturally advanced area. A total of 406 farm
households from these 21 villages were selected following a multistage stratified random
sampling procedure. Among these 406 farms, 380 farms produced modern varieties of rice
and were therefore included in the final sample. The dataset also includes information on the
level of soil fertility3 determined from soil samples collected from representative locations
and information on the level of infrastructure4 development in the study villages.
2.2. Measuring determinants of farmers’ environmental awareness
The environmental awareness index (EAI) is constructed using a simple two-step
procedure5. A set of 12 specific environmental impacts was read to the respondents who were
asked to reveal their opinion on each of these impacts (Ej). A value of 1 is assigned for each
of the impact indicators where the farmer recognizes the impact and 0 otherwise. Selection of
these indicators was based on Focus Group Discussions (FGD) with the farmers during a pre-
testing stage prior to administration of the structured questionnaire. In the next step, farmers
were asked to reveal the relative importance of each impact indicator on a five-point scale
(Rm). A score of 1 is assigned for least importance and 5 for very high importance. These
ranks were then converted into weighted score (Wq). A weight of 0.2 is assigned for lowest
rank of 1 and a weight of 1 is assigned for the highest rank of 5. A zero weight is assigned for
indicators for which the farmer does not recognize an impact. The environmental awareness
index (EAI) for each farmer is computed by summing up the weighted scores of impact
indicator6:
∑∑∑= = =
=12
1
5
0
1
0j m q
qmj WREEAI (1)
To examine determinants of farmers’ environmental awareness, a Tobit model is used
because of the truncated nature of the dependent variable. This is because farmers could be
unaware of any environmental impacts even after prolonged adoption of GR technology.
7
Therefore, there are a number of farmers with zero environmental awareness at the limit.
Briefly, the stochastic model underlying Tobit may be expressed as follows7 (McDonald and
Moffit, 1980):
,,......2,1
,00
0
ni
uXif
uXifuXy
ii
iiiii
=
≤+=
>++=
β
ββ
(2)
where n is the number of observations, yi is the dependent variable (farmers’ environmental
awareness), Xi is a vector of independent variables, β is a vector of parameters to be
estimated, and ui is an independently distributed error term assumed to be normal with zero
mean and constant variance σ2. The model assumes that there is an underlying stochastic
index equal to (Xiβ + ui) which is observed when it is positive, and hence qualifies as an
unobserved latent variable. A total of nine explanatory variables are used to explain farmers’
environmental awareness. Choice of these explanatory variables is based on the adoption –
perception literature with similar justification thereof. Two principal technology attributes,
the level (area cultivated) and duration (actual years of growing) of GR technology adoption
are hypothesized as the major determinants in raising farmers’ environmental awareness
since perception comes from experience of adoption (Negatu and Parikh, 1999). Modern
irrigation is included because it is an important pre-requisite for growing modern varieties of
rice and absence of this vital input affects yield level significantly, which is expected to raise
awareness. The education variable is used as a proxy for the capacity to understand the
technical aspects of GR technology. Age is incorporated to account for the maturity of the
farmer in the decision making process. Agricultural extension is an important source of
information dissemination directly related to production practices (Baidu-Forson, 1999;
Adesina and Zinnah, 1993). According to Chayanovian theory of peasant agriculture,
subsistence pressure is expected to increase adoption of new technology, which has been
found to be valid in Bangladesh case (Hossain et al., 1990). Land ownership represents a

8
major source of wealth and influences crop production as well as opens up opportunity to
adopt modern technologies. Tenurial status is also important since large masses of farming
population are either landless or marginal farmers. The percentage of income earned off-farm
was included to reflect the relative importance of non-agricultural work of these households
and as a proxy for measuring investment potential for soil conservation (Mbaga-Semgalawe
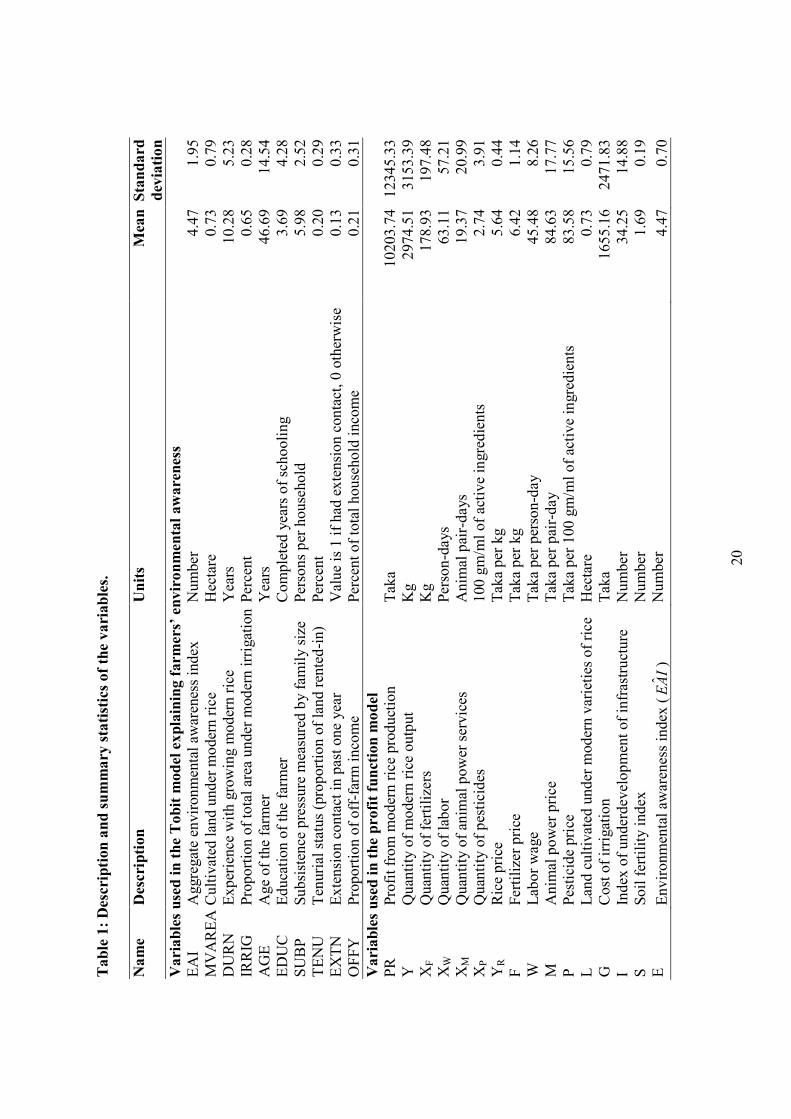
and Folmer, 2000). The upper panel of Table 1 presents the description and summary
statistics of the explanatory variables used for the Tobit analysis to explain farmers’
environmental awareness.
2.3. Modeling productivity effects of farmers’ environmental awareness
A profit function approach is adopted to examine the effect of farmers’ environmental
awareness on resource allocation decisions. The basic assumption is that farm management
decisions can be described as static profit maximization8. Specifically, the farm household
was assumed to maximize ‘restricted’ profits from growing modern rice, defined as the gross
value of output less variable costs, subject to a given technology and given fixed factor
endowments. In this context, the estimated environmental awareness index ( IAE ˆ ) obtained
from the first stage regression of the Tobit model is treated as a given level of stock of
knowledge and added as an explanatory variable.
The general form of the translog profit function, dropping the ith subscript for the
farm, is defined as:
∑ ∑∑ ∑∑= = = = =
+++=4
1
4
1
4
1
4
1
5
121
0 ln'ln'ln'ln'ln'lnj j k j l
ljjlkjjkjj ZPPPP δγααπ
∑ ∑∑= = =
+++5
1
5
1
5
121 ,lnlnln
l l t
tlltll vZZZ θβ (3)
where:
9
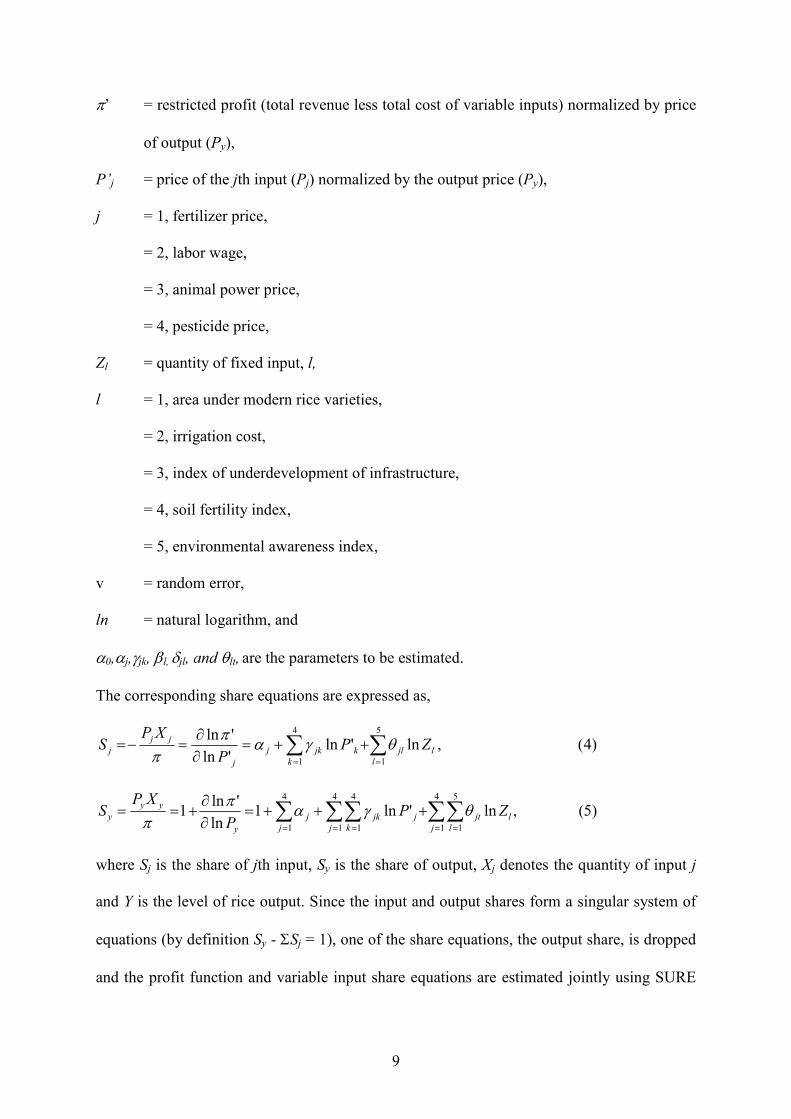
π’ = restricted profit (total revenue less total cost of variable inputs) normalized by price
of output (Py),
P’j = price of the jth input (Pj) normalized by the output price (Py),
j = 1, fertilizer price,
= 2, labor wage,
= 3, animal power price,
= 4, pesticide price,
Zl = quantity of fixed input, l,
l = 1, area under modern rice varieties,
= 2, irrigation cost,
= 3, index of underdevelopment of infrastructure,
= 4, soil fertility index,
= 5, environmental awareness index,
v = random error,
ln = natural logarithm, and
α0,αj,γjk, βl, δjl, and θlt, are the parameters to be estimated.
The corresponding share equations are expressed as,
)4(,ln'ln'ln
'ln 4
1
5
1
∑ ∑= =
++=∂
∂=−=
k l
ljlkjkj
j
jj
j ZPP
XPS θγα
π
π
∑ ∑∑∑∑= = ===
+++=∂
∂+==
4
1
4
1
5
1
4
1
4
1
,ln'ln1ln
'ln1
j j
l
l
jtj
k
jk
j
j
y
yy
y ZPP
XPS θγα
π
π (5)
where Sj is the share of jth input, Sy is the share of output, Xj denotes the quantity of input j
and Y is the level of rice output. Since the input and output shares form a singular system of
equations (by definition Sy - ΣSj = 1), one of the share equations, the output share, is dropped
and the profit function and variable input share equations are estimated jointly using SURE
10
procedure9. The joint estimation of the profit function together with factor demand equations
ensures consistent parameter estimates (Sidhu and Baanante, 1981).
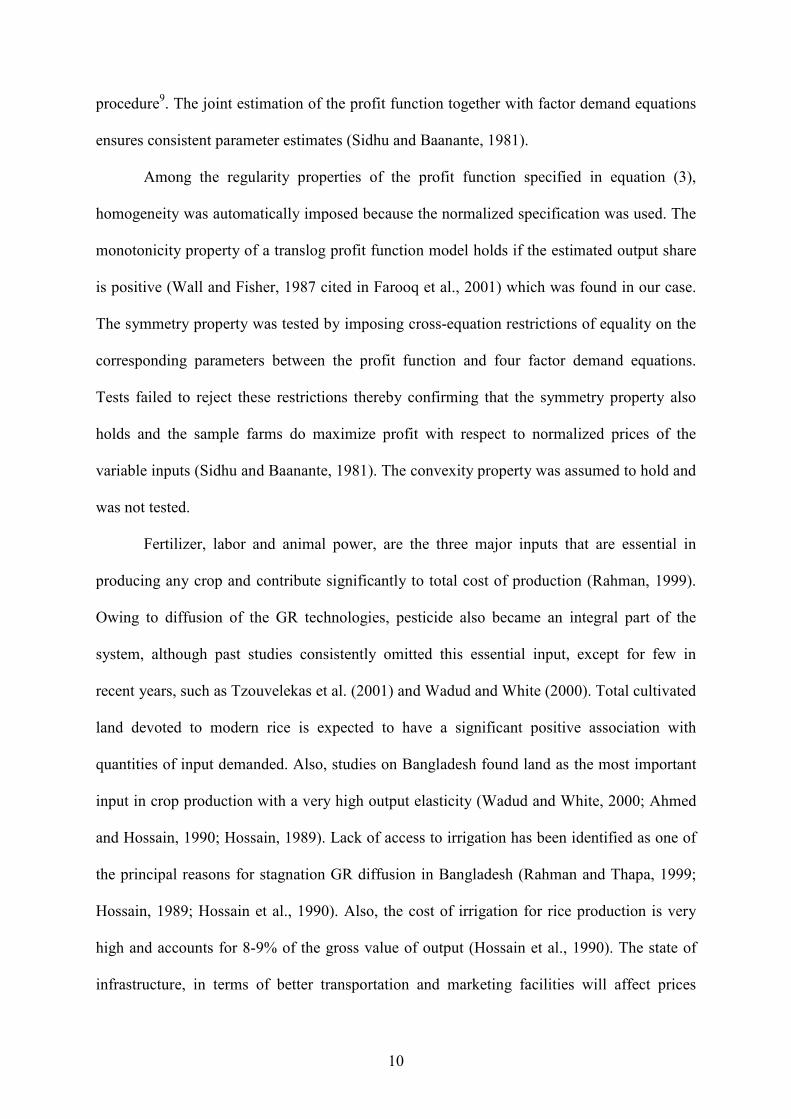
Among the regularity properties of the profit function specified in equation (3),
homogeneity was automatically imposed because the normalized specification was used. The
monotonicity property of a translog profit function model holds if the estimated output share
is positive (Wall and Fisher, 1987 cited in Farooq et al., 2001) which was found in our case.
The symmetry property was tested by imposing cross-equation restrictions of equality on the
corresponding parameters between the profit function and four factor demand equations.
Tests failed to reject these restrictions thereby confirming that the symmetry property also
holds and the sample farms do maximize profit with respect to normalized prices of the
variable inputs (Sidhu and Baanante, 1981). The convexity property was assumed to hold and
was not tested.
Fertilizer, labor and animal power, are the three major inputs that are essential in
producing any crop and contribute significantly to total cost of production (Rahman, 1999).
Owing to diffusion of the GR technologies, pesticide also became an integral part of the
system, although past studies consistently omitted this essential input, except for few in
recent years, such as Tzouvelekas et al. (2001) and Wadud and White (2000). Total cultivated
land devoted to modern rice is expected to have a significant positive association with
quantities of input demanded. Also, studies on Bangladesh found land as the most important
input in crop production with a very high output elasticity (Wadud and White, 2000; Ahmed
and Hossain, 1990; Hossain, 1989). Lack of access to irrigation has been identified as one of
the principal reasons for stagnation GR diffusion in Bangladesh (Rahman and Thapa, 1999;
Hossain, 1989; Hossain et al., 1990). Also, the cost of irrigation for rice production is very
high and accounts for 8-9% of the gross value of output (Hossain et al., 1990). The state of
infrastructure, in terms of better transportation and marketing facilities will affect prices
11
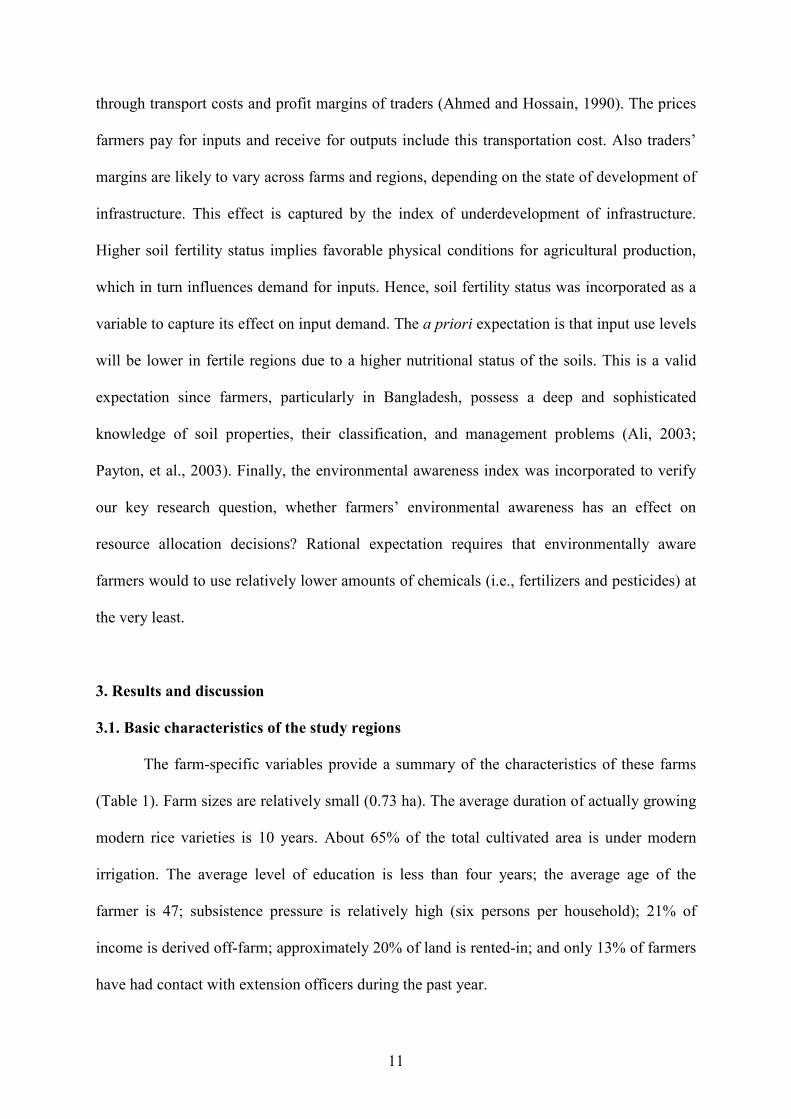
through transport costs and profit margins of traders (Ahmed and Hossain, 1990). The prices
farmers pay for inputs and receive for outputs include this transportation cost. Also traders’
margins are likely to vary across farms and regions, depending on the state of development of
infrastructure. This effect is captured by the index of underdevelopment of infrastructure.
Higher soil fertility status implies favorable physical conditions for agricultural production,
which in turn influences demand for inputs. Hence, soil fertility status was incorporated as a
variable to capture its effect on input demand. The a priori expectation is that input use levels
will be lower in fertile regions due to a higher nutritional status of the soils. This is a valid
expectation since farmers, particularly in Bangladesh, possess a deep and sophisticated
knowledge of soil properties, their classification, and management problems (Ali, 2003;
Payton, et al., 2003). Finally, the environmental awareness index was incorporated to verify
our key research question, whether farmers’ environmental awareness has an effect on
resource allocation decisions? Rational expectation requires that environmentally aware
farmers would to use relatively lower amounts of chemicals (i.e., fertilizers and pesticides) at
the very least.
3. Results and discussion
3.1. Basic characteristics of the study regions
The farm-specific variables provide a summary of the characteristics of these farms
(Table 1). Farm sizes are relatively small (0.73 ha). The average duration of actually growing
modern rice varieties is 10 years. About 65% of the total cultivated area is under modern
irrigation. The average level of education is less than four years; the average age of the
farmer is 47; subsistence pressure is relatively high (six persons per household); 21% of
income is derived off-farm; approximately 20% of land is rented-in; and only 13% of farmers
have had contact with extension officers during the past year.
12
Table 1 about here
3.2. Ranking of farmers’ environmental awareness
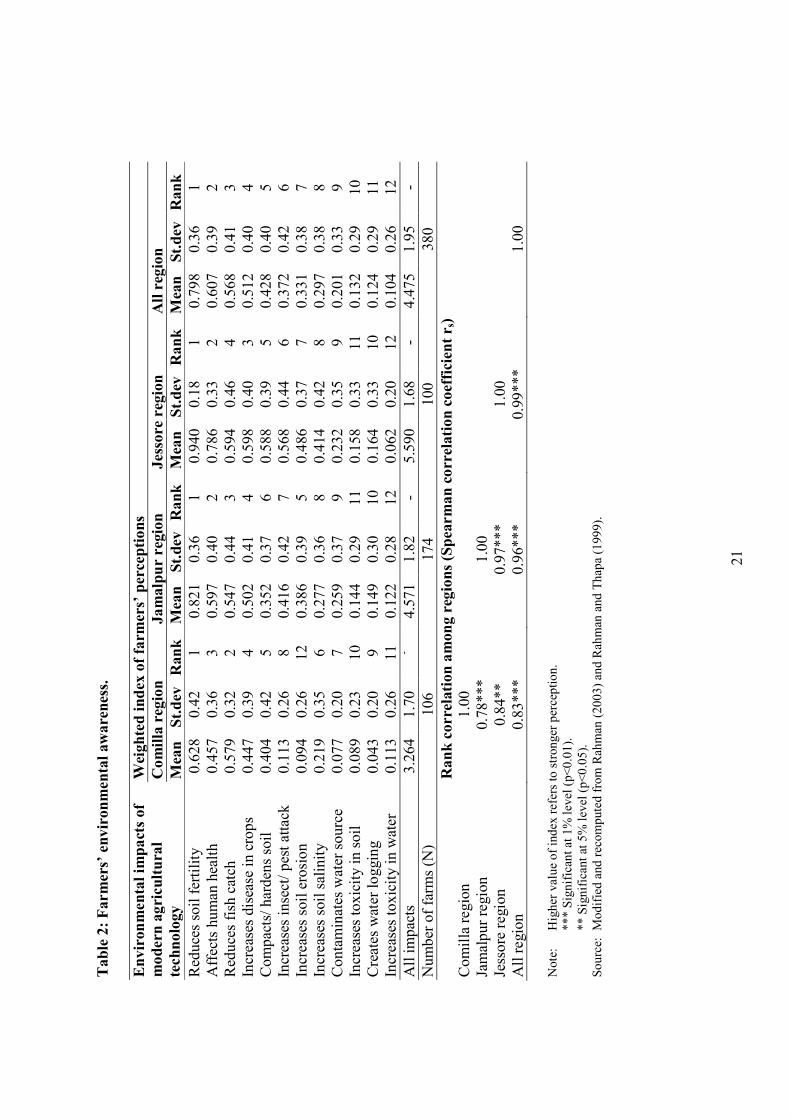
‘Reduces soil fertility’ features at the top of the list of perceived adverse
environmental impacts of modern agricultural technology diffusion, followed by ‘health
effects’, ‘reduces fish catch’, ‘increases crop disease’, ‘soil compaction’, ‘increase in
insect/pest attack’, ‘soil erosion’ and ‘soil salinity’ (Table 2). Perception of the adverse
impact of modern technology on water resources is, however, very weak, as evident from
sharp decline in index values. This implies that though farmers are aware of the adverse
environmental impacts of modern agricultural technology, their awareness of the extent
remains confined to the visible impacts evident from farm fields and crop production on
which their livelihoods depend. The awareness of indirect impacts such as ‘contamination of
soil and water bodies’ is poor as indicated by low index values. The consistency of these
response patterns across regions is evident from the analysis of rank correlation (lower panel
in Table 2). All relative rankings of impacts across regions are significantly and positively
correlated, with the value of rank correlation R varying between 0.78 and 0.99.
Table 2 about here
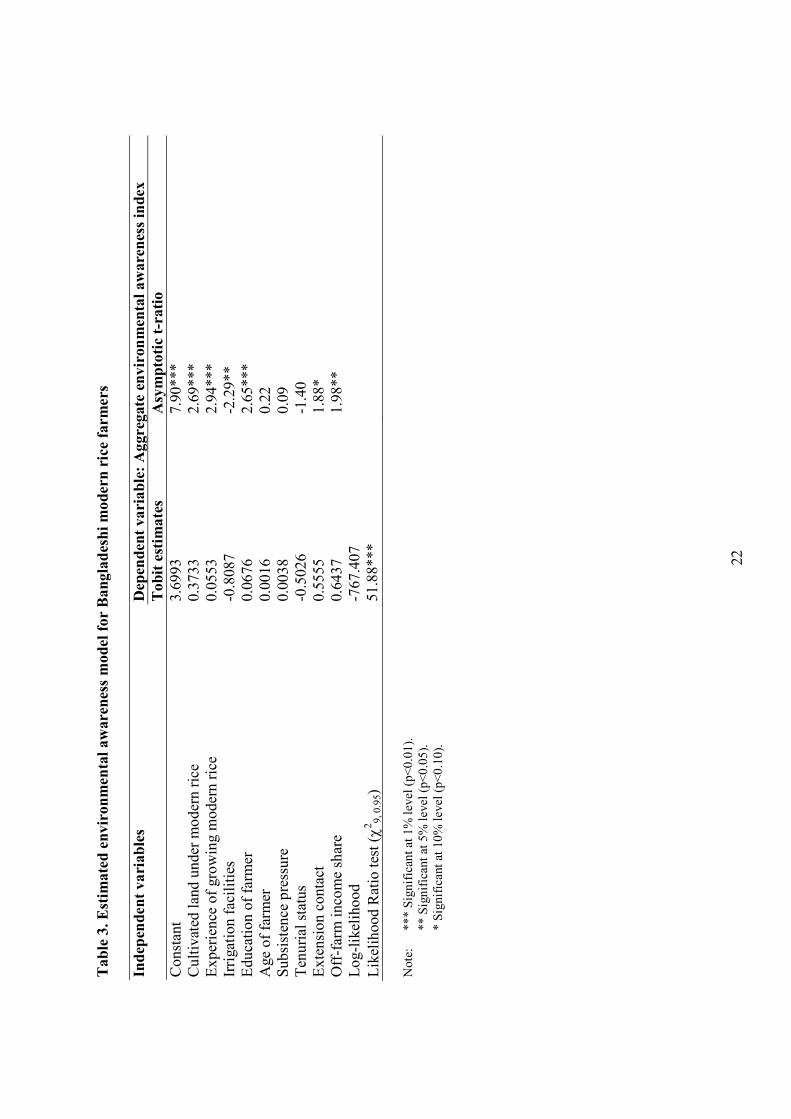
3.3. Determinants of farmers’ environmental awareness
Table 3 presents the parameter estimates of the Tobit model of factors explaining
farmers’ environmental awareness. Except age, family size (proxy for subsistence pressure)
and tenurial status, the coefficients for the remaining six variables representing technology
attributes and farmers’ circumstances were significantly different from zero at 10% level at
least. The Likelihood Ratio test result presented at the bottom of Table 3 further statistically
validates that these variables contribute significantly as a group to the explanation of the
13
environmental awareness level of the farmers. As expected, the level and duration of
involvement with modern technology directly influences awareness of its adverse effects.
Lack of access to modern irrigation also raises awareness because of its overarching
importance in yield performance, particularly in the Boro (dry-winter) season that solely
depends on artificial irrigation. Both education and extension contacts significantly increase
awareness as expected and conform to the results of other adoption-perception studies (e.g.,
Mbaga-Semgalawe and Folmer, 2000; Baidu-Forson, 1999). Finally, those who earn their
livelihood substantially from off-farm sources are also more aware. Probably, these are the
households who engage themselves in off-farm activities after realizing that GR technologies
are not paying off as expected.
Table 3 about here
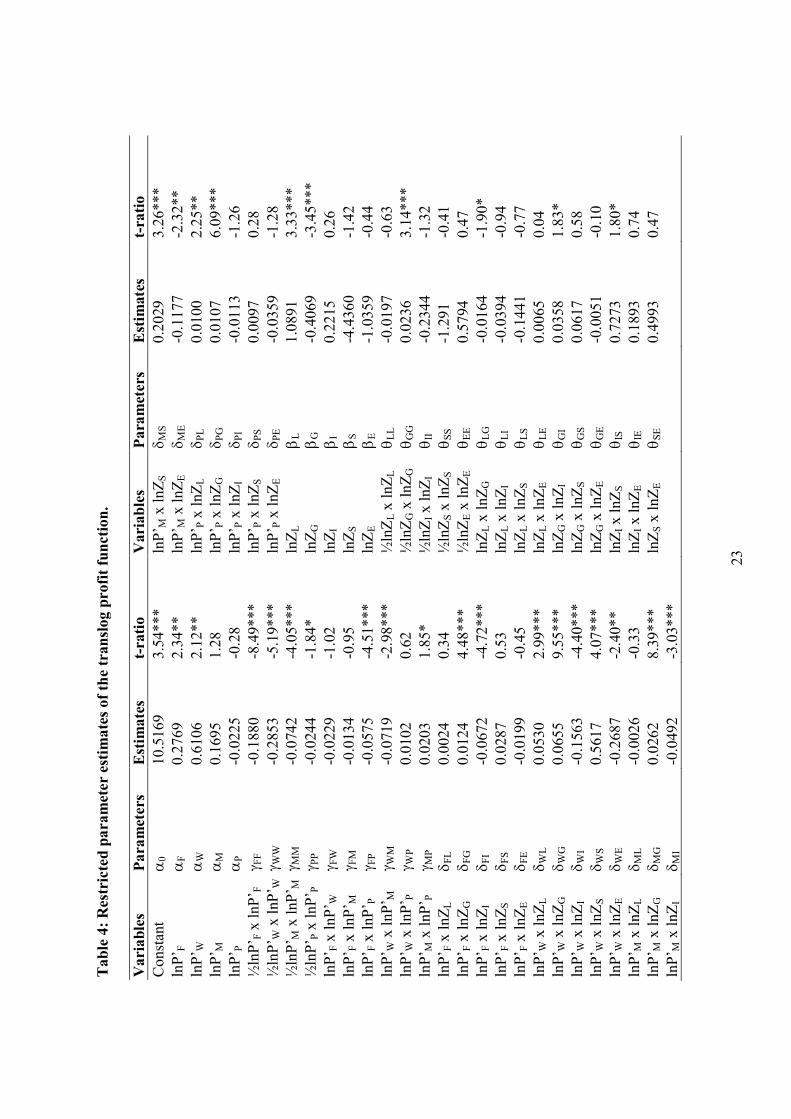
3.4. Effects of farmers’ environmental awareness on resource allocation decisions
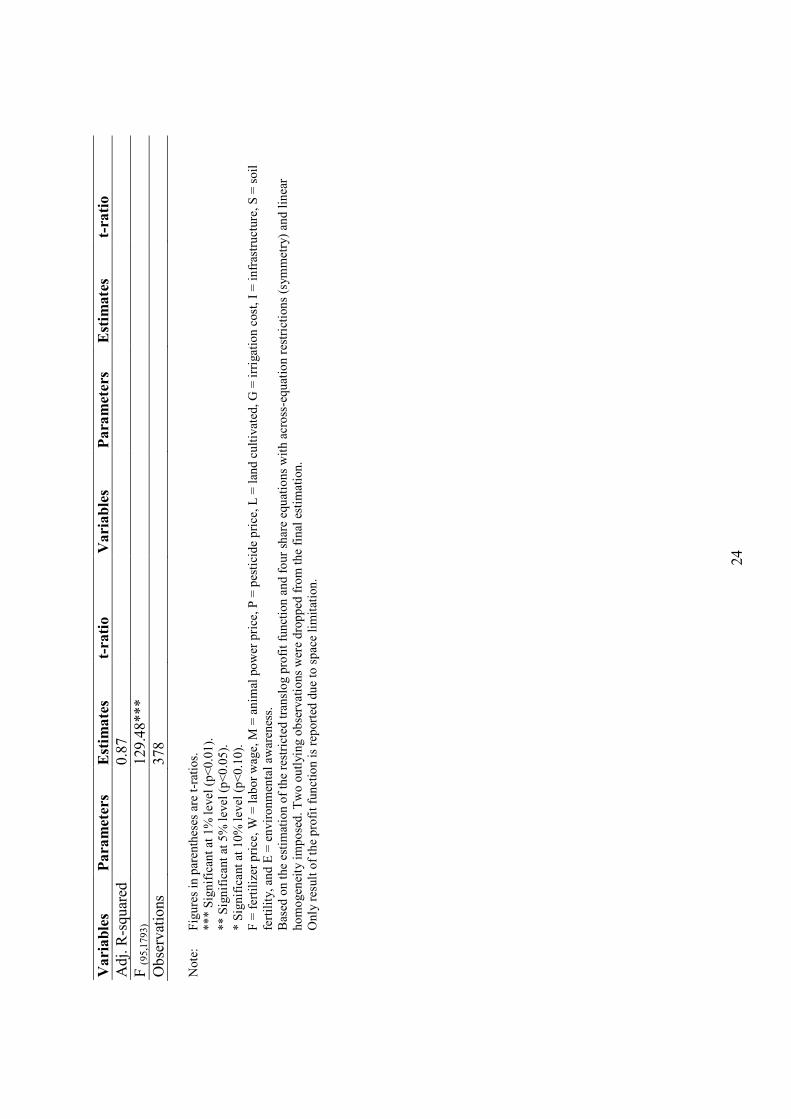
Table 4 presents the estimates of the profit function estimated jointly with four input
demand equations. The value of the adjusted R-squared for the profit function (from OLS) is
0.87 indicating a remarkable fit. Also, 28 of the total 54 parameters are significantly different
from zero at the least the 10% level. Significance of the interaction terms indicates the non-
linearity in the production structure, which justifies the use of a translog instead of a more
restrictive Cobb-Douglas model.
Table 4 about here
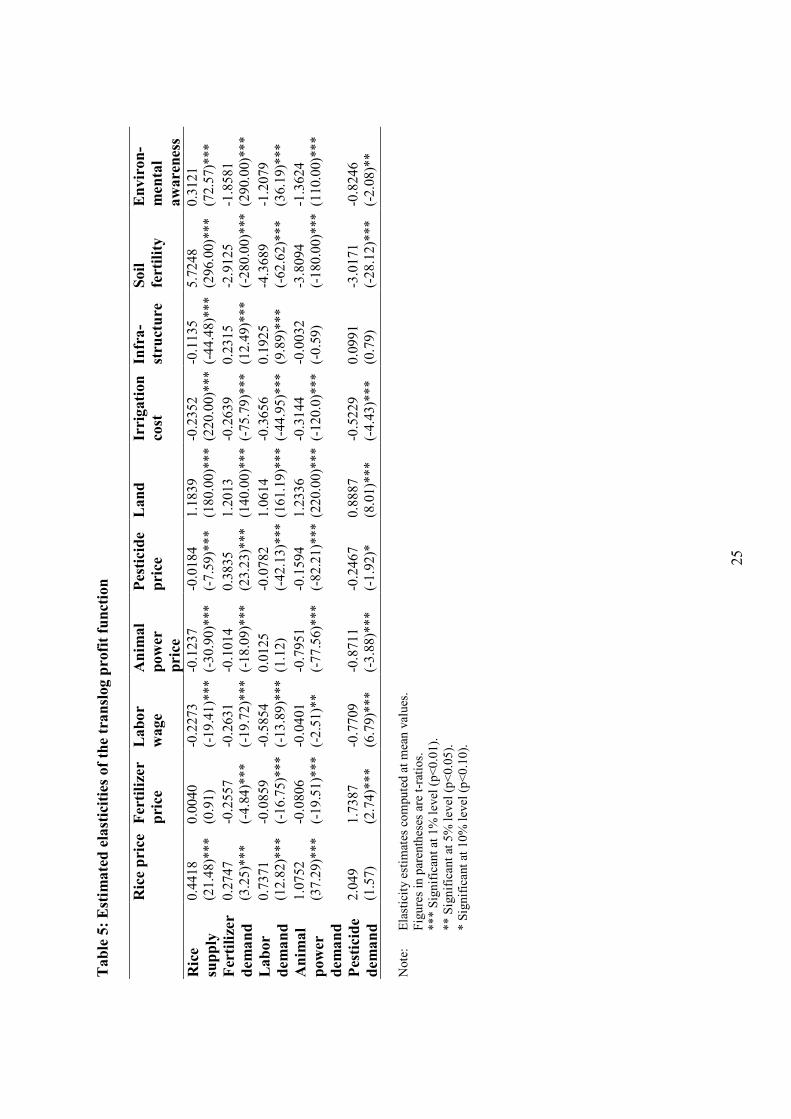
The parameter estimates of the profit function model are used to estimate the
elasticities with respect to variable input demand and output supply (Table 5). Forty-five of
the 50 elasticity estimates are significantly different from zero at least the 10% level
indicating that modern rice farmers are responsive to change in prices as well as fixed factor
endowments including environmental awareness. The supply response of farmers to a rise in
14
rice price is positive as expected, but inelastic. A 1% increase in the rice price will increase
its supply by 0.44%. On the other hand, the effect of a rise in rice prices will significantly
boost pesticide demand (2.05) followed by demand for animal power services (1.08).
All own price elasticities have negative signs consistent with theory, but are in the
inelastic range. Price elasticities of demand for fertilizers and pesticides are similar, estimated
at –0.25.
Table 5 about here
Among the fixed factor endowments, supply response to an expansion in the land area
is high as expected. A 1% increase in land area will increase rice supply by 1.2%. Among the
inputs, response to an expansion in land area is also high. A 1% increase in land area under
modern varieties will increase fertilizer demand by 1.2% and pesticide demand by 0.9%,
thereby reinforcing the chemical intensity argument of this GR technology. Increases in the
cost of irrigation have a depressing effect on input demand as well as output supply. Farooq
et al., (2001) also report negative impacts of irrigation cost on input demand in Basmati rice
production in Pakistan. Demand for chemical inputs (fertilizers and pesticides) is higher in
underdeveloped regions10 although the supply of output is higher in developed regions.
Hossain et al. (1990) and Ahmed and Hossain (1990) also conclude that diffusion of modern
agricultural technology is higher in underdeveloped regions, consequently exerting higher
demand on inputs, as there were little or no opportunities to engage in off-farm work to
support livelihood, which provide higher earnings as compared to rice production.
The influence of the soil fertility variable provides interesting insights. Demand for
inputs are lower in regions with relatively better soil fertility, as expected a priori. The
supply of rice is higher in fertile regions, which is also consistent with expectations. The
responsiveness is very high indicating that it would make economic sense to invest in soil
conservation measures to raise soil fertility in deprived and/or degraded areas11.
15
Turning to our variable of interest, we see that the demand for all inputs by the
environmentally aware farmers is lower and largely in the elastic range. A 1% increase in
awareness leads to a decrease in demand for fertilizers by 1.9%, labor by 1.2%, animal power
services by 1.4% and pesticides by 0.8%, respectively. This is expected since ‘decline in soil
fertility’, ‘effect on human health’ and ‘hardening/compaction of soils’ tops the list of
impacts across all regions (see Table 2), which induces farmers to use inputs, particularly
chemicals, more cautiously in order to avoid further environmental damage. Coelli et al.,
(2002) note that Bangladeshi rice farmers systematically overuse all major inputs, particularly
labor and fertilizers. Therefore, relatively lower use of inputs by environmentally aware
farmers is not expected to affect rice output adversely. This expectation is confirmed by a
small but positive increase in output supply in response to an increase in environmental
awareness, estimated at only 0.3%.
5. Conclusions and policy implications
The study deals with one of the least touched upon issues associated with the
diffusion of modern agricultural technology, specifically the relationship between
technological change, resource allocation decisions and farmers’ environmental awareness.
Results reveal that ‘level’ and ‘duration’ of involvement with modern rice production has a
positive impact on farmers’ environmental awareness. Farmers’ environmental awareness, on
the other hand, has desired impacts on resource use and productivity. Farmers who are aware
of the adverse environmental impacts of modern agricultural technology use relatively less of
all inputs in order to avoid further damage to the environment. Therefore, raising farmers’
environmental awareness is expected to enhance the intangible benefit accruing from a less
chemical intensive environment. Also, measures to replenish soil fertility are expected to
induce less use of chemicals and enhance productivity. It is hoped that the results of this
16
study will assist in developing an agricultural development strategy conducive to maintaining
or even increasing agricultural production without further depleting environmental quality.
Acknowledgements
The author is grateful to Noel Russell and the anonymous Referees for valuable suggestions
and comments. The author alone is responsible for remaining errors.
Notes
1. Although this issue was studied in Rahman (2003), we have re-analyzed the data for modern rice producers only to obtain estimates of farmers’ environmental awareness for inclusion in the profit function.
2. This nested procedure reduces any potential bias that may arise from using a raw index of
farmers’ perception as a proxy for environmental awareness. 3. Information on physical and chemical properties of soil from selected farmers’ fields was
collected to evaluate the general fertility status of the soil and to examine inter-regional differences (if any) between the study areas. Ten soil-fertility parameters were tested (1) soil pH; (2) available nitrogen; (3) available potassium; (4) available phosphorus; (5) available sulfur; (6) available zinc; (7) soil texture; (8) cation exchange capacity (CEC) of soil; (9) soil organic matter content; and (10) electrical conductivity of soil. The soil fertility index was constructed from test results of these soil samples. High index values refer to better soil fertility.
4. The index of infrastructure was constructed using the cost of access approach. A total of
13 elements were considered: (1) primary market; (2) secondary market; (3) storage facility; (4) rice mill; (5) paved road; (6) bus stop; (7) bank; (8) union office; (9) agricultural extension office; (10) high school; (11) college; (12) thana (sub-district) headquarter; and (13) post office. High index values refer to highly underdeveloped infrastructure (for details of construction procedure, see Ahmed and Hossain, 1990).
5. Construction procedure of the farmers’ environmental awareness index is detailed in
Rahman (2003) and Rahman and Thapa (1999). However, for the ease of exposition, the procedure is briefly described in this paper with permission.
6. This formulation provides an aggregated environmental awareness index unlike that of
Rahman (2003), who reports a normalized version of this index by dividing it by the total number of impacts.
7. For details of the theoretical framework underlying the use of Tobit model for
determinant analysis and justification on the choice of explanatory variables, see Rahman (2003).

17
8. Several studies validate that Bangladeshi farmers are profit maximizers (Hossain, 1989; Hossain et al., 1990; Ahmed and Hossain, 1990).
9. Intercooled Stata Version 8 software was used for the analyses. 10. The index reflects the underdevelopment of infrastructure, and therefore, a negative sign
indicates positive effect on the dependent variable. 11. It should be noted that a 1% increase in the soil fertility index implies a major
improvement in soil nutrient levels. Therefore, this high level of responsiveness does not come as a surprise.
References
Adesina, A.A., Zinnah, M.M., 1993. Technology characteristics, farmers’ perceptions and adoption decisions: a tobit model application in Sierra Leone. Agricultural Economics, 9, 297–311.
Ahmed, R., Hossain, M., 1990. Developmental Impact of Rural Infrastructure in Bangladesh. Research Report. No.83. International Food Policy Research Institute, Washington, D.C.
Alauddin, M., Tisdell, C., 1991. The Green Revolution and Economic Development: The Process and its Impact in Bangladesh. Macmillan, London.
Ali, A.M.S., 2003. Farmers’ knowledge of soils and the sustainability of agriculture in a saline water ecosystem in Southwestern Bangladesh. Geoderma, 111, 333–353.
Ali, M.M., Shaheed, S.M., Kubota, D., Masunaga, T., Wakatsuki, T., 1997. Soil degradation during the period 1967 – 1995 in Bangladesh, 2: selected chemical characters. Soil Science and Plant Nutrition, 43, 879–890.
Antle, J.M., Pingali, P.L., 1994. Pesticides, productivity, and farmer health: a Philippine case study. American Journal of Agricultural Economics, 76, 418–430.
Baanante, C.A., Henao, J., Wan, X., 1993. Fertilizer Subsidy Removal in Bangladesh: An Assessment of the Impact of Fertilizer Use, Crop Yields, and Profits of Farmers. International Fertilizer Development Center, Muscle Shoals, Alabama.
Baidu-Forson, J., 1999. Factors influencing adoption of land-enhancing technology in the Sahel: lessons from a case study in Niger. Agricultural Economics, 20, 231–239.
BBS., 2001. Yearbook of Agricultural Statistics of Bangladesh, 1999. Bangladesh Bureau of Statistics, Dhaka.
Bowonder, B., 1979. Impact analysis of the Green Revolution in India. Technological forecasting and social change, 15, 297–313.
Bowonder, B., 1981. The myth and realities of HYVs in Indian agriculture. Development and Change, 12, 293–313.
Brown, L.R., 1988. The Changing World Food Prospect: The Nineties and Beyond. Worldwatch Paper No. 85. Washington, D.C.: Worldwatch Institute.
Clapham, W.B., 1980. Environmental problems, development, and agricultural production systems. Environmental Conservation, 7, 145–153.
Coelli, T., Rahman, S., Thirtle, C., 2002. Technical, allocative, cost and scale efficiencies in Bangladesh rice cultivation: a non-parametric approach. Journal of Agricultural Economics, 53, 607–626.

18
Coelli, T., Rahman, S., Thirtle, C., 2003. A stochastic frontier approach to total factor productivity measurement in Bangladesh crop agriculture, 1961–92. Journal of International Development, 15, 321–333.
Das, R.J., 2002. The green revolution and poverty: a theoretical and empirical examination of the relation between technology and society. Geoforum, 33, 55–72.
Eicher, C.K., 1995. Zimbabwe’s maize-based green revolution: preconditions for replication. World Development, 23, 805–818.
Farooq, U., Young, T., Russell, N., Iqbal, M., 2001. The supply response of Basmati rice growers in Punjab, Pakistan: price and non-price determinants. Journal of International Development, 13, 227–237.
Freebairn, D.K., 1995. Did the Green Revolution concentrate incomes? A quantitative study of research reports. World Development, 23, 265–279.
Griffin, K., 1974. The Political Economy of Agrarian Change: An Essay on the Green Revolution. Cambridge, M.A.: Harvard University Press.
Hayami, Y., Ruttan, V.W., 1985. Agricultural Development: an International Perspective. 2nd Edition. Baltimore: Johns Hopkins University Press.
Hazell, P.B.R., Ramasamy, C., 1991. The Green Revolution Reconsidered. Baltimore: Johns Hopkins University Press.
Hossain, M., 1989. Green Revolution in Bangladesh: Impact on Growth and Distribution of Income. University Press Limited, Dhaka.
Hossain, M., Quasem, M.A., Akash, M.M., Jabber, M.A., 1990. Differential Impact of Modern Rice Technology: The Bangladesh Case. Bangladesh Institute of Development Studies, Dhaka.
Husain, A.M.M., Hossain, M., Janaiah, A., 2001. Hybrid Rice Adoption in Bangladesh: A Socioeconomic Assessment of Farmers’ Experiences. Research Monograph Series No. 18. BRAC/IRRI, Dhaka.
Lipton, M., Longhurst, R., 1989. New Seeds and Poor People. London: Unwin Hyman. Mbaga-Semgalawe, Z., Folmer, H., 2000. Household adoption behavior of improved soil
conservation: the case of the North Pare and West Usambara Mountains of Tanzania. Land Use Policy, 17, 321–336.
McDonald, J.F., Moffit, R.A., 1980. The uses of Tobit analysis. Review of Economics and Statistics, 61, 318–321.
Mellor, J.W., 1978. Food price policy and income distribution in low-income countries. Economic Development and Cultural Change, 27, 1–26.
Negatu, W., Parikh, A., 1999. The impact of perception and other factors in the adoption of agricultural technology in the Moret and Jiru Woreda (district) of Ethiopia. Agricultural Economics, 21, 205–216.
Otsuka, K., 2000. Role of agricultural research in poverty reduction: lessons from the Asian experience. Food Policy, 25, 447–462.
Payton, R.W., Barr, J.J.F., Martin, A., Sillitoe, P., Deckers, J.F., Gowing, J.W., Hatibu, N., Naseem, S.B., Tenywa, M., Zuberi, M.I., 2003. Contrasting approaches to integrating indigenous knowledge about soils and scientific soil survey in East Africa and Bangladesh. Geoderma, 111, 355–386.
Pimentel, D., 1996. Green Revolution and chemical hazards. The Science of the Total Environment, 188 (Supplement 1), S86–S98.
Rahman, S., 1999. The impact of technological change on income distribution and poverty in Bangladesh agriculture: an empirical analysis. Journal of International Development, 11, 935–955.
Rahman, S., 2002. Technological change and food production sustainability in Bangladesh agriculture. Asian Profile, 30, 233–245.
19
Rahman, S., 2003. Environmental impacts of modern agricultural technology diffusion in Bangladesh: an analysis of farmers’ perceptions and their determinants. Journal of Environmental Management, 68, 183–191.
Rahman, S., Thapa, G.B., 1999. Environmental impacts of technological change in Bangladesh agriculture: farmers’ perceptions and empirical evidence”. Outlook on Agriculture, 28, 233–238.
Redclift, M., 1989. The environmental consequences of Latin America’s agricultural development: some thoughts on the Brundtland Commission report. World
Development, 17, 365–377. Shiva, V., 1991. The Violence of the Green Revolution: Third World Agriculture, Ecology and
Politics. London: Zed Books. Sidhu, S.S., Baanate, C.A., 1981. Estimating farm-level input demand and wheat supply in
the Indian Punjab using a translog profit function. American Journal of Agricultural Economics, 63, 237–246.
Singh, R.B., 2000. Environmental consequences of agricultural development: a case study from the Green Revolution state of Haryana, India. Agriculture, Ecosystem and Environment, 82, 97–103.
Tzouvelekas, V., Pantzios, C.J., Fotopoulos, C., 2001. Technical efficiency of alternative farming systems: the case of Greek organic and conventional olive growing farms. Food Policy, 26, 549–569.
Wadud, A., White, B., 2000. Farm household efficiency in Bangladesh: a comparison of stochastic frontier and DEA methods. Applied Economics, 32, 1665–1673.
Wolf, E.C., 1986. Beyond the Green Revolution: New Approaches for Third World Agriculture. Worldwatch Paper No. 73. Washington, D.C.: Worldwatch Institute.
20
Table 1: Description and summary statistics of the variables.
Name
Description
Units
Mean Standard
deviation
Variables used in the Tobit m
odel explaining farmers’ environmental awareness
EAI
Aggregate environmental awareness index
Number
4.47
1.95
MVAREA Cultivated land under modern rice
Hectare
0.73
0.79
DURN
Experience with growing modern rice
Years
10.28
5.23
IRRIG
Proportion of total area under modern irrigation Percent
0.65
0.28
AGE
Age of the farmer
Years
46.69
14.54
EDUC
Education of the farmer
Completed years of schooling
3.69
4.28
SUBP
Subsistence pressure measured by family size
Persons per household
5.98
2.52
TENU
Tenurial status (proportion of land rented-in)
Percent
0.20
0.29
EXTN
Extension contact in past one year
Value is 1 if had extension contact, 0 otherwise
0.13
0.33
OFFY
Proportion of off-farm income
Percent of total household income
0.21
0.31
Variables used in the profit function m
odel
PR
Profit from modern rice production
Taka
10203.74 12345.33
Y
Quantity of modern rice output
Kg
2974.51
3153.39
XF
Quantity of fertilizers
Kg
178.93
197.48
XW
Quantity of labor
Person-days
63.11
57.21
XM
Quantity of animal power services
Animal pair-days
19.37
20.99
XP
Quantity of pesticides
100 gm/ml of active ingredients
2.74
3.91
YR
Rice price
Taka per kg
5.64
0.44
F
Fertilizer price
Taka per kg
6.42
1.14
W
Labor wage
Taka per person-day
45.48
8.26
M
Animal power price
Taka per pair-day
84.63
17.77
P
Pesticide price
Taka per 100 gm/ml of active ingredients
83.58
15.56
L
Land cultivated under modern varieties of rice Hectare
0.73
0.79
G
Cost of irrigation
Taka
1655.16
2471.83
I Index of underdevelopment of infrastructure
Number
34.25
14.88
S
Soil fertility index
Number
1.69
0.19
E
Environmental awareness index (
IA
Eˆ)
Number
4.47
0.70
21
Table 2: Farmers’ environmental awareness.
Environmental im
pacts of
modern agricultural
technology
Weighted index of farm
ers’ perceptions
Comilla region
Jamalpur region
Jessore region
All region
Mean St.dev Rank
Mean St.dev Rank Mean St.dev Rank Mean St.dev Rank
Reduces soil fertility
0.628
0.42
1
0.821
0.36
1
0.940
0.18
1
0.798
0.36
1
Affects human health
0.457
0.36
3
0.597
0.40
2
0.786
0.33
2
0.607
0.39
2
Reduces fish catch
0.579
0.32
2
0.547
0.44
3
0.594
0.46
4
0.568
0.41
3
Increases disease in crops
0.447
0.39
4
0.502
0.41
4
0.598
0.40
3
0.512
0.40
4
Compacts/ hardens soil
0.404
0.42
5
0.352
0.37
6
0.588
0.39
5
0.428
0.40
5
Increases insect/ pest attack
0.113
0.26
8
0.416
0.42
7
0.568
0.44
6
0.372
0.42
6
Increases soil erosion
0.094
0.26
12
0.386
0.39
5
0.486
0.37
7
0.331
0.38
7
Increases soil salinity
0.219
0.35
6
0.277
0.36
8
0.414
0.42
8
0.297
0.38
8
Contaminates water source
0.077
0.20
7
0.259
0.37
9
0.232
0.35
9
0.201
0.33
9
Increases toxicity in soil
0.089
0.23
10
0.144
0.29
11
0.158
0.33
11
0.132
0.29
10
Creates water logging
0.043
0.20
9
0.149
0.30
10
0.164
0.33
10
0.124
0.29
11
Increases toxicity in water
0.113
0.26
11
0.122
0.28
12
0.062
0.20
12
0.104
0.26
12
All impacts
3.264
1.70
- 4.571
1.82
- 5.590
1.68
- 4.475
1.95
-
Number of farms (N)
106
174
100
380
Rank correlation among regions (Spearman correlation coefficient r s)
Comilla region
1.00
Jamalpur region
0.78***
1.00
Jessore region
0.84**
0.97***
1.00
All region
0.83***
0.96***
0.99***
1.00
Note:
Higher value of index refers to stronger perception.
*** Significant at 1% level (p<0.01).
** Significant at 5% level (p<0.05).
Source: Modified and recomputed from Rahman (2003) and Rahman and Thapa (1999).
22
Table 3. Estim
ated environmental awareness model for Bangladeshi modern rice farmers
Indep
endent variables
Depen
dent variable: Aggregate environmental awareness index
Tobit estim
ates
Asymptotic t-ratio
Constant
3.6993
7.90***
Cultivated land under modern rice
0.3733
2.69***
Experience of growing modern rice
0.0553
2.94***
Irrigation facilities
-0.8087
-2.29**
Education of farmer
0.0676
2.65***
Age of farmer
0.0016
0.22
Subsistence pressure
0.0038
0.09
Tenurial status
-0.5026
-1.40
Extension contact
0.5555
1.88*
Off-farm income share
0.6437
1.98**
Log-likelihood
-767.407
Likelihood Ratio test (χ
29, 0.95)
51.88***
Note:
*** Significant at 1% level (p<0.01).
** Significant at 5% level (p<0.05).
* Significant at 10% level (p<0.10).
23
Table 4: Restricted parameter estimates of the translog profit function.
Variables
Parameters
Estim
ates
t-ratio
Variables
Parameters
Estim
ates
t-ratio
Constant
α0
10.5169
3.54***
lnP’ M x lnZS
δMS
0.2029
3.26***
lnP’ F
αF
0.2769
2.34**
lnP’ M x lnZE
δME
-0.1177
-2.32**
lnP’ W
αW
0.6106
2.12**
lnP’ P x lnZL
δPL
0.0100
2.25**
lnP’ M
αM
0.1695
1.28
lnP’ P x lnZG
δPG
0.0107
6.09***
lnP’ P
αP
-0.0225
-0.28
lnP’ P x lnZI
δPI
-0.0113
-1.26
½lnP’ F x lnP’ F γ FF
-0.1880
-8.49***
lnP’ P x lnZS
δPS
0.0097
0.28
½lnP’ W x lnP’ W γ W
W
-0.2853
-5.19***
lnP’ P x lnZE
δPE
-0.0359
-1.28
½lnP’ M x lnP’ M γ M
M
-0.0742
-4.05***
lnZL
βL
1.0891
3.33***
½lnP’ P x lnP’ P γ PP
-0.0244
-1.84*
lnZG
βG
-0.4069
-3.45***
lnP’ F x lnP’ W
γ FW
-0.0229
-1.02
lnZI
βI
0.2215
0.26
lnP’ F x lnP’ M
γ FM
-0.0134
-0.95
lnZS
βS
-4.4360
-1.42
lnP’ F x lnP’ P
γ FP
-0.0575
-4.51***
lnZE
βE
-1.0359
-0.44
lnP’ W x lnP’ M
γ WM
-0.0719
-2.98***
½lnZL x lnZL
θLL
-0.0197
-0.63
lnP’ W x lnP’ P
γ WP
0.0102
0.62
½lnZG x lnZG
θGG
0.0236
3.14***
lnP’ M x lnP’ P
γ MP
0.0203
1.85*
½lnZI x lnZI
θII
-0.2344
-1.32
lnP’ F x lnZL
δFL
0.0024
0.34
½lnZS x lnZS
θSS
-1.291
-0.41
lnP’ F x lnZG
δFG
0.0124
4.48***
½lnZE x lnZE
θEE
0.5794
0.47
lnP’ F x lnZI
δFI
-0.0672
-4.72***
lnZL x lnZG
θLG
-0.0164
-1.90*
lnP’ F x lnZS
δFS
0.0287
0.53
lnZL x lnZI
θLI
-0.0394
-0.94
lnP’ F x lnZE
δFE
-0.0199
-0.45
lnZL x lnZS
θLS
-0.1441
-0.77
lnP’ W x lnZL
δWL
0.0530
2.99***
lnZL x lnZE
θLE
0.0065
0.04
lnP’ W x lnZG
δWG
0.0655
9.55***
lnZG x lnZI
θGI
0.0358
1.83*
lnP’ W x lnZI
δWI
-0.1563
-4.40***
lnZG x lnZS
θGS
0.0617
0.58
lnP’ W x lnZS
δWS
0.5617
4.07***
lnZG x lnZE
θGE
-0.0051
-0.10
lnP’ W x lnZE
δWE
-0.2687
-2.40**
lnZI x lnZS
θIS
0.7273
1.80*
lnP’ M x lnZL
δML
-0.0026
-0.33
lnZI x lnZE
θIE
0.1893
0.74
lnP’ M x lnZG
δMG
0.0262
8.39***
lnZS x lnZE
θSE
0.4993
0.47
lnP’ M x lnZI
δMI
-0.0492
-3.03***
24
Variables
Parameters
Estim
ates
t-ratio
Variables
Parameters
Estim
ates
t-ratio
Adj. R-squared
0.87
F (95,1793)
129.48***
Observations
378
Note:
Figures in parentheses are t-ratios.
*** Significant at 1% level (p<0.01).
** Significant at 5% level (p<0.05).
* Significant at 10% level (p<0.10).
F = fertilizer price, W = labor wage, M = animal power price, P = pesticide price, L = land cultivated, G = irrigation cost, I = infrastructure, S = soil
fertility, and E = environmental awareness.
Based on the estimation of the restricted translog profit function and four share equations with across-equation restrictions (symmetry) and linear
homogeneity imposed. Two outlying observations were dropped from the final estimation.
Only result of the profit function is reported due to space limitation.
25
Table 5: Estim
ated elasticities of the translog profit function
Rice price Fertilizer
price
Labor
wage
Anim
al
power
price
Pesticide
price
Land
Irrigation
cost
Infra-
structure
Soil
fertility
Environ-
mental
awareness
Rice
supply
0.4418
0.0040
-0.2273
-0.1237
-0.0184
1.1839
-0.2352
-0.1135
5.7248
0.3121
(21.48)*** (0.91)
(-19.41)*** (-30.90)*** (-7.59)*** (180.00)*** (220.00)*** (-44.48)*** (296.00)*** (72.57)***
Fertilizer
demand
0.2747
-0.2557
-0.2631
-0.1014
0.3835
1.2013
-0.2639
0.2315
-2.9125
-1.8581
(3.25)***
(-4.84)*** (-19.72)*** (-18.09)*** (23.23)*** (140.00)*** (-75.79)*** (12.49)*** (-280.00)*** (290.00)***
Labor
demand
0.7371
-0.0859
-0.5854
0.0125
-0.0782
1.0614
-0.3656
0.1925
-4.3689
-1.2079
(12.82)*** (-16.75)*** (-13.89)*** (1.12)
(-42.13)*** (161.19)*** (-44.95)*** (9.89)***
(-62.62)*** (36.19)***
Anim
al
power
demand
1.0752
-0.0806
-0.0401
-0.7951
-0.1594
1.2336
-0.3144
-0.0032
-3.8094
-1.3624
(37.29)*** (-19.51)*** (-2.51)**
(-77.56)*** (-82.21)*** (220.00)*** (-120.0)*** (-0.59)
(-180.00)*** (110.00)***
Pesticide
demand
2.049
1.7387
-0.7709
-0.8711
-0.2467
0.8887
-0.5229
0.0991
-3.0171
-0.8246
(1.57)
(2.74)***
(6.79)***
(-3.88)***
(-1.92)*
(8.01)***
(-4.43)*** (0.79)
(-28.12)*** (-2.08)**
Note:
Elasticity estimates computed at mean values.
Figures in parentheses are t-ratios.
*** Significant at 1% level (p<0.01).
** Significant at 5% level (p<0.05).
* Significant at 10% level (p<0.10).