emir 2013 presentation
TRANSCRIPT

8/13/2019 Emir 2013 Presentation
http://slidepdf.com/reader/full/emir-2013-presentation 1/69
Delivering aprofitable waterpure-play
Kemira Capital Markets Day 2013, September 10
Wolfgang Büchele, President and CEO
8/13/2019 Emir 2013 Presentation
http://slidepdf.com/reader/full/emir-2013-presentation 2/69
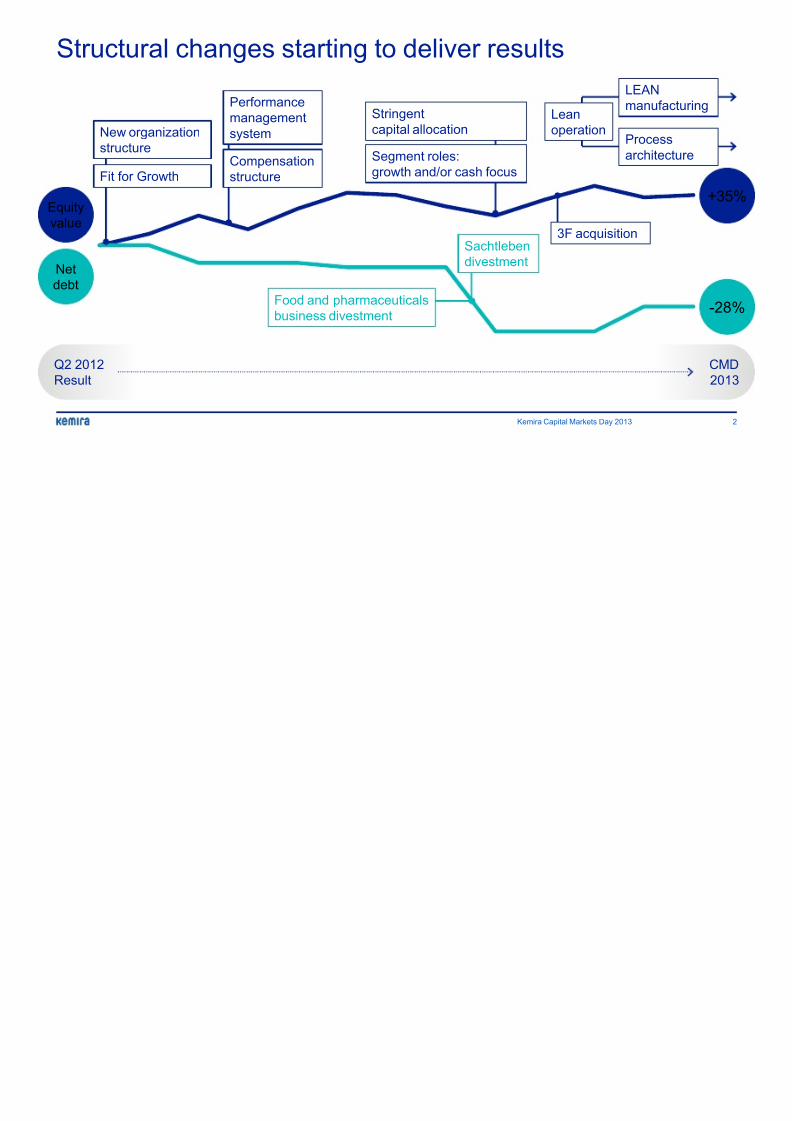
Structural changes starting to deliver results
Food and pharmaceuticals
business divestment
Sachtleben
divestment
Stringent
capital allocation
L
m
3F acquisitio
New organizationstructure
Fit for Growth
Segment roles:
growth and/or cash focus
Netdebt
Equity
value
Kemira Capital Markets Day 2013
Performance
management
system
Compensation
structure
Pa
Lean
operation
Q2 2012
Result
8/13/2019 Emir 2013 Presentation
http://slidepdf.com/reader/full/emir-2013-presentation 3/69
Managing businesses from their growth regions
Oil & Mining
management based
in Atlanta, US
Municipal & Industrial
management relocatingfrom Helsinki to Frankfurt
Paper m
relocatin
to Hong
EMEA Paper management
relocating from Helsinki to
Frankfurt
Kemira Capital Markets Day 2013
8/13/2019 Emir 2013 Presentation
http://slidepdf.com/reader/full/emir-2013-presentation 4/69
2012 Q4 2012 Q1 2013
0
200
400
600
800
1,000
1,200
1,400
1,600
Jan 2012 Jun 2012 Dec 2012 Mar 2013 Jun 2013
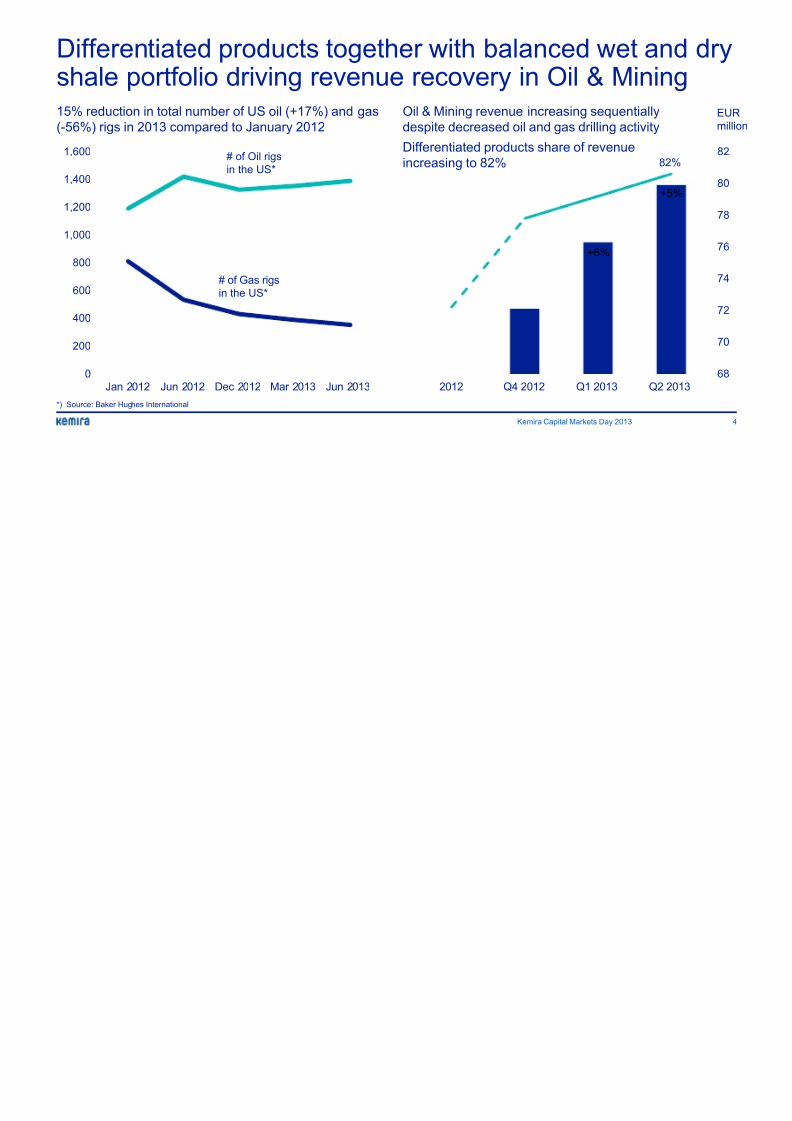
Differentiated products together with balanced weshale portfolio driving revenue recovery in Oil & M15% reduction in total number of US oil (+17%) and gas
(-56%) rigs in 2013 compared to January 2012
Oil & Mining revenue increasing sequen
despite decreased oil and gas drilling ac
Differentiated products share of revenue
increasing to 82%
+6%
# of Oil rigs
in the US*
# of Gas rigsin the US*
*) Source: Baker Hughes International
Kemira Capital Markets Day 2013
8/13/2019 Emir 2013 Presentation
http://slidepdf.com/reader/full/emir-2013-presentation 5/69
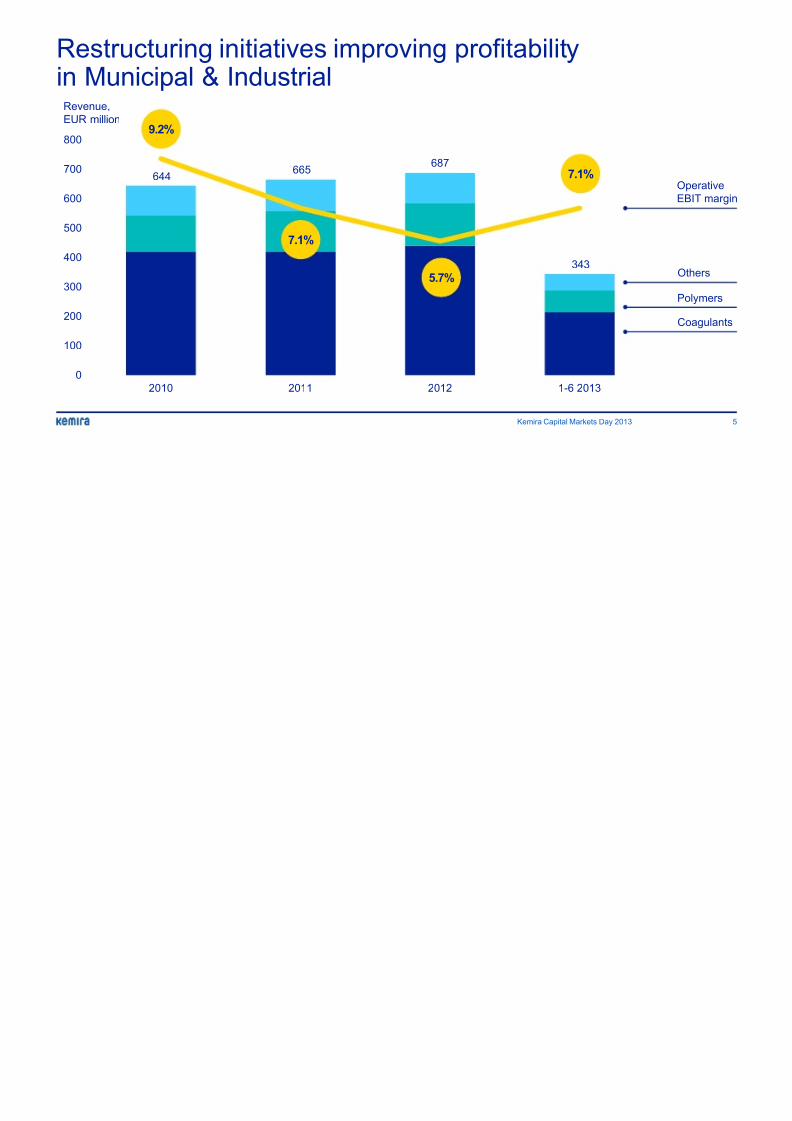
Restructuring initiatives improving profitabilityin Municipal & Industrial
0
100
200
300
400
500
600
700
800
2010 2011 2012 1-6 2013
7.1%
5.7%
7.1%
9.2%
644665
687
343
Revenue,
EUR million
Kemira Capital Markets Day 2013
8/13/2019 Emir 2013 Presentation
http://slidepdf.com/reader/full/emir-2013-presentation 6/69
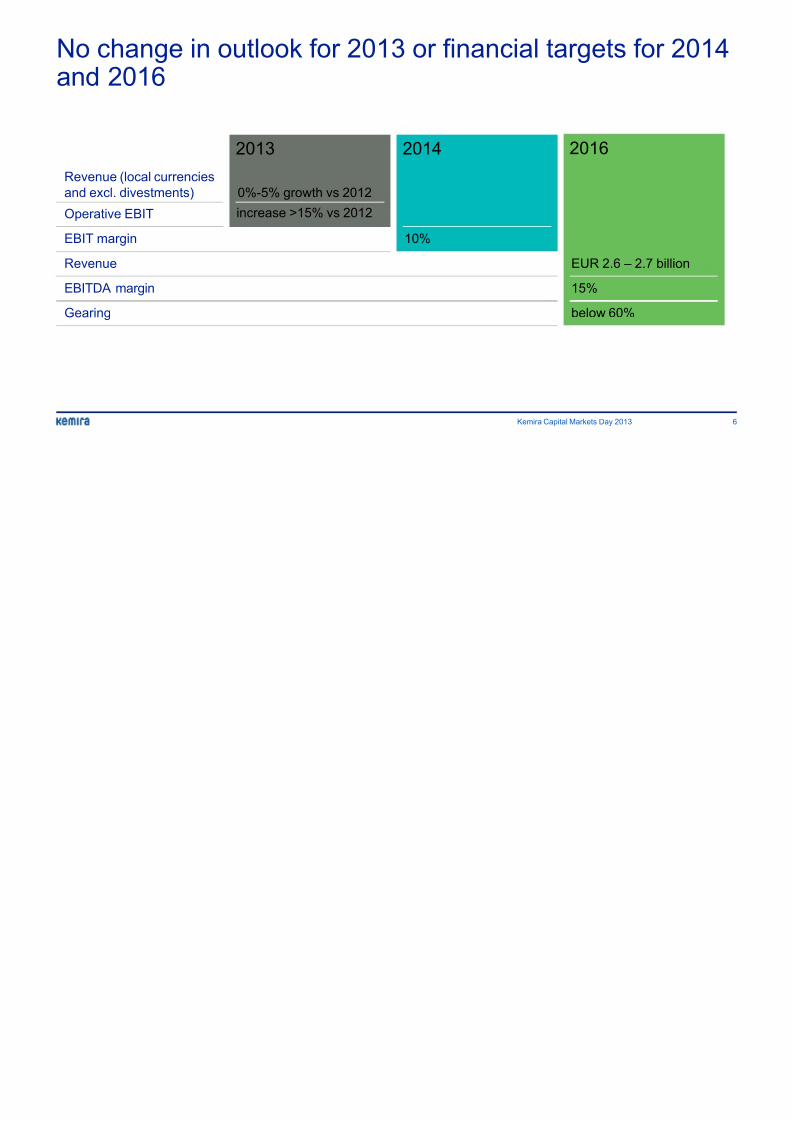
2013
Revenue (local currencies
and excl. divestments)
2014 2016
Operative EBIT
0%-5% growth vs 2012
EBIT margin 10%
Revenue
EBITDA margin
Gearing
EUR 2.6 –
15%
below 60%
increase >15% vs 2012
No change in outlook for 2013 or financial targets and 2016
Kemira Capital Markets Day 2013
8/13/2019 Emir 2013 Presentation
http://slidepdf.com/reader/full/emir-2013-presentation 7/69
Fit for Growth helping to deliver 2013 profit target*
Fit for Growth savings
expected to be EUR
15-20 million higher in
H2 2013 vs H2 2012
Input prices
trending up
*) Revenue in local currencies, excl. divestments 0%-5% growth vs 2012, Operative EBIT +15% vs 2012
Propylene price trend
Kemira Capital Markets Day 2013
850
1000
1150
1300
1/12 2/12 3/12 4/12 5/12 6/12 7/12 8/12 9/12 10/1211/1212/12 1/13 2/13 3/13 4
EU (EUR/MT, ICIS) NA (USD/pound, CMAI)
3
79 10
0
5
10
15
Q3 2012 Q4 2012 Q1 2013 Q2 2013 Q3 2
Fit for Growth savings, EUR million

8/13/2019 Emir 2013 Presentation
http://slidepdf.com/reader/full/emir-2013-presentation 8/69
External indicators show stable economic develoEMEA and NAFTA, uncertainty in emerging markKemira early warning dashboard
Kemira Capital Markets Day 2013
1. Lead time is the estimated time (months) between movement of indicator vs. resultant 2. Average new order value (3 months rolling)
Indicators Status Trend Ch
Overall WTI crude oil futures (9/13)
OECD + Emerging market bus. confidence index (6/13)
FOEX China BHKP pulp (9/13)
Chicago fed nat. activity (7/13)
EMEA IFO manufacturing business expectations (8/13)
Eurozone PMI survey (8/13)
NA S&P 500 index (9/13)
ISM business supplier deliveries (8/13)
SA Brazil industry production % growth (6/13)
Brazil company leading indicator (6/13)
APAC Major 5 Asia companies leading indicator (6/13)
China containerized freight index (8/13)
Contracting: indicator has decreased for at least 3 consecutive months
Expanding: indicator has increased for at least 3 consecutive months
Normal: indicator moves within standard deviation corridor
Above: indicator moves above standard deviation corridor
Below: indicator moves below standard deviation corridor
Trend
8/13/2019 Emir 2013 Presentation
http://slidepdf.com/reader/full/emir-2013-presentation 9/69
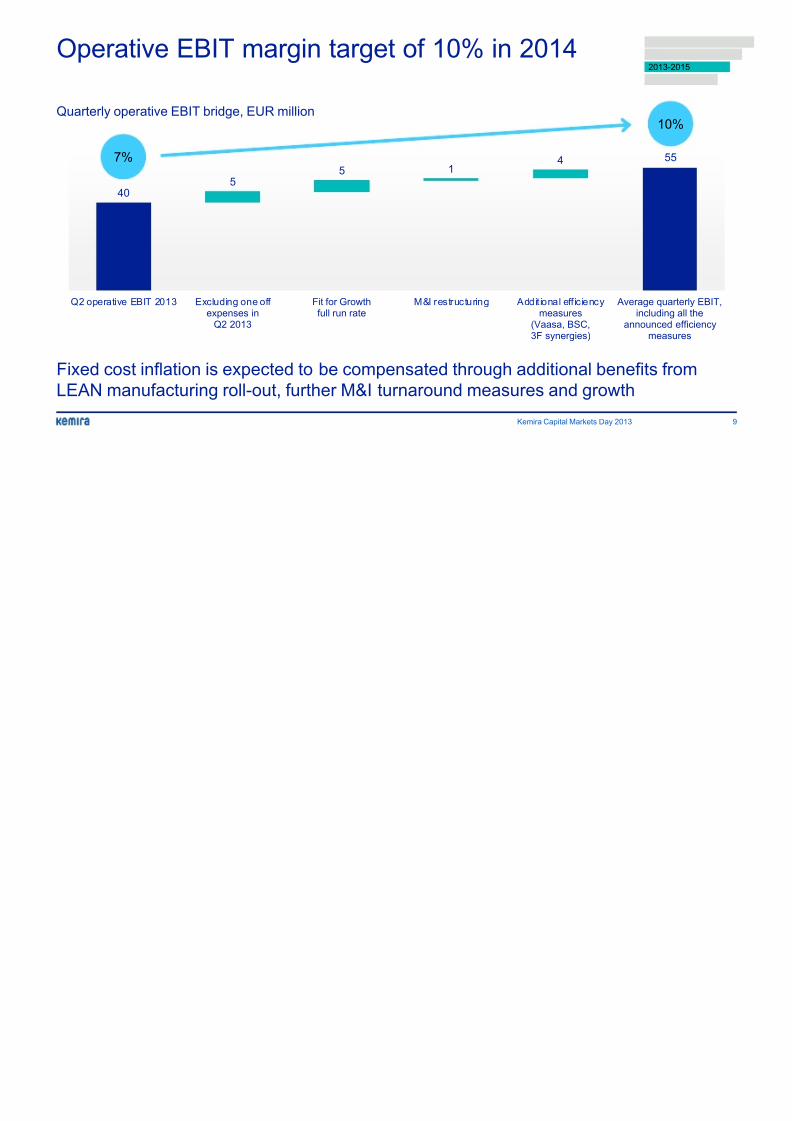
Operative EBIT margin target of 10% in 2014
Fixed cost inflation is expected to be compensated through additional bene
LEAN manufacturing roll-out, further M&I turnaround measures and growth
Q2 operative EBIT 2013 Excluding one off expenses in
Q2 2013
Fit for Growthfull run rate
M&I restructuring Addit ional eff iciencymeasures
(Vaasa, BSC,3F synergies)
Ave
a
40
415
5
Kemira Capital Markets Day 2013
Quarterly operative EBIT bridge, EUR million
7%

8/13/2019 Emir 2013 Presentation
http://slidepdf.com/reader/full/emir-2013-presentation 10/69
Capital allocation focusing on growth marketsand product lines
Targeted payback time for new greenfield investments is max. 7 years and
for capacity additions on existing productsFocus on Paper in China, strengthening Oil & Mining in mature markets,
South America, Middle East and Africa
65%35%
6.0%
2012
Capex split average
2010-2012
Targeted capex split
2016
Capex-to-sales ra
30% 70%
Kemira Capital Markets Day 2013
Differentiated products
Commodity products
8/13/2019 Emir 2013 Presentation
http://slidepdf.com/reader/full/emir-2013-presentation 11/69
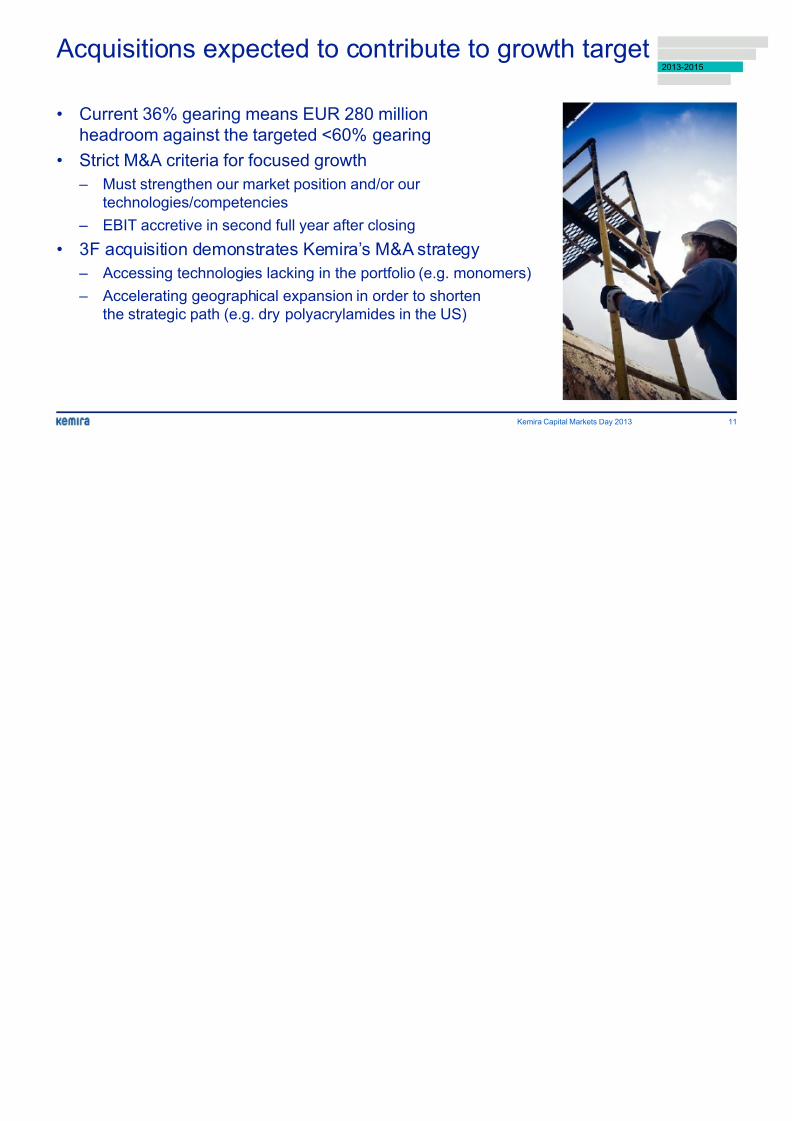
• Current 36% gearing means EUR 280 million
headroom against the targeted <60% gearing• Strict M&A criteria for focused growth
– Must strengthen our market position and/or our
technologies/competencies
– EBIT accretive in second full year after closing
• 3F acquisition demonstrates Kemira’s M&A strategy
– Accessing technologies lacking in the portfolio (e.g. monomers) – Accelerating geographical expansion in order to shorten
the strategic path (e.g. dry polyacrylamides in the US)
Acquisitions expected to contribute to growth targe
Kemira Capital Markets Day 2013
8/13/2019 Emir 2013 Presentation
http://slidepdf.com/reader/full/emir-2013-presentation 12/69
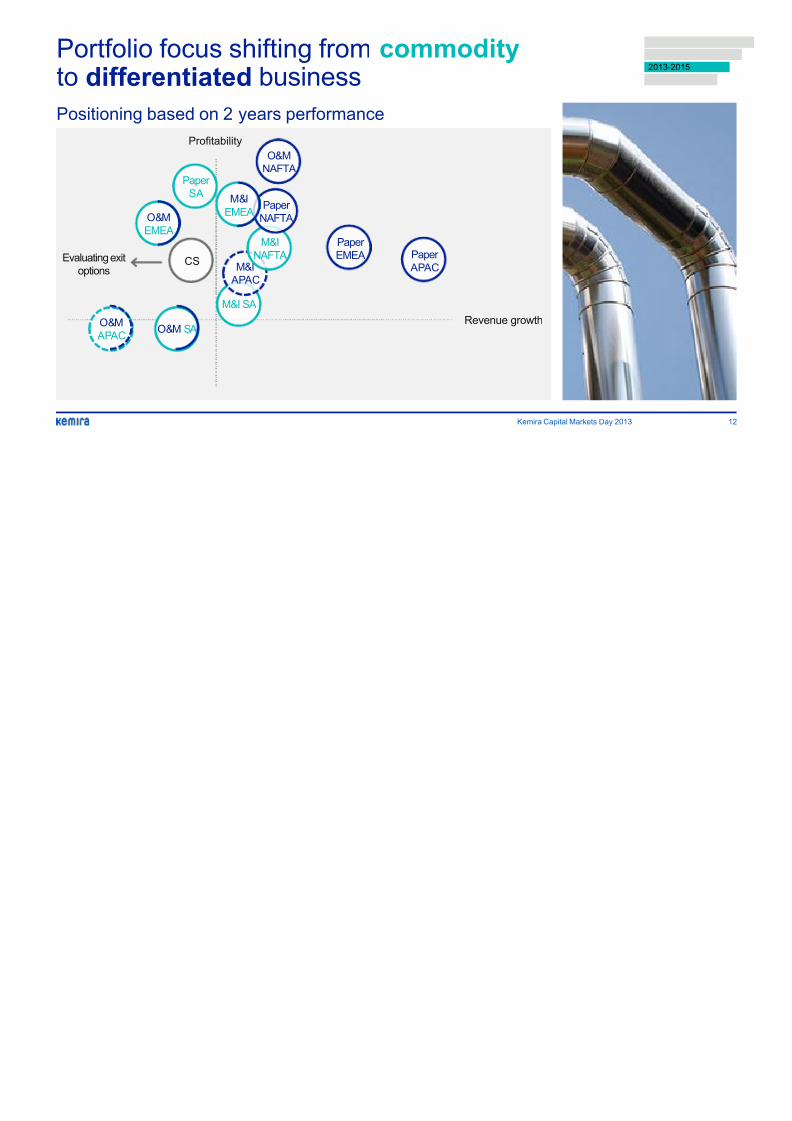
Positioning based on 2 years performance
Portfolio focus shifting from commodity to differentiated business
Kemira Capital Markets Day 2013
Revenue growth
Profitability
O&M SAO&M
APAC
M&I SA
M&I
APAC
M&I
NAFTA
O&M
EMEA
Paper
SA
O&M
NAFTA
Paper
NAFTA
Paper
EMEA Paper
APACCSEvaluating exit
options
M&I
EMEA
8/13/2019 Emir 2013 Presentation
http://slidepdf.com/reader/full/emir-2013-presentation 13/69
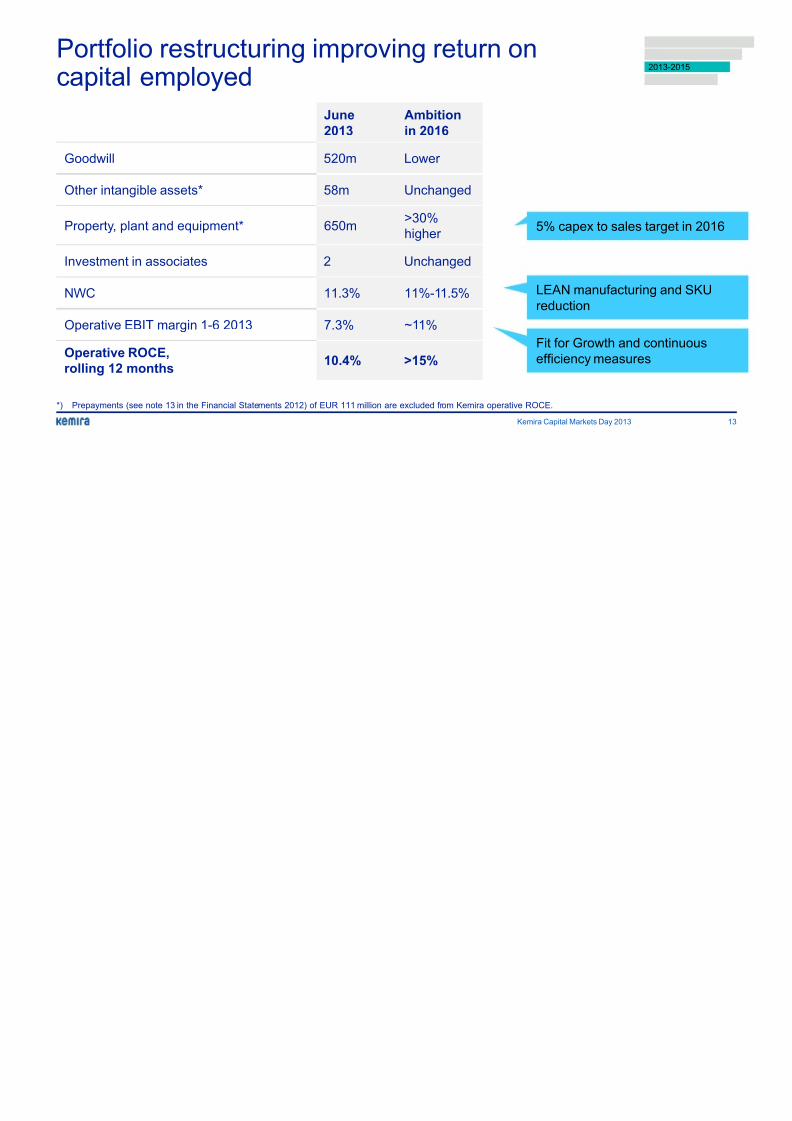
Portfolio restructuring improving return oncapital employed
June
2013
Ambition
in 2016
Goodwill 520m Lower
Other intangible assets* 58m Unchanged
Property, plant and equipment* 650m>30%
higher
Investment in associates 2 Unchanged
NWC 11.3% 11%-11.5%
Operative EBIT margin 1-6 2013 7.3% ~11%
Operative ROCE,
rolling 12 months10.4% >15%
5% capex to sale
LEAN manufactu
reduction
Fit for Growth an
efficiency measu
*) Prepayments (see note 13 in the Financial Statements 2012) of EUR 111 million are excluded from Kemira operative ROCE.
Kemira Capital Markets Day 2013

8/13/2019 Emir 2013 Presentation
http://slidepdf.com/reader/full/emir-2013-presentation 14/69
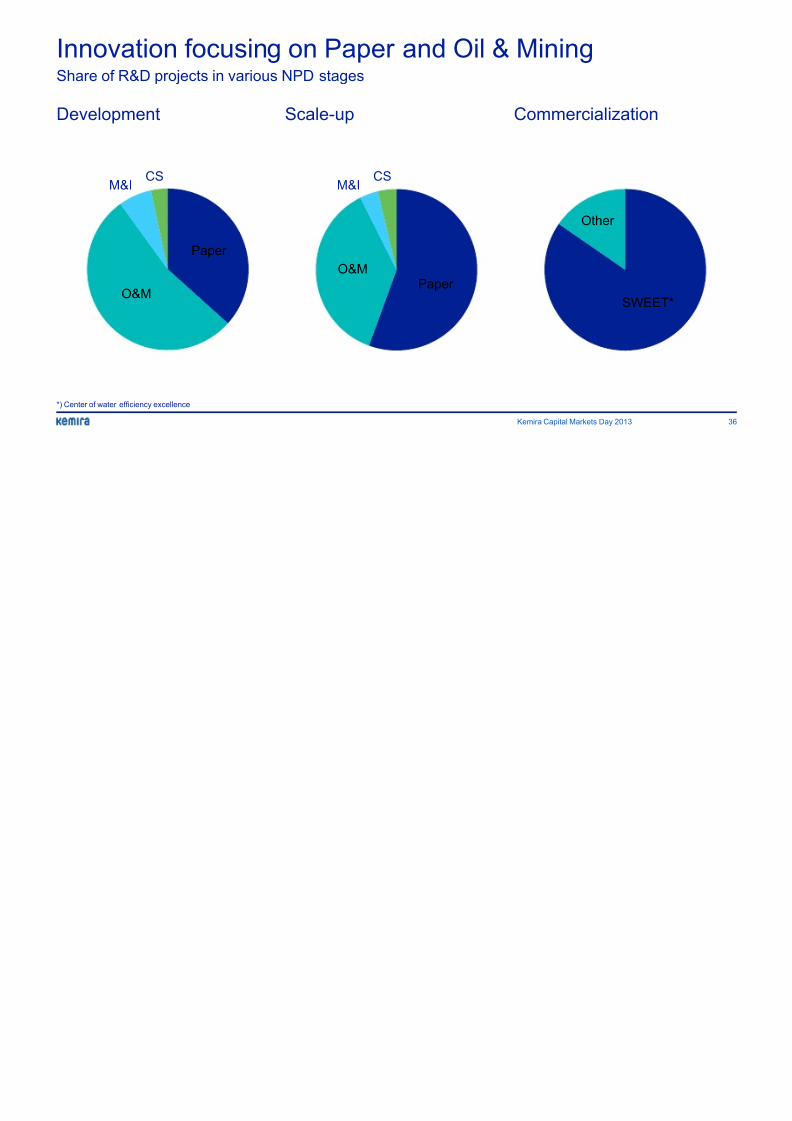
Innovation focusing on Paper and Oil & Mining
Technology Management
Board targeting 50%reduction in development
times for ”R” and ”D”
projects
Dedicated global team
and structured process
to drive ideation
R&D projects per New
Product Development stageDevelopment Scale-up
Kemira Capital Markets Day 2013
Paper
Oil &
Mining
Municipal
& Industrial
ChemSolutions
Oil &
Mining
Municipal
& Industrial
ChemSolutions
8/13/2019 Emir 2013 Presentation
http://slidepdf.com/reader/full/emir-2013-presentation 15/69
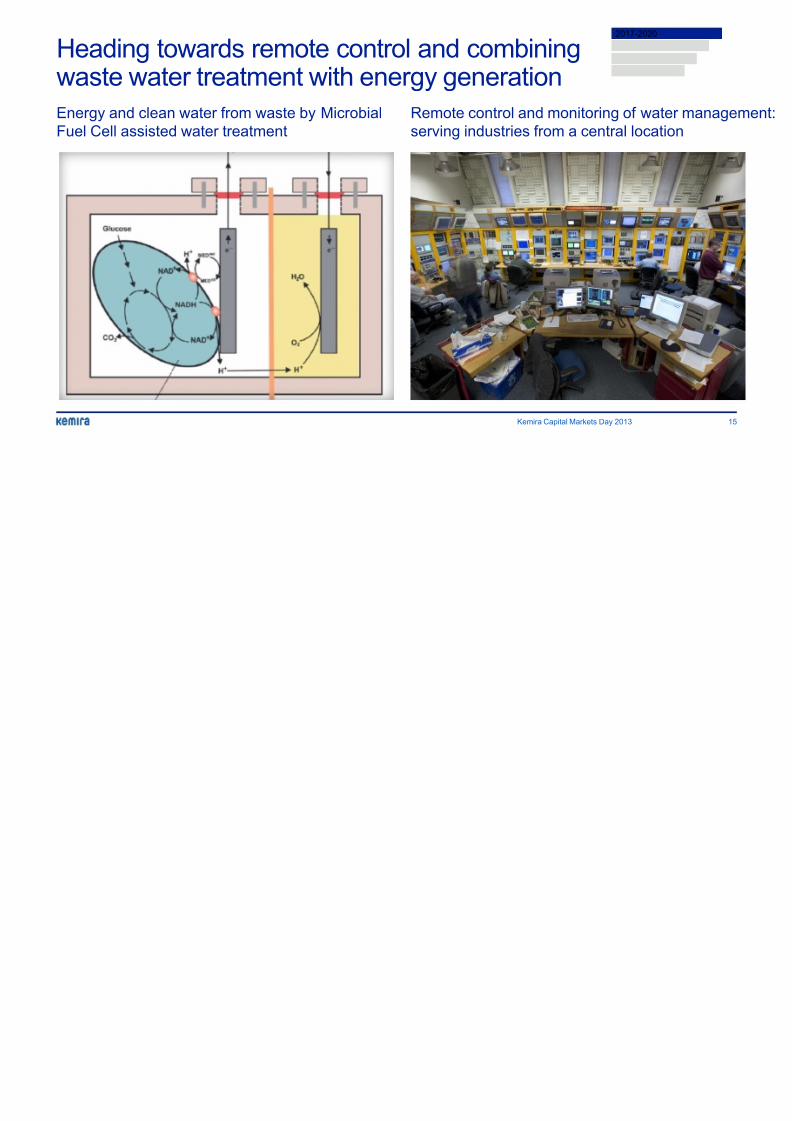
Heading towards remote control and combiningwaste water treatment with energy generation
Remote control and monitoring o
serving industries from a central
Kemira Capital Markets Day 2013
Energy and clean water from waste by Microbial
Fuel Cell assisted water treatment
201
8/13/2019 Emir 2013 Presentation
http://slidepdf.com/reader/full/emir-2013-presentation 16/69
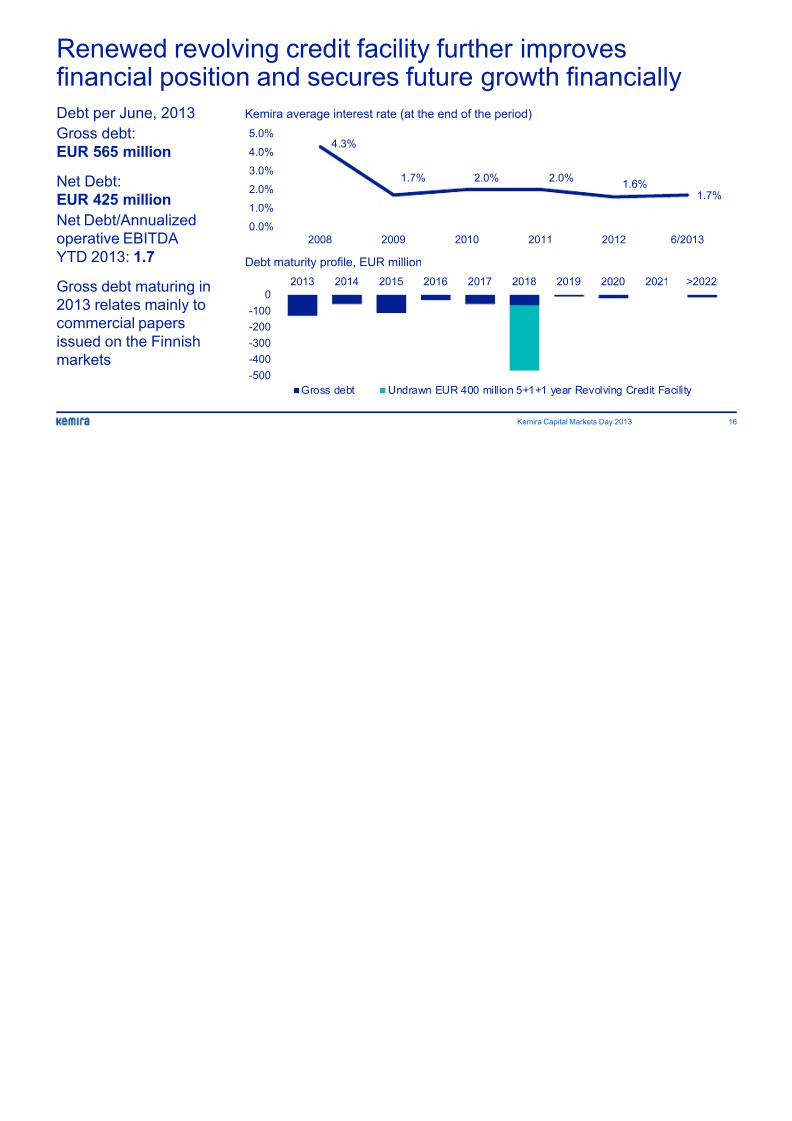
Renewed revolving credit facility further improvesfinancial position and secures future growth financ
Debt per June, 2013
Gross debt:
EUR 565 million
Net Debt:
EUR 425 million
Net Debt/Annualized
operative EBITDA
YTD 2013: 1.7
Gross debt maturing in
2013 relates mainly to
commercial papers
issued on the Finnish
markets
4.3%
1.7% 2.0% 2.0%1
0.0%
1.0%
2.0%
3.0%
4.0%
5.0%
2008 2009 2010 2011 2012
-500
-400
-300
-200
-100
02013 2014 2015 2016 2017 2018 2019 2020
Gross debt Undrawn EUR 400 million 5+1+1 year Revolving C
Debt maturity profile, EUR million
Kemira average interest rate (at the end of the period)
Kemira Capital Markets Day 2013
8/13/2019 Emir 2013 Presentation
http://slidepdf.com/reader/full/emir-2013-presentation 17/69
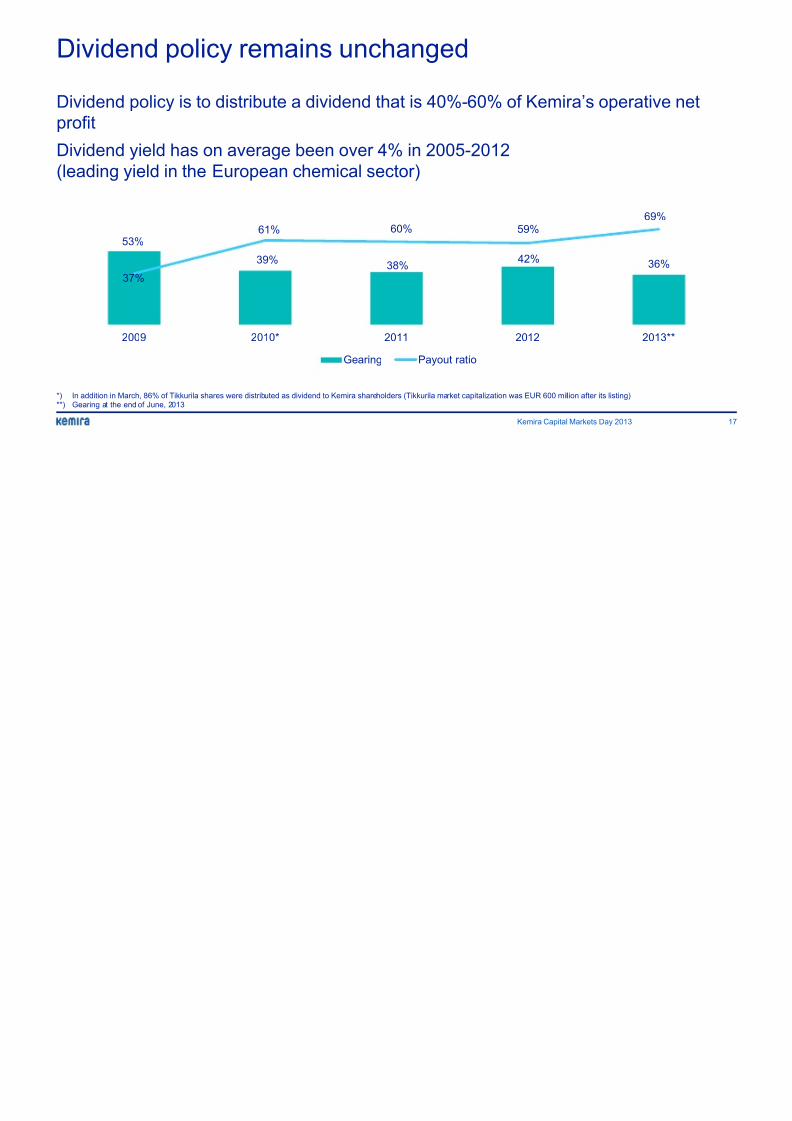
Dividend policy remains unchanged
Dividend policy is to distribute a dividend that is 40%-60% of Kemira’s oper
profit
Dividend yield has on average been over 4% in 2005-2012
(leading yield in the European chemical sector)
Kemira Capital Markets Day 2013
*) In addition in March, 86% of Tikkurila shares were distributed as dividend to Kemira shareholders (Tikkurila market capitalization was EUR 600 million after its listing)**) Gearing at the end of June, 2013
53%
39%38%
42%
37%
61% 60% 59%
2009 2010* 2011 2012
Gearing Payout ratio
8/13/2019 Emir 2013 Presentation
http://slidepdf.com/reader/full/emir-2013-presentation 18/69
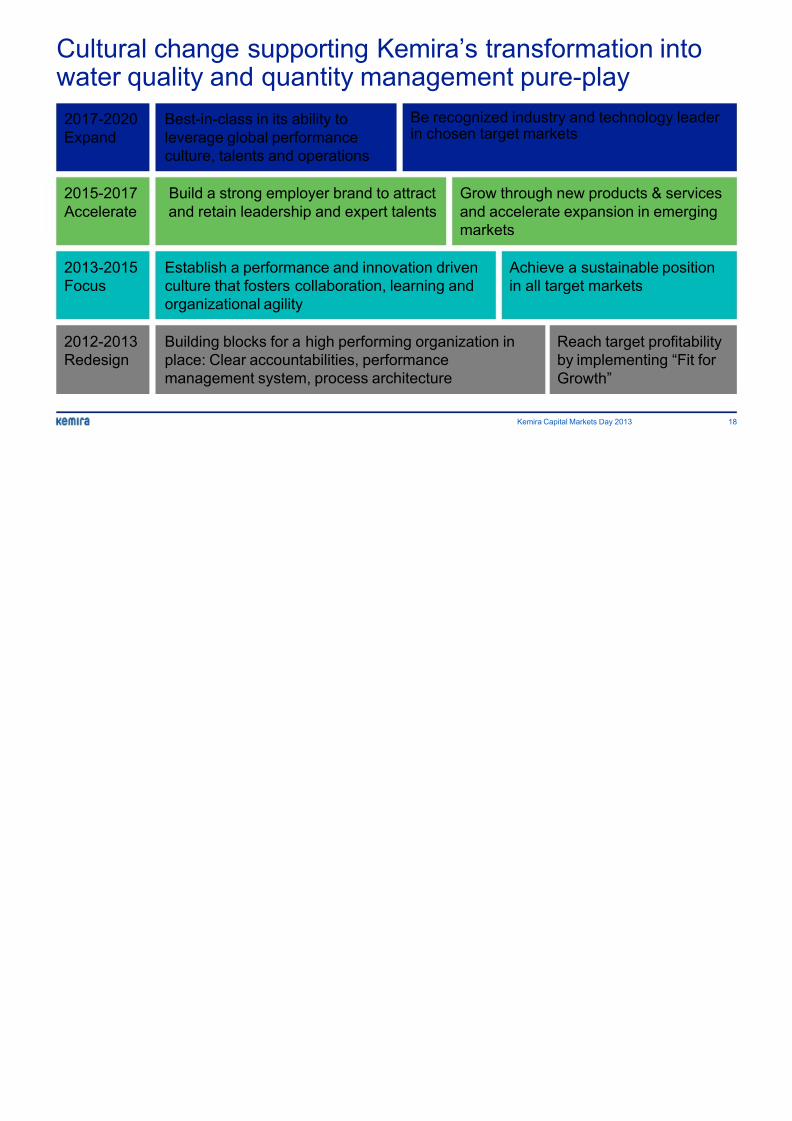
Cultural change supporting Kemira’s transformatiowater quality and quantity management pure-play
2013-2015
Focus
2017-2020
Expand
Be recognized industry and technin chosen target markets
2015-2017
Accelerate
Grow through new produc
and accelerate expansion
markets
Achieve a sustain
in all target marke
2012-2013
Redesign
Reach targ
by impleme
Growth”
Best-in-class in its ability to
leverage global performanceculture, talents and operations
Build a strong employer brand to attract
and retain leadership and expert talents
Establish a performance and innovation driven
culture that fosters collaboration, learning andorganizational agility
Building blocks for a high performing organization in
place: Clear accountabilities, performance
management system, process architecture
Kemira Capital Markets Day 2013

8/13/2019 Emir 2013 Presentation
http://slidepdf.com/reader/full/emir-2013-presentation 19/69
Increased focuson efficiency andsavings
Kemira Capital Markets Day 2013, September 10
Michael Löffelmann, SVP restructuring
8/13/2019 Emir 2013 Presentation
http://slidepdf.com/reader/full/emir-2013-presentation 20/69
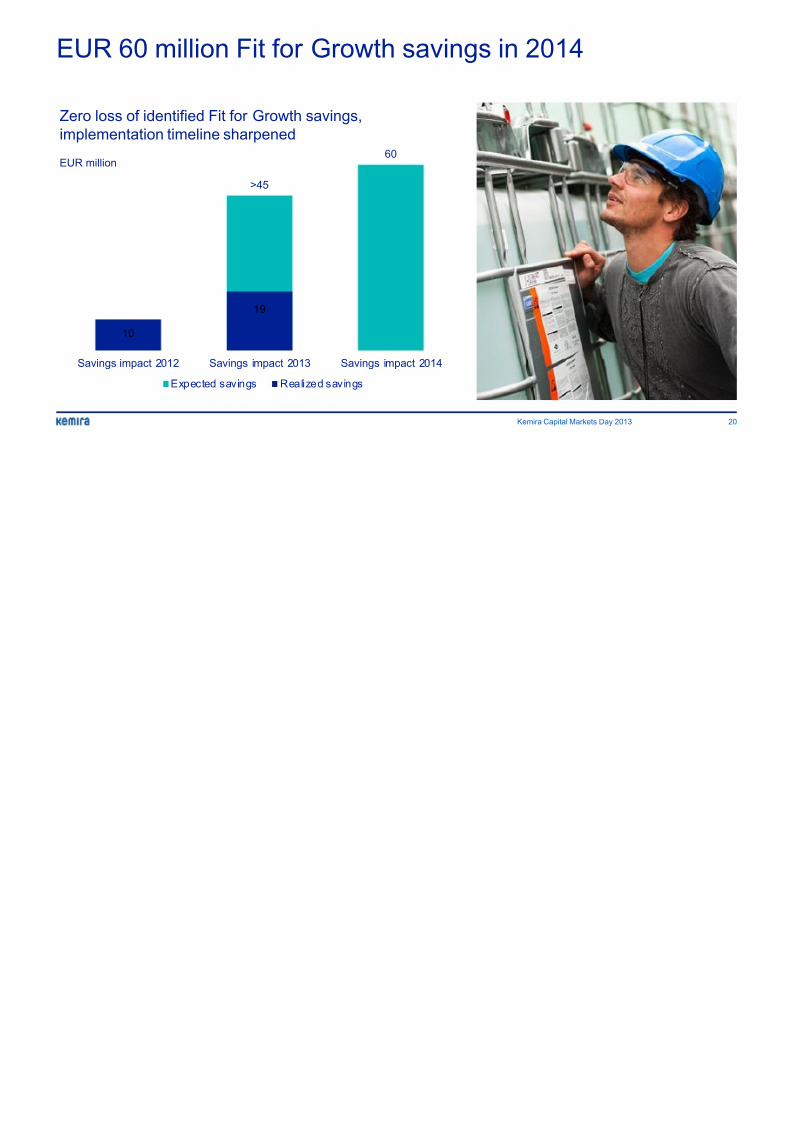
EUR 60 million Fit for Growth savings in 2014
>45
60
10
19
Savings impact 2012 Savings impact 2013 Savings impact 2014
Expected savings Realized savings
Zero loss of identified Fit for Growth savings,
implementation timeline sharpened
EUR million
Kemira Capital Markets Day 2013
8/13/2019 Emir 2013 Presentation
http://slidepdf.com/reader/full/emir-2013-presentation 21/69
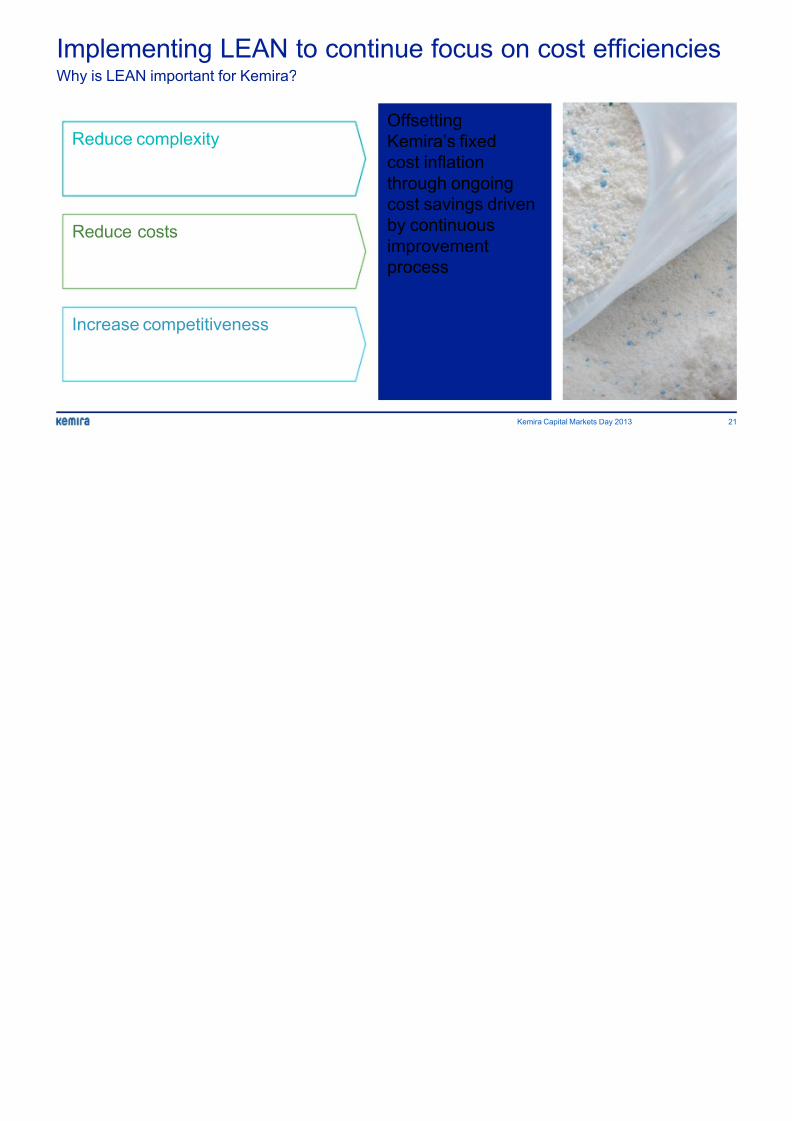
Offsetting
Kemira’s fixedcost inflation
through ongoing
cost savings driven
by continuous
improvement
process
Implementing LEAN to continue focus on cost efficWhy is LEAN important for Kemira?
Reduce complexity
Reduce costs
Increase competitiveness
Kemira Capital Markets Day 2013
8/13/2019 Emir 2013 Presentation
http://slidepdf.com/reader/full/emir-2013-presentation 22/69
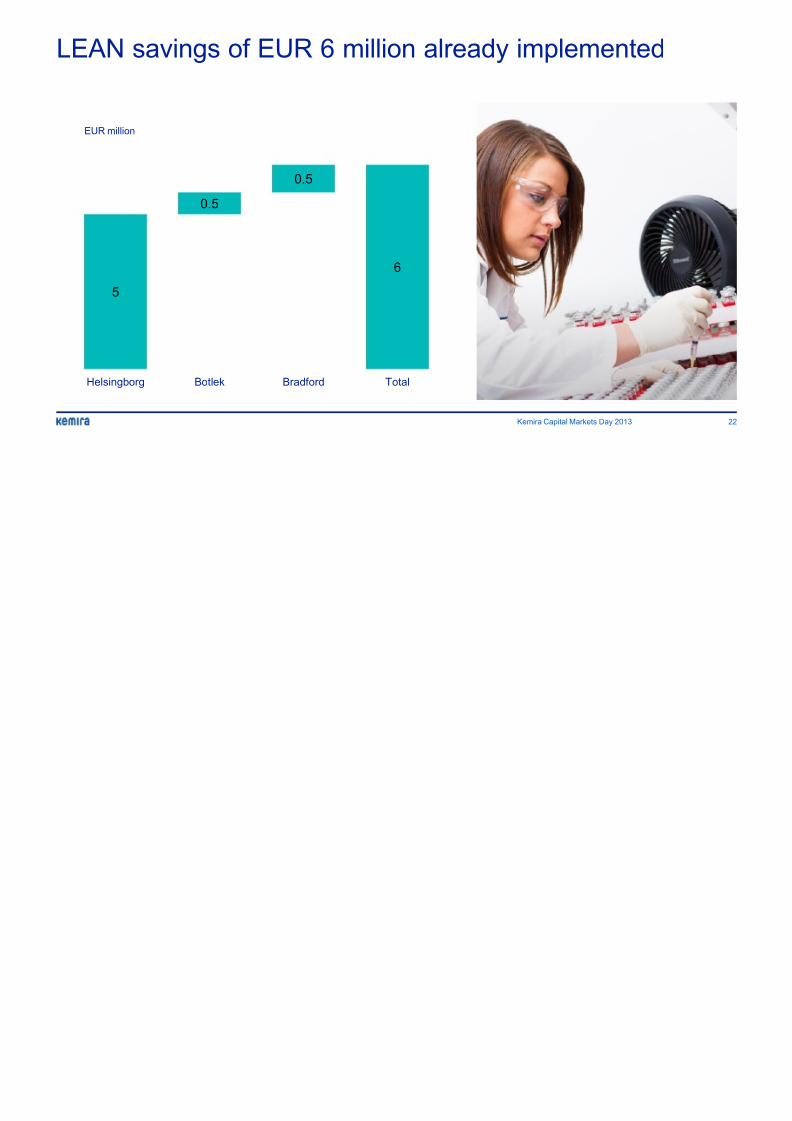
LEAN savings of EUR 6 million already implemen
Kemira Capital Markets Day 2013
5
0.5
0.5
6
Helsingborg Botlek Bradford Total
EUR million
8/13/2019 Emir 2013 Presentation
http://slidepdf.com/reader/full/emir-2013-presentation 23/69
4.
Self-loadin
3.
LEAN lab &
in-process
analysis
Global roll-out of standardized LEAN savings mod
Kemira Capital Markets Day 2013
2.
Material handling
benchmark
1.
Weighing
& filling

8/13/2019 Emir 2013 Presentation
http://slidepdf.com/reader/full/emir-2013-presentation 24/69
Strong focus on implementation discipline
Kemira Capital Markets Day 2013
Enhanced implementation• Higher and constant drive to achieve results
• Continuous identification of savings
• Greater sense of urgency
Resources
• Closer interaction and follow-up
• Full time LEAN resources
• Dedicated manufacturing
optimization resources
Tools
• Action based with financial tracking
• Standardized LEAN tools
• Additional training for sites
Delivering high performance driven culture
8/13/2019 Emir 2013 Presentation
http://slidepdf.com/reader/full/emir-2013-presentation 25/69
Acceleratingthe turnaround
in Municipal &Industrial
Kemira Capital Markets Day 2013, September 10
Frank Wegener, President, Municipal & Industrial

8/13/2019 Emir 2013 Presentation
http://slidepdf.com/reader/full/emir-2013-presentation 26/69
Fit for Growth has started to improve profitability
RevenueEUR million
Operative EBIT %
Municipal & Industrial targets cross-the-cycle operative EBIT margin of 10% in 2014
1) Targeted Fit for Growth savings above EUR 20 million
2) New organization and customer segmentation leading to more than EUR 5 millionadditional savings
3) Further benefits from manufacturing network optimization, SKU reduction and R&D
improvements
161
165
174
178
150
155
160
165
170175
180
Q1 2012 Q1 2013 Q2 2012 Q2 2013
3.5%
5.2%
6.9%
0%
2%
4%
6%
8%
10%
Q1 2012 Q1 2013 Q2 201
+2%
+2%
+49%
Kemira Capital Markets Day 2013
8/13/2019 Emir 2013 Presentation
http://slidepdf.com/reader/full/emir-2013-presentation 27/69
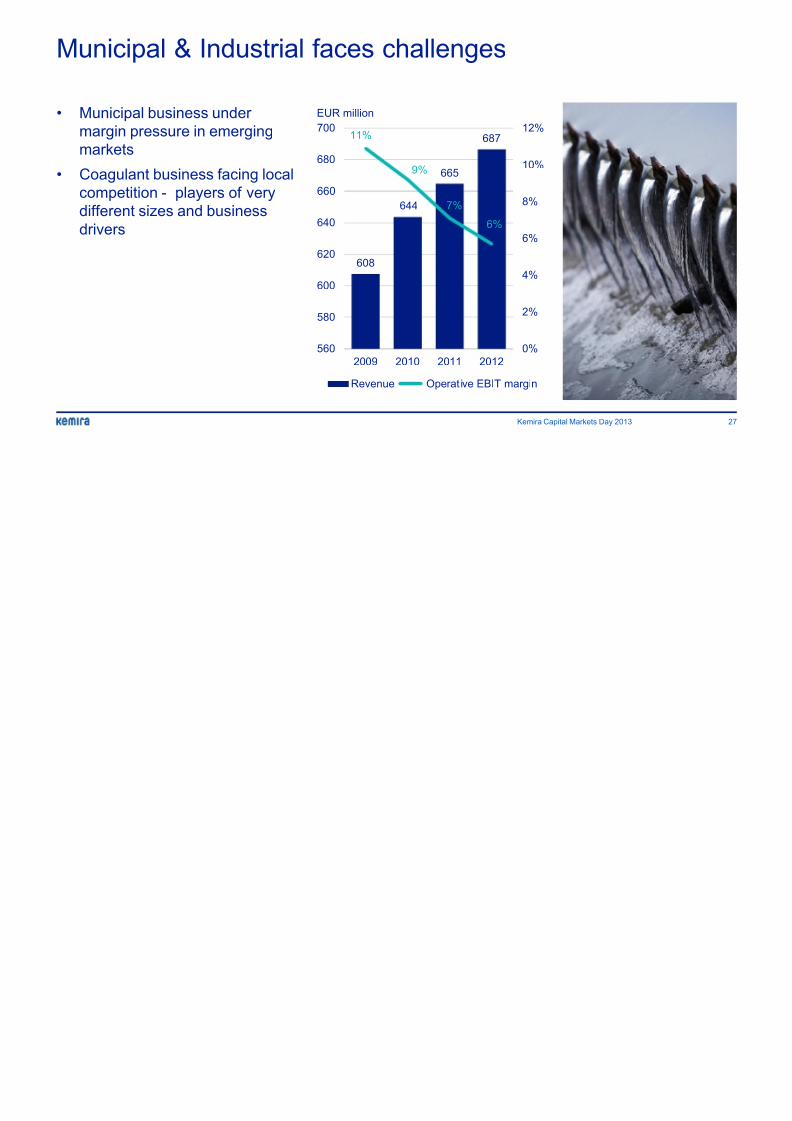
Municipal & Industrial faces challenges
• Municipal business under
margin pressure in emerging
markets
• Coagulant business facing local
competition - players of very
different sizes and business
drivers
608
644
665
68711%
9%
7%
6%
0%
2%
4%
6%
8%
10%
12%
560
580
600
620
640
660
680
700
2009 2010 2011 2012
Revenue Operative EBIT margin
EUR million
Kemira Capital Markets Day 2013

8/13/2019 Emir 2013 Presentation
http://slidepdf.com/reader/full/emir-2013-presentation 28/69
Historic business model New business model
New business model and organization to address challenging business environment
Kemira Capital Markets Day 2013
• Sales model with simplified organiz
and channel strategy
• Headcount reduction of ~50 emplo
• R&D focus in line with strategy, po
by 40%
• Uniform service approach with limited
customer segmentation
• Sales force weighted more towards
direct sales vs. distribution sales
• Global geographical focus with scattered
manufacturing footprint
• Limited focus on production technology
• World class coagulant footprint foc
mature markets
• Over 1,000 SKU’s • Number of SKU’s reduced by 50%

8/13/2019 Emir 2013 Presentation
http://slidepdf.com/reader/full/emir-2013-presentation 29/69
Segmented customer business model increasingprofitability
Historic model –
unsegmented
New model with two custo
segments
Kemira Capital Markets Day 2013
Kemira offering:• Reliable delivery and effective treatment
• Tailor made solutions
• Fast time to resolution
• Technical support
Paying for:
Reliable delivery and effective treatment
Value and
performance
Price>9,000 municipal and industrial
customers buying coagulants and polymers >9000
customers
>4500
customers
>4500
customers
Paying fo
Effective t
Paying foFaster res
Some tech
and
Tailored s
immediate
tech suppo
offering

8/13/2019 Emir 2013 Presentation
http://slidepdf.com/reader/full/emir-2013-presentation 30/69
Securing competitive position through manufacturnetwork consolidation
Fit for Growth measures will be fully implemented by the end of Q2 2014• 6 sites closed, closure of 2 sites and 2 production plants under implementation
• 2 sites to be closed only after new Tarragona coagulant site is on stream (delayed to Q1 2014)Further manufacturing optimization through economies of scale and the use of industr
Additional rationalization expected in NAFTA
*) Europoort and Krems (production plants), Lauterburg, Sevilla, Flix, Tarragona old, St. Petersburg, Houston, Savannah, Xoxla, Camacari, Romania
Coagula
New pro
Sites an
closed o
closed
Kemira Capital Markets Day 2013
8/13/2019 Emir 2013 Presentation
http://slidepdf.com/reader/full/emir-2013-presentation 31/69
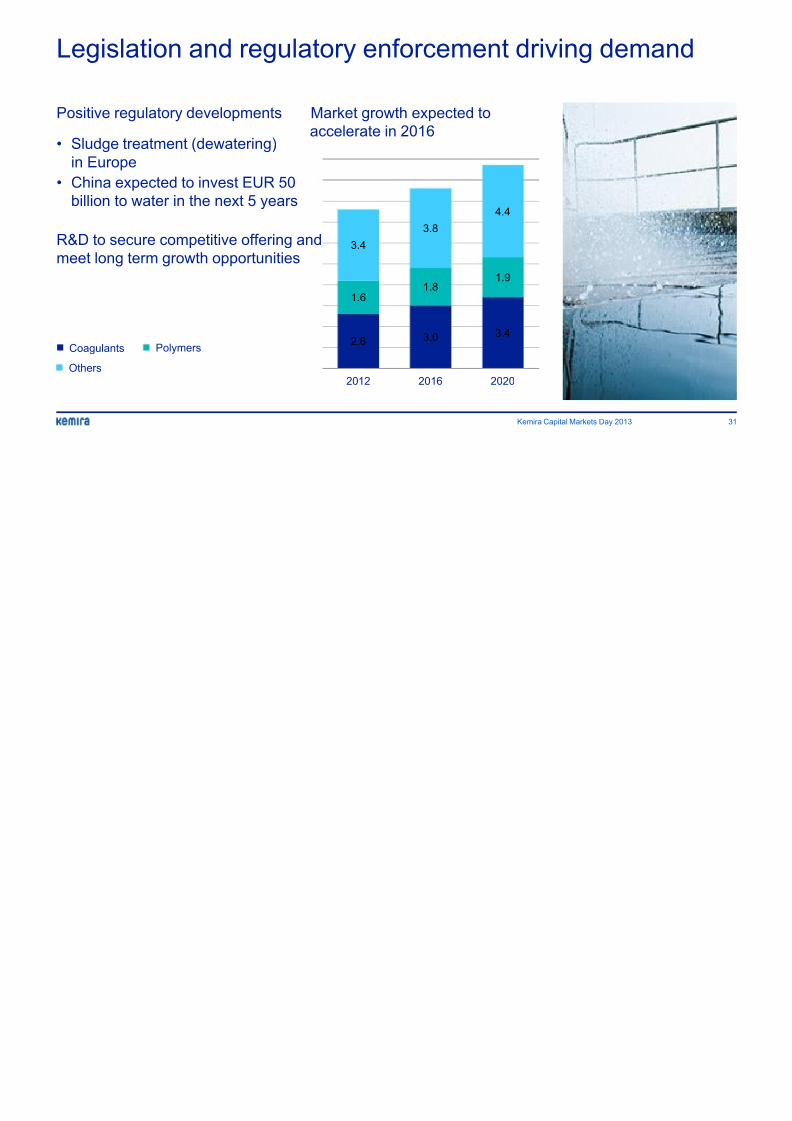
Legislation and regulatory enforcement driving de
• Sludge treatment (dewatering)in Europe
• China expected to invest EUR 50
billion to water in the next 5 years
R&D to secure competitive offering and
meet long term growth opportunities
Positive regulatory developments Market growth expected to
accelerate in 2016
2.6 3.0 3.4
1.61.8
1.9
3.4
3.8
4.4
2012 2016 2020
Coagulants
Others
Polymers
Kemira Capital Markets Day 2013
8/13/2019 Emir 2013 Presentation
http://slidepdf.com/reader/full/emir-2013-presentation 32/69
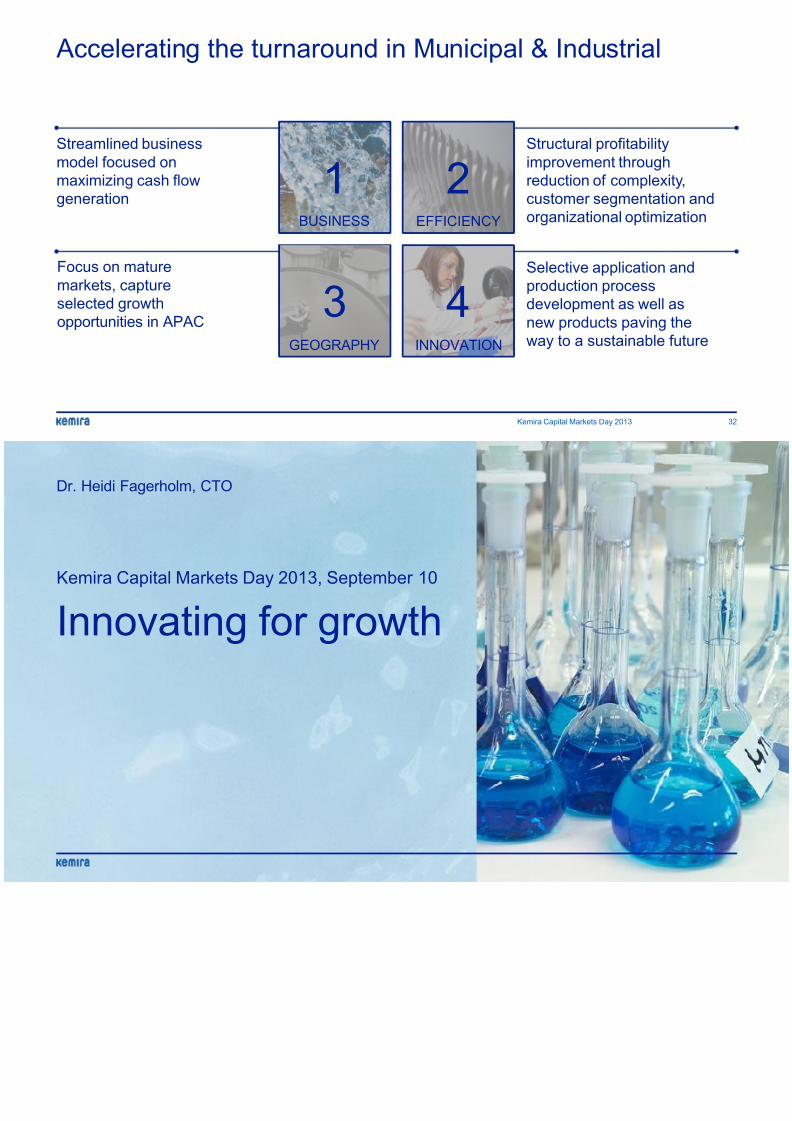
Accelerating the turnaround in Municipal & Industr
Streamlined businessmodel focused on
maximizing cash flow
generation
Focus on mature
markets, captureselected growth
opportunities in APAC
Structural profitimprovement th
reduction of com
customer segm
organizational o
Selective applic
production procdevelopment as
new products p
way to a sustain
43
21BUSINESS
INNOVATIONGEOGRAPHY
EFFICIENCY
Kemira Capital Markets Day 2013

8/13/2019 Emir 2013 Presentation
http://slidepdf.com/reader/full/emir-2013-presentation 33/69
Innovating for growth
Kemira Capital Markets Day 2013, September 10
Dr. Heidi Fagerholm, CTO

8/13/2019 Emir 2013 Presentation
http://slidepdf.com/reader/full/emir-2013-presentation 34/69
Research Center network focusing on competencedevelopment and regional business support
Shanghai,
China
• Paperapplication
• Tissue• TCS
Espoo, Finl• Fundamenta
• Paper resea
• M&I• TCS
Sao Paolo, Brazil• Minerals & Metals
• TCS
Atlanta, GA, USA• Oil & Gas
• Minerals & Metals• Paper
• TCS
TCS = Technical Customer Service & Production Support
Kemira Capital Markets Day 2013
Total personnel 250
Patent families ~350
8/13/2019 Emir 2013 Presentation
http://slidepdf.com/reader/full/emir-2013-presentation 35/69
• Increase in total portfolio value by
50% from 2013 to 2020
• Increase in cross-regional
participation across R&D projects
• Every second project has an external research
partner
• FTE per project growing more than 50% due to
increased focus
R&D portfolio aligned with strategy
Kemira Capital Markets Day 2013

8/13/2019 Emir 2013 Presentation
http://slidepdf.com/reader/full/emir-2013-presentation 36/69
Innovation focusing on Paper and Oil & Mining
Development Scale-up
Share of R&D projects in various NPD stages
Commercializa
Paper
O&M
M&ICS
M&ICS
Paper
O&M
S
Other
*) Center of water efficiency excellence
Kemira Capital Markets Day 2013
I i l EUR 250 illi i 2016
8/13/2019 Emir 2013 Presentation
http://slidepdf.com/reader/full/emir-2013-presentation 37/69
40
106
140
0
20
40
60
80
100
120
140
160
2011 2012 2013**
Innovation sales target EUR 250 million in 2016
Kemira innovation sales*, EUR million
*) Sales from new products or existing products for new applications launched within the previous 5 years
**) Annualized Jan-Jun 2013 innovation sales
Fennobond
strength
Fennobind
bindersKemflite,
control & monitoring
KemFlow
friction
reducer
KemFlow
biocide
Kemira Capital Markets Day 2013
O&M
Paper
M&I
Tagged antiscalant
Guar replacement
Green friction
reducer
Rheology modifiers
Performic acid
Next Fennobind
generation
New innovation are
Targeting to double innovation driven sales from 5% in 2012 to ~10% of total sales in 2
P l t f 50%
8/13/2019 Emir 2013 Presentation
http://slidepdf.com/reader/full/emir-2013-presentation 38/69
Polymers account for 50%of Kemira’s differentiatedproduct revenue
• Case study: Polymers in flocculation
and sludge dewatering
• Technical benefits for customer include
improved reject water quality and
increased solid content of sludge
• Global polymer market growing from
EUR 7 billion to EUR 10 billion in 2020
• Kemira targeting faster than market
growth
Kemira Capital Markets Day 2013
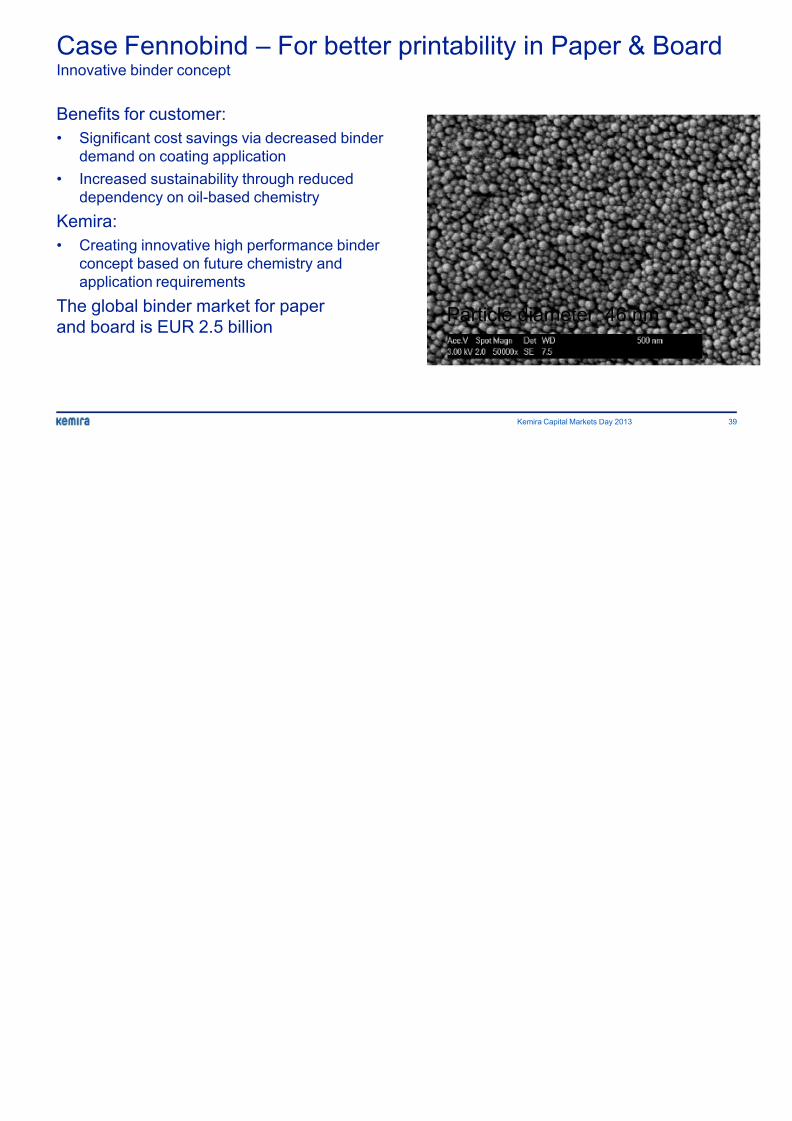
Case Fennobind For better printability in Paper &
8/13/2019 Emir 2013 Presentation
http://slidepdf.com/reader/full/emir-2013-presentation 39/69
Benefits for customer:
• Significant cost savings via decreased binder
demand on coating application
• Increased sustainability through reduced
dependency on oil-based chemistry
Kemira:
• Creating innovative high performance binder
concept based on future chemistry and
application requirementsThe global binder market for paper
and board is EUR 2.5 billion
Case Fennobind – For better printability in Paper &Innovative binder concept
Kemira Capital Markets Day 2013
Fennobind
Particle diameter 46
Sh l G & Oil
8/13/2019 Emir 2013 Presentation
http://slidepdf.com/reader/full/emir-2013-presentation 40/69
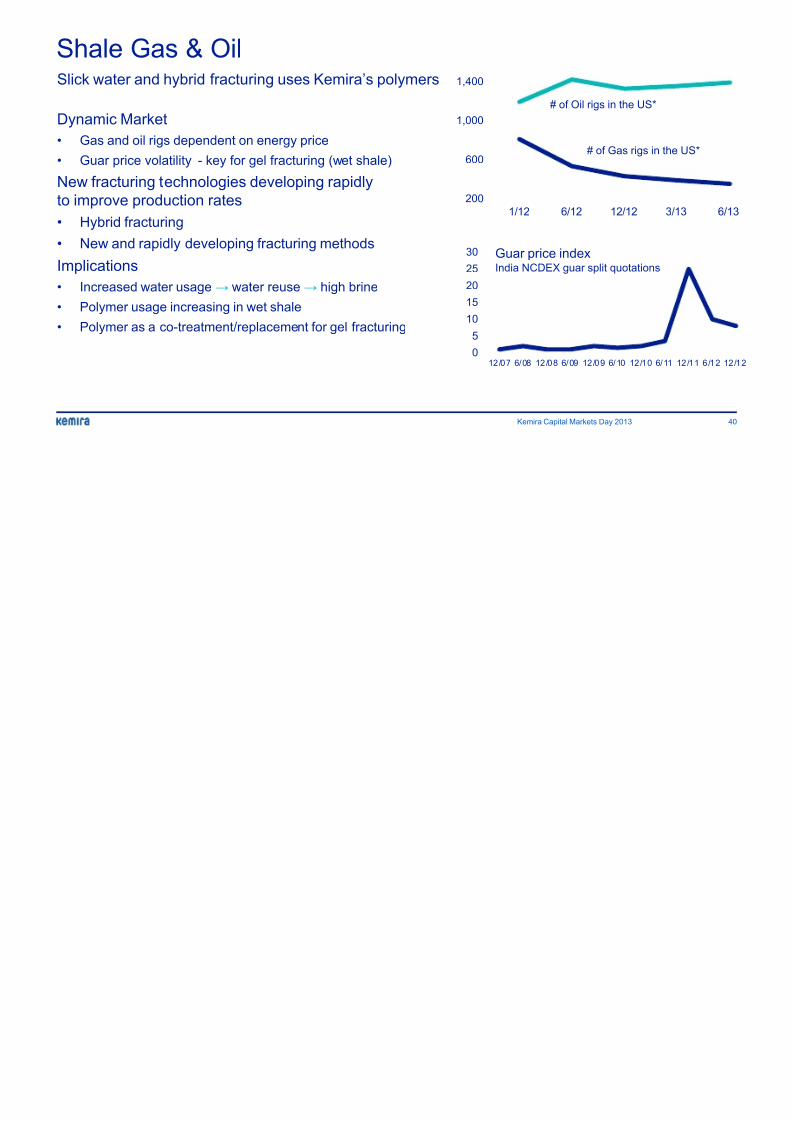
Shale Gas & OilSlick water and hybrid fracturing uses Kemira’s polymers
Kemira Capital Markets Day 2013
Dynamic Market
• Gas and oil rigs dependent on energy price
• Guar price volatility - key for gel fracturing (wet shale)
New fracturing technologies developing rapidly
to improve production rates
• Hybrid fracturing
• New and rapidly developing fracturing methods
Implications
• Increased water usage → water reuse → high brine• Polymer usage increasing in wet shale
• Polymer as a co-treatment/replacement for gel fracturing
200
600
1,000
1,400
1/12 6/12 12/1
# of Oil rigs in the
# of Gas
0
5
10
1520
25
30
12/07 6/08 12/08 6/09 12/09 6/10
Guar price indexIndia NCDEX guar split quot
Removing volatility in shale gas and oil through te
8/13/2019 Emir 2013 Presentation
http://slidepdf.com/reader/full/emir-2013-presentation 41/69
Removing volatility in shale gas and oil through te
and applications
Kemira Capital Markets Day 2013
Innovation driven growth
• Customer focused
• New products wet and dry shale
• Portfolio of products for water management
Accomplishments
• New slick water friction reducers for high brines
• Products with improved handling → inversion, cold
temperature
• Guar replacement under development
• Growing multi-product patented portfolio
• Applications knowledge & partnerships with key
service companies
Relevant market size for polymers is
about EUR 1 billion
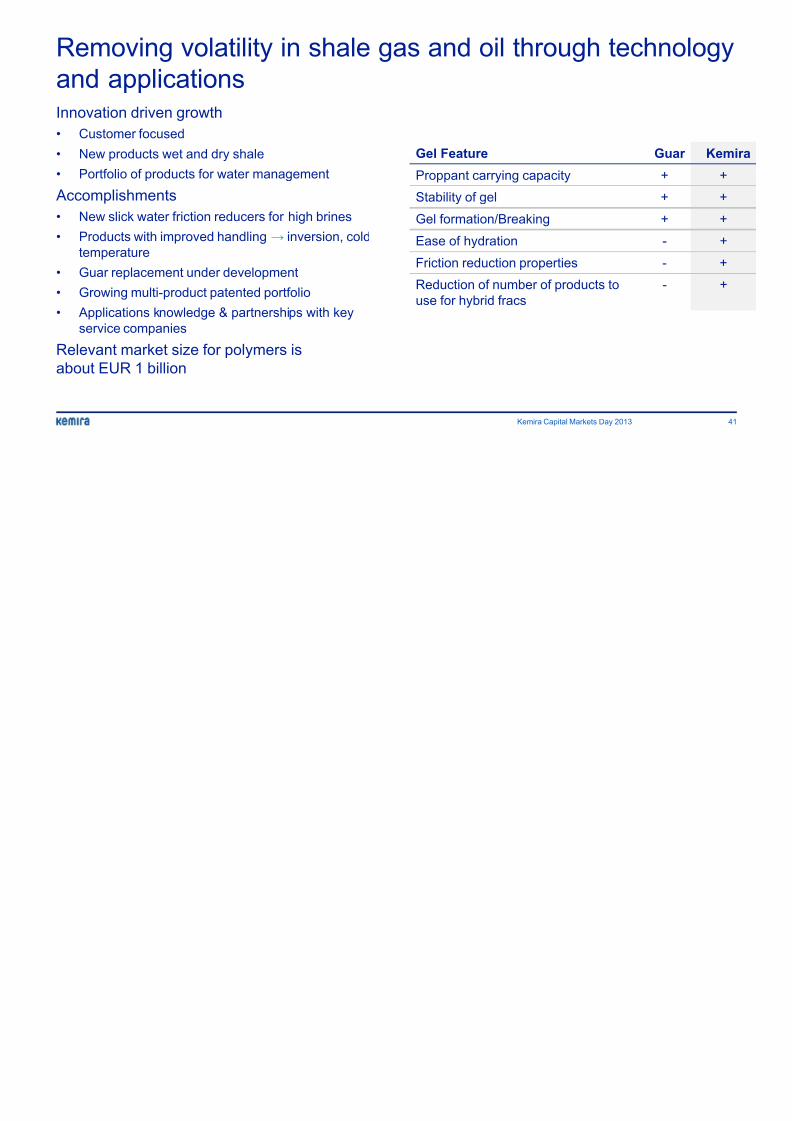
Gel Feature
Proppant carrying capacity
Stability of gel
Gel formation/Breaking
Ease of hydration
Friction reduction properties
Reduction of number of products touse for hybrid fracs
Success Story
8/13/2019 Emir 2013 Presentation
http://slidepdf.com/reader/full/emir-2013-presentation 42/69
Benefits for customer:
• Deeper water, more complex wells, and the optimization of mature
fields• Scale risk minimization, differentiated detection, peace of mind &
production optimization.
• Lower costs (Capex flexibility, optimized chemical usage, lower
equipment & operational costs)
Kemira:
• New tagged antiscalant technology based on proven polymeric
scale inhibitor
Relevant market size for downhole scale squeeze
business is about EUR 100 million
Success StoryTagged antiscalants for Oil & Gas stimulation and production
Kemira Capital Markets Day 2013
Building a culture of
8/13/2019 Emir 2013 Presentation
http://slidepdf.com/reader/full/emir-2013-presentation 43/69
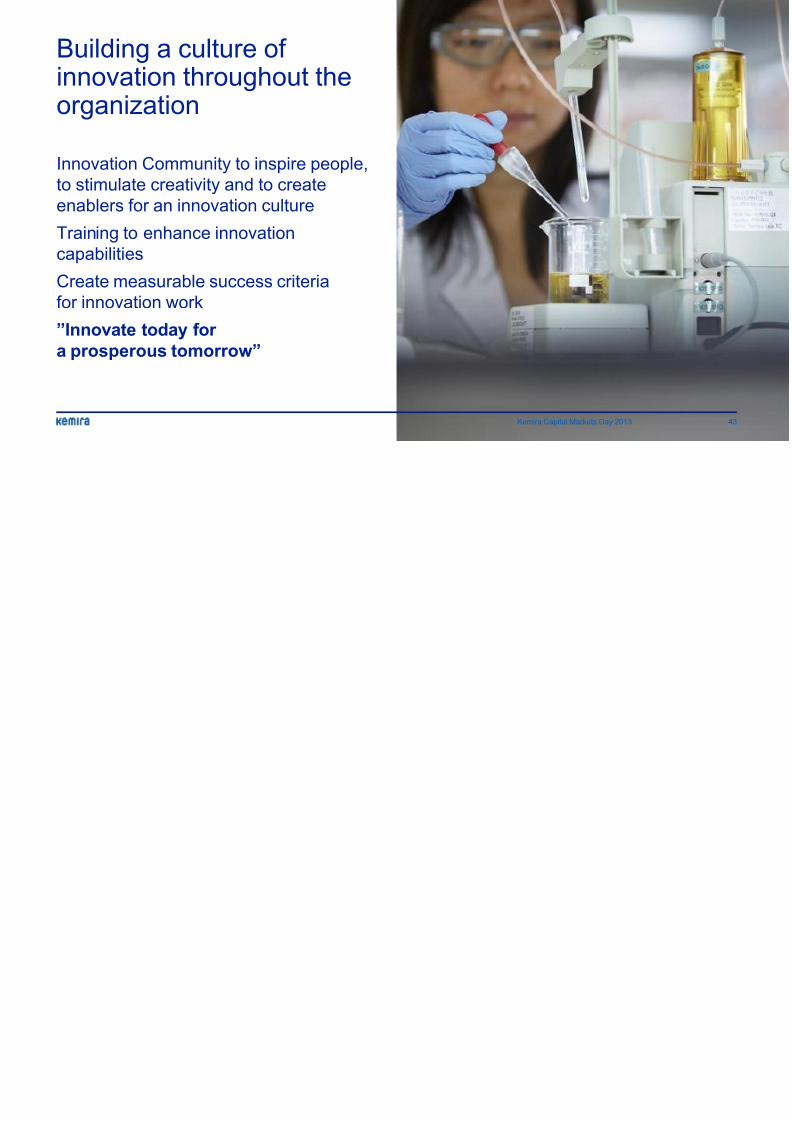
Building a culture ofinnovation throughout theorganization
Innovation Community to inspire people,
to stimulate creativity and to create
enablers for an innovation culture
Training to enhance innovation
capabilities
Create measurable success criteriafor innovation work
”Innovate today for
a prosperous tomorrow”
Kemira Capital Markets Day 2013
8/13/2019 Emir 2013 Presentation
http://slidepdf.com/reader/full/emir-2013-presentation 44/69
Appendix
Kemira Capital Markets Day 2013, September 10
Kemira Capital Markets Day 2013
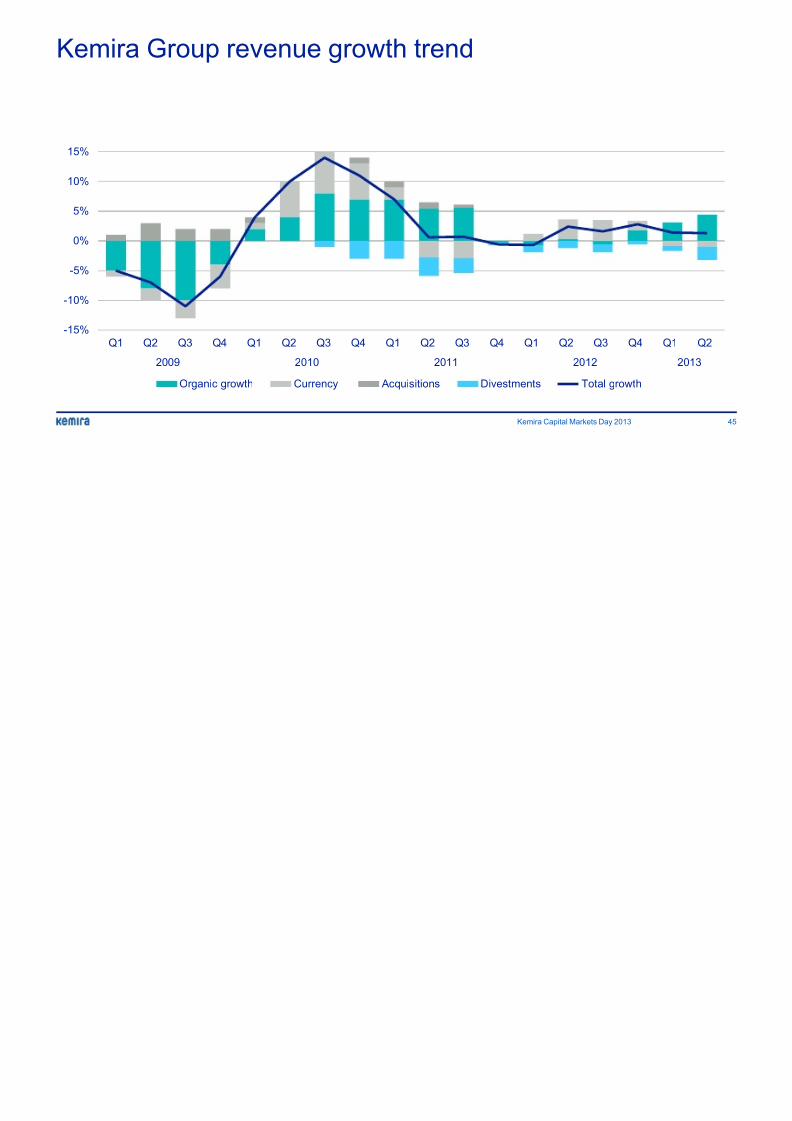
Kemira Group revenue growth trend

8/13/2019 Emir 2013 Presentation
http://slidepdf.com/reader/full/emir-2013-presentation 45/69
Kemira Group revenue growth trend
-15%
-10%
-5%
0%
5%
10%
15%
Q1 Q2 Q3 Q4 Q1 Q2 Q3 Q4 Q1 Q2 Q3 Q4 Q1 Q2 Q3
2009 2010 2011 2012
Organic growth Currency Acquisitions Divestments Total grow
Kemira Capital Markets Day 2013
Differentiated products expected to grow substantially

8/13/2019 Emir 2013 Presentation
http://slidepdf.com/reader/full/emir-2013-presentation 46/69
Differentiated products expected to grow substantiallymarket, commodity products focusing on efficiency im
Differentiated products
• Growth target substantially above the market
• Driven by innovation and expertise
• Higher margins due to higher value to the
customer
• Flexible manufacturing capabilities with
sufficient scale
• Higher barriers to entry (technology)
781843 879
0
200
400
600
800
1000
2010 2011 2012
Commodity products• Targeting growth, but slightly lower than
the market
• Maximizing profitability and cash flow by
leveraging existing capacity
Differentiated products revenue, EUR m
1380 1365 1362
0
500
1000
1500
2010 2011 2012
Commodity products revenue, EUR mil
Kemira revenue split into differentiated and comm
8/13/2019 Emir 2013 Presentation
http://slidepdf.com/reader/full/emir-2013-presentation 47/69
Kemira revenue split into differentiated and commproducts
Differentiated product lines Commodity product lines
%-of total
revenue in
1-6 2013
Polymers Sizing and
strength
Defoamers,
dispersants,
biocides and
other process
chemicals
Coagulants Bleaching
chemicals
Formic acid
and derivativ
Paper 10% 20% 15% 5% 25% -
M&I 20% - 5% 65% - -
O&M 55% - 25% 5% - - Chem-
Solutions
- - - - - 80%
Kemira 20% 10% 10% 25% 15% 5%
*) Mainly sodium percarbonate, colorants, acrylamide, inorganic salts and acids as well as caustic soda
Kemira Capital Markets Day 2013
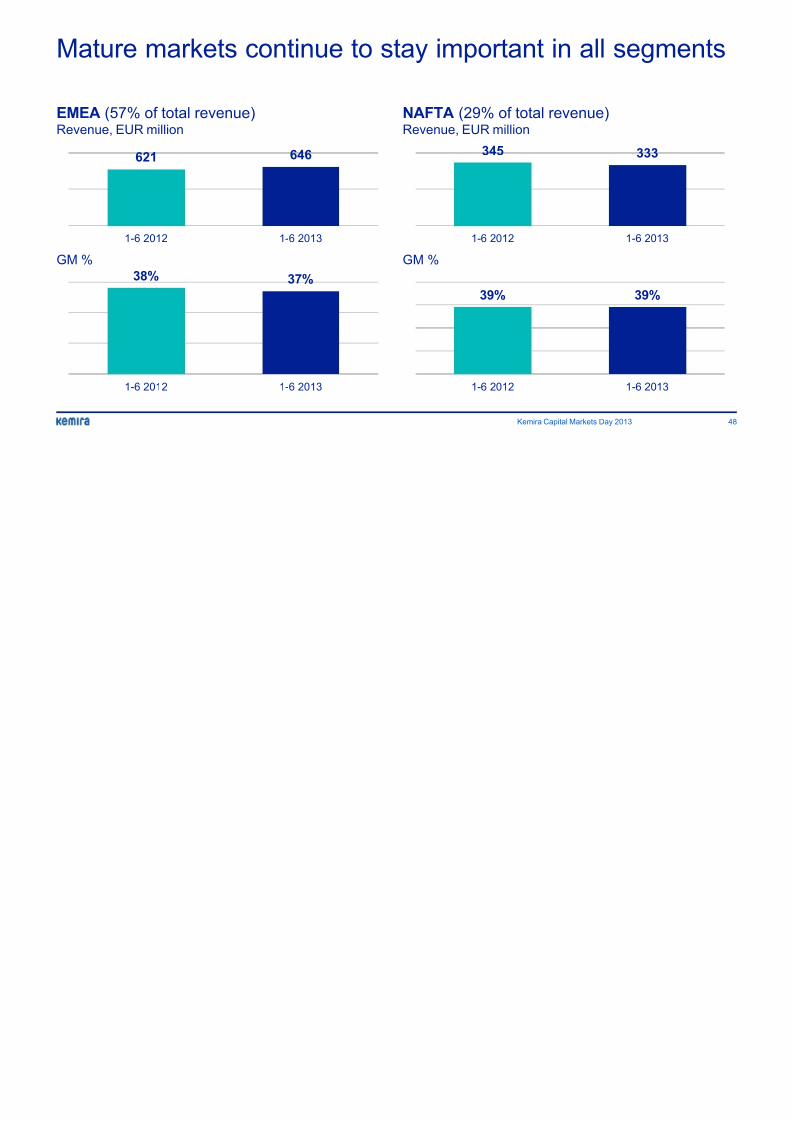
Mature markets continue to stay important in all se
8/13/2019 Emir 2013 Presentation
http://slidepdf.com/reader/full/emir-2013-presentation 48/69
Mature markets continue to stay important in all se
621 646
1-6 2012 1-6 2013
EMEA (57% of total revenue)Revenue, EUR million
345
1-6 2012 1
NAFTA (29% of total revenue)Revenue, EUR million
38% 37%
1-6 2012 1-6 2013
GM %
39%
1-6 2012 1
GM %
Kemira Capital Markets Day 2013
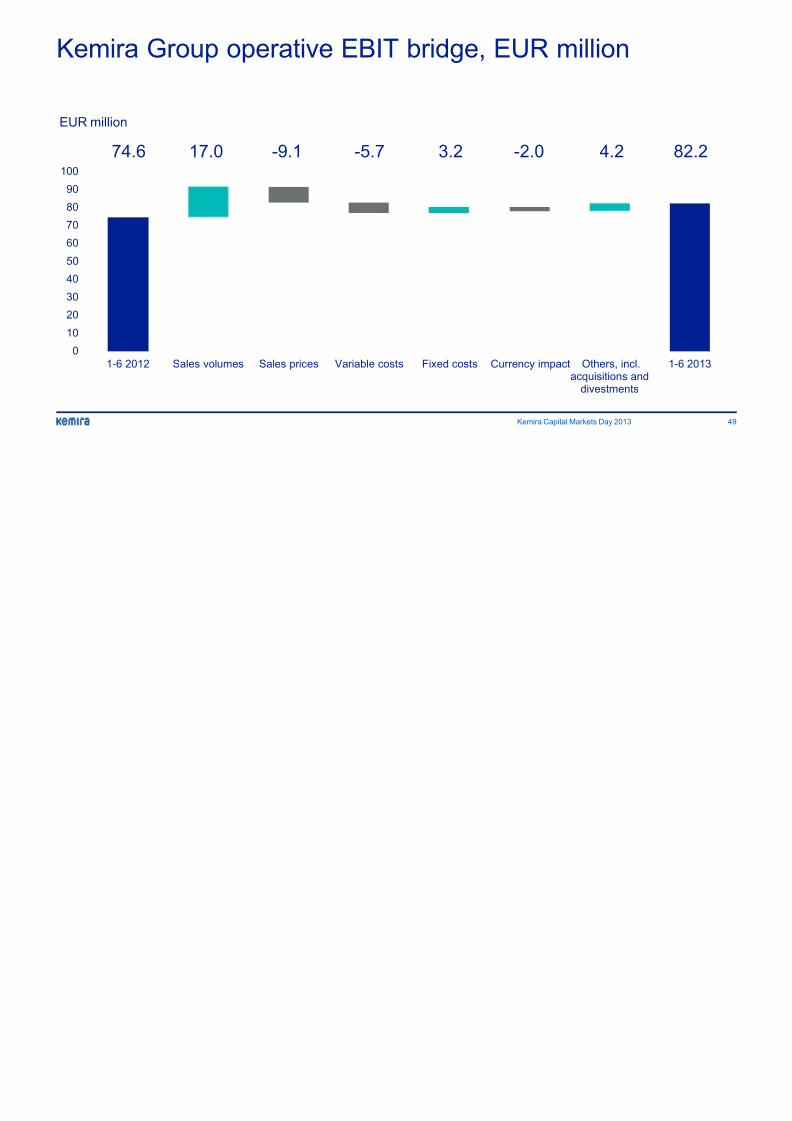
Kemira Group operative EBIT bridge EUR million
8/13/2019 Emir 2013 Presentation
http://slidepdf.com/reader/full/emir-2013-presentation 49/69
Kemira Group operative EBIT bridge, EUR million
0
10
20
30
40
50
60
70
80
90
100
1-6 2012 Sales volumes Sales prices Variable costs Fixed costs Currency impact Others, incacquisitions
divestmen
74.6 17.0 4.23.2-9.1 -5.7 -2.0
EUR million
Kemira Capital Markets Day 2013
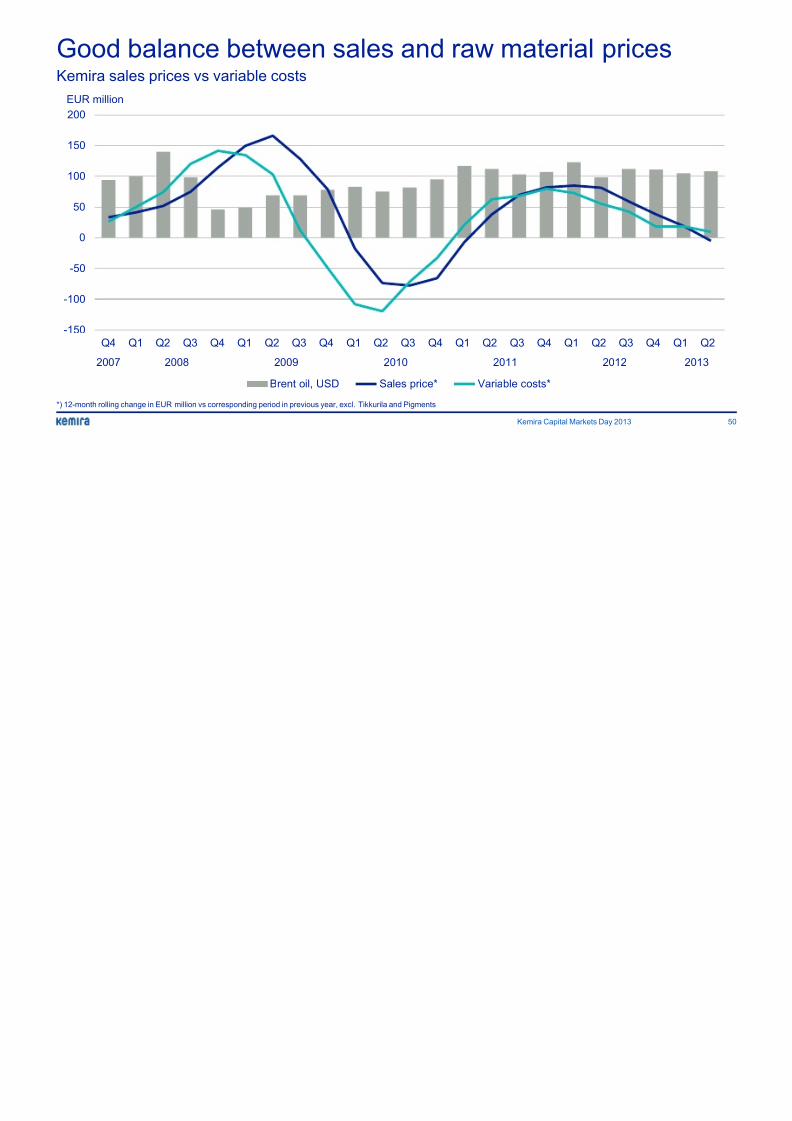
Good balance between sales and raw material pri
8/13/2019 Emir 2013 Presentation
http://slidepdf.com/reader/full/emir-2013-presentation 50/69
Good balance between sales and raw material priKemira sales prices vs variable costs
*) 12-month rolling change in EUR million vs corresponding period in previous year, excl. Tikkurila and Pigments
-150
-100
-50
0
50
100
150
200
Q4 Q1 Q2 Q3 Q4 Q1 Q2 Q3 Q4 Q1 Q2 Q3 Q4 Q1 Q2 Q3 Q4 Q1 Q2 Q
2007 2008 2009 2010 2011 2012
Brent oil, USD Sales price* Variable costs*
EUR million
Kemira Capital Markets Day 2013
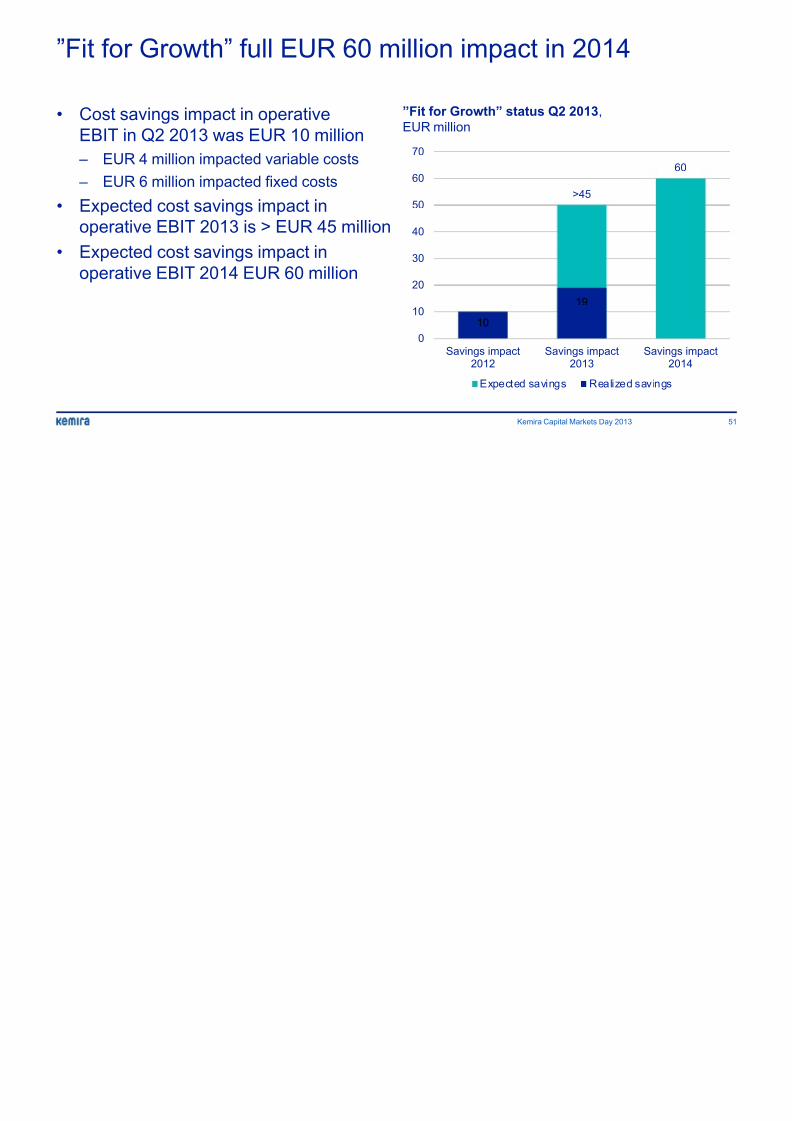
”Fit for Growth” full EUR 60 million impact in 2014
8/13/2019 Emir 2013 Presentation
http://slidepdf.com/reader/full/emir-2013-presentation 51/69
Fit for Growth full EUR 60 million impact in 2014
• Cost savings impact in operative
EBIT in Q2 2013 was EUR 10 million
– EUR 4 million impacted variable costs
– EUR 6 million impacted fixed costs
• Expected cost savings impact in
operative EBIT 2013 is > EUR 45 million
• Expected cost savings impact in
operative EBIT 2014 EUR 60 million
”Fit for Growth” status Q2 2013,
EUR million
>45
10
19
0
10
20
30
40
50
60
70
Savings impact2012
Savings impact2013
Expected savings Realized
Kemira Capital Markets Day 2013
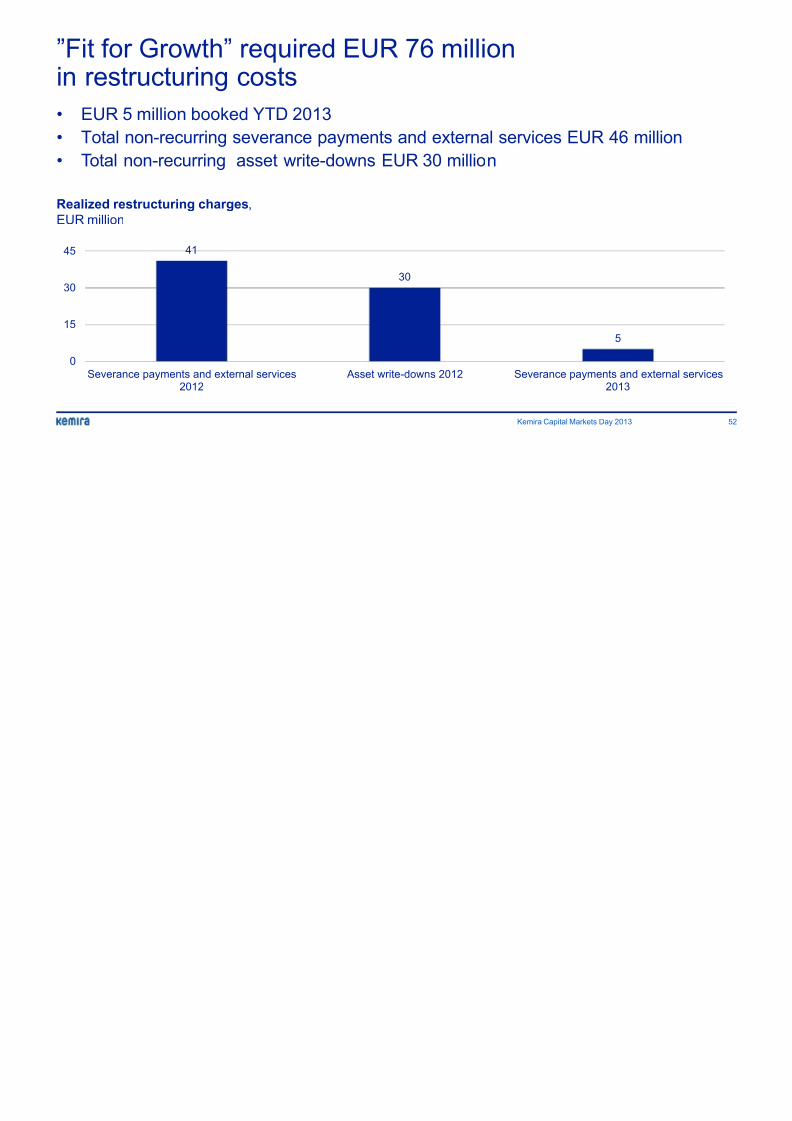
”Fit for Growth” required EUR 76 million

8/13/2019 Emir 2013 Presentation
http://slidepdf.com/reader/full/emir-2013-presentation 52/69
Fit for Growth required EUR 76 millionin restructuring costs
• EUR 5 million booked YTD 2013
• Total non-recurring severance payments and external services EUR 46
• Total non-recurring asset write-downs EUR 30 million
41
30
5
0
15
30
45
Severance payments and external services2012
Asset write-downs 2012 Severance payments an2013
Realized restructuring charges,
EUR million
Kemira Capital Markets Day 2013
Key figures and ratios
8/13/2019 Emir 2013 Presentation
http://slidepdf.com/reader/full/emir-2013-presentation 53/69
Key figures and ratios
EUR million (except ratios) 4-6/2013 4-6/2012 % 1-6/2013 1-6/2012
Revenue 569.3 562.3 1 1,130.2 1,115.2
Operative EBITDA 61.5 58.2 6 125.0 121.0
of which margin 10.8 10.3 - 11.1 10.8 Operative EBIT 40.0 36.0 11 82.2 74.6
of which margin 7.0 6.4 - 7.3 6.7
Share of profit or loss
of associates
0.1 5.8 - -1.1 16.6
Financing income and expenses -4.2 1.4 - -28.9 -8.9
Operative EPS, EUR 0.14 0.21 -33 0.31 0.41
Operative ROCE* 10.4 10.5 - 10.4 10.5
Capital expenditure 30.9 51.0 -39 59.9 70.4
Casf flow after investingactivities**
10.5 24.2 -57 200.4 16.1
Gearing, % at period-end 36 44 - 36 44
Personnel at period-end 4,664 5,181 -10 4,664 5,181
*12-month rolling average
**2012 numbers include EUR 5.3 million dividends and EUR 27.3 million paid-in-capital from JV Sachtleben. 1-6/2013 numbers include EUR 97.5 m
divestment of the JV Sachtleben shares and EUR 80.6 million from the divestment of the food and pharmaceuticals businesses.
Kemira Capital Markets Day 2013
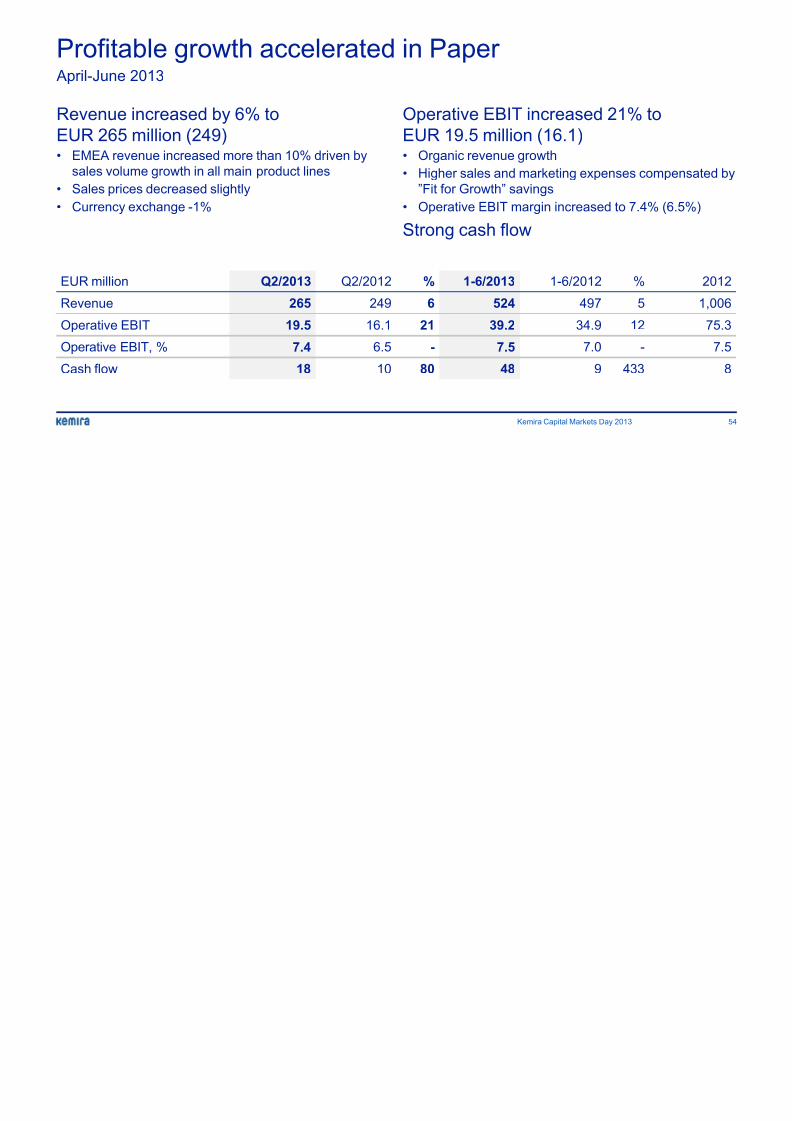
Profitable growth accelerated in Paper

8/13/2019 Emir 2013 Presentation
http://slidepdf.com/reader/full/emir-2013-presentation 54/69
g p April-June 2013
Revenue increased by 6% to
EUR 265 million (249)
• EMEA revenue increased more than 10% driven bysales volume growth in all main product lines
• Sales prices decreased slightly
• Currency exchange -1%
EUR million Q2/2013 Q2/2012 % 1-6/2013 1-6/2012
Revenue 265 249 6 524 497
Operative EBIT 19.5 16.1 21 39.2 34.9
Operative EBIT, % 7.4 6.5 - 7.5 7.0
Cash flow 18 10 80 48 9 4
Operative EBIT increased 21%
EUR 19.5 million (16.1)
• Organic revenue growth• Higher sales and marketing expense
”Fit for Growth” savings
• Operative EBIT margin increased to
Strong cash flow
Kemira Capital Markets Day 2013
Profitable growth in Municipal & Industrial
8/13/2019 Emir 2013 Presentation
http://slidepdf.com/reader/full/emir-2013-presentation 55/69
g p April-June 2013
Revenue increased 2% to
EUR 178 million (174)
• Revenues increased in all regions, except APAC• Currency exchange -1%
EUR million Q2/2013 Q2/2012 % 1-6/2013 1-6/2012
Revenue 178 174 2 343 335
Operative EBIT 15.9 12.0 33 24.5 17.7
Operative EBIT, % 8.9 6.9 - 7.1 5.3
Cash flow 5 -3 - 5 4
Operative EBIT increased 33%
EUR 15.9 million (12.0)
• Increased sales prices and sales volulower fixed costs
• Higher variable costs due to increase
based raw material prices during Q1
• Operative EBIT margin increased to
Kemira Capital Markets Day 2013
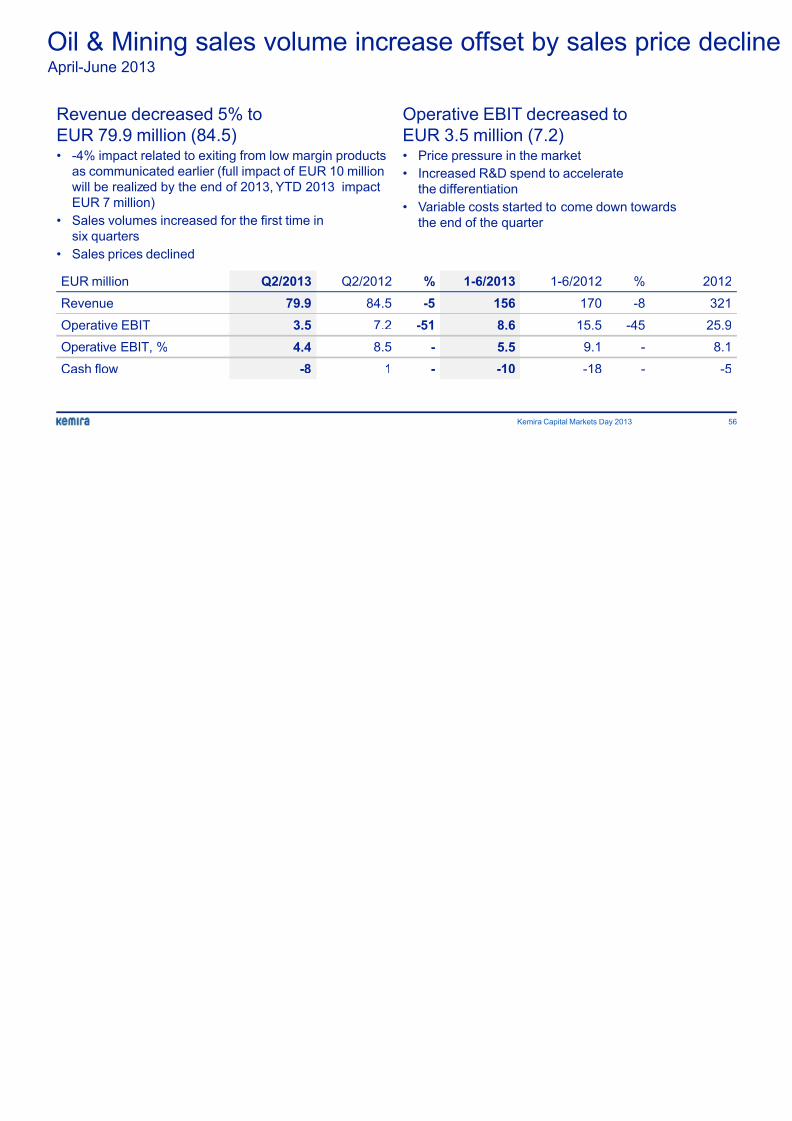
Oil & Mining sales volume increase offset by sales
8/13/2019 Emir 2013 Presentation
http://slidepdf.com/reader/full/emir-2013-presentation 56/69
April-June 2013
Revenue decreased 5% to
EUR 79.9 million (84.5)
• -4% impact related to exiting from low margin productsas communicated earlier (full impact of EUR 10 million
will be realized by the end of 2013, YTD 2013 impact
EUR 7 million)
• Sales volumes increased for the first time in
six quarters
• Sales prices declined
EUR million Q2/2013 Q2/2012 % 1-6/2013 1-6/2012
Revenue 79.9 84.5 -5 156 170
Operative EBIT 3.5 7.2 -51 8.6 15.5 -
Operative EBIT, % 4.4 8.5 - 5.5 9.1
Cash flow -8 1 - -10 -18
Operative EBIT decreased to
EUR 3.5 million (7.2)
• Price pressure in the market• Increased R&D spend to accelerate
the differentiation
• Variable costs started to come down
the end of the quarter
Kemira Capital Markets Day 2013
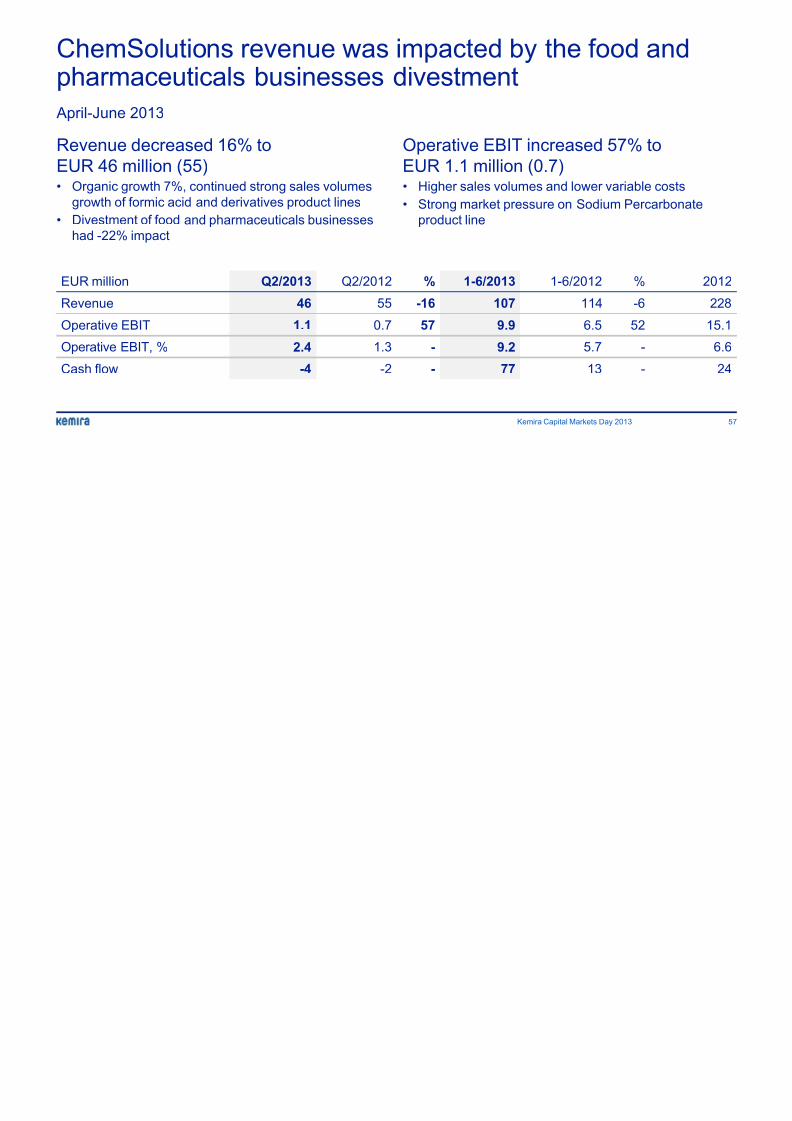
ChemSolutions revenue was impacted by the food

8/13/2019 Emir 2013 Presentation
http://slidepdf.com/reader/full/emir-2013-presentation 57/69
p ypharmaceuticals businesses divestment
April-June 2013
Revenue decreased 16% to
EUR 46 million (55)• Organic growth 7%, continued strong sales volumes
growth of formic acid and derivatives product lines
• Divestment of food and pharmaceuticals businesses
had -22% impact
EUR million Q2/2013 Q2/2012 % 1-6/2013 1-6/2012
Revenue 46 55 -16 107 114
Operative EBIT 1.1 0.7 57 9.9 6.5
Operative EBIT, % 2.4 1.3 - 9.2 5.7
Cash flow -4 -2 - 77 13
Operative EBIT increased 57%
EUR 1.1 million (0.7)• Higher sales volumes and lower varia
• Strong market pressure on Sodium P
product line
Kemira Capital Markets Day 2013
Kemira capital expenditure

8/13/2019 Emir 2013 Presentation
http://slidepdf.com/reader/full/emir-2013-presentation 58/69
p p
0
20
40
60
80
100
120
140
160
2008 2009 2010 2011 2012 1-6 2013
EUR million
134
56
98
7669
109
Kemira Capital Markets Day 2013
Net working capital ratio
8/13/2019 Emir 2013 Presentation
http://slidepdf.com/reader/full/emir-2013-presentation 59/69
Kemira ambition is to keep net working capital ratio* between 11%-11.5%
14.1%
13.3%
11.3%
13.4%
12.8%
9%
11%
13%
15%
2008 2009 2010 2011 2012
*) Rolling 12-month average
Kemira Capital Markets Day 2013
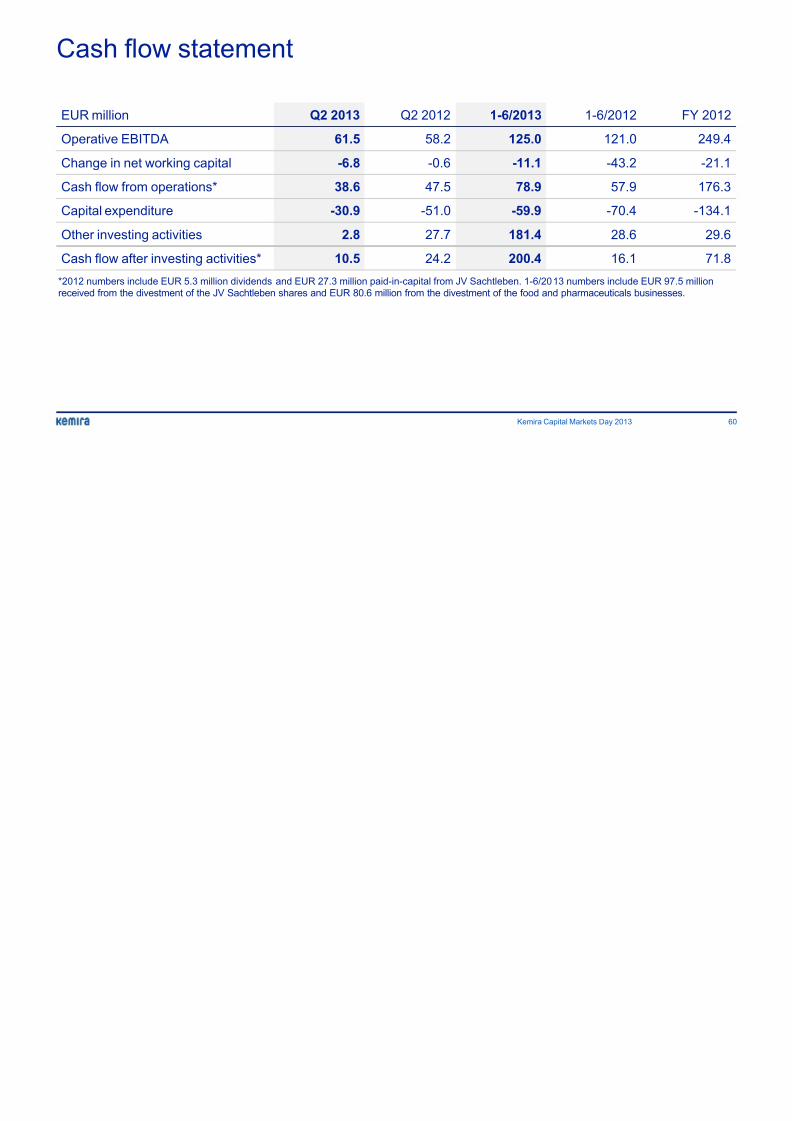
Cash flow statement
8/13/2019 Emir 2013 Presentation
http://slidepdf.com/reader/full/emir-2013-presentation 60/69
EUR million Q2 2013 Q2 2012 1-6/2013 1-6/201
Operative EBITDA 61.5 58.2 125.0 121.
Change in net working capital -6.8 -0.6 -11.1 -43.
Cash flow from operations* 38.6 47.5 78.9 57.
Capital expenditure -30.9 -51.0 -59.9 -70.4
Other investing activities 2.8 27.7 181.4 28.
Cash flow after investing activities* 10.5 24.2 200.4 16.
Kemira Capital Markets Day 2013
*2012 numbers include EUR 5.3 million dividends and EUR 27.3 million paid-in-capital from JV Sachtleben. 1-6/2013 numbers includ
received from the divestment of the JV Sachtleben shares and EUR 80.6 million from the divestment of the food and pharmaceuticals
8/13/2019 Emir 2013 Presentation
http://slidepdf.com/reader/full/emir-2013-presentation 61/69
Market andproduct
specifications
Kemira Capital Markets Day 2013, September 10
Kemira Capital Markets Day 2013
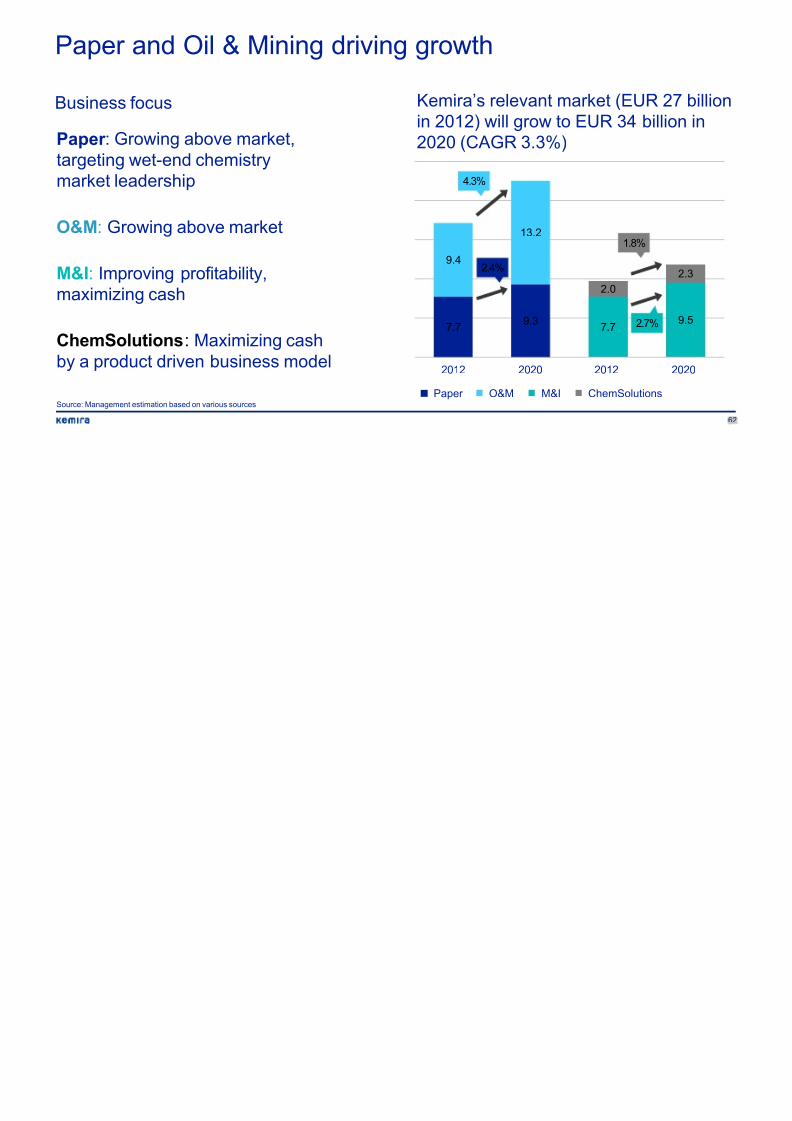
Paper and Oil & Mining driving growth

8/13/2019 Emir 2013 Presentation
http://slidepdf.com/reader/full/emir-2013-presentation 62/69
Kemira’s relevant market (E
in 2012) will grow to EUR 34
2020 (CAGR 3.3%)Paper : Growing above market,
targeting wet-end chemistrymarket leadership
O&M: Growing above market
M&I: Improving profitability,
maximizing cash
ChemSolutions: Maximizing cash
by a product driven business model
Source: Management estimation based on various sources
7.79.3
7.7
9.4
13.2
2.0
2012 2020 2012'
O&MPaper
2.4%
ChemSoM&I
4.3%
1.
Business focus
Paper segment - Demand for sizing and strengthh i l i i f t t l b ll
8/13/2019 Emir 2013 Presentation
http://slidepdf.com/reader/full/emir-2013-presentation 63/69
1.5 1.7 1.9 2.0 2.1 2
0.91.0
1.1
1.82.0
21.5
1.61.8
2012 2016 2020 2012 2016 20
Defoamers, biocides and other wet-end pr
chemicals is growing fastest globally
Pulp and paper industry trends increasing
chemical demand:
• Increased use of recycled fibres• Hardwood replacing softwood in virgin
pulp
• Lightweighting of packaging and board
grades
• Higher filler loads in graphic papers
• New digital printing methods
• Lower water / energy consumption
Market size,
EUR billion (CAGR: 2.4%)
Sizing and strength
Miscellaneous co
Bleaching chemi
Polymers
Kemira Capital Markets Day 2013
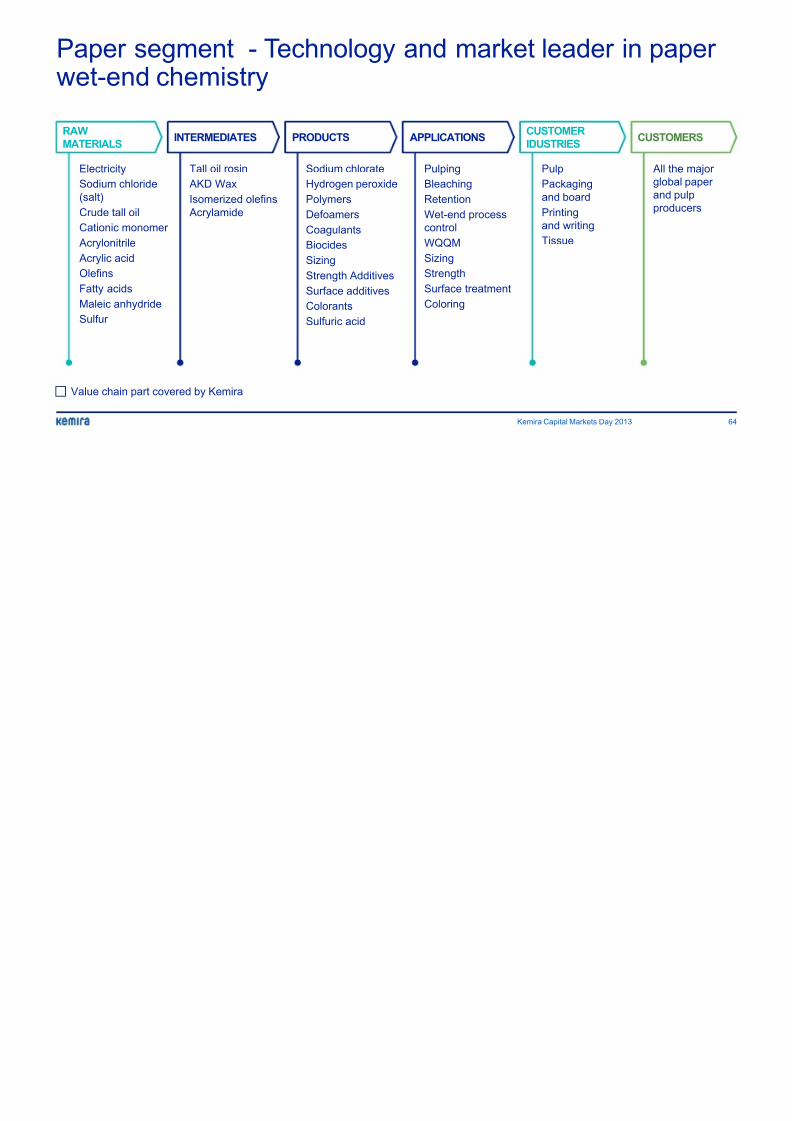
Paper segment - Technology and market leader it d h i t

8/13/2019 Emir 2013 Presentation
http://slidepdf.com/reader/full/emir-2013-presentation 64/69
wet-end chemistry
Value chain part covered by Kemira
RAW
MATERIALSINTERMEDIATES PRODUCTS APPLICATIONS
CUSTOMER
IDUSTRIES
Electricity
Sodium chloride
(salt)
Crude tall oil
Cationic monomer
Acrylonitrile
Acrylic acid
Olefins
Fatty acids
Maleic anhydride
Sulfur
Tall oil rosin
AKD Wax
Isomerized olefins
Acrylamide
Sodium chlorate
Hydrogen peroxide
Polymers
Defoamers
Coagulants
Biocides
Sizing
Strength Additives
Surface additives
Colorants
Sulfuric acid
Pulping
Bleaching
Retention
Wet-end process
control
WQQM
Sizing
Strength
Surface treatment
Coloring
Pulp
Packaging
and board
Printing
and writing
Tissue
Kemira Capital Markets Day 2013
Oil & Mining segment - Strong market growth acrod t li
8/13/2019 Emir 2013 Presentation
http://slidepdf.com/reader/full/emir-2013-presentation 65/69
product lines
• High oil price spurs demand for
identifying new sources
• Global growth of shale gas and wetshale
• Declining ore assays require improved
processing
• Increasing environmental pressure
which increases demand for waste
water treatment
Market size,
EUR billion (CAGR: 4.7%)
3.1 3.6 4.3
2.0
4.3
5.1
6.1
2012 2016 2020 2012
Polymers Defoamers, biocides
and other process
chemicals
Kemira Capital Markets Day 2013
Oil & Mining segment - Winning market share withtiti bi ti f i ti h i l
8/13/2019 Emir 2013 Presentation
http://slidepdf.com/reader/full/emir-2013-presentation 66/69
competitive combination of innovation chemicals aapplication knowledge
Value chain part covered by Kemira
RAW
MATERIALS
INTERMEDIATES PRODUCTS APPLICATIONS CUST
Acrylonitrile
Acrylic acid
Various monomers
Miscellaneous
specialty chemicalsand commodities
Acrylamide Polymers
Dispersants &
Antiscalants
Biocides
Emulsifiers
Defoamers
Coagulants
Formulations
Friction Reduction
Formation & Well Scale
Control
Asset integrity Microbial
Induced Corrosion
Enhanced Oil Recovery
Drilling muds
Concentrate thickening
Mineral slurrypreservation
Mining processes
Scale Control
P
O
op
S
co
M
Kemira Capital Markets Day 2013
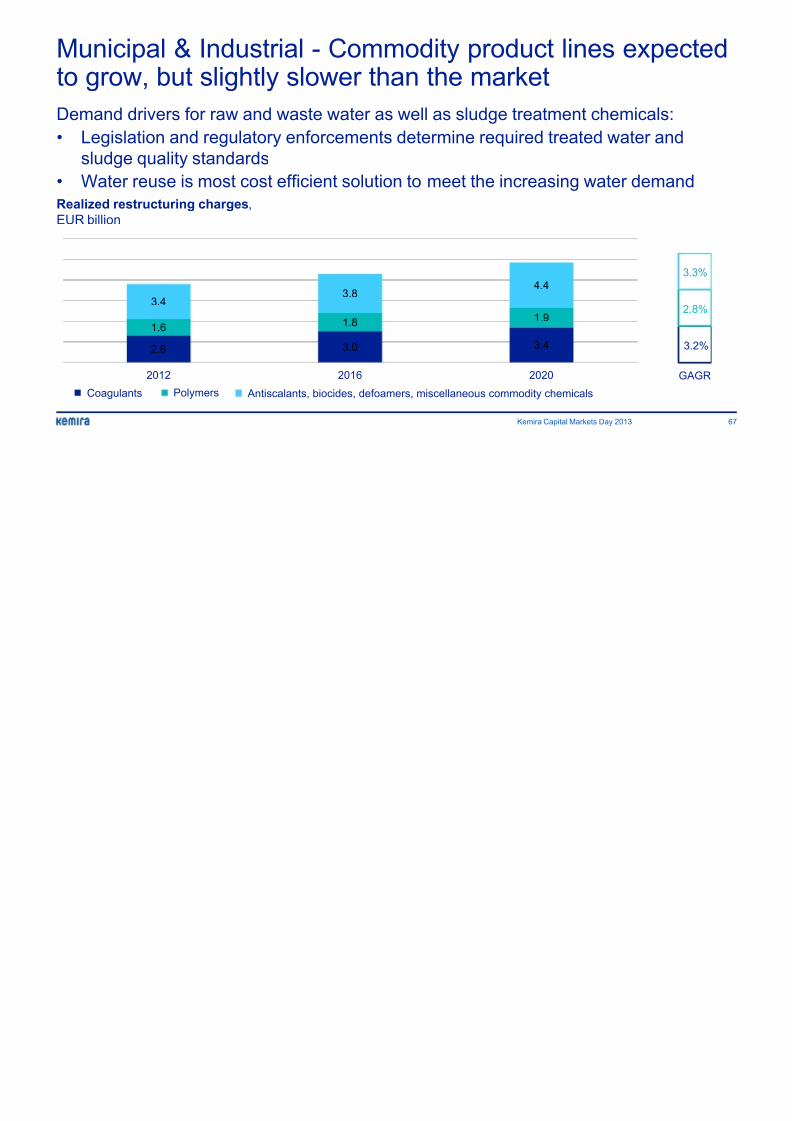
Municipal & Industrial - Commodity product lines eto grow but slightly slower than the market
8/13/2019 Emir 2013 Presentation
http://slidepdf.com/reader/full/emir-2013-presentation 67/69
to grow, but slightly slower than the market
Demand drivers for raw and waste water as well as sludge treatment chem
• Legislation and regulatory enforcements determine required treated wat
sludge quality standards• Water reuse is most cost efficient solution to meet the increasing water
2.6 3.0 3.4
1.6 1.8 1.9
3.4 3.8
4.4
2012 2016 2020
Coagulants Antiscalants, biocides, defoamers, miscellaneous commodity chemicalsPolymers
Realized restructuring charges,
EUR billion
Kemira Capital Markets Day 2013
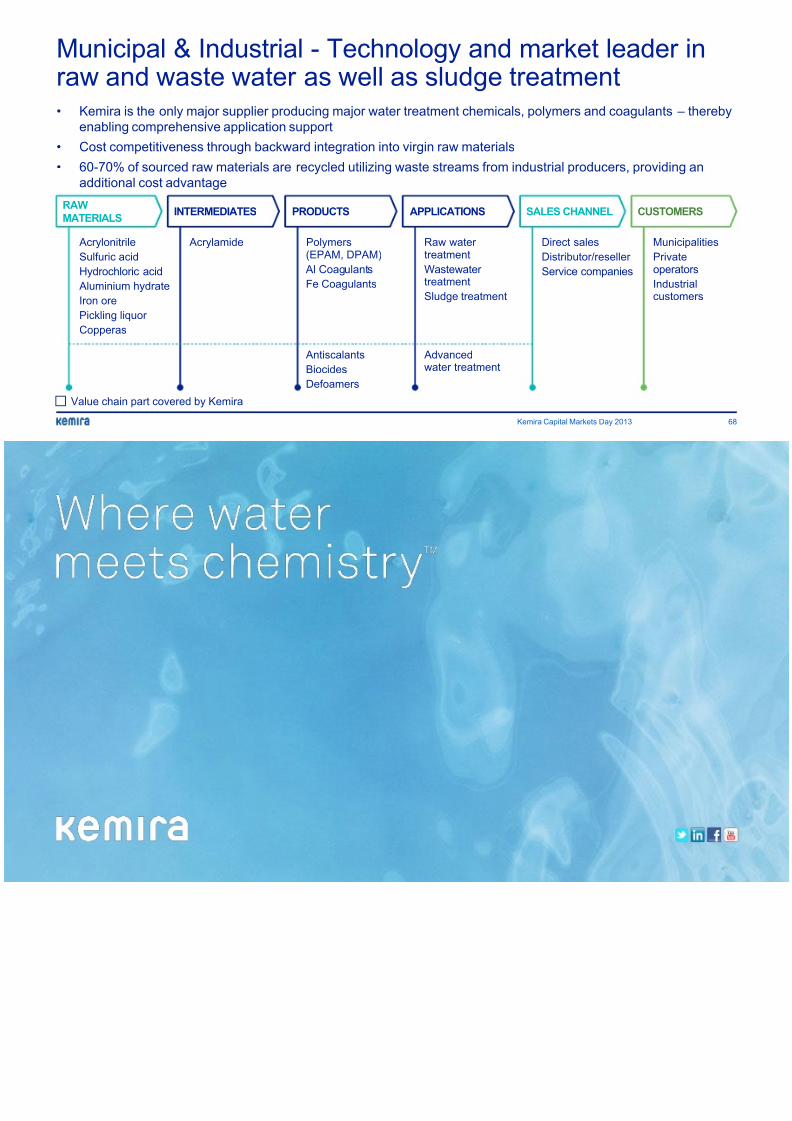
Municipal & Industrial - Technology and market learaw and waste water as well as sludge treatment

8/13/2019 Emir 2013 Presentation
http://slidepdf.com/reader/full/emir-2013-presentation 68/69
raw and waste water as well as sludge treatment• Kemira is the only major supplier producing major water treatment chemicals, polymers and coa
enabling comprehensive application support
• Cost competitiveness through backward integration into virgin raw materials
• 60-70% of sourced raw materials are recycled utilizing waste streams from industrial producers,
additional cost advantage
RAW
MATERIALSINTERMEDIATES PRODUCTS APPLICATIONS SALES CHANNEL
Acrylonitrile
Sulfuric acid
Hydrochloric acid
Aluminium hydrate
Iron orePickling liquor
Copperas
Acrylamide Polymers(EPAM, DPAM)
Al Coagulants
Fe Coagulants
Antiscalants
Biocides
Defoamers
Raw watertreatment
Wastewatertreatment
Sludge treatment
Advancedwater treatment
Direct sales
Distributor/reseller
Service companies
Value chain part covered by Kemira
Kemira Capital Markets Day 2013

8/13/2019 Emir 2013 Presentation
http://slidepdf.com/reader/full/emir-2013-presentation 69/69