emerging markets fund limited - wp-genesis-2020.s3.eu …
TRANSCRIPT

EMERGING MARKETS FUND LIMITED
HALF YEAR REPORT ANDUNAUDITED FINANCIAL STATEMENTSFOR THE SIX MONTHS ENDED 31st DECEMBER 2012
G E N E S I S


PAGE
INTRODUCTION .........................................................................................................................................................................................2
HALF YEAR REPORT
CHAIRMAN’S STATEMENT ............................................................................................................................................................3
MANAGER’S REVIEW .......................................................................................................................................................................5
INTERIM REPORT ...............................................................................................................................................................................7
TWENTY LARGEST HOLDINGS .................................................................................................................................................. 10
COUNTRY EXPOSURE OF THE PORTFOLIO ............................................................................................................................................13
SECTOR EXPOSURE OF THE PORTFOLIO ............................................................................................................................ 14
UNAUDITED CONSOLIDATED STATEMENT OF FINANCIAL POSITION ............................................................ 15
UNAUDITED CONSOLIDATED STATEMENT OF COMPREHENSIVE INCOME ................................................ 16
UNAUDITED CONSOLIDATED STATEMENT OF CHANGES IN EQUITY ............................................................ 17
UNAUDITED CONSOLIDATED STATEMENT OF CASH FLOWS ................................................................................ 18
NOTES TO THE UNAUDITED CONSOLIDATED FINANCIAL STATEMENTS ..................................................... 19
PERFORMANCE RECORD ................................................................................................................................................................ 21
ADMINISTRATION ................................................................................................................................................................................ 22
G E N E S I S E M E RG I N G M A R K E T S F U N D L I M I T E D
1
All reference to “$” throughout this report is to the United States currency.

OBJECTIVE
To provide shareholders with a broadly diversified means of investing
in developing countries and immature stock markets, and so provide
access to their superior returns offered by high rates of economic and
corporate growth, whilst limiting individual country risk.
STRUCTURE
The Fund is a Guernsey based Closed-Ended Investment Company,
with the ability to issue additional shares. The Fund’s shares are listed
on the official London Stock Exchange and are included in the FTSE
250. The number of Participating Preference Shares outstanding is
135,863,060 as at 31st December 2012 (30th June 2012: 135,863,060).
MANAGER
Genesis Asset Managers, LLP (“Manager” or “Genesis”)
INVESTMENT APPROACH
The investment approach is to identify companies which are able to
take advantage of growth opportunities in emerging markets for the
benefit of shareholders, and invest in them when they are trading at
an attractive discount to the Manager’s assessment of their intrinsic
value.
NEW SHARES
Shares may be issued twice monthly subject to the following conditions:
i) the Fund is invested as to at least 75% in emerging market
securities;
ii) the Fund will only issue new shares if it is unable, on behalf of
the new subscriber, to acquire shares in the secondary market at a
price equivalent to or below the price at which new shares would
be issued; and
iii) the issued share capital of the Fund is not increased by more than
ten per cent in any six month period.
I N T RO D U C T I O N
2

The investment environment has been rather uncertain over the last six months, following the
negative sentiment which dominated in the spring of last year. Despite this, however, equity markets
have performed reasonably well. The Fund’s net asset value per share (“NAV”) rose by 9.6% in
sterling terms over the half-year period, marginally underperforming the MSCI Emerging Markets
Index which increased by 10.0%.
The share price, however, rose by 14.8% over the same period, partly driven by some significant
additional purchases by one of the Fund’s major shareholders, and supported by a trend of
considerable interest from investors in emerging markets more generally. This activity meant that
the shares in fact traded briefly at a small premium to its NAV in mid-October, before the discount
moved back towards more typical levels, finishing the period at 3.3%.
The Fund held its Annual General Meeting on 2nd November 2012, at which Hélène Ploix was
elected to the Board. As I noted to shareholders in the Annual Report six months ago, Mrs Ploix’s
extensive international experience in finance and investment will bring a valuable contribution to the
Board’s deliberations, and its discussions with the Manager.
Mrs Ploix’s appointment brings the number of Board Members to six, representing a range of
financial and business backgrounds and skills, and we will, as a group, continue to strive to meet
shareholders’ expectations and protect their interests.
I am also pleased to report that shareholders voted in favour of all proposals at the Annual General
Meeting, and I thank them for their continuing support.
A number of shareholders attended the Fund’s Annual Information Meeting in London in October.
All holders are welcome to this event, which allows them to hear presentations from representatives
of the Manager. The discussion provided a detailed view of the Manager’s outlook for emerging
markets as well as the current positioning and recent performance of the Fund, and on this occasion
also incorporated a presentation on south-east Asia, a region the Manager currently feels is a source
of particularly attractive companies, and a number of interesting developments.
The Manager’s Review that follows this Statement explains some of the activity in the portfolio over
the last few months, and comments on the investment environment.
C H A I R M A N ’ S S TAT E M E N T
3

C H A I R M A N ’ S S TAT E M E N TC O N T I N U E D
Looking forward we believe that the environment will remain challenging for investors during
2013. One feature of recent months has been that those companies (often in the consumer sector)
which appear to have some level of predictability of income or cashflow have performed well, as
investors have trended towards “safe” investments in both developed and emerging markets. It is
worth remembering, however, a point often emphasised by the IMF (whose view of the outlook the
Manager also quotes from on the following page) while better policy choices in emerging economies
over the last decade have led to improved stock market performance, they have generally helped
economic growth by lengthening the duration of the upturns rather than muting the magnitude of
the downturns. As a result investors looking for short-term “safe” investments in emerging markets
may be disappointed. Conversely, those with a longer-term perspective should continue to do well in
emerging markets, where the best companies have the ability to use volatility or downturns to their
great advantage.
Coen Teulings
Chairman
February 2013
4

Equities have rallied over the last six months, recovering somewhat from the severe retreat in risk
appetite that closed the Fund’s last financial year. Caution remains appropriate, however, and it would
be difficult to improve on the IMF’s October summary of the current global economic outlook:
“The recovery continues, but it has weakened. In advanced economies, growth is now too low to
make a substantial dent in unemployment. And in major emerging market economies, growth that
had been strong earlier has also decreased.” Developing economies continue to provide the bulk of
the IMF’s 1.5% global growth estimate for 2013, but are affected by the tortuous unwinding of the
developed world’s debt overhang, mainly through the slowdown in global trade.
The Fund’s return was roughly in line with that of the MSCI Emerging Markets Index over the half-
year. In terms of significant drivers of relative performance, the Fund’s two major materials sector
holdings have had contrasting experiences. Anglo American was a major detractor from portfolio
performance and has had a torrid year, not only with generally weaker product prices but also
continued doubts over its capital allocation process centered on its large, costly and much-delayed
Minas Rio iron ore project in Brazil. On the positive side, First Quantum Minerals continued on
its growth path, successfully commissioning a new project in Finland and announcing a substantial
expansion to its flagship mine in Zambia as well as two new projects in that country. The company
ended the year by bidding for a fellow mid-tier copper miner with a large undeveloped project in
Panama. The absence of any holding in the underperforming Vale (Brazil) also had a positive effect
on performance.
In other sectors, energy companies Tullow Oil and OGX (Brazil) underperformed their peers, while
retail mall developer Central Pattana (Thailand) continued its very strong 2012 performance to
December.
Looking at portfolio changes, India has been the market seeing most purchase activity for the Fund
in recent months, with auto manufacturer Maruti Suzuki and Cognizant, an IT services firm that
complements the holdings in Infosys and TCS, added to the portfolio during the second half of
2012. Elsewhere the Fund instigated positions in a number of new holdings in several markets,
including Novolipetsk Steel (Russia), milk company China Mengniu Dairy, Robinson Department
Stores in Thailand, and First Bank, the largest bank in Nigeria by assets, deposits and loans. The
holdings of Bank of Ayudhya (Thailand) and Santander Brasil were also increased, along with
Anglo American (in response to its price weakness), while a number of Indonesian bank and cement
holdings were reduced after a prolonged period of strong performance.
M A N AG E R ’ S R E V I E W
5

The expected return of the portfolio remains in double digits. We forecast that earnings growth in
2013 will accelerate to the mid-teens following approximately 10% growth in 2012. While pockets
of the portfolio appear expensive, particularly some consumer holdings, others remain attractive,
most notably in the financials and materials sectors. Our estimates suggest that, in aggregate, the
companies we follow in Russia and South Korea are on single-digit earnings multiples for 2013, with
companies in the major markets of China and Brazil trading only a touch higher. This is enticing, we
believe, given that we are talking about the best quality companies in these countries.
Genesis Asset Managers, LLP
February 2013
M A N AG E R ’ S R E V I E WC O N T I N U E D
6

Capital ValuesAt 31st December 2012, the value of Equity Shareholders’ Funds was $1,228,173,000 (30th June
2012: $1,081,560,000) and the Equity per Participating Preference Share was $9.10 (30th June
2012: $8.02).
Risk ManagementThe investment objective of the Fund is to achieve capital growth over the medium to long term,
primarily through investment in equity securities quoted on emerging markets. The main risks to
the value of its assets arising from the Fund’s investment in financial instruments are unanticipated
adverse changes in market prices and foreign currency exchange rates and an absence of liquidity.
The Board reviews and agrees with the Manager policies for managing each of these risks and they
are summarised below. These policies have remained unchanged since the beginning of the period to
which these financial statements relate.
The economies, the currencies and the financial markets of a number of developing countries
in which the Fund invests may be extremely volatile. To manage the risks posed by adverse price
fluctuations the Fund’s investments are geographically diversified, and will continue to be so. The
Fund will not normally invest more than 25% of its assets (at the time the investment is made) in any
one country. Further, the exposure to any one company or group (other than an investment company,
unit trust or mutual fund) is unlikely to exceed 5% of the Fund’s net assets at the time the investment
is made. The Articles of Incorporation place a limit of 10% for securities issued by one company but
the Directors use 5% for monitoring purposes.
The Fund’s assets will be invested in securities of companies in various countries and income will be
received by the Fund in a variety of currencies. However, the Fund will compute its net asset value
and make any distributions in US dollars. The value of the assets of the Fund as measured in US
dollars may be affected favourably or unfavourably by fluctuations in currency rates and exchange
control regulations. Further, the Fund may incur costs in connection with conversions between
various currencies.
Trading volumes on the stock exchanges of developing countries can be substantially less than in
the leading stock markets of the developed world. This lower level of liquidity exaggerates the
fluctuations in the value of investments described previously. The restrictions on concentration and
the diversification requirements detailed above also serve normally to protect the overall value of the
Fund from the risks created by the lower level of liquidity in the markets in which the Fund operates.
I N T E R I M R E P O RT
7
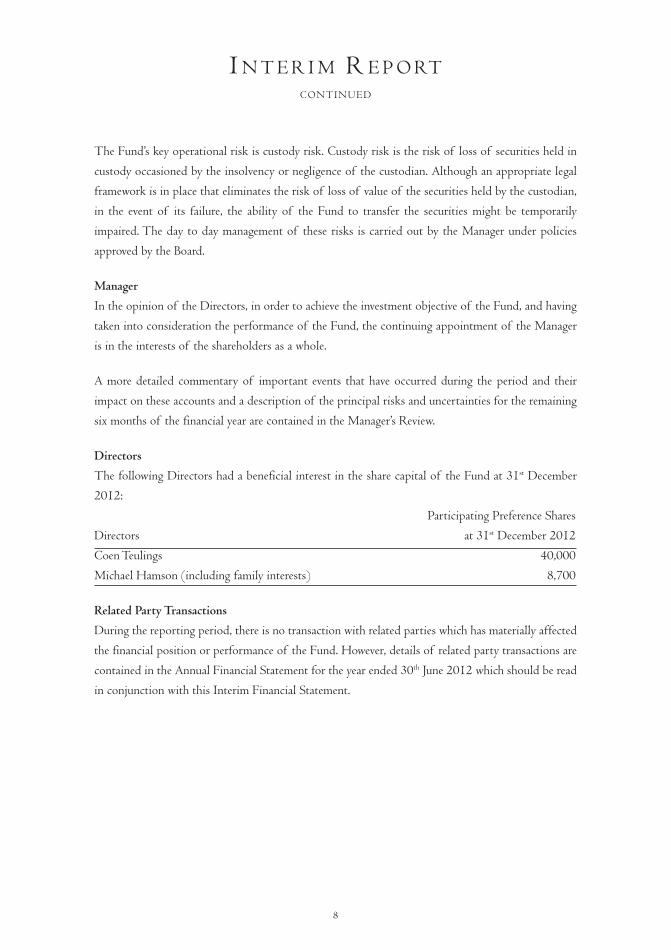
The Fund’s key operational risk is custody risk. Custody risk is the risk of loss of securities held in
custody occasioned by the insolvency or negligence of the custodian. Although an appropriate legal
framework is in place that eliminates the risk of loss of value of the securities held by the custodian,
in the event of its failure, the ability of the Fund to transfer the securities might be temporarily
impaired. The day to day management of these risks is carried out by the Manager under policies
approved by the Board.
ManagerIn the opinion of the Directors, in order to achieve the investment objective of the Fund, and having
taken into consideration the performance of the Fund, the continuing appointment of the Manager
is in the interests of the shareholders as a whole.
A more detailed commentary of important events that have occurred during the period and their
impact on these accounts and a description of the principal risks and uncertainties for the remaining
six months of the financial year are contained in the Manager’s Review.
DirectorsThe following Directors had a beneficial interest in the share capital of the Fund at 31st December
2012:
Participating Preference Shares
Directors at 31st December 2012
Coen Teulings 40,000
Michael Hamson (including family interests) 8,700
Related Party TransactionsDuring the reporting period, there is no transaction with related parties which has materially affected
the financial position or performance of the Fund. However, details of related party transactions are
contained in the Annual Financial Statement for the year ended 30th June 2012 which should be read
in conjunction with this Interim Financial Statement.
I N T E R I M R E P O RTCONTINUED
8
Going ConcernThe Directors believe that the Fund has adequate resources to continue in operational existence for
the foreseeable future. For this reason, they continue to adopt the going concern basis in preparing
the financial statements.
Responsibility StatementThe Directors confirm that to the best of their knowledge:
• the condensed set of financial statements has been prepared in accordance with IAS 34 ‘Interim
Financial Reporting’;
• as required by DTR 4.2.7R of the FSA’s Disclosure and Transparency Rules, the interim
management report includes a fair review of important events that have occurred during the first
six months of the financial year and their impact on the condensed set of financial statements,
and a description of the principal risks and uncertainties for the remaining six months of the
financial year; and
• the interim management report includes a fair review of the information concerning related
party transactions required by DTR 4.2.8R.
Approved by the Board
Coen Teulings Dr. John Llewellyn
Director Director
February 2013
I N T E R I M R E P O RTCONTINUED
9
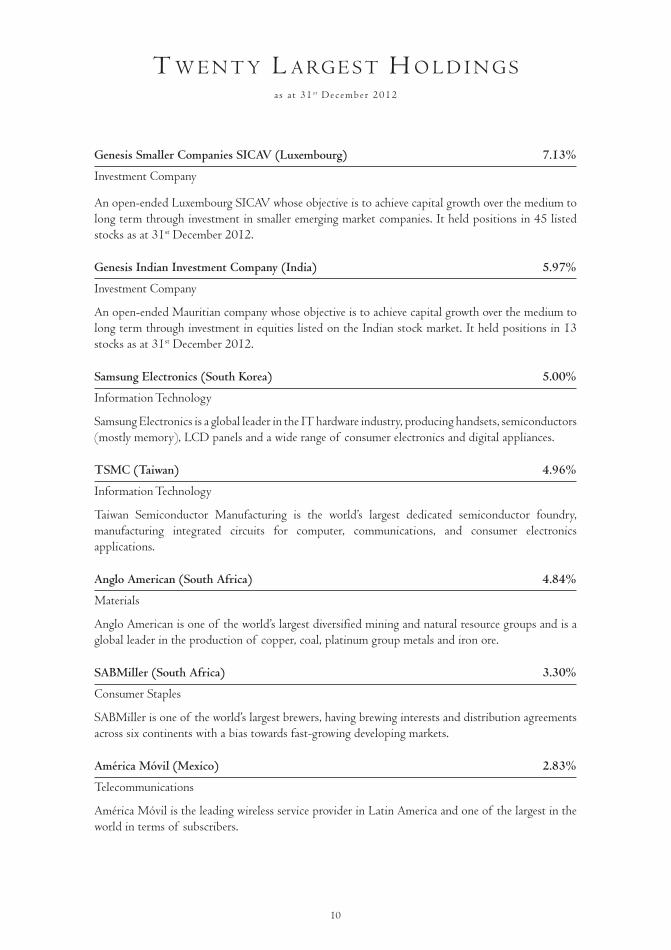
T W E N T Y L A RG E S T H O L D I N G Sas at 31 st December 2012
Genesis Smaller Companies SICAV (Luxembourg) 7.13%
Investment Company
An open-ended Luxembourg SICAV whose objective is to achieve capital growth over the medium to long term through investment in smaller emerging market companies. It held positions in 45 listed stocks as at 31st December 2012.
Genesis Indian Investment Company (India) 5.97%
Investment Company
An open-ended Mauritian company whose objective is to achieve capital growth over the medium to long term through investment in equities listed on the Indian stock market. It held positions in 13 stocks as at 31st December 2012.
Samsung Electronics (South Korea) 5.00%
Information Technology
Samsung Electronics is a global leader in the IT hardware industry, producing handsets, semiconductors (mostly memory), LCD panels and a wide range of consumer electronics and digital appliances.
TSMC (Taiwan) 4.96%
Information Technology
Taiwan Semiconductor Manufacturing is the world’s largest dedicated semiconductor foundry, manufacturing integrated circuits for computer, communications, and consumer electronics applications.
Anglo American (South Africa) 4.84%
Materials
Anglo American is one of the world’s largest diversified mining and natural resource groups and is a global leader in the production of copper, coal, platinum group metals and iron ore.
SABMiller (South Africa) 3.30%
Consumer Staples
SABMiller is one of the world’s largest brewers, having brewing interests and distribution agreements across six continents with a bias towards fast-growing developing markets.
América Móvil (Mexico) 2.83%
Telecommunications
América Móvil is the leading wireless service provider in Latin America and one of the largest in the world in terms of subscribers.
10

T W E N T Y L A RG E S T H O L D I N G SCONTINUED
First Quantum Minerals (Zambia) 2.45%
Materials
First Quantum Minerals explores for, mines, and produces copper, nickel and gold.
Tullow Oil (United Kingdom) 2.32%
Energy
Tullow Oil is a UK-listed independent oil exploration and production company with a major focus on Africa, where it is already a dominant player.
Sberbank (Russia) 2.14%
Financials
Sberbank is one of Russia’s oldest banks and the largest credit institution there, accounting for over a quarter of aggregate Russian banking assets and capital.
Korea Electric Power Corporation (South Korea) 2.09%
Energy
Korea Electric Power Corporation generates, transmits, and distributes electricity to South Korea for a variety of uses. The company also builds and operates hydro, thermal and nuclear power units in South Korea.
Banco Santander Brasil (Brazil) 1.86%
Financials
Banco Santander Brasil is a leading full-service bank strategically concentrated in the south and south-east of Brazil.
China Resources Enterprise (China) 1.67%
Consumer Staples
China Resources Enterprise is a conglomerate uniting several fast-growing consumer businesses in mainland China, including breweries, hypermarkets, supermarkets and food manufacturers.
China Mobile (China) 1.67%
Telecommunications
China Mobile is the largest mobile phone operator in China with more than half a billion subscribers.
11

Bank Of Ayudhya (Thailand) 1.61%
Financials
Bank of Ayudhya is one of the largest commercial banks in Thailand, with a focus on high yield retail activities, including credit cards.
Samsung Fire & Marine Insurance (South Korea) 1.47%
Financials
Samsung Fire and Marine Insurance is a leading South Korean company with automobile insurance prominent amongst its products.
Infosys (India) 1.42%
Information Technology
Infosys is based in Bangalore and is listed in both India and on NASDAQ. The company is a leading provider of consulting and IT services to Global 2000 companies.
Itau Unibanco (Brazil) 1.39%
Financials
Itau Unibanco is the largest Latin American bank with over 5,000 branches in Brazil alone. It was formed in 2008 by the merger of two of the oldest banks, Itau and Unibanco, both with many decades of operations in the Brazilian financial sector.
Anhui Conch Cement (China) 1.27%
Materials
Anhui Conch Cement is China’s largest cement producer in terms of sales and production volume.
China Merchants Bank (China) 1.25%
Financials
China Merchants Bank is headquartered in Shenzhen and mainly focuses on the Chinese domestic market, providing a wide range of commercial banking services.
Shinhan Financial Group (South Korea) 1.22%
Financials
Shinhan Financial Group is a holding company that offers a full range of financial services to retail and corporate customers in Korea through its subsidiaries, which include one of the largest banks in the country.
T W E N T Y L A RG E S T H O L D I N G SCONTINUED
12

C O U N T RY E X P O S U R E O F T H E P O RT F O L I O *Country December June December 2012 2012 2011 % % %China 13.06 13.28 13.95South Africa 10.30 9.97 10.06India 10.25 9.41 8.21South Korea 10.18 10.13 10.11Russia 7.78 7.32 7.14Brazil 6.84 7.08 8.06Taiwan 5.87 5.54 6.06Mexico 5.21 5.57 5.35Thailand 4.22 3.67 2.91Turkey 3.56 3.09 2.49Indonesia 2.55 4.17 5.59Zambia 2.44 2.38 2.48United Kingdom 2.32 2.97 2.77Nigeria 1.89 1.42 1.23Egypt 1.31 1.54 1.40Malaysia 1.20 1.77 2.20Hungary 1.04 1.06 1.10Colombia 1.00 1.01 1.03Chile 0.75 0.59 0.50Philippines 0.68 0.85 0.73Greece 0.63 0.55 0.56Romania 0.60 0.67 0.72Mauritius 0.60 0.65 0.63Argentina 0.53 0.47 0.42Austria 0.46 0.40 0.41Saudi Arabia 0.45 0.51 0.54Vietnam 0.35 0.46 0.47Mongolia 0.33 0.25 0.16Ghana 0.25 0.25 0.05Ukraine 0.23 0.23 0.25Zimbabwe 0.23 0.17 0.20Poland 0.21 - -Senegal 0.20 0.18 0.21Peru 0.18 0.17 0.15Estonia 0.18 0.14 0.15Botswana 0.17 0.04 -Kenya 0.12 0.21 0.18Croatia 0.11 0.11 0.13Jordan 0.11 0.11 0.09Lebanon 0.09 0.11 0.11Tanzania 0.09 0.11 0.06Mozambique 0.09 - -Czech Republic 0.04 0.04 0.05Sri Lanka 0.04 0.03 0.05Iran 0.03 0.04 0.04Kazakhstan - 0.04 0.04Net current assets 1.23 1.24 0.96
Total 100.00 100.00 100.00
* Treating Genesis Smaller Companies SICAV and Genesis Indian Investment Company Limited on a ‘look-through’ basis.
13
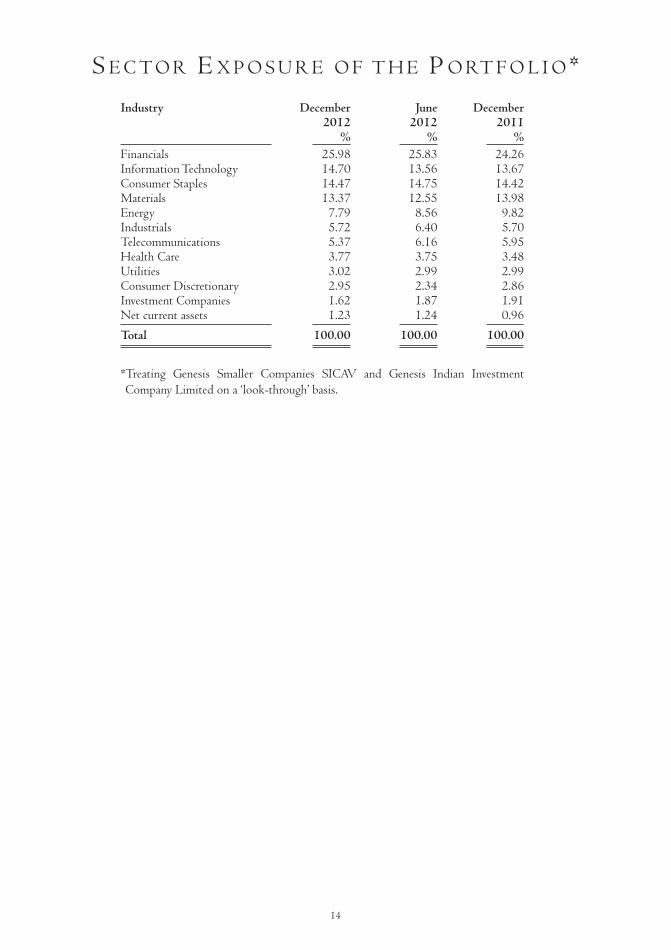
S E C T O R E X P O S U R E O F T H E P O RT F O L I O *Industry December June December 2012 2012 2011 % % %Financials 25.98 25.83 24.26Information Technology 14.70 13.56 13.67Consumer Staples 14.47 14.75 14.42Materials 13.37 12.55 13.98Energy 7.79 8.56 9.82Industrials 5.72 6.40 5.70Telecommunications 5.37 6.16 5.95Health Care 3.77 3.75 3.48Utilities 3.02 2.99 2.99Consumer Discretionary 2.95 2.34 2.86Investment Companies 1.62 1.87 1.91Net current assets 1.23 1.24 0.96
Total 100.00 100.00 100.00
* Treating Genesis Smaller Companies SICAV and Genesis Indian Investment Company Limited on a ‘look-through’ basis.
14

U N AU D I T E D C O N S O L I DAT E DS TAT E M E N T O F F I N A N C I A L P O S I T I O N
as at 31 st December 2012
(Audited) 31st December 30th June 2012 2012 $’000 $’000ASSETSCurrent assetsFinancial assets at fair value through profit or loss 1,213,431 1,068,101Amounts due from brokers 44 3,952Dividends receivable 890 2,810Other receivables and prepayments 154 160Cash and cash equivalents 18,863 10,407
TOTAL ASSETS 1,233,382 1,085,430
LIABILITIESCurrent liabilitiesAmounts due to brokers 1,250 160Capital gains tax accrued 2,048 1,664Payables and accrued expenses 1,911 2,046
TOTAL LIABILITIES 5,209 3,870
TOTAL NET ASSETS 1,228,173 1,081,560
EQUITYShare premium 134,349 134,349Capital reserve 1,066,689 916,195Revenue account 27,135 31,016
TOTAL EQUITY 1,228,173 1,081,560
EQUITY PER PARTICIPATINGPREFERENCE SHARE* $9.10 $8.02
* Calculated on an average number of 134,963,060 Participating Preference Shares outstanding as at 31st December 2012 (30th June 2012: 134,963,060).
The notes on pages 19 to 20 form part of these unaudited financial statements.
15

U N AU D I T E D C O N S O L I DAT E DS TAT E M E N T O F C O M P R E H E N S I V E I N C O M E
for the s ix months ended 31 st December 2012
2012 2011 $’000 $’000INCOMENet change in financial assets at fair value through profit or loss 150,621 (207,091)Net exchange losses (127) (134)Dividend income 8,472 7,137Deposit interest - 7Miscellaneous income 17 94
158,983 (199,987)EXPENSESManagement fees (8,715) (8,133)Custodian fees (677) (706)Transaction costs (593) (644)Directors’ fees and expenses (163) (150)Administration fees (106) (115)Audit fees (36) (24)Other expenses (107) (74)
TOTAL OPERATING EXPENSES (10,397) (9,846)
OPERATING PROFIT/(LOSS) 148,586 (209,833)
FINANCE COSTS - -Capital gains tax (1,008) (1)Withholding taxes (965) (574)
PROFIT/(LOSS) AFTER TAX 146,613 (210,408)Other comprehensive income - -
TOTAL COMPREHENSIVE INCOME/(LOSS) ATTRIBUTABLE TO PARTICIPATING PREFERENCE SHARES 146,613 (210,408)
EARNINGS PER PARTICIPATINGPREFERENCE SHARE* $1.09 $(1.56)
* Calculated on an average number of 134,963,060 Participating Preference Shares outstanding as at 31st December 2012 (30th June 2012: 134,963,060)
Note
4
16
The notes on pages 19 to 20 form part of these unaudited financial statements.
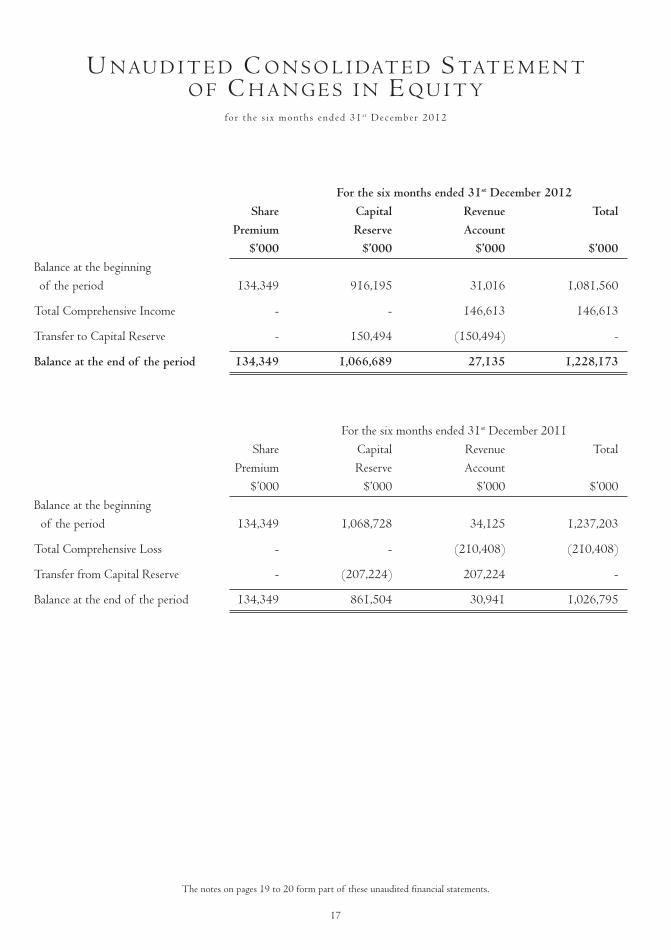
U N AU D I T E D C O N S O L I DAT E D S TAT E M E N TO F C H A N G E S I N E Q U I T Y
for the s ix months ended 31 st December 2012
For the six months ended 31st December 2012 Share Capital Revenue Total Premium Reserve Account $’000 $’000 $’000 $’000Balance at the beginningof the period 134,349 916,195 31,016 1,081,560
Total Comprehensive Income - - 146,613 146,613
Transfer to Capital Reserve - 150,494 (150,494) -
Balance at the end of the period 134,349 1,066,689 27,135 1,228,173
For the six months ended 31st December 2011 Share Capital Revenue Total Premium Reserve Account $’000 $’000 $’000 $’000Balance at the beginning of the period 134,349 1,068,728 34,125 1,237,203
Total Comprehensive Loss - - (210,408) (210,408)
Transfer from Capital Reserve - (207,224) 207,224 -
Balance at the end of the period 134,349 861,504 30,941 1,026,795
17
The notes on pages 19 to 20 form part of these unaudited financial statements.

U N AU D I T E D C O N S O L I DAT E DS TAT E M E N T O F C A S H F L OW S
for the s ix months ended 31 st December 2012
2012 2011 $’000 $’000OPERATING ACTIVITIESDividends received 10,409 11,409Taxation paid (1,589) (1,345)Purchase of investments (99,514) (112.080)Proceeds from sale of investments 109,803 109,166Interest received - 7Operating expenses paid (10,526) (10,229)
NET CASH INFLOW/(OUTFLOW) FROM OPERATING ACTIVITIES 8,583 (3,072) Effect of exchange losses on cash and cash equivalents (127) (133)
NET INCREASE/(DECREASE) IN CASH AND CASH EQUIVALENTS 8,456 (3,205) Net cash and cash equivalents at the beginning of period 10,407 13,496
NET CASH AND CASH EQUIVALENTS AT THE END OF THE PERIOD 18,863 10,291 Comprising: Cash and cash equivalents 18,863 10,291
18
The notes on pages 19 to 20 form part of these unaudited financial statements.

N O T E S T O T H E U N AU D I T E D C O N S O L I DAT E DF I N A N C I A L S TAT E M E N T S
for the s ix months ended 31 st December 2012
The “Fund” comprises Genesis Emerging Markets Fund Limited (the “Company”) and its wholly owned subsidiary Genemar Limited. The Company was incorporated in Guernsey on 7th June 1989 and commenced its activities on 19th September 1989. The Fund is an authorised Closed-Ended Investment Company as defined by the Authorised Closed-Ended Investment Schemes Rules (2008) (and, as such, is subject to ongoing supervision by the Guernsey Financial Services Commission). The Fund is listed on London Stock Exchange and is a constituent of the FTSE 250 Index.
The Fund’s registered office is at Arnold House, St. Julian’s Avenue, St. Peter Port, Guernsey GY1 3NF, Channel Islands.
The Interim Financial Information for the six months ended 31st December 2012 has been prepared in accordance with International Accounting Standards 34, ‘Interim Financial Reporting’. The Interim Financial Information should be read in conjunction with the Annual Financial Statements for the year ended 30th June 2012, which have been prepared in accordance with International Financial Reporting Standards (‘IFRS’).
The unaudited consolidated financial statements have been prepared under the historical cost convention, as modified by the revaluation of financial assets and financial liabilities at fair value through profit or loss.
1. GENERAL
2 . BASIS OFPREPARATION
3. RECONCILIATIONOF PUBLISHED NET
ASSET VALUEATTRIBUTABLE TO
EQUITYSHAREHOLDERS TO
THE IFRSEQUIVALENT
Published Net Asset ValueChange from mid-marketpricing to bid pricing forinvestmentsNet Asset Value under IFRS
Published Net Asset ValueChange from mid-marketpricing to bid pricing forinvestmentsNet Asset Value under IFRS
Total$’000
1,234,771
(6,598)1,228,173
Total$’000
1,087,287
(5,727)1,081,560
Per ParticipatingPreference Share
$9.15
1,234,771
(0.05)9.10
Per ParticipatingPreference Share
$8.06
(0.04)8.02
31st December 2012
30th June 2012
19
N O T E S T O T H E U N AU D I T E D C O N S O L I DAT E DF I N A N C I A L S TAT E M E N T S
CONTINUED
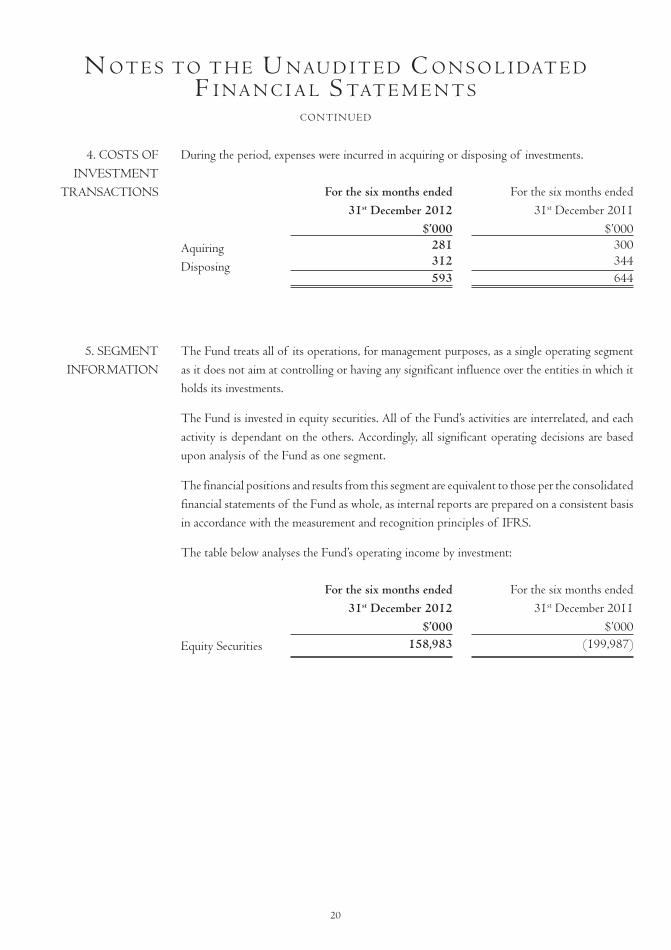
During the period, expenses were incurred in acquiring or disposing of investments.
The Fund treats all of its operations, for management purposes, as a single operating segment as it does not aim at controlling or having any significant influence over the entities in which it holds its investments.
The Fund is invested in equity securities. All of the Fund’s activities are interrelated, and each activity is dependant on the others. Accordingly, all significant operating decisions are based upon analysis of the Fund as one segment.
The financial positions and results from this segment are equivalent to those per the consolidated financial statements of the Fund as whole, as internal reports are prepared on a consistent basis in accordance with the measurement and recognition principles of IFRS.
The table below analyses the Fund’s operating income by investment:
Aquiring Disposing
Equity Securities
4. COSTS OFINVESTMENT
TRANSACTIONS
5. SEGMENTINFORMATION
For the six months ended31st December 2011
$’000300344644
For the six months ended31st December 2011
$’000(199,987)
For the six months ended31st December 2012
$’000281312593
For the six months ended31st December 2012
$’000158,983
20

P E R F O R M A N C E R E C O R D
Date Fund FX Rate Fund MSCI EM (TR) MSCI EM (TR) Fund MSCI EM (TR) NAV ($) (£/$) NAV (£) ($) (£) NAV (£) (£)
31.12.89 0.58 1.61 0.36 231.65 143.61 11.85 28.00 29.06.90 0.77 1.74 0.44 258.08 147.93 35.93 31.85 31.12.90 0.61 1.93 0.31 207.21 107.25 (2.36) (4.41) 28.06.91 0.78 1.62 0.48 281.28 173.52 48.98 54.66 31.12.91 0.93 1.87 0.50 331.35 177.67 54.92 58.35 30.06.92 1.07 1.90 0.56 355.82 186.90 74.15 66.58 31.12.92 0.95 1.51 0.63 369.14 244.02 95.19 117.49 30.06.93 1.11 1.49 0.74 421.83 282.35 129.80 151.65 31.12.93 1.58 1.48 1.07 645.38 436.81 231.72 289.32 30.06.94 1.47 1.55 0.95 578.58 373.77 194.69 233.14 31.12.94 1.58 1.56 1.01 598.17 382.26 213.61 240.71 30.06.95 1.53 1.59 0.96 578.48 363.54 197.48 224.02 31.12.95 1.46 1.55 0.94 567.01 364.99 190.54 225.31 30.06.96 1.70 1.55 1.10 627.49 403.71 239.66 259.82 31.12.96 1.75 1.71 1.02 601.21 351.17 217.06 212.99 30.06.97 2.21 1.67 1.33 707.94 425.11 310.84 278.89 31.12.97 1.82 1.64 1.11 531.56 323.41 243.65 188.25 30.06.98 1.52 1.67 0.91 431.27 258.25 182.34 130.17 31.12.98 1.30 1.66 0.78 396.86 238.66 141.60 112.71 30.06.99 1.55 1.57 0.98 555.08 352.48 204.13 214.16 31.12.99 1.86 1.62 1.15 660.41 408.84 257.15 264.40 30.06.00 1.76 1.51 1.17 607.65 401.62 261.43 257.96 31.12.00 1.47 1.50 0.98 458.26 306.40 205.32 173.09 30.06.01 1.55 1.41 1.10 450.73 320.05 241.19 185.26 31.12.01 1.57 1.45 1.08 447.39 308.44 234.47 174.91 30.06.02 1.61 1.52 1.06 456.63 299.88 228.38 167.28 31.12.02 1.55 1.61 0.96 420.54 261.32 197.61 132.91 30.06.03 1.84 1.65 1.11 488.40 295.55 244.99 163.42 31.12.03 2.53 1.79 1.42 657.22 368.02 339.01 228.01 30.06.04 2.61 1.81 1.44 652.07 359.94 346.96 220.81 31.12.04 3.38 1.92 1.76 827.78 431.56 445.78 284.64 30.06.05 3.67 1.79 2.05 879.58 490.86 535.43 337.50 31.12.05 4.59 1.72 2.67 1,113.71 648.45 727.93 477.95 30.06.06 4.80 1.85 2.60 1,195.39 646.51 704.76 476.22 31.12.06 5.92 1.96 3.02 1,476.63 754.15 836.49 572.16 30.06.07 7.05 2.01 3.52 1,738.72 866.89 989.80 672.65 31.12.07 7.96 1.99 4.00 2,064.00 1,036.87 1,139.16 824.15 30.06.08 7.40 1.99 3.72 1823.79 916.43 1053.17 716.80 31.12.08 3.97 1.44 2.76 966.34 672.10 755.31 499.03 30.06.09 5.47 1.65 3.32 1,316.39 799.36 928.94 612.46 31.12.09 7.40 1.62 4.57 1,729.96 1,070.52 1,318.22 854.14 30.06.10 7.26 1.49 4.85 1,625.46 1,085.95 1,403.59 867.90 31.12.10 9.12 1.56 5.84 2,062.04 1,320.72 1,710.43 1,077.14 31.03.11 8.97 1.60 5.71 2,105.28 1,311.62 1,669.95 1,069.03 30.06.11 9.20 1.61 5.73 2,083.31 1,297.12 1,675.77 1,056.11 30.09.11 7.34 1.56 4.69 1,615.42 1,033.27 1,354.64 820.94 31.12.11 7.64 1.56 4.91 1,687.30 1,084.10 1,421.11 866.25 30.03.12 8.65 1.60 5.40 1,925.64 1,204.33 1,576.88 973.41 29.06.12 8.06 1.57 5.14 1,756.77 1,119.89 1,492.04 898.14 28.09.12 8.70 1.61 5.40 1,895.32 1,175.54 1,572.48 947.74 31.12.12 9.15 1.62 5.65 2,001.60 1,231.60 1,645.11 997.71
The $ and £ NAV figures have been adjusted to reflect the one-for-one capitalisation issue made in September 1993. The $ and £ NAV figures have been adjusted to reflect the ten-for-one share split in November 2009. The figures are based on mid-market prices.
Percentageincrease from
30th June 1989
Percentageincrease from6th July 1989
21

A D M I N I S T R AT I O N
REGISTERED OFFICEArnold House, St. Julian’s Avenue, St. Peter Port, Guernsey GY1 3NF, Channel Islands
WEBSITEwww.giml.co.uk
MANAGER Genesis Asset Managers, LLP
Heritage Hall, P.O. Box 225, Le Marchant Street, St. Peter Port, Guernsey GY1 4HY, Channel Islands
CUSTODIAN AND REGISTRARHSBC Custody Services (Guernsey) Limited
Arnold House, St. Julian’s Avenue, St. Peter Port, Guernsey GY1 3NF, Channel Islands
INVESTMENT ADVISERGenesis Investment Management, LLP
21 Grosvenor Place, London SW1X 7HU, United Kingdom (Authorised and regulated by the United Kingdom’s Financial Services Authority)
SUB-CUSTODIANJP Morgan Chase Bank
25 Bank Street, Canary Wharf, London E14 5JP, United Kingdom
ADMINISTRATOR AND SECRETARYHSBC Securities Services (Guernsey) Limited
Arnold House, St. Julian’s Avenue, St. Peter Port, Guernsey GY1 3NF, Channel Islands
SUB-REGISTRAR AND TRANSFER AGENTComputershare Investor Services (Channel Islands) Limited
Queensway House, Hilgrove Street, St. Helier, Jersey JE1 1ES, Channel Islands
STOCKBROKERSJP Morgan Cazenove
25 Bank Street, Canary Wharf, London E14 5JP, United Kingdom Smith & Williamson Securities
25 Moorgate, London EC2R 6AY, United Kingdom
INDEPENDENT AUDITORSPricewaterhouseCoopers, CI LLP
Royal Bank Place, 1 Glategny Esplanade, St. Peter Port, Guernsey GY1 4ND, Channel Islands
LEGAL ADVISERSMourant Ozannes
1 Le Marchant Street, St. Peter Port, Guernsey GY1 4HP, Channel Islands
22
© Copyright: Genesis Emerging Markets Fund Limited 2013


GENESIS EMERGING MARKETS FUND LIMITEDArnold House
St. Julian’s Avenue, St. Peter PortGuernsey GY1 3NF, Channel Islands