emerging chinese market & consumer insights€¦ · emerging chinese market & consumer...
TRANSCRIPT
Emerging Chinese Market & Consumer Insights
Vinay DixitSenior Director – Asia Consumer CentersMcKinsey & Company
15 October 2010
CONFIDENTIAL AND PROPRIETARYAny use of this material without specific permission of McKinsey & Company is strictly prohibited

McKinsey & Company 1|
Presentation Outline
Role of Internet in lifestyle & consumption
Increasing consumer sophistication
▪ Continued shift towards discretionary spend categories
▪ City-tiers no longer the best business opportunity framework in China; city-clusters more effective & efficient
▪ Brands remain important, but loyalty is falling; moreover loyalty is largely to a suite of brands rather than a single brand
▪ While some consumers are upgrading, a majority are “trading-off”to manage their share of wallet
Chinese market & consumers
Continued macroeconomic resilience
▪ Macroeconomic fundamentals remain strong
▪ Continued drive towards urbanization results in majority of economic activity to be concentrated in urban centers
▪ The explosive growth of internet is causing significant shifts in lifestyles, research process and purchase channels in China & India
▪ Consumers are turning into “smart-shoppers” at accelerated pace
McKinsey & Company 2|
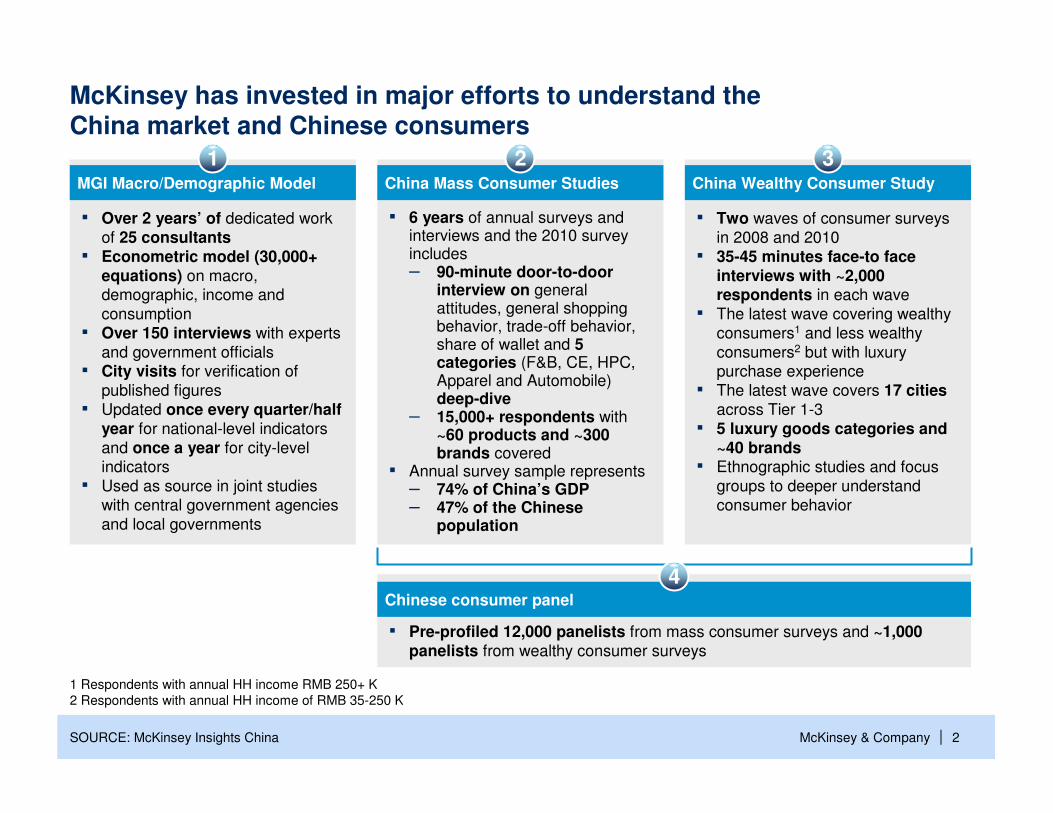
McKinsey has invested in major efforts to understand the China market and Chinese consumers
SOURCE: McKinsey Insights China
1 Respondents with annual HH income RMB 250+ K
2 Respondents with annual HH income of RMB 35-250 K
▪ Over 2 years’ of dedicated work
of 25 consultants▪ Econometric model (30,000+
equations) on macro, demographic, income and
consumption
▪ Over 150 interviews with experts
and government officials▪ City visits for verification of
published figures
▪ Updated once every quarter/half year for national-level indicators
and once a year for city-level indicators
▪ Used as source in joint studies
with central government agencies
and local governments
▪ Two waves of consumer surveys
in 2008 and 2010
▪ 35-45 minutes face-to face interviews with ~2,000 respondents in each wave
▪ The latest wave covering wealthy
consumers1 and less wealthy
consumers2 but with luxury purchase experience
▪ The latest wave covers 17 citiesacross Tier 1-3
▪ 5 luxury goods categories and ~40 brands
▪ Ethnographic studies and focus
groups to deeper understand
consumer behavior
▪ 6 years of annual surveys and interviews and the 2010 survey includes– 90-minute door-to-door
interview on general attitudes, general shopping behavior, trade-off behavior, share of wallet and 5categories (F&B, CE, HPC, Apparel and Automobile)deep-dive
– 15,000+ respondents with ~60 products and ~300 brands covered
▪ Annual survey sample represents– 74% of China’s GDP– 47% of the Chinese
population
MGI Macro/Demographic Model China Wealthy Consumer StudyChina Mass Consumer Studies
1 2 3
▪ Pre-profiled 12,000 panelists from mass consumer surveys and ~1,000 panelists from wealthy consumer surveys
Chinese consumer panel
4

McKinsey & Company 3|SOURCE: Global Insight; McKinsey Insights China - August 2010 update
China’s GDP has rebounded well, and is expected to stayrobust to 2025
CONTINUED MACROECONOMIC RESILIENCE
Growth of China real GDP – YearlyGrowth of China real GDP – Quarterly (YoY)
11.9
10.7
6.2
0
2
4
6
8
10
12
14
Q1Q4Q3Q2Q1Q4Q3Q2Q1Q4Q3Q2Q1
10.3
Q2
2007 08 09 2010
9.8
8.7
5
6
7
8
9
10
11
12
13
14
2025 2015102005
History Forecast
>9% 8~9% <8%
China’s GDP is expected to grow at around 10% in 2010 and between 8-10% through the current decade
McKinsey & Company 4|
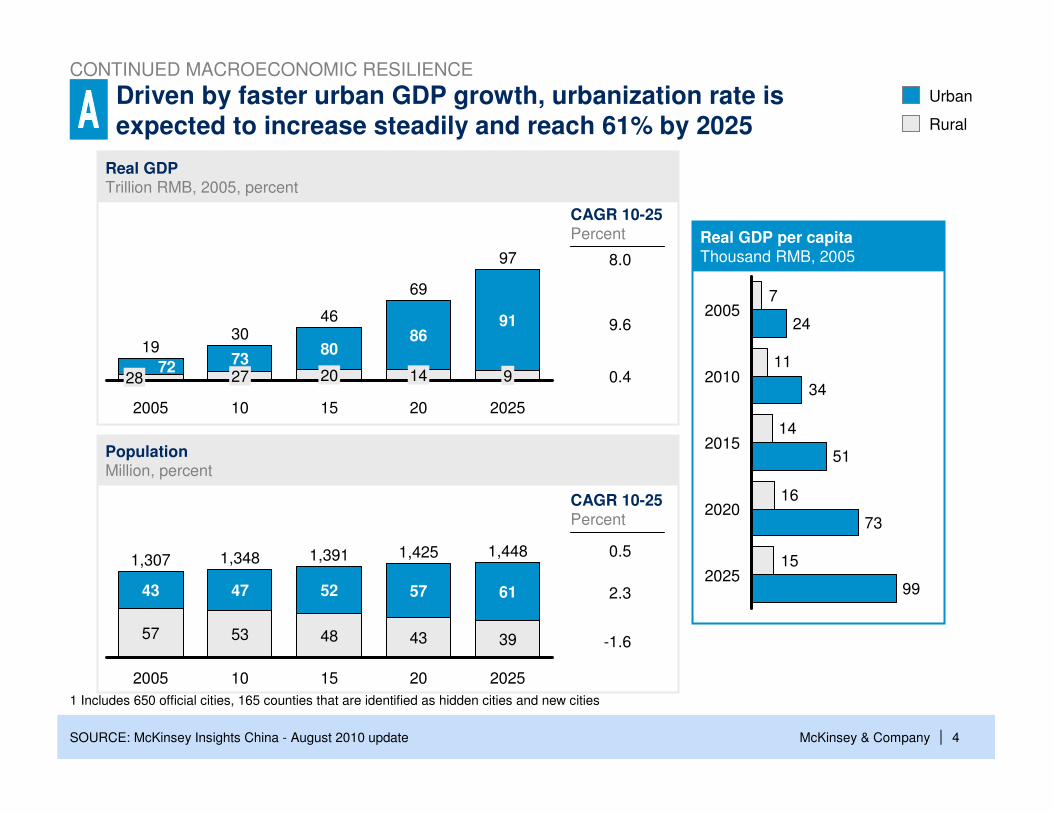
1 Includes 650 official cities, 165 counties that are identified as hidden cities and new cities
SOURCE: McKinsey Insights China - August 2010 update
Driven by faster urban GDP growth, urbanization rate is expected to increase steadily and reach 61% by 2025
CONTINUED MACROECONOMIC RESILIENCE
Real GDP Trillion RMB, 2005, percent
PopulationMillion, percent
Real GDP per capitaThousand RMB, 2005
73
2005
19
2872
10
27
30
69
20
91
2025
97
914
86
15
46
20
80
2025
1,448
39
20
1,425
61
43
52
10
57
15
1,348
53
1,391
48
47
2005
43
1,307
57
15
16
14
11
7
99
73
51
34
24
2025
2015
2020
2010
20059.6
0.4
8.0
2.3
-1.6
0.5
CAGR 10-25Percent
CAGR 10-25Percent
Urban
Rural
McKinsey & Company 5|
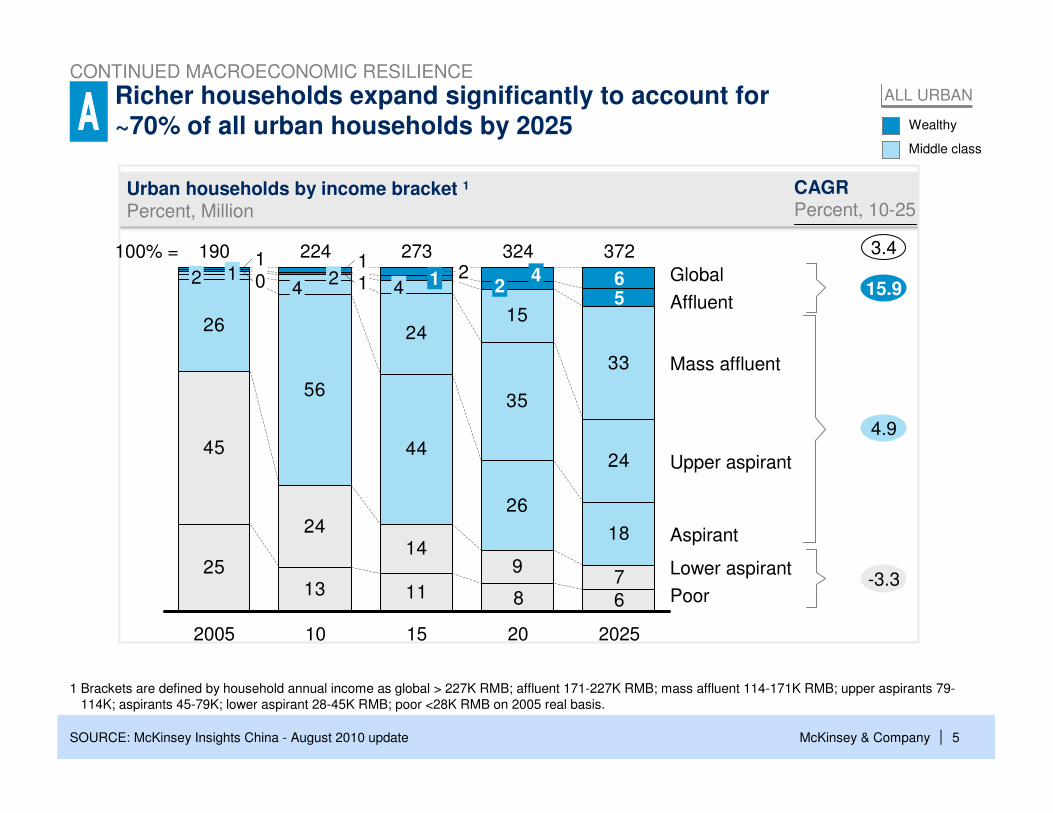
1 Brackets are defined by household annual income as global > 227K RMB; affluent 171-227K RMB; mass affluent 114-171K RMB; upper aspirants 79-
114K; aspirants 45-79K; lower aspirant 28-45K RMB; poor <28K RMB on 2005 real basis.
ALL URBAN
SOURCE: McKinsey Insights China - August 2010 update
Richer households expand significantly to account for~70% of all urban households by 2025
Urban households by income bracket 1
Percent, Million
CONTINUED MACROECONOMIC RESILIENCE
2513 11 6
45
2414
97
26
56
44
26
18
24
35
24
8
33
15
102
11100% = 324
224
5
224
10
14
273
15
372
Global
Affluent
Mass affluent
Upper aspirant
Aspirant
2025
Lower aspirant
Poor
12 4
20
6
190
2005
15.9
3.4
4.9
-3.3
Middle class
Wealthy
CAGRPercent, 10-25

McKinsey & Company 6|
Presentation Outline
Role of Internet in lifestyle & consumption
Increasing consumer sophistication
▪ Continued shift towards discretionary spend categories
▪ City-tiers no longer the best business opportunity framework in China; city-clusters more effective & efficient
▪ Brands remain important, but loyalty is falling; moreover loyalty is largely to a suite of brands rather than a single brand
▪ While some consumers are upgrading, a majority are “trading-off”to manage their share of wallet
Chinese market & consumers
Continued macroeconomic resilience
▪ Macroeconomic fundamentals remain strong
▪ Continued drive towards urbanization results in majority of economic activity to be concentrated in urban centers
▪ The explosive growth of internet is causing significant shifts in lifestyles, research process and purchase channels in China & India
▪ Consumers are turning into “smart-shoppers” at accelerated pace
McKinsey & Company 7|
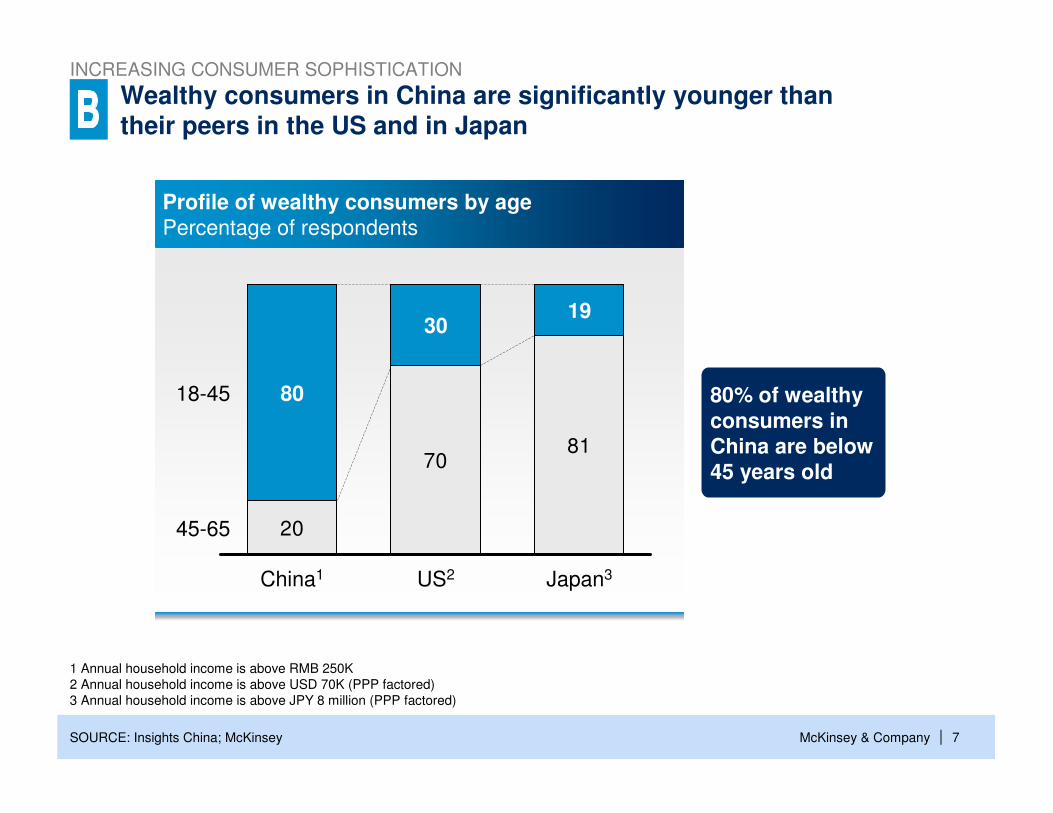
20
7081
45-65
18-45
Japan3
19
US2
30
China1
80
Profile of wealthy consumers by agePercentage of respondents
80% of wealthy consumers in China are below 45 years old
1 Annual household income is above RMB 250K
2 Annual household income is above USD 70K (PPP factored)
3 Annual household income is above JPY 8 million (PPP factored)
SOURCE: Insights China; McKinsey
Wealthy consumers in China are significantly younger than their peers in the US and in Japan
INCREASING CONSUMER SOPHISTICATION

McKinsey & Company 8|SOURCE: McKinsey Insights China - March 2010 update
Urban China's share of wallet will continue to shift towards discretionary categories
ALL URBAN
INCREASING CONSUMER SOPHISTICATION
Thousand RMB, 2005, percent CAGRPercent, 10-25
Necessities Semi-necessities Discretionary
1010
1112
14
66
589
1011
11
1012
1110
937
29 24 20 18
13
14
3
26
20
95
21
Recreation, edu-cationand cultural
100% =
Personal items
18
5
5Housing and utility
Household product
Health care
Transportation, communication
2025
Food
Apparel
73
20
15
52
16
5
5
14
4
2005
5
18
15
2010
36
16
6.8
3.3
6.9
8.8
McKinsey & Company 9| 9
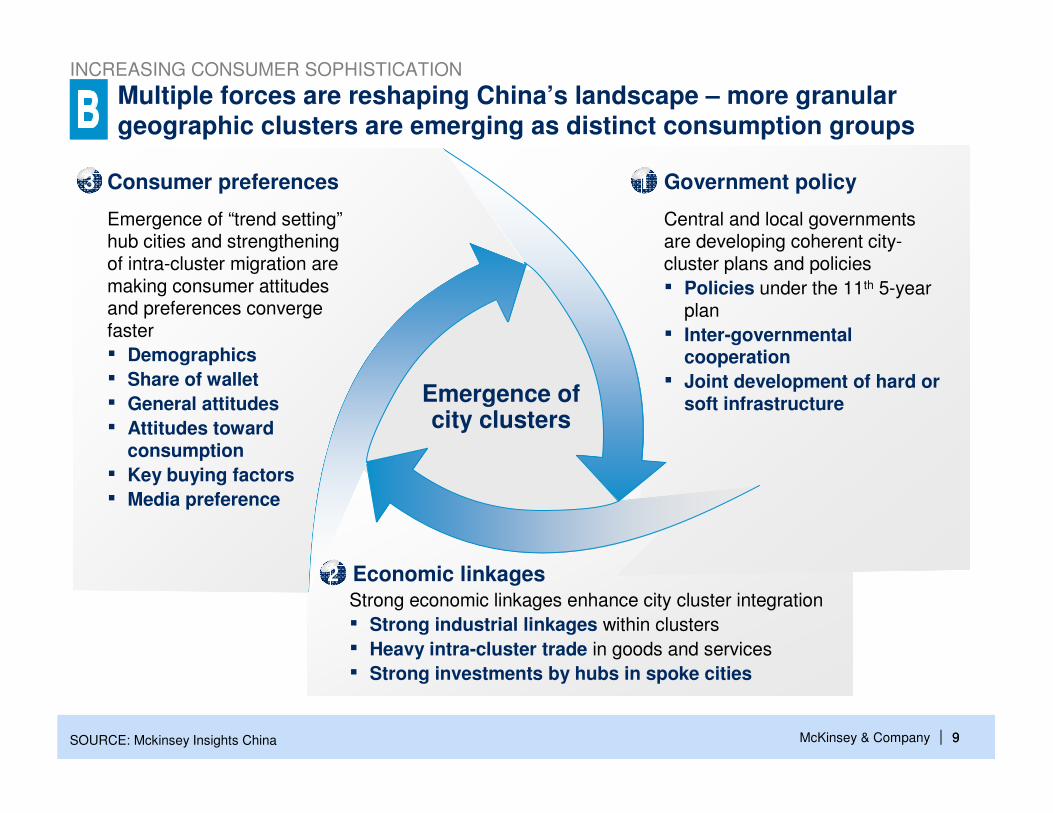
Multiple forces are reshaping China’s landscape – more granular geographic clusters are emerging as distinct consumption groups
Central and local governments are developing coherent city-cluster plans and policies
▪ Policies under the 11th 5-year plan
▪ Inter-governmental cooperation
▪ Joint development of hard or soft infrastructure
Strong economic linkages enhance city cluster integration
▪ Strong industrial linkages within clusters
▪ Heavy intra-cluster trade in goods and services
▪ Strong investments by hubs in spoke cities
Emergence of “trend setting”hub cities and strengthening of intra-cluster migration are making consumer attitudes and preferences converge faster
▪ Demographics
▪ Share of wallet
▪ General attitudes
▪ Attitudes toward consumption
▪ Key buying factors
▪ Media preference
Emergence of city clusters
Government policy
Economic linkages
Consumer preferences 13
2
SOURCE: Mckinsey Insights China
INCREASING CONSUMER SOPHISTICATION

McKinsey & Company 10|
xx (xx)
xx% | xx%
Cluster name # of cities
Cluster GDP & Hub city GDP
Large MegaSmall
22 is not a magic number! Each
company should tailor clusters to meet its
unique requirements
重庆重庆重庆重庆Chongqing
Chongqing (15)
2.3% | 1.5%
南宁南宁南宁南宁Nanning
Nanning (28)
1.8% | 0.3%
昆明昆明昆明昆明Kunming
Kunming (15)
1.0% | 0.5%
呼和浩特呼和浩特呼和浩特呼和浩特Huhehaote
Huhehaote (10)
1.3% | 0.4%
杭州杭州杭州杭州Hangzhou
Hangzhou (35)
6.6% | 1.6%
长春长春长春长春Changchun
哈尔滨哈尔滨哈尔滨哈尔滨Haerbin Changchun-Haerbin (36)
3.6 | 1.6%
南昌南昌南昌南昌Nanchang
Nanchang (21)
1.7% | 0.6%深圳深圳深圳深圳Shenzhen
Shenzhen (2)
4.3% |2.9%
大连大连大连大连Dalian
沈阳沈阳沈阳沈阳Shenyang
Liao central south (30)
4.3% | 2.4%
西̀安西安西安西安Xian
Guanzhong (15)
1.9% | 1.2%
Taiyuan (19)
1.4% | 0.5%
太原太原太原太原Taiyuan
Central (39)
3.6% | 0.7%
郑州郑州郑州郑州Zhengzhou
Chengdu (25)
2.7% | 1.6% 成都成都成都成都Chengdu
Hefei (29)
2.8% | 0.8% 合肥合肥合肥合肥Hefei
Yangzi mid-lower (42)
4.1% | 1.8%Changzhutan (29)
2.2% | 0.8%
长沙长沙长沙长沙Changsha
Coast West (38)
3.9 | 1.4%
福州福州福州福州Fuzhou厦门厦门厦门厦门
Xiamen
Jingjinji (37)
10.8% | 8.5%北京北京北京北京Beijing天津天津天津天津
Tianjin
石家庄石家庄石家庄石家庄Shijiazhuang
Shandong byland (67)
9.0% | 2.1%青岛青岛青岛青岛Qingdao济南济南济南济南
Jinan
Nanjing (28)
5.5% | 1.8%南京南京南京南京Nanjing
Shanghai (19)
10.1% | 6.2%上海上海上海上海Shanghai
Guangzhou (28)
6.9% | 2.6%
广州广州广州广州Guangzhou
武汉武汉武汉武汉Wuhan
We divided China into 22 city clusters accountingfor 92% of China’s GDP
SOURCE: Mckinsey Insights China
INCREASING CONSUMER SOPHISTICATION
McKinsey & Company 11|
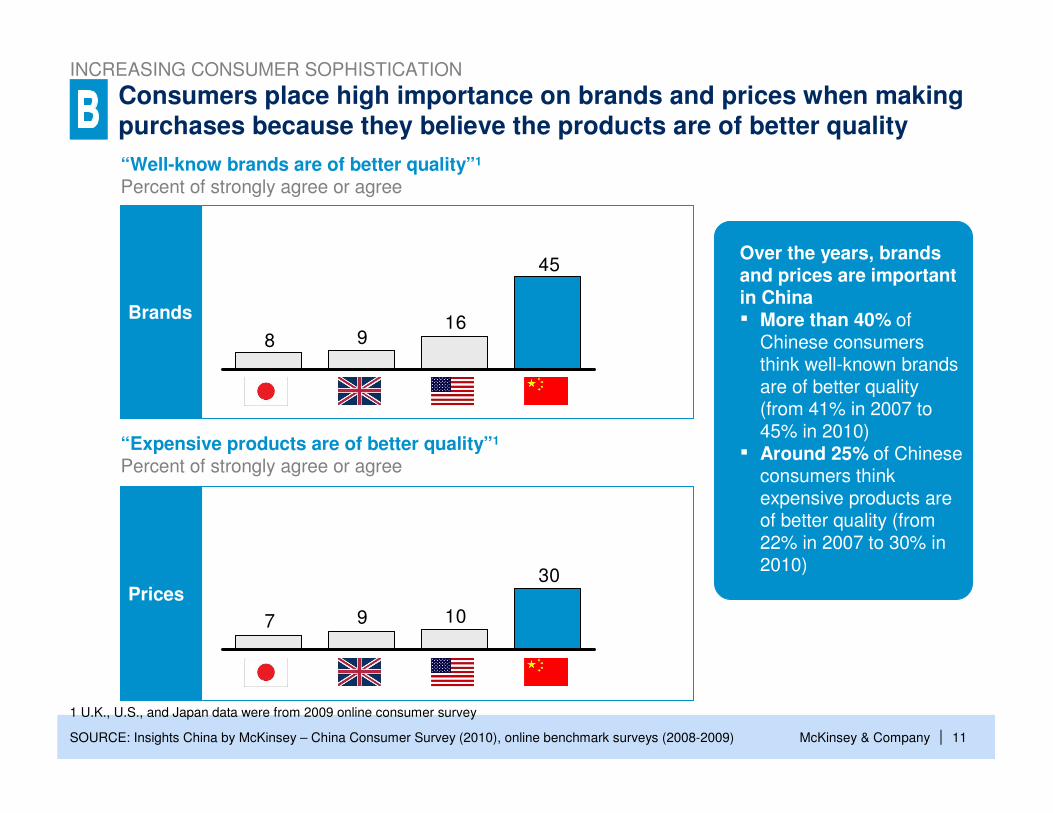
Consumers place high importance on brands and prices when makingpurchases because they believe the products are of better quality
“Well-know brands are of better quality”1
Percent of strongly agree or agree
“Expensive products are of better quality”1
Percent of strongly agree or agree
Brands
Prices
45
1698
30
1097
SOURCE: Insights China by McKinsey – China Consumer Survey (2010), online benchmark surveys (2008-2009)
1 U.K., U.S., and Japan data were from 2009 online consumer survey
Over the years, brands and prices are important in China▪ More than 40% of
Chinese consumers think well-known brands are of better quality (from 41% in 2007 to 45% in 2010)
▪ Around 25% of Chinese consumers think expensive products are of better quality (from 22% in 2007 to 30% in 2010)
INCREASING CONSUMER SOPHISTICATION

McKinsey & Company 12|
However, single brand loyalty is declining rapidly
SOURCE: McKinsey Insights China – 2007-2010 China consumer surveys
1 Weighted average of 5 F&B (UHT/fresh milk, yogurt, chocolate, beer, and carbonated soft drink)
2 Among respondents who claim to consider a few brands and decide which one to buy in the store or consider a few brands but are open to others if it is
on promotions in the store 3 Weighted average of 17 F&B 4 Weighted average of 13 HPC products 5 Weighted average of 7 CE products
1821
2927
44
48
4646
3626
20 24
53Always buy the best deal
Consider a few brandsbut are open to othersif they are on sale
Consider a few brandsand decide among theconsideration set
Only buy the preferred brand
2010
3
20092008
5
2007
Percent of respondents
Decreasing brand loyalty but increasing consideration from a repertoire of brands
F&B CATEGORY EXAMPLE1
Brand loyalty
Repertoire of brands
INCREASING CONSUMER SOPHISTICATION

McKinsey & Company 13|
Laptop exampleHome/ personal care example1
Purchase decisions are now increasingly influenced by “emotional” considerations – Comparison vs. US and UK
SOURCE: McKinsey Insights China – Annual Chinese Consumer Studies (2008, 2010); Online benchmark survey (2008)
12
434
15
36
14
105
2125
U.K. (2008)
U.S.(2008)
China (2010)
China (2008)
1 Facial moisturizer data for “status” and “what fits me”; laundry detergent data for “family”
2 Purchasing this brand can show my status
3 Using this brand makes me feel like my family is better off
4 It is a brand for people like me
Status2
Family3
What fits me4
10
122
6244
106
1115
China (2010)
China (2008)
U.K. (2008)
U.S.(2008)
INCREASING CONSUMER SOPHISTICATION

McKinsey & Company 14|
As consumers get more sophisticated, importance of Package Design is getting increasingly important over the years for FMCG categories
Importance of “Attractive Packaging Design”(percent)
SOURCE: Source
INCREASING CONSUMER SOPHISTICATION
16
12
2010
2008
Yogurt
24
9
Beer
24
17
30
23
ChocolateCarbonatedSoft Drink
20
14
Facial Moisturizer
21
16
Haircare

McKinsey & Company 15|
Presentation Outline
Role of Internet in lifestyle & consumption
Increasing consumer sophistication
▪ Continued shift towards discretionary spend categories
▪ City-tiers no longer the best business opportunity framework in China; city-clusters more effective & efficient
▪ Brands remain important, but loyalty is falling; moreover loyalty is largely to a suite of brands rather than a single brand
▪ While some consumers are upgrading, a majority are “trading-off”to manage their share of wallet
Chinese market & consumers
Continued macroeconomic resilience
▪ Macroeconomic fundamentals remain strong
▪ Continued drive towards urbanization results in majority of economic activity to be concentrated in urban centers
▪ The explosive growth of internet is causing significant shifts in lifestyles, research process and purchase channels in China & India
▪ Consumers are turning into “smart-shoppers” at accelerated pace
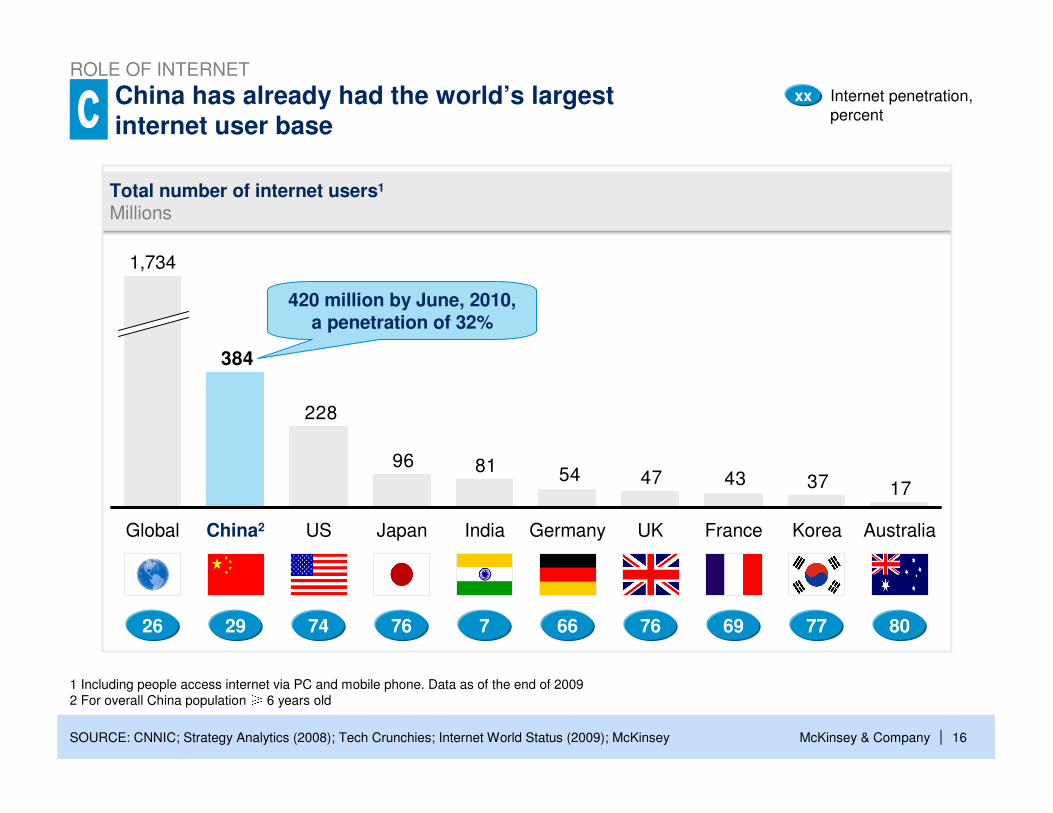
McKinsey & Company 16|SOURCE: CNNIC; Strategy Analytics (2008); Tech Crunchies; Internet World Status (2009); McKinsey
Total number of internet users1
Millions
17374347548196
228
384
AustraliaKoreaFranceUKGermanyIndiaJapanUSChina2Global
1,734
26 29 74 76 7 66 76 69 77 80
1 Including people access internet via PC and mobile phone. Data as of the end of 2009
2 For overall China population ≥ 6 years old
China has already had the world’s largest internet user base
Internet penetration,
percent
xx
420 million by June, 2010, a penetration of 32%
ROLE OF INTERNET
McKinsey & Company 17|
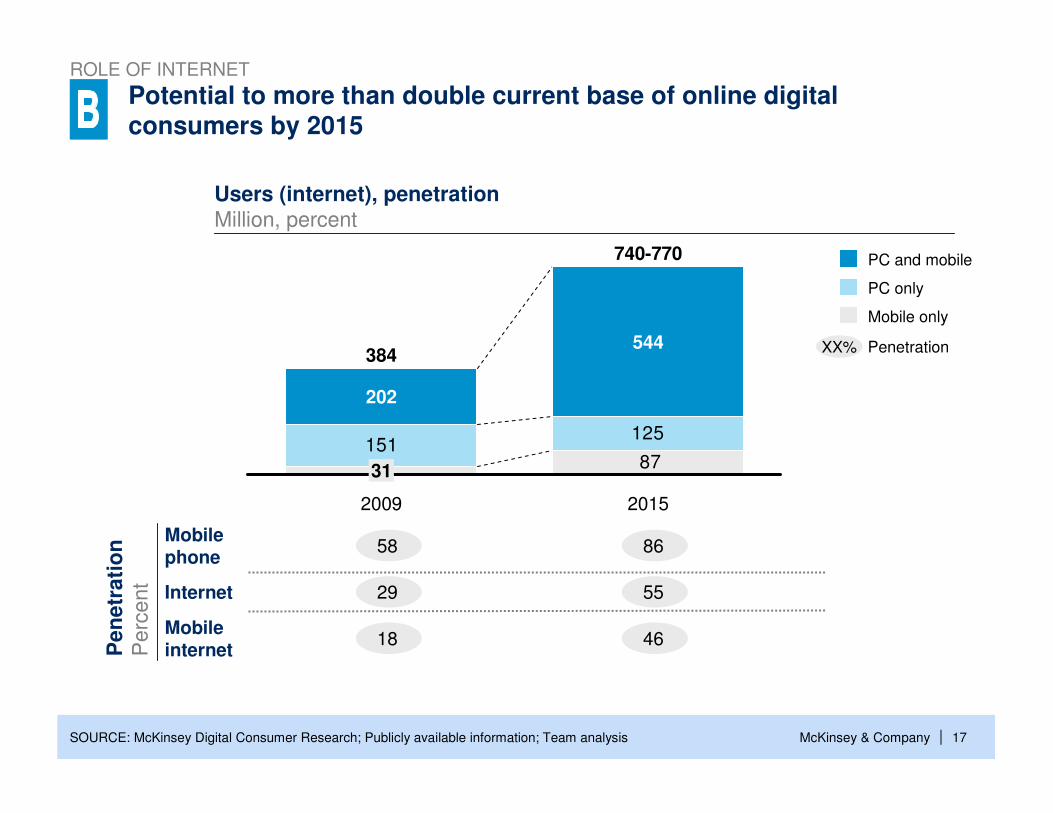
Potential to more than double current base of online digital consumers by 2015
Users (internet), penetrationMillion, percent
SOURCE: McKinsey Digital Consumer Research; Publicly available information; Team analysis
15187
125
2015
740-770
544
2009
384
31
202
29 55Internet
18 46Mobile internet
58 86Mobile phone
Pe
ne
tra
tio
nP
erc
en
t
XX% Penetration
Mobile only
PC only
PC and mobile
ROLE OF INTERNET
McKinsey & Company 18|
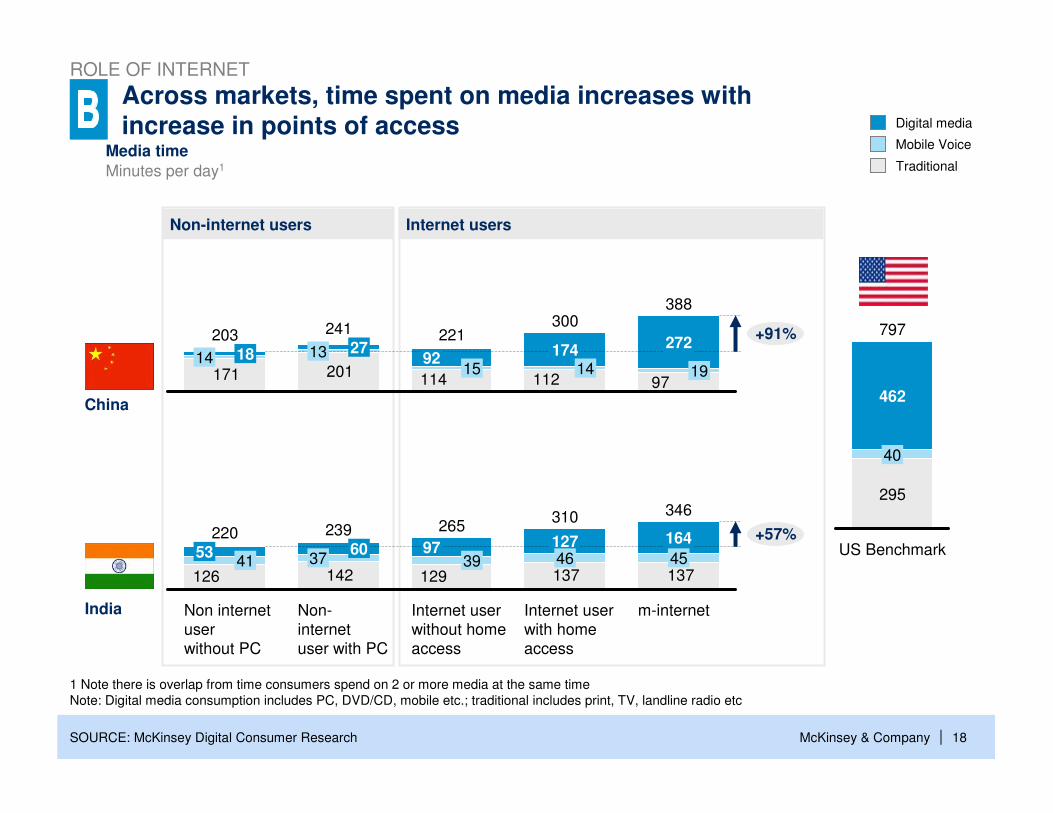
Across markets, time spent on media increases withincrease in points of access
Traditional
Mobile Voice
Digital media
97112114201171
388
19
272
300
14174
221
1592
241
13 27203
14 18
+91%
US Benchmark
797
295
40
462
SOURCE: McKinsey Digital Consumer Research
1 Note there is overlap from time consumers spend on 2 or more media at the same time
Note: Digital media consumption includes PC, DVD/CD, mobile etc.; traditional includes print, TV, landline radio etc
137137129142126
346
m-internet
45
164
Internet user
with home
access
310
46127
Internet user
without home
access
265
3997
Non-
internet
user with PC
239
3760
Non internet
user
without PC
220
4153
+57%
Non-internet users Internet users
India
China
Media time
Minutes per day1
ROLE OF INTERNET

McKinsey & Company 19|
“Have you surfed the internet in the past 6 months?”
While internet penetration in China is largely dependenton age …
URBAN CHINA
1 Among age 15-65
2 Weighted average of absolute deviation in each group from mean, sample size as weighting
SOURCE: Insights China by McKinsey – China Consumer Survey (2010)
Internet penetration clearly differs by agePercent of respondents (N = 13,271)
In fact, age is the most significant differentiator%; Weighted average deviation from mean2
11
20
47
76
91
Average internet
penetration rate: 531
55-65
45-54
35-44
25-34
18-24
2
4
9
11
26
Gender
Tier
Cluster
Income
Age
ROLE OF INTERNET

McKinsey & Company 20|
“How many hours do you spend on the Internet each week for personal reasons?”
URBAN CHINA
Time online does not differ much by ageAverage hours per week among internet
users (N = 7,079)
In fact, usage time is also similar across others macro-demographics%; Weighted average deviation from mean2
17
16
17
19
21
Average time
online: 191
55-65
45-54
35-44
25-34
18-24
3
5
4
Gender
Tier
Cluster 12
Income
Age 11
… once online, the amount of time people spent on internet doesn’t differ much by demographics
SOURCE: Insights China by McKinsey – China Consumer Survey (2010)
1 Among age 15-65
2 Weighted average of absolute deviation in each group from mean, sample size as weighting
ROLE OF INTERNET

McKinsey & Company 21|
“Before purchasing new products, I always check the Internet for other people's
usage experience/comments/feedback”
2010 25
2008 16
Total
45
N/A
Automotive
27
23
20
12
ApparelConsumerElectronics
19
14
Home/ Personal Care
▪ The proportion of consumers checking online for product information before purchasing is growing steadily over past 2 years
▪ This trend is especially strong for high value & high involvement categories
When in the market to make a purchase, Chinese consumers are increasingly using social media for checking product information
20
12
Food & Beverages
SOURCE: Insights China by McKinsey – China Consumer Survey (2010)
Percent of internet users who choose “strongly agree” or “agree” (N = 7,079)
ROLE OF INTERNET

McKinsey & Company 22|
In Summary…
Role of Internet in lifestyle & consumption
Increasing consumer sophistication
▪ Continued shift towards discretionary spend categories
▪ City-tiers no longer the best business opportunity framework in China; city-clusters more effective & efficient
▪ Brands remain important, but loyalty is falling; moreover loyalty is largely to a suite of brands rather than a single brand
▪ While some consumers are upgrading, a majority are “trading-off”to manage their share of wallet
Chinese market & consumers
Continued macroeconomic resilience
▪ Macroeconomic fundamentals remain strong
▪ Continued drive towards urbanization results in majority of economic activity to be concentrated in urban centers
▪ The explosive growth of internet is causing significant shifts in lifestyles, research process and purchase channels in China & India
▪ Consumers are turning into “smart-shoppers” at accelerated pace