effects of climate change on water quality in the jucar
TRANSCRIPT

water
Article
Effects of Climate Change on Water Quality in the Jucar RiverBasin (Spain)
Gabriel Gómez-Martínez 1,2,* , Lorena Galiano 3 , Toni Rubio 3 , Carlos Prado-López 3, Darío Redolat 3,César Paradinas Blázquez 3 , Emma Gaitán 3, María Pedro-Monzonís 1, Sergio Ferriz-Sánchez 1,4,Miguel Añó Soto 1,4, Robert Monjo 3,5 , Miguel Ángel Pérez-Martín 2 , Pura Almenar Llorens 1,4
and Javier Macián Cervera 1,4
�����������������
Citation: Gómez-Martínez, G.;
Galiano, L.; Rubio, T.; Prado-López,
C.; Redolat, D.; Paradinas Blázquez,
C.; Gaitán, E.; Pedro-Monzonís, M.;
Ferriz-Sánchez, S.; Añó Soto, M.; et al.
Effects of Climate Change on Water
Quality in the Jucar River Basin
(Spain). Water 2021, 13, 2424.
https://doi.org/10.3390/w13172424
Academic Editor: Bommanna
Krishnappan
Received: 26 July 2021
Accepted: 30 August 2021
Published: 3 September 2021
Publisher’s Note: MDPI stays neutral
with regard to jurisdictional claims in
published maps and institutional affil-
iations.
Copyright: © 2021 by the authors.
Licensee MDPI, Basel, Switzerland.
This article is an open access article
distributed under the terms and
conditions of the Creative Commons
Attribution (CC BY) license (https://
creativecommons.org/licenses/by/
4.0/).
1 Global Omnium-Aguas de Valencia S.A., Gran Vía Marqués del Túria, 19, 46005 València, Spain;[email protected] (M.P.-M.); [email protected] (S.F.-S.);[email protected] (M.A.S.); [email protected] (P.A.L.);[email protected] (J.M.C.)
2 IIAMA—Instituto de Ingeniería del Agua y Medio Ambiente, Universitat Politècnica de València,Camino de Vera s/n, 46022 València, Spain; [email protected]
3 Climate Research Foundation, C/Gran Vía 22, 7◦ dcha, 28040 Madrid, Spain; [email protected] (L.G.);[email protected] (T.R.); [email protected] (C.P.-L.); [email protected] (D.R.); [email protected] (C.P.B.);[email protected] (E.G.); [email protected] (R.M.)
4 Empresa Mixta Valenciana de Aguas, S.A., (EMIVASA) Reino de Valencia n◦ 28, 46005 València, Spain5 Department of Algebra, Geometry and Topology, Complutense University of Madrid, Plaza de Ciencias 3,
Ciudad Universitaria, 28040 Madrid, Spain* Correspondence: [email protected] or [email protected]
Abstract: The Mediterranean region is a climate change hotspot, especially concerning issues ofhydrological planning and urban water supply systems. In this context, the Jucar River Basin (Spain)presents an increase of frequency, intensity and duration of extreme meteorological phenomena, suchas torrential rains, droughts or heat waves, which directly affect the quantity and quality of rawwater available for drinking. This paper aims to analyze the effects of climate change on the rawwater quality of the Jucar River Basin District, which mainly supplies the city of Valencia and itsmetropolitan area, in order to adapt drinking water treatments to new conditions and opportunities.For this purpose, we used observed data of water quality parameters from four stations and climatedrivers from seven Earth system models of the latest Coupled Model Intercomparison Project—Phase6. To model water quality (turbidity and conductivity) in the past and future scenarios, this studyemploys a backward stepwise regression taking into account daily values of mean temperature,maximum temperature, total rainfall and minimum and maximum relative humidity. Resultsshowed that the model performance of the water quality simulation is more adequate for shortmoving-average windows (about 2–7 days) for turbidity and longer windows (about 30–60 days)for conductivity. Concerning the future scenarios, the most significant change was found in theprojected increase of conductivity for the station of the Júcar river, between 4 and 11% by 2100,respectively, under the medium (SSP2–4.5) and pessimistic (SSP5–8.5) emission scenarios. The jointuse of these types of management and monitoring tools may help the managers in charge of carryingout the different water treatments needed to apply a better plan to raw water and may help themidentify future threats and investment needs to adapt the urban water supply systems to the changingconditions of raw water, such as turbidity or conductivity, as a consequence of climate change.
Keywords: urban water supply; climate change; resilience; water treatment; water quality
1. Introduction
Traditionally, urban growth has been accompanied by the search for new waterresources to meet drinking water needs in new settlements. These additional volumescould come from conventional resources (either by increasing the exploitation of surface
Water 2021, 13, 2424. https://doi.org/10.3390/w13172424 https://www.mdpi.com/journal/water
Water 2021, 13, 2424 2 of 17
and groundwater) or from unconventional resources (by resorting to water transfers fromother basins or the desalination of seawater). For this reason, it is necessary to promotethe use of integrated resources management and the use of decision making-tools andsimulation models, for a better management under uncertainty scenarios and more resilientresources allocation [1–4].
Many regions in the world suffer from structural water stress and scarcity problemswhen managing and allocating water resources. Regions such as those localized in theMediterranean area, such as the city of Valencia and its metropolitan area, can be consideredas an example of this situation [5–9].
Problems linked to water scarcity and droughts have been getting worse during thelast decades because of the effects of climate change, which have increased their magnitudeand frequency [10]. In Mediterranean regions, such as the Jucar River Basin District, wherethe city of Valencia is located, the effects of climate change over water scarcity and thereduction of water resources availability are definitely being exacerbated [11] and theyhave been assessed in a range going from 8 to 28% of flow reduction by the end of thecentury [12–14].
Moreover, numerous studies have also found an influence of climate on water qual-ity [15–20], which is of great importance for ecosystems and societies, as many sectors(e.g., human health, industry, water supply and sanitation, or tourism) depend on waterresources and their availability in good condition. However, the quality of surface andgroundwater has generally declined in recent decades as a consequence of the growthof agricultural and industrial activities, coupled with changes in hydrological regimesassociated with climate change having important socio-economic impacts [21,22].
Water quality in freshwater systems is the result of a delicate and complex interactionof climatic variability and hydrological, biogeochemical and anthropogenic influencesoperating at different temporal and spatial scales [16]. It is therefore difficult to clearlypinpoint the role of climate. Water pollution is directly related to human activities of urban,industrial and agricultural origin (as well as land use changes). On the other hand, climatechange could lead to the degradation of surface water quality as an indirect consequence ofthese activities, mainly through increased temperatures and changing precipitation patterns.In association with heavy rainfall events, nutrient runoff from croplands is triggered andincreasingly warm temperatures accelerate the growth of bacteria and phytoplankton.Floods and droughts also change water quality through direct dilution or concentrationeffects of dissolved substances [15–17,21].
Taking into account the current and projected climate change scenarios, it is necessaryto incorporate information on climate-related risks and impacts into operational and strate-gic decision-making processes in order to reduce the deterioration of water quality [20,23].This is a major effort, as it is necessary to assess specific climatic conditions and the extentto which they are capable of modifying water quality, while taking into account land useand management, population distribution and other factors [17]. Along this line, numerousstudies have confirmed that temperature and precipitation have important effects on waterquality (e.g., [19]) and are used as climate predictors with lag times, using their predictivecharacter. Even so, it should be considered that depending on the location and the river fea-ture in question, the climatic influence may be changing, and may include other variablesin addition to those mentioned.
In general terms, significant modifications of local and global climate patterns areprojected at very different time scales, especially affecting temperature and rainfall, eitherin terms of average values or in terms of the frequency, intensity or duration of extremeevents [24,25]. The impacts caused by these extreme phenomena directly affect water bodies(both, surface water and groundwater) and as a consequence, the quantity and quality ofraw water available for drinking water [13,26,27]. Moreover, it should be highlighted thatthe Mediterranean region is a hotspot for changes in the hydrological cycle, especially forthe winter rainfall regimes [28].

Water 2021, 13, 2424 3 of 17
For the Mediterranean region, some of the most consensual effects of climate changeon water resources are, on the one hand, a considerable decrease over water availabilityand incomes, produced by reduction in precipitation patterns and changes in hydrologicaltemporal distribution and, on the other hand, a progressive rise of average temperaturesthat increments the potential evapotranspiration [12,27]. These impacts also indirectlyaffect water resources treatments, so in the case of necessary treatments carried out atdrinking water treatment plants (DWTPs), adjustments are needed to maintain waterquality standards and requirements. Therefore, the impact of some parameters, for instance,water temperature, play an important role in these necessary modifications in watertreatment to ensure the process’ resilience [29].
Officially, the adaptation planning in Spain is supported by the Exchange of Infor-mation on Adaptation to the Climate Change (AdapteCCa) platform [30]. However, itsapplication scale is regional because the spatial resolution of the outputs is approximately11 km × 11 km. Moreover, it does not currently consider the latest climate projections ofthe Coupled Model Intercomparison Project—Phase 6 (CMIP6) but it is based on CMIP5model outputs. Therefore, it is necessary to consider local climate scenarios by usingCMIP6 outputs.
For this purpose, the European project named Climate Risk Information for Support-Ing ADAptation Planning and Operation—Phase II (CRISI-ADAPT-II) was co-designed toanalyze climate change effects in several pilot cases of the Mediterranean region. In thecase of the city of Valencia, CRISI-ADAPT-II was focused on climate change’s impact onwater quality. CRISI-ADAPTII developed local climate scenarios by using CMIP6 outputsdownscaled at a 1 km × 1 km resolution grid.
Using these scenarios, the main objective of this study is to analyze the impact ofclimate change on water quality in the city of Valencia in order to increase the resilience ofurban supplies according to these impacts on water resources. Thus, the paper shows howseveral parameters conditioning water quality, such as turbidity and conductivity, behave,analyzing its evolution and providing probable future scenarios, by the use of statisticaldecision-making tools, in order to improve the Valencia water supply system’s resilienceand better plan future actions and investments.
2. Application Scope2.1. Study Area
The Júcar River Basin and Túria River Basin are two of the nine water exploitationsystems in the Júcar River Basin District, which is located in the eastern part of the IberianPeninsula, both flowing into the Mediterranean Sea. The Júcar River Basin is the preeminentwater exploitation system considering its size (22,186 km2) and the volume of waterresources (1244.8 hm3/year). In second position, the Túria River Basin has a length of6393 km2 and the volume of water resources rises to 401.4 hm3/year.
Both rivers symbolize an example of a typical Mediterranean river [31], characterizedby mild winters and warm summers, with an average precipitation of 475.2 mm/year anda potential evapotranspiration of 926.6 mm/year [32]. The mean temperatures are about14 and 16.5 ◦C, being the maximum degrees reached during the dry season (months of Julyand August). Moreover, the phenomenon called “gota fría” (a cold front with intense andshort-term precipitations) may occur.
The supply system of the city of Valencia and its metropolitan area represents themain urban water supply in the Júcar River Basin District, along with the Sagunto andAlbacete urban supplies. The Valencian case currently serves almost 1.5 million inhabitants,in an area of intense economic activity, which requires reinforcing the reliability of bothsupply and water quality.
The urban supply comes from two drinking water treatment plants (DWTP) located inthe municipalities of Manises (La Presa) and Picassent (El Realón), with nominal treatmentcapacities of 3.4 and 3.0 m3/s, respectively.

Water 2021, 13, 2424 4 of 17
The La Presa DWTP can provide raw water from the Túria River, from the Júcar–Túria transfer channel (CJT) and from the wells located in the facility itself, having threealternative supply sources. On the other hand, the El Realón DWTP captures the raw wateronly from the CJT. This channel begins at the Tous reservoir and water flows from the JúcarRiver to the Túria River. From the point of view of service coverage, both facilities areworking, on average, at around 50% of their nominal capacity.
The supply of the city of Valencia and its metropolitan area presents mainly two keyissues: the quality of the water at the point of intake of the DWTP and the vulnerabilityof the supply system (Figure 1). At certain times of the year, the water quality might becompromised due to the fact that, as an open channel, the risk of uncontrolled dischargesinto the channel itself and the entry of surface water run-off affects the treatments thatmust be carried out in order to obtain adequate water quality. Regarding the vulnerabilityof the system, the possibility of a failure in the CJT would affect the supply of thousandsof users.
Water 2021, 13, x FOR PEER REVIEW 4 of 19
The La Presa DWTP can provide raw water from the Túria River, from the Júcar–Túria transfer channel (CJT) and from the wells located in the facility itself, having three alternative supply sources. On the other hand, the El Realón DWTP captures the raw wa-ter only from the CJT. This channel begins at the Tous reservoir and water flows from the Júcar River to the Túria River. From the point of view of service coverage, both facilities are working, on average, at around 50% of their nominal capacity.
The supply of the city of Valencia and its metropolitan area presents mainly two key issues: the quality of the water at the point of intake of the DWTP and the vulnerability of the supply system (Figure 1). At certain times of the year, the water quality might be com-promised due to the fact that, as an open channel, the risk of uncontrolled discharges into the channel itself and the entry of surface water run-off affects the treatments that must be carried out in order to obtain adequate water quality. Regarding the vulnerability of the system, the possibility of a failure in the CJT would affect the supply of thousands of users.
Figure 1. Main vulnerabilities and location of DWTP for the supply of the city of Valencia and its metropolitan area.
Furthermore, the intake of the La Presa DWTP is located downstream of the natural mouth of the ravine called Barranc de Mandor. In 1991, the non-pluvial flows collected by this channel were directed downstream of the intake of the DWTP. This passage collects the effluents from two WWTPs and in times of intense rains, the channel is insufficient and the rain and waste flows overflow upstream of the intake of the DWTP, affecting the intake of raw water from a quantitative, qualitative and environmental point of view. Having three alternative supply sources avoids the stoppage of the DWTP.
As noted, the El Realón DWTP has its intake in the Júcar–Túria channel. This channel transports good quality water from the Tous reservoir, but because it is an uncovered course there is a risk of uncontrolled discharges and runoff. This is due to the rains that generate specific events of water with toxic substances and that require the plant to stop. The effects related to the quantity are conditioned by the shared use of this canal, since the use of irrigation greatly hinders the normal work of maintenance of this critical infra-structure. In addition to conveniently ensuring supply reliability, it is convenient to have a more flexible system in terms of contributions from both the Júcar and the Túria in the two existing DWTPs.
Regarding the drinking water treatment system, it consists of a physical-chemical and microbiological nature, basically adapted to compliance with current regulations and
Figure 1. Main vulnerabilities and location of DWTP for the supply of the city of Valencia and itsmetropolitan area.
Furthermore, the intake of the La Presa DWTP is located downstream of the naturalmouth of the ravine called Barranc de Mandor. In 1991, the non-pluvial flows collected bythis channel were directed downstream of the intake of the DWTP. This passage collectsthe effluents from two WWTPs and in times of intense rains, the channel is insufficient andthe rain and waste flows overflow upstream of the intake of the DWTP, affecting the intakeof raw water from a quantitative, qualitative and environmental point of view. Havingthree alternative supply sources avoids the stoppage of the DWTP.
As noted, the El Realón DWTP has its intake in the Júcar–Túria channel. This channeltransports good quality water from the Tous reservoir, but because it is an uncovered coursethere is a risk of uncontrolled discharges and runoff. This is due to the rains that generatespecific events of water with toxic substances and that require the plant to stop. The effectsrelated to the quantity are conditioned by the shared use of this canal, since the use ofirrigation greatly hinders the normal work of maintenance of this critical infrastructure.In addition to conveniently ensuring supply reliability, it is convenient to have a moreflexible system in terms of contributions from both the Júcar and the Túria in the twoexisting DWTPs.
Regarding the drinking water treatment system, it consists of a physical-chemicaland microbiological nature, basically adapted to compliance with current regulations andthe raw water quality conditions observed to date. In both cases, these are conventional
Water 2021, 13, 2424 5 of 17
treatment plants with a basic line made up of a pretreatment (roughing and pre-oxidation);clarification (coagulation–flocculation–decantation); filtration and a final disinfection.
If we consider the advent of emerging and complex pollutants, the growing demandfrom health authorities and the limitations they impose on the use of chlorinated compo-nents, together with the pressure from society to improve the quality required beyondwater drinkable in terms of its organoleptic perception, it is very possible that in the futureit will be necessary to rethink current treatment systems.
2.2. Materials and Methods
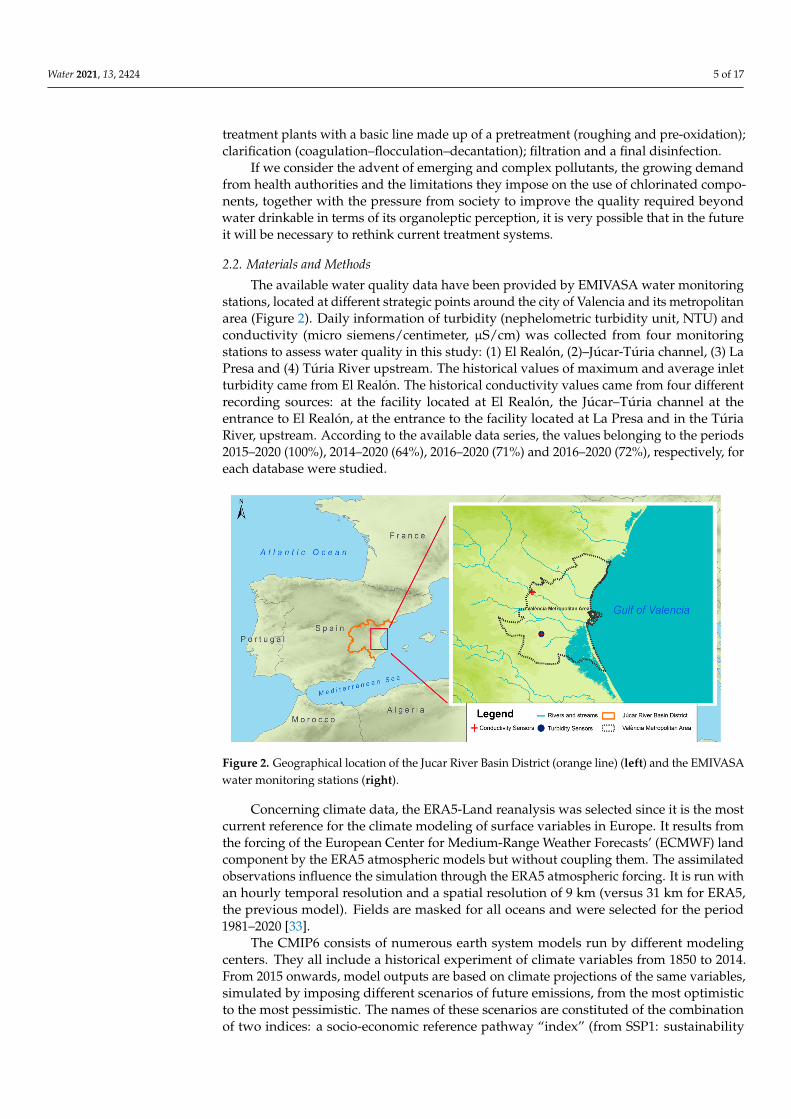
The available water quality data have been provided by EMIVASA water monitoringstations, located at different strategic points around the city of Valencia and its metropolitanarea (Figure 2). Daily information of turbidity (nephelometric turbidity unit, NTU) andconductivity (micro siemens/centimeter, µS/cm) was collected from four monitoringstations to assess water quality in this study: (1) El Realón, (2)–Júcar-Túria channel, (3) LaPresa and (4) Túria River upstream. The historical values of maximum and average inletturbidity came from El Realón. The historical conductivity values came from four differentrecording sources: at the facility located at El Realón, the Júcar–Túria channel at theentrance to El Realón, at the entrance to the facility located at La Presa and in the TúriaRiver, upstream. According to the available data series, the values belonging to the periods2015–2020 (100%), 2014–2020 (64%), 2016–2020 (71%) and 2016–2020 (72%), respectively, foreach database were studied.
Water 2021, 13, x FOR PEER REVIEW 5 of 19
the raw water quality conditions observed to date. In both cases, these are conventional treatment plants with a basic line made up of a pretreatment (roughing and pre-oxida-tion); clarification (coagulation–flocculation–decantation); filtration and a final disinfec-tion.
If we consider the advent of emerging and complex pollutants, the growing demand from health authorities and the limitations they impose on the use of chlorinated compo-nents, together with the pressure from society to improve the quality required beyond water drinkable in terms of its organoleptic perception, it is very possible that in the future it will be necessary to rethink current treatment systems.
2.2. Materials and Methods The available water quality data have been provided by EMIVASA water monitoring
stations, located at different strategic points around the city of Valencia and its metropol-itan area (Figure 2). Daily information of turbidity (nephelometric turbidity unit, NTU) and conductivity (micro siemens/centimeter, μS/cm) was collected from four monitoring stations to assess water quality in this study: (1) El Realón, (2)–Júcar-Túria channel, (3) La Presa and (4) Túria River upstream. The historical values of maximum and average inlet turbidity came from El Realón. The historical conductivity values came from four different recording sources: at the facility located at El Realón, the Júcar–Túria channel at the en-trance to El Realón, at the entrance to the facility located at La Presa and in the Túria River, upstream. According to the available data series, the values belonging to the periods 2015–2020 (100%), 2014–2020 (64%), 2016–2020 (71%) and 2016–2020 (72%), respectively, for each database were studied.
Figure 2. Geographical location of the Jucar River Basin District (orange line) (left) and the EMI-VASA water monitoring stations (right).
Concerning climate data, the ERA5-Land reanalysis was selected since it is the most current reference for the climate modeling of surface variables in Europe. It results from the forcing of the European Center for Medium-Range Weather Forecasts’ (ECMWF) land component by the ERA5 atmospheric models but without coupling them. The assimilated observations influence the simulation through the ERA5 atmospheric forcing. It is run with an hourly temporal resolution and a spatial resolution of 9 km (versus 31 km for ERA5, the previous model). Fields are masked for all oceans and were selected for the period 1981–2020 [33].
The CMIP6 consists of numerous earth system models run by different modeling centers. They all include a historical experiment of climate variables from 1850 to 2014. From 2015 onwards, model outputs are based on climate projections of the same variables, simulated by imposing different scenarios of future emissions, from the most optimistic
Figure 2. Geographical location of the Jucar River Basin District (orange line) (left) and the EMIVASAwater monitoring stations (right).
Concerning climate data, the ERA5-Land reanalysis was selected since it is the mostcurrent reference for the climate modeling of surface variables in Europe. It results fromthe forcing of the European Center for Medium-Range Weather Forecasts’ (ECMWF) landcomponent by the ERA5 atmospheric models but without coupling them. The assimilatedobservations influence the simulation through the ERA5 atmospheric forcing. It is run withan hourly temporal resolution and a spatial resolution of 9 km (versus 31 km for ERA5,the previous model). Fields are masked for all oceans and were selected for the period1981–2020 [33].
The CMIP6 consists of numerous earth system models run by different modelingcenters. They all include a historical experiment of climate variables from 1850 to 2014.From 2015 onwards, model outputs are based on climate projections of the same variables,simulated by imposing different scenarios of future emissions, from the most optimisticto the most pessimistic. The names of these scenarios are constituted of the combinationof two indices: a socio-economic reference pathway “index” (from SSP1: sustainability

Water 2021, 13, 2424 6 of 17
to SSP5: fossil-fueled development), and the radiative forcing level in 2100 (from 1.9 to8.5 W/m2) [34]. The CMIP6 models considered in this study are presented in Table A1 inAppendix A, as well as the centers and countries in which they have been developed andtheir spatial resolution. Both the ERA5-Land and CMIP6 climate databases were collectedfrom the Climate Data Store (CDS) provided by the Copernicus Climate Change Service(C3S). The climate models were selected according to the availability of daily data for thevariables used: mean/maximum temperature, total precipitation and minimum/maximumrelative humidity.
3. Water Quality Modeling
The inertia of climatic predictors in relation to water quality was considered as ahypothesis of this study. Thus, it aimed to relate variables associated with water quality,such as turbidity and conductivity, measured at EMIVASA water monitoring stations(Figure 2), with climatic variables from the ERA5-Land reanalysis in order to obtain futureprojections of these variables of water quality. The observed databases contained dailydata for turbidity, both maximum and average, and conductivity at different points in theprovince of Valencia, so the predictive climatic variables were considered on the same timescale. As mentioned above, the climatic influence on water quality can be variable, so allthe climatic variables that may have some influence on it were considered: average dailytemperature, maximum daily temperature, total daily rainfall, minimum daily relativehumidity and maximum daily relative humidity.
In order to find the predictor variables and time anticipation with which to predictthe behavior of the different water quality parameters in the different databases, severalconfigurations of multiple linear fits were proposed. In particular, prediction models werebased on daily predictor series lagged and smoothed by 2 to 90-day moving averages withpredictive character. The method used for the selection of the most suitable predictor cli-mate variables was the backward stepwise regression [35], a linear regression approach thatstarts with a full model and at each step gradually removes variables from the regressionmodel to find a reduced model that best explains the data (Figure 3). To avoid overfitting,these calculations were performed with detrended inputs by using the R programminglanguage [36]. The selection of the best model was performed according to the Akaikeinformation criterion (AIC) provided by the stepwise regression function [37,38].
Considering the results, the most appropriate models were selected for each waterquality variable in order to obtain future projections of these variables. Conductivity andturbidity series obtained by the selected CMIP6 models (M) were corrected with ERA5-Landoutputs (E) according to Gaussian and log-Gaussian transfer functions, respectively, i.e.:
Mcorr = E−mean(E)sd(E)sd(M) + mean(E)
Mcorr = exp{log(E)−mean(log(E))sd(log(E))sd(log(M)) + mean(log(E))}
where the log is the Neperian logarithm, while the sd function symbolizes standarddeviation. Mcorr states the corrected model outputs, which reduce systematic errors ofthe simulated water quality in terms of climatology (mean and standard deviation). Inthis way, three future periods were considered: 2021–2050, 2046–2075 and 2071–2100 andtwo future scenarios SSP2 4.5 (medium but generous scenario) and SSP5 8.5 (catastrophicscenario); for each combination of these, the increase of the variables with respect to theaverage conditions of the historical period 1981–2010 of the same model were obtained.Subsequently, these increases were taken and added to the average conditions of thehistorical period (1981–2010) for the ERA5-Land reanalysis. Thus, the corrected futurescenarios were finally obtained for each model and for each point of the ERA5-Land(Figure 3). Once this was done, the corrected future series were used to simulate the futureconditions of turbidity and conductivity values, using the ERA5-Land point closest to eachspecific observatory.

Water 2021, 13, 2424 7 of 17
Water 2021, 13, x FOR PEER REVIEW 7 of 19
Figure 3. General scheme of the methodologies used in this paper.
Considering the results, the most appropriate models were selected for each water quality variable in order to obtain future projections of these variables. Conductivity and turbidity series obtained by the selected CMIP6 models (M) were corrected with ERA5-Land outputs (E) according to Gaussian and log-Gaussian transfer functions, respectively, i.e.:
Mcorr = E-mean(E)sd(E)sd(M) + mean(E)
Mcorr = exp{log(E)-mean(log(E))sd(log(E))sd(log(M)) + mean(log(E))}
where the log is the Neperian logarithm, while the sd function symbolizes standard devi-ation. Mcorr states the corrected model outputs, which reduce systematic errors of the simulated water quality in terms of climatology (mean and standard deviation). In this way, three future periods were considered: 2021–2050, 2046–2075 and 2071–2100 and two future scenarios SSP2 4.5 (medium but generous scenario) and SSP5 8.5 (catastrophic sce-nario); for each combination of these, the increase of the variables with respect to the av-erage conditions of the historical period 1981–2010 of the same model were obtained. Sub-sequently, these increases were taken and added to the average conditions of the historical period (1981–2010) for the ERA5-Land reanalysis. Thus, the corrected future scenarios were finally obtained for each model and for each point of the ERA5-Land (Figure 3). Once this was done, the corrected future series were used to simulate the future conditions of turbidity and conductivity values, using the ERA5-Land point closest to each specific ob-servatory.
Statistical analysis of both model performance (training) and projection trends (re-sults) was applied according to the analysis of variance (ANOVA) [39]. Particularly, p-value of linear model coefficients indicates whether or not one can reject or accept the hypothesis (in our case, that predictors are not meaningful for the model). As commonly used, this paper sets p-value < 0.05 for a rejection of the “not meaningful predictor”, so it is probably an excellent contribution of explained variance of the variable modeled.
Figure 3. General scheme of the methodologies used in this paper.
Statistical analysis of both model performance (training) and projection trends (results)was applied according to the analysis of variance (ANOVA) [39]. Particularly, p-value oflinear model coefficients indicates whether or not one can reject or accept the hypothesis(in our case, that predictors are not meaningful for the model). As commonly used, thispaper sets p-value < 0.05 for a rejection of the “not meaningful predictor”, so it is probablyan excellent contribution of explained variance of the variable modeled.
4. Results4.1. Training and Validation of the Method
Taking into account the databases of observed values and past climatic values fromthe ERA5-Land reanalysis at the grid points closest to each observatory, the aim was tomodel for turbidity and conductivity considering exclusively climatic variables. The bestfits were found to be obtained by modeling the predictors using multiple linear regressionsbased on daily predictor series smoothed by 2–90 day moving averages.
The validity of the results is based on the p-values and Pearson correlation coefficient(R) obtained for each adjustment. While for turbidity values, better results are obtainedusing small period moving averages, for conductivity values there is a higher variability(see Appendix A). This higher variability may be associated with the different locationsof the observed conductivity databases used in the study. For the maximum and meanturbidity inlet values, the low correlation values obtained are interpreted as a minorcontribution to the variability of the series (variance explained by the model) comparedto other contributions of non-climatic origin (Figure 4). Despite this, the linear modelsshowed statistical significance, with the total p-value obtained being less than 10−6 inall cases, implying that there was an influence of climate on this water quality variable.The best fits were obtained for the 2-day and 7-day moving average predictor series,respectively (Table A2).

Water 2021, 13, 2424 8 of 17
Water 2021, 13, x FOR PEER REVIEW 9 of 19
Figure 4. Scatter plot of observed (NTU) versus simulated (NTU) values for the El Realón facility for (a) maximum inlet turbidity with simulated series obtained using 2-day moving average smoothed predictors; and (b) mean inlet turbidity with simulated series obtained using 7-day moving average smoothed predictors.
Figure 4. Scatter plot of observed (NTU) versus simulated (NTU) values for the El Realón facility for (a) maximum inletturbidity with simulated series obtained using 2-day moving average smoothed predictors; and (b) mean inlet turbiditywith simulated series obtained using 7-day moving average smoothed predictors.
Regarding the conductivity values (see Table A3), it should be noted that these con-ductivity values came from different databases and they have been extracted at differentlocations. It should also be taken into account that measured data series at the inlet pointof the La Presa DWTP facility may vary depending on the mixing of water from differentsources. In addition, it should be noted that all the observed series have missing data thathave been removed for analysis, so there was not a complete day-to-day continuity in theseries. Significantly higher linear-correlation values than for turbidity were obtained fromall the databases except for the upstream Túria river, which remained in the same order ofmagnitude but with slightly higher values. This implied that the climatic contribution ac-counted for a larger proportion of the variability in the series than in the variable analyzedabove (Figure 5). All models showed statistical significance, with the total p-value obtainedbeing less than 10−11 in all cases, confirming that there is an influence of climate on waterquality. However, the relationship is not perfectly linear and it accounted for less than 34%of the explained variability at best, therefore other contributions of non-climatic originmust be considered. For the conductivity measured at El Realón, the best fit resulted fromthe series of predictors smoothed by the 30-day moving average, although with 60-daysmoothing a practically equal value was obtained; for the conductivity measured in theJúcar–Túria channel at the entrance to El Realón, the best fit also resulted from the 30-daymoving average; for the conductivity measured at the entrance to La Presa, the best fitresulted from the 7-day moving average; finally, for the conductivity measured in theTúria River upstream, the best fit resulted from the 60-day moving average. These fitsrepresented a higher percentage of the variability of the variable under similar statisticalsignificance values.
4.2. Climate-Based Water Quality Scenarios
The future projections obtained for the different water quality variables are shown inFigures 6 and 7 for turbidity and conductivity, respectively, at the different observatoriesanalyzed. These figures correspond to the 5-year moving average of the annual averagesof the daily values obtained so that inter-annual variability and year-to-year variations donot interfere in the observation of the future evolution of the values, thus being able todistinguish more easily trends towards higher or lower values.

Water 2021, 13, 2424 9 of 17
Water 2021, 13, x FOR PEER REVIEW 9 of 19
Figure 4. Scatter plot of observed (NTU) versus simulated (NTU) values for the El Realón facility for (a) maximum inlet turbidity with simulated series obtained using 2-day moving average smoothed predictors; and (b) mean inlet turbidity with simulated series obtained using 7-day moving average smoothed predictors.
Figure 5. Scatter plot of observed (µS/cm) versus simulated (µS/cm) conductivity values for (a) ElRealón facility, (b) Júcar–Túria channel, (c) La Presa facility and (d) upstream Túria River. In each case,simulated series were obtained using 30-day, 30-day, 7-day and 60-day moving average smoothedpredictors respectively.
Water 2021, 13, x FOR PEER REVIEW 10 of 19
Figure 5. Scatter plot of observed (μS/cm) versus simulated (μS/cm) conductivity values for (a) El Realón facility, (b) Júcar–Túria channel, (c) La Presa facility and (d) upstream Túria River. In each case, simulated series were obtained using 30-day, 30-day, 7-day and 60-day moving average smoothed predictors respectively.
4.2. Climate-Based Water Quality Scenarios The future projections obtained for the different water quality variables are shown in
Figures 6 and 7 for turbidity and conductivity, respectively, at the different observatories analyzed. These figures correspond to the 5-year moving average of the annual averages of the daily values obtained so that inter-annual variability and year-to-year variations do not interfere in the observation of the future evolution of the values, thus being able to distinguish more easily trends towards higher or lower values.
In the simulations of turbidity values the CanESM5 model was not considered as it did not properly simulate the interannual variability (<50%). Regarding the results ob-tained, two different behaviors are observed (Figure 6). On the one hand, in terms of the 50th quantile of the six CMIP6 models analyzed, the maximum inlet turbidity would ex-perience a reduction of 0.3 NTU (21%) in the SSP2 4.5 scenario, and of 1.2 NTU (71%) in the SSP5 8.5 scenario, both by the end of the 21st century (Figure 6a). On the other hand, the mean inlet turbidity variable would experience an increase of 0.5 NTU (35.1%) in the SSP2 4.5 scenario and an increase of 0.5 NTU (35.1%) in the SSP5 8.5 scenario, again both by the end of the 21st century (Figure 6b). The limitations of the baseline models should not be forgotten, as they have Pearson correlation coefficients of 0.2 and 0.19 (Table A2) for each variable, respectively, (climatic conditions do not account for a large percentage of the total variability). Even so, they do have considerable statistical significance. This result would indicate that climatic influence on these variables occurs significantly, and would cause them to decrease and increase, respectively. However, in order to predict with more certainty their future behavior, it would be necessary to consider what other factors might influence them and in what way.
Figure 6. Graphics of 5-year moving average of the annual averages of the simulated daily values of (a) the maximum inlet turbidity and (b) the mean inlet turbidity, both measured in NTU at the El Realón facility. The thicker black, blue and red solid lines correspond to the 50th quantile of the values obtained for the different CMIP6 models in the historical simulation and for the emission scenarios SSP2 4.5 and SSP5 8.5, respectively. In shading, the range of values between the 10th and 90th quantiles are shown in grey, blue and red for the historical, SSP2 4.5 and SSP5 8.5 scenarios respectively. (a) maximum inlet turbidity; (b) mean inlet turbidity.
Concerning conductivity values, in terms of the 50th quantile of the seven CMIP6 models analyzed, an increasing trend would be expected at all the stations analyzed in this study. Conductivity at the El Realón facility would increase by 3.8 μS/cm (0.4%) in
Figure 6. Graphics of 5-year moving average of the annual averages of the simulated daily valuesof (a) the maximum inlet turbidity and (b) the mean inlet turbidity, both measured in NTU at theEl Realón facility. The thicker black, blue and red solid lines correspond to the 50th quantile of thevalues obtained for the different CMIP6 models in the historical simulation and for the emissionscenarios SSP2 4.5 and SSP5 8.5, respectively. In shading, the range of values between the 10th and90th quantiles are shown in grey, blue and red for the historical, SSP2 4.5 and SSP5 8.5 scenariosrespectively. (a) maximum inlet turbidity; (b) mean inlet turbidity.

Water 2021, 13, 2424 10 of 17
Water 2021, 13, x FOR PEER REVIEW 11 of 19
the SSP2 4.5 scenario and 27.2 μS/cm (2.9%) in the SSP5 8.5 scenario by the end of the 21st century (Figure 7a). In the Júcar–Túria canal it would increase by 4.6 μS/cm (0.5) in the SSP2 4.5 scenario and 32.1 μS/cm (3.4%) in the SSP5 8.5 scenario by the end of the 21st century (Figure 7b). At the La Presa facility, it would increase by 15 μS/cm (1.5%) in the SSP2 4.5 scenario and 46.4 μS/cm (4.8%) in the SSP5 8.5 scenario by the end of the 21st century (Figure 7c). Finally, in the upstream Túria river it would increase by 125.7 μS/cm (10.9%) in the SSP2 4.5 scenario and 192.9 μS/cm (16.7%) in the SSP5 8.5 scenario by the end of the 21st century (Figure 7d). As for turbidity, the baseline models for conductivity have some limitations. In this case, the Pearson correlation coefficients are higher: 0.58, 0.58, 0.57 and 0.28 (Table A2) for each variable, respectively, indicating that climatic con-ditions contribute a higher percentage of the total variability than for the previous varia-ble. Furthermore, all models also have considerable statistical significance. Therefore, the future behavior of these variables can be predicted with more certainty by considering only climatic factors, especially in the first three cases. However, it would be ideal to con-sider again what other factors could have an influence, even if their contribution is smaller than in the case of turbidity.
All increments were calculated by comparing the 5-year moving average of the an-nual averages of the daily values obtained at the end of the 21st century with the most current historical value.
Figure 7. Graphics of 5-year moving average of the annual averages of the simulated conductivity daily values at (a) El Realónfacility, (b) Júcar–Túria canal, (c) La Presa facility and (d) upstream Túria river, all measured in µS/cm. The thicker black,blue and red solid lines correspond to the 50th quantile of the values obtained for the different CMIP6 models in the historicalsimulation and for the emission scenarios SSP2 4.5 and SSP5 8.5, respectively. In shading, the range of values between the 10thand 90th quantiles are shown in grey, blue and red for the historical, SSP2 4.5 and SSP5 8.5 scenarios, respectively.
In the simulations of turbidity values the CanESM5 model was not considered asit did not properly simulate the interannual variability (<50%). Regarding the resultsobtained, two different behaviors are observed (Figure 6). On the one hand, in terms ofthe 50th quantile of the six CMIP6 models analyzed, the maximum inlet turbidity wouldexperience a reduction of 0.3 NTU (21%) in the SSP2 4.5 scenario, and of 1.2 NTU (71%) inthe SSP5 8.5 scenario, both by the end of the 21st century (Figure 6a). On the other hand,the mean inlet turbidity variable would experience an increase of 0.5 NTU (35.1%) in theSSP2 4.5 scenario and an increase of 0.5 NTU (35.1%) in the SSP5 8.5 scenario, again bothby the end of the 21st century (Figure 6b). The limitations of the baseline models shouldnot be forgotten, as they have Pearson correlation coefficients of 0.2 and 0.19 (Table A2) foreach variable, respectively, (climatic conditions do not account for a large percentage of thetotal variability). Even so, they do have considerable statistical significance. This resultwould indicate that climatic influence on these variables occurs significantly, and would

Water 2021, 13, 2424 11 of 17
cause them to decrease and increase, respectively. However, in order to predict with morecertainty their future behavior, it would be necessary to consider what other factors mightinfluence them and in what way.
Concerning conductivity values, in terms of the 50th quantile of the seven CMIP6models analyzed, an increasing trend would be expected at all the stations analyzed in thisstudy. Conductivity at the El Realón facility would increase by 3.8 µS/cm (0.4%) in the SSP24.5 scenario and 27.2 µS/cm (2.9%) in the SSP5 8.5 scenario by the end of the 21st century(Figure 7a). In the Júcar–Túria canal it would increase by 4.6 µS/cm (0.5) in the SSP24.5 scenario and 32.1 µS/cm (3.4%) in the SSP5 8.5 scenario by the end of the 21st century(Figure 7b). At the La Presa facility, it would increase by 15 µS/cm (1.5%) in the SSP24.5 scenario and 46.4 µS/cm (4.8%) in the SSP5 8.5 scenario by the end of the 21st century(Figure 7c). Finally, in the upstream Túria river it would increase by 125.7 µS/cm (10.9%)in the SSP2 4.5 scenario and 192.9 µS/cm (16.7%) in the SSP5 8.5 scenario by the end of the21st century (Figure 7d). As for turbidity, the baseline models for conductivity have somelimitations. In this case, the Pearson correlation coefficients are higher: 0.58, 0.58, 0.57 and0.28 (Table A2) for each variable, respectively, indicating that climatic conditions contributea higher percentage of the total variability than for the previous variable. Furthermore, allmodels also have considerable statistical significance. Therefore, the future behavior ofthese variables can be predicted with more certainty by considering only climatic factors,especially in the first three cases. However, it would be ideal to consider again whatother factors could have an influence, even if their contribution is smaller than in the caseof turbidity.
All increments were calculated by comparing the 5-year moving average of the annualaverages of the daily values obtained at the end of the 21st century with the most currenthistorical value.
5. Discussion
Climate change’s impacts on productive processes and human activities are of highinterest, as they are associated with activities that produce essential services or resources,subject to high climate-related vulnerabilities and risks. Particularly, this study is focusedon the effects of climate change on water quality, completing previous works about climate-related impacts on water availability [1–9,13,24,32]. Such is the case of the drinking watersupply processes for human consumption, provided by the water operator, capturing,treating and supplying drinking water to the city of Valencia and its metropolitan areain Spain.
The information provided by these kind of geographic information systems withforecast information for the values of the determining variables in the water cycle, accordingto different scenarios, is an extremely useful tool which let water managers adapt andanticipate future needs of quantity and quality, and therefore, the application of necessaryadaptation measures, thus improving the efficiency of processes and the resilience ofsystems, such as in the case study selected.
It should be noted that the quality processes are directly and widely related to thequantity values of the resource, since the measured concentrations of the different parame-ters that define the quality of the water ultimately depend on the dilution, defined by thelevel of flows available. That is why one of the main evidenced and widely identified effectsof climate change, such as the reduction in available contributions due to the change inhydrology [12], will mean lower flows, and therefore higher concentration values (turbidity,conductivity, etc.), due to a lower dilution.
Results showed that turbidity quickly depends on daily mean temperature, totalrainfall and maximum relative humidity, with statistically significant linear coefficientsfor moving-average windows ranging between 2 and 7 days. Moreover, the empiricalrelationship shows nonlinear contributions that are can be viewed in Figure 5. On the otherhand, the predictive model for conductivity presented a slower response (with significant

Water 2021, 13, 2424 12 of 17
linear signal up to 30 or 60 days) and also incorporating maximum temperature andminimum relative humidity, additional to the climate-dependency obtained for turbidity.
According to the future scenarios generated, the most significant change was foundin the projected increase of conductivity for the station of the Túria River. However,this increment of conductivity has not been highlighted in the vicinity of the Júcar–Túriachannel stations which provide streams from the Júcar River. In this case, the water qualitysimulation is positive but with a lower trend and does not reflect the expected similarbehavior among both river basins, possibly due to other contributions of non-climaticorigin that should be considered as river basin regulation. Note that this is a crucialquestion in the Jucar River Basin District planning and management and specially for thedrinking water supply of Valencia and its metropolitan area where, currently three out offour cubic meters of water have their origin in the Jucar River. Depending on the quality ofwater resources this relation may vary in the future.
Furthermore, the main requirement for human consumption of water is to meetthe quality standards required by the applicable health regulations in each country orregion and its modifications (RD 140/2003), being currently under review and withinthe approval process of the new one [40]. This is done through the analysis of certainparameters or variables, whose concentration determines the quality of the water and thephysical-chemical processes necessary to apply for its treatment.
Compliance with quality requirements is increasingly influenced or affected by riskepisodes associated with extreme meteorological processes, such as floods and droughts,since their appearance affects the values of the monitored quality parameters. The moni-tored parameters within this study, as previously shown, are conductivity, turbidity, whichcould mean a limitation of the study’s scope (more uncertainty associated with the forecastsand results), so there are more variables or parameters affecting water quality. This meansan opportunity of widening the future project’s scope, so climate change research involvesmultiple activities, variables and parameters, and need the use of different methodologies,and decision making and management tools, to tackle the overwhelming task [41].
On the other hand, it is worth noting that this study is focused on predicting anaverage climate. The 5-year moving average of the annual averages of the daily valuesobtained masks the extreme precipitation events that may occur, which should be analyzedby further works on probability distributions and return periods. Currently, during theseepisodes the turbidity and conductivity parameters tend to reach very high values andthat usually requires the implementation of specific measures in the DWTP, such as thereduction of the treated flows or an increase in the addition of coagulants. As an example ofthis, the currently existing water treatment at the La Presa DWTP (composed by coagulants,flocculant, high I start-up and increase of oxidation at the head and start-up of wells)managed to treat turbidity values over 85 NTU during the extreme events that occurred in2020. Higher turbidity values can be treated but the microbiological risk increases. Theeffluents go out from the plant with 0.1–0.15 NTU and in those moments of high turbidity,we would extract filtered with 0.2–0.3 NTU, going below 0.5 NTU.
Regarding conductivity values, especially for the Túria River station with forecastedconductivity values of 2000 µS/cm in the worst scenario around year 2100, RD140/2003establishes a threshold for drinking water up to 2500 µS/cm but it would influence thevalue (out of range +/−0.5) encrusting in the index of Langelier, which is also reflectedin this RD140/2003, so some additional treatment would be necessary in the case of thisscenario occurring, which probably would be associated with a low occurrence probability,but it should be nevertheless considered in order to anticipate the adaptation strategy andthe system’s resilience.
In this scenario, it would mean a drought episode in which the flow would basicallybe reduced to more than half compared to the existing one. In these situations, two optionsare considered in order to reduce conductivity. On the one hand, through dilution effect bymixing with water from the Júcar–Túria Channel, so the conductivity is somewhat lower,of 960 µS/cm. That proportion of water coming from the Channel increases compared to
Water 2021, 13, 2424 13 of 17
the reduction of the river flow. On the other hand, the objective of salinity can be reachedthrough an adjustment in the membrane technology used in the filtration process.
Another example is presented when comparing with the adaptive measures carriedout during the last period of drought with important repercussions on the supply systemof Valencia and its metropolitan area that took place during the years 2005–2008. The maineffects were related to the scarcity of water to meet demands and the deterioration of waterquality. Thus, the main tasks were focused on improvements in water treatment to enhanceraw water quality and, in second place, on reducing water losses in the system. Regardingquality aspects, the three main dangers affecting raw water quality were: (1) the increasedlevels of salt and nutrients concentration in the Túria River, such as nitrates and organicmatter, related to suspended solids and turbidity; (2) the increase in pesticide levels in theTúria river due to irrigation systems; and (3) new emerging hazards in the system, such assome macrobiotics that could cause massive growth of algae, cyanobacteria and multipleepisodes of 2-MIB or excessive concentrations of protozoa.
During this period, within the adaptation measures in the DWTPs, a framework ofvarious structural and non-structural measures was created, with the aim of improvingraw water quality and drought management. The structural measures included: theinstallation of a new granular activated carbon filtration stage in the La Presa DWTP, theconstruction of new wells also in La Presa with UV disinfection equipment, the installationof motorized activated carbon dosing in both plants for the retention of pesticides andorganic pollutants and the advanced oxidation facility in El Realón to tackle the diseasescaused by sapid substances.
This study has shown the usefulness of evaluating the expected consequences ofclimate change on purification treatments in the most important supply of the Júcar RiverBasin District. For future research, the results obtained here should be complemented withfuture predictions of external events, helping to prevent and economically quantify thedangerous changes to the climate. Possible improvements in further works are the incorpo-ration of nonlinear factors within the turbidity model and the analysis of climate change andof extreme event occurrence. This will be developed as a demonstration in the Europeanproject WAtchfulness Tool for Evaluation of wateR Quality and Quantity (WATER-Q2).
6. Conclusions
The use of climate services means a decision-making and adaptation tool very usefulfor water managers, in order to assess the resilience of water supply systems againstvariations in the main variables and parameters determining the operation of their systemsor facilities.
Within this study, the use of climate information for water systems provided by CRISI-ADAPT-II tools is presented in order to assess the evolution of the main climate variablesinfluencing water quality for urban supply in the city of Valencia and its metropolitanarea. These tools offer the possibility to obtain the evolution or future behavior of severalvariables such as temperature, turbidity, conductivity, etc., through results of the applicationof different climate change forecasting scenarios. The application of this tool within thisstudy case may will be improved in the future, by increasing the number of variablesdetermining water quality, such as temperature or dissolved oxygen, and the amount ofdata involved for a better models’ calibration.
Results showed that the modeled performance of the water quality simulation is moreadequate for short moving-average windows (about 2–7 days) for turbidity and longerwindows (about 30–60 days) for conductivity. With this method, future scenarios wereobtained to analyze the possible effects of climate change on water quality. The mostsignificant change was found in the projected increase of conductivity for the station of theJúcar river, between 4 and 11% by 2100.
Research and development of climate services applied to water resources managementmay respond to the need of quantifying these impacts on the availability of water resources,

Water 2021, 13, 2424 14 of 17
guaranteeing that the purification treatments are adequate to the new circumstances,influenced by the effects of climate change.
Improving and adapting the quality and reliability of the results provided by the useof these kinds of tools will let water managers make better fitted and planned investmentprograms to improve the resilience of the water resources systems to better respond to theimpact of climate change. Thus, through the analysis of the evolution or the expected valuesof variables such as temperature, turbidity and conductivity, joined with the resourcesquantity’s forecasts, water managers will identify the necessary additional treatmentswithin a purification or treatment process, or the necessary catchment works, in order toface water scarcity periods and the consequent quality problems.
Author Contributions: Conceptualization G.G.-M., M.P.-M., P.A.L., J.M.C. and M.Á.P.-M.; methodol-ogy, R.M.; software, C.P.-L.; validation, C.P.B. and T.R.; formal analysis, L.G. and G.G.-M.; investiga-tion, G.G.-M., E.G. and L.G.; resources, D.R.; data curation, L.G.; writing—original draft preparation,G.G.-M.; writing—review and editing, G.G.-M. and M.P.-M.; visualization—figures, L.G., D.R., R.M.and M.P.-M.; supervision, S.F.-S. and M.A.S.; project administration, G.G.-M., M.P.-M. and R.M.;funding acquisition, M.P.-M. and E.G. All authors have read and agreed to the published version ofthe manuscript.
Funding: This research was co-funded by the Agència Valenciana de la Innovació, through thestudy “Aplicación de los servicios climáticos para el desarrollo de una estrategia de adaptación alcambio climático de los sistemas urbanos de abastecimiento” (INNTA3/2020/14), as well as by EITClimate-KIC, financing the CRISI-ADAP-II project (EIT-CKIC-TC_2.13.7_190799), and supportedby the Ministry for the Ecological Transition and the Demographic Challenge (MITECO) of theSpanish Government under the “IMpacts of climate change on wetlands Affected by GroUndwAter(IMAGUA)” project.
Informed Consent Statement: Informed consent was obtained from all subjects involved in the study.
Data Availability Statement: The CMIP6 model outputs and ERA5-Land climate databases werecollected from the Climate Data Store (CDS) of the Copernicus Climate Change Service (C3S), andare available, respectively, at https://cds.climate.copernicus.eu/#!/home and https://cds.climate.copernicus.eu/cdsapp#!/dataset/reanalysis-era5-land?tab=overview (accessed on 30 December2020). Finally, CRISI-ADAPT-II data is available in https://tool.crisi-adapt2.eu/clima-medio/ (ac-cessed on 30 December 2020).
Acknowledgments: The authors wish to thank the Valencia City Council for its collaboration andsupport in all the technological initiatives of the supply management company. Thanks are due to allthe colleagues from the EMIVASA Operations team for their collaboration by data and informationdelivery in this project; without them this work would not have been possible.
Conflicts of Interest: The authors declare no conflict of interest.
Appendix A
Table A1. Summary of basic information about CMIP6 models used in the study.
Earth System Model Entity (Country) Spatial Resolution(Length × Lat, Degree)
ACCESS-CM2 Australian Community Climate and Earth System Simulator (ACCESS) 1.87 × 1.25ACCESS-ESM1-5 Australian Community Climate and Earth System Simulator (ACCESS) 1.87 × 1.25
CanESM5 Canadian Centre for Climate Modeling and Analysis (Canada) 2.81 × 2.79CNRM-ESM2-1 Centre National de Recherches Meteorologiques (France) 1.4 × 1.4
EC-EARTH3-Veg EC-EARTH Consortium (UE) 1.25 × 1.00
MPI-ESM1-2-HR Max Planck Institute for Meteorology (Germany) 0.938 × 0.935MRI-ESM2-0 Meteorological Research Institute (Japan) 1.125 × 1.121
In this section, model configuration is shown concerning the fitting coefficients ob-tained from the stepwise regression and significance level for turbidity (Table A2) andconductivity (Table A3) according to several moving averages.

Water 2021, 13, 2424 15 of 17
Table A2. Coefficients of the model fit of the turbidity values using the daily predictive series smoothed by a 2-, 7-and 30-day moving average, indicating for each one the error interval in its last significant number at a 95% confidenceinterval in brackets and its significance in the fitting model in square brackets according to the following classification:*** for p-value < 0.001, ** p-value < 0.01, * p-value < 0.05, ◦ p-value < 0.1, - p-value ≥ 0.1. The correlation value between theobserved and simulated series for each fitting model is also presented. In all cases, the total p-value of the model is lessthan 10−6.
Predictand
Predictor Fit Coefficient
Intercept FitCoefficient
PearsonCorrelation
Coefficient (R)Daily MeanTemperature Daily Max t ◦ Daily Total
Rainfall
DailyMinimumRelative
Humidity
DailyMaximumRelative
Humidity
Maximum inletturbidity El Realón
DWTP
ma 2 - - 0.26(9)[***] - 0.03(2)
[**]0(1)[-] 0.20
ma 7 0.04(5)[-] - 0.4(1)
[***] - 0.04(3)[**]
−1(1)[-] 0.19
ma 30 - - 0.6(2)[***] - - 1.1(4)
[***] 0.13
Average inletturbidity El Realón
DWTP
ma 2 0.02(2)[◦] - 0.12(5)
[***] - 0.02(1)[*]
0(1)[-] 0.19
ma 7 0.03(2)[*] - 0.19(7)
[***] - 0.02(1)[*]
0(1)[-] 0.19
ma 30 0.02(2)[-] - 0.3(1)
[***] - - 0.6(5)(**) 0.12
Table A3. Coefficients of the model fit of the conductivity values using the daily predictive series smoothed by a 7-, 30-and 60-day moving average, indicating for each one the error interval in its last significant number at a 95% confidenceinterval in brackets and its significance in the fitting model in square brackets according to the following classification:*** for p-value < 0.001, ** p-value < 0.01, * p-value < 0.05, ◦ p-value < 0.1, - p-value ≥ 0.1. The correlation value between theobserved and simulated series for each fitting model is also presented. In all cases, the total p-value of the model is lessthan 10−6.
Predictand
Predictor Fit Coefficient (Significance Rating)Intercept FitCoefficient
(Significance Rating)RDaily Mean
Temperature
DailyMaximum
Temperature
Daily TotalRainfall
DailyMinimumRelative
Humidity
DailyMaximumRelative
Humidity
ConductivityEl Realón
DWTP
ma 7 - - −2(1)[*] - −3.0(4)
[***]1080(20)
[***] 0.51
ma 30 −1.3(6)[***] - −4(4)
[***] - −3.4(6)[***]
1130(30)[***] 0.58
ma 60 10(10)[◦]
−10(10)[*]
−19(5)[***] - −4.2(8)
[***]1260(90)
[***] 0.58
ConductivityJúcar–Túria
channel
ma 7 8(6)[**]
−9(6)[**]
−3(2)[**]
−4.4(9)[***]
1.8(8)[***]
1030(50)[***] 0.52
ma 30 - −1.4(5)[***]
−15(4)[***]
−3.6(6)[***] - 1140(30)
[***] 0.58
ma 60 −2.6(9)[***] - −16(6)
[***]−3(2)[***]
−2(1)[-]
1280(130)[***] 0.55
Conductivityof La Presa
DWTP
ma 7 - −0.8(8)[*]
−12(4)[***]
−4(1)[***]
1.7(8)[**]
1070(70)[***] 0.57
ma 30 - −3(1)[***]
−36(9)[***]
−4(2)[***]
4(1)[***]
960(120)[***] 0.55
ma 60 - −5(1)[***]
−50(10)[***]
−1(1)[-] - 1200(40)
[***] 0.50
UpstreamTúria river
conductivity
ma 7 14(8)[***]
−16(8)[***]
−17(5)[***]
−0.6(8)[-] - 1290(70)
[***] 0.27
ma 30 50(20)[***]
−50(20)[***]
−40(10)[***]
−1(1)[*] - 1510(140)
[***] 0.25
ma 60 70(20)[***]
−70(20)[***]
−70(20)[***] - - 1620(140)
[***] 0.28

Water 2021, 13, 2424 16 of 17
References1. Rubio-Martin, A.; Pulido-Velazquez, M.; Macian-Sorribes, H.; Garcia-Prats, A. System Dynamics Modeling for Supporting
Drought-Oriented Management of the Jucar River System, Spain. Water 2020, 12, 1407. [CrossRef]2. Molina, J.-L.; Zazo, S.; Martín, A.-M. Causal Reasoning: Towards Dynamic Predictive Models for Runoff Temporal Behavior of
High Dependence Rivers. Water 2019, 11, 877. [CrossRef]3. Caloiero, T.; Coscarelli, R.; Pellicone, G. Trend Analysis of Rainfall Using Gridded Data over a Region of Southern Italy. Water
2021, 13, 2271. [CrossRef]4. Mosleh, L.; Negahban-Azar, M. Role of Models in the Decision-Making Process in Integrated Urban Water Management: A
Review. Water 2021, 13, 1252. [CrossRef]5. IPCC. Intergovernmental Panel on Climate Change. In Managing Therisks of Extreme Events and Disasters to Advance Climate Change
Adaptation; Field, C.B., Barros, V.R., Eds.; A special report of working groups i and ii of the intergovernmental panel on climatechange; Cambridge University Press: Cambridge, UK, 2012.
6. IPCC. Intergovernmental Panel on Climate Change. Climate Change 2014—Impacts, Adaptation and Vulnerability: Part A: Global andSectoral Aspects; Field, C.B., Barros, V.R., Dokken, D.J., Mach, K.J., Mastrandrea, M.D., et al., Eds.; Contribution of working groupII to the fifth assessment report of the intergovernmental panel on climate change; Cambridge University Press: Cambridge,UK, 2014.
7. Sabater, S.; Tockner, K. Effects of Hydrologic Alterations on the Ecological Quality of River Ecosystems; Sabater, S., Barcelo, D., Eds.;Water scarcity in the Mediterranean: Perspectives under global change, the handbook of environmental chemistry 8; Springer:Berlin/Heidelberg, Germany, 2010.
8. Kellis, M.; Kalavrouziotis, I.K.; Gikas, P. Review of waste water reuse in the Mediterranean countries, focusing on regulations andpolicies for municipal and industrial applications. Glob. NEST J. 2013, 15, 333–350.
9. Karaouzas, I.; Theodoropoulos, C.; Vardakas, L.; Kalogianni, E.; Th. Skoulikidis, N. A review of the effects of pollution and waterscarcity on the stream biota of an intermittent Mediterranean basin. River Res. Appl. 2018, 34, 291–299. [CrossRef]
10. Vargas-Amelin, E.; Pindado, P. The challenge of climate change in Spain: Water resources, agriculture and land. J. Hydrol. 2014,518, 243–249. [CrossRef]
11. Estrela, T.; Pérez-Martin, M.; Vargas, E. Impacts of climate change on water resources in Spain. Hydrol. Sci. J. 2012, 57,1154–1167. [CrossRef]
12. Gómez-Martínez, G.; Pérez-Martín, M.A.; Estrela, T.; Del-Amo, P. North Atlantic Oscillation as a Cause of the HydrologicalChanges in the Mediterranean (Júcar River, Spain). Water Resour. Manag. 2018, 32, 2717–2734. [CrossRef]
13. Suárez-Almiñana, S.; Solera, A.; Andreu, J.; García-Romero, L. Uncertainty analysis of climate projections in relation to historicalcontributions in the Júcar River Basin. Ing. Del Agua 2020, 24, 89–99. [CrossRef]
14. Suárez-Almiñana, S.; Solera, A.; Madrigal, J.; Andreu, J.; Paredes-Arquiola, J. Risk assessment in water resources planning underclimate change at the Júcar River basin. Hydrol. Earth Syst. Sci. 2020, 24, 5297–5315. [CrossRef]
15. Delpla, I.; Jung, A.-V.; Baures, E.; Clement, M.; Thomas, O. Impacts of climate change on surface water quality in relation todrinking water production. Environ. Int. 2009, 35, 1225–1233. [CrossRef]
16. Mosley, L. Drought impacts on the water quality of freshwater systems; review and integration. Earth-Sci. Rev. 2015, 140,203–214. [CrossRef]
17. Michalak, A.M. Study role of climate change in extreme threats to water quality. Nature 2016, 535, 349–350. [CrossRef] [PubMed]18. Rose, K.C.; Greb, S.R.; Diebel, M.; Turner, M.G. Annual precipitation regulates spatial and temporal drivers of lake water clarity.
Ecol. Appl. 2017, 27, 632–643. [CrossRef]19. Collins, S.M.; Yuan, S.; Tan, P.N.; Oliver, S.K.; Lapierre, J.F.; Cheruvelil, K.S.; Fergus, C.E.; Skaff, N.K.; Stachelek, J.; Wagner,
T.; et al. Winter Precipitation and Summer Temperature Predict Lake Water Quality at Macroscales. Water Resour. Res. 2019, 55,2708–2721. [CrossRef]
20. Shuvo, A.; O’Reilly, C.M.; Blagrave, K.; Ewins, C.; Filazzola, A.; Gray, D.; Mahdiyan, O.; Moslenko, L.; Quinlan, R.; Sharma, S.Total phosphorus and climate are equally important predictors of water quality in lakes. Aquat. Sci. 2021, 83, 1–11. [CrossRef]
21. Bates, B.; Kundzewicz, Z.; Wu, S. Climate Change and Water; Intergovernmental Panel on Climate Change Secretariat: Geneva,Switzerland, 2008.
22. Kundzewicz, Z.; Mata, L.J.; Arnell, N.W.; Döll, P.; Jimenez, B.; Miller, K.; Oki, T.; Sen, Z.; Shiklomanov, I. The implications ofprojected climate change for freshwater resources and their management. Hydrol. Sci. J. 2008, 53, 3–10. [CrossRef]
23. Retallack, M. The intersection of economic demand for ecosystem services and public policy: A watershed case study exploringimplications for social-ecological resilience. Ecosyst. Serv. 2021, 50, 101322. [CrossRef]
24. Monjo, R.; Gaitán, E.; Pórtoles, J.; Ribalaygua, J.; Torres, L. Changes in extreme precipitation over Spain using statisticaldownscaling of CMIP5 projections. Int. J. Clim. 2015, 36, 757–769. [CrossRef]
25. Gaitán, E.; Monjo, R.; Pórtoles, J.; Pino-Otín, M.R. Projection of temperatures and heat and cold waves for Aragón (Spain) using atwo-step statistical downscaling of CMIP5 model outputs. Sci. Total Environ. 2018, 650, 2778–2795. [CrossRef]
26. Moutahir, H.; Bellot, P.; Monjo, R.; Bellot, J.; Garcia, M.; Touhami, I. Likely effects of climate change on groundwater availabilityin a Mediterranean region of Southeastern Spain. Hydrol. Process. 2016, 31, 161–176. [CrossRef]
27. Forero-Ortiz, E.; Martínez-Gomariz, E.; Monjo, R. Climate Change Implications for Water Availability: A Case Study of BarcelonaCity. Sustainability 2020, 12, 1779. [CrossRef]
Water 2021, 13, 2424 17 of 17
28. Tuel, A.; Eltahir, E.A.B. Why Is the Mediterranean a Climate Change Hot Spot? J. Clim. 2020, 33, 5829–5843. [CrossRef]29. Valdivia-Garcia, M.; Weir, P.; Graham, D.W.; Werner, D. Predicted Impact of Climate Change on Trihalomethanes Formation in
Drinking Water Treatment. Sci. Rep. 2019, 9, 1–10. [CrossRef]30. Abdul Malak, D.; McGlade, K.; Pascual, D.; Pla, E. Policy Assessment. Spanish Policy Framework. In Adapting to Climate Change;
Springer Briefs in Environmental Science; Springer: Cham, Switzerland, 2017. [CrossRef]31. Haro-Monteagudo, D.; Solera, A.; Pedro-Monzonís, M.; Andreu, J. Optimal Management of the Jucar River and Turia River
Basins under Uncertain Drought Conditions. Procedia Eng. 2014, 89, 1260–1267. [CrossRef]32. Suárez-Almiñana, S.; Pedro-Monzonís, M.; Paredes-Arquiola, J.; Andreu, J.; Solera, A. Linking Pan-European data to the local scale
for decision making for global change and water scarcity within water resources planning and management. Sci. Total Environ.2017, 603–604, 126–139. [CrossRef] [PubMed]
33. Muñoz-Sabater, J.; Dutra, E.; Agustí-Panareda, A.; Albergel, C.; Arduini, G.; Balsamo, G.; Boussetta, S.; Choulga, M.; Harrigan, S.;Hersbach, H.; et al. ERA5-Land: A state-of-the-art global reanalysis dataset for land applications. Earth Syst. Sci. Data Discuss2021, 1–50. [CrossRef]
34. O’Neill, B.C.; Tebaldi, C.; van Vuuren, D.P.; Eyring, V.; Friedlingstein, P.; Hurtt, G.; Knutti, R.; Kriegler, E.; Lamarque, J.-F.; Lowe,J.; et al. The Scenario Model Intercomparison Project (ScenarioMIP) for CMIP6. Geosci. Model. Dev. 2016, 9, 3461–3482. [CrossRef]
35. Venables, W.N.; Ripley, B.D. Modern Applied Statistics with S, 4th ed.; Springer: New York, NY, USA, 2012.36. R Core Team. R: A Language and Environment for Statistical Computing; R Foundation for Statistical Computing: Vienna, Austria,
2021; Available online: https://www.R-project.org/ (accessed on 30 December 2020).37. Hastie, T.J.; Pregibon, D. Generalized Linear Models. In Wadsworth & Brooks/Cole; Chambers, J.M., Hastie, T.J., Eds.; Chapter 6 of
Statistical Models in S; Springer: Berlin/Heidelberg, Germany, 1992.38. Yamashita, T.; Yamashita, K.; Kamimura, R. A Stepwise AIC Method for Variable Selection in Linear Regression.
Commun. Stat.-Theory Methods 2007, 36, 2395–2403. [CrossRef]39. Chambers, J.M. Linear models. Chapter 4 of Statistical Models in Seds. In Wadsworth & Brooks/Cole; Chambers, J.M., Hastie,
T.J., Eds.; Springer: Berlin/Heidelberg, Germany, 1992.40. Royal Decree 902/2018, of July 20, which Modifies Royal Decree 140/2003, of February 7, which Establishes the Sanitary
Criteria of the Quality of Water for Human Consumption, and the Specifications of the Methods of Analysis of Royal Decree1798/2010, of December 30, which Regulates the Exploitation and Commercialization of Natural Mineral Waters and SpringWaters Packaged for Human Consumption, and of Royal Decree 1799/2010, of December 30, by which the Process of Elaborationand Commercialization of Packaged Prepared Waters for Human Consumption is Regulated. Available online: https://www.boe.es/diario_boe/txt.php?id=BOE-A-2018-10940 (accessed on 1 September 2021).
41. Hernández-Bedolla, J.; Solera, A.; Paredes-Arquiola, J.; Pedro-Monzonís, M.; Andreu, J.; Sánchez-Quispe, S.T. The Assessment ofSustainability Indexes and Climate Change Impacts on Integrated Water Resource Management. Water 2017, 9, 213. [CrossRef]