ecosystem - southern researchy biogeochemistry 61: 135-17 1, 2002. o 2002 kluwer academic...
TRANSCRIPT
Y Biogeochemistry 61: 135-17 1, 2002. O 2002 Kluwer Academic Publishers. Printed in the Netherlands.
Retention of soluble organic nutrients by a forested ecosystem
R.G. QUALLS '.*, B.L. HAINES~, W.T. SWANK3 and S.W. TYLER1 'Department of Environmental and Resource Sciences, University of Nevada, M.S. 370, Reno, NV89557, USA; 'Botany Department, University of Georgia, Athens, GA 30602, USA; 'USDA Forest Service,
f Coweeta Hydrologic Laboratory, Otto, NC 28763. USA; *Author for comspondence (e-mail: qualls@unzedu; phone: (775) 327-5014; fax: (77.5) 784-4789)
t Received 29 August 2000; accepted in revised form 27 September 2001
Key words: Adsorption, Biodegradation, Carbon, Decomposition, Dissolved organic nitrogen, Flux, Hydrology, Organic matter, Phosphorus, Soil, Stream
Abstract. We document an example of a forested watershed at the Coweeta Hydrologic Laboratory with an extraordinary tendency to retain dissolved organic matter (DOM) generated in large quantities within the ecosystem. Our objectives were to determine fluxes of dissolved organic C, N, and P (DOC, DON, DOP, respectively), in water draining through each stratum of the ecosystem and synthesize information on the physicochemical, biological and hydrologic factors leading to retention of dissolved organic nu- trients in this ecosystem. The ecosystem retained 99.3, 97.3, and 99.0% of water soluble organic C, N and P, respectively, produced in litterfall, throughfall, and root exudates. Exports in streamwater were 4.1 kg ha-' yr-' of DOC, 0.191 kg ha-' yr-I of DON, and 0.011 kg ha-' yr-' of DOP. FIuxes of DON were greater than those of inorganic N in all strata. Most DOC, DON, and DOP was removed from solution in the A and B horizons, with DOC being rapidly adsorbed to Fe and A1 oxyhydroxides, most likely by ligand exchange. DON and DOC were released gradually from the forest floor over the year. Water soluble organic C produced in litterfall and throughfall had a disjoint distribution of half-decay times with very labile and very refractory fractions so that most labile DOC was decomposed before being leached into the mineral soil and refractory fractions dominated the DOC transported through the ecosystem. We hypothesize that this watershed retained soluble organic nutrients to an extraordinary degree because the soils have very high contents of Fe and A1 oxyhydroxides with high adsorption ca- pacities and because the predominant hydrologic pathway is downwards as unsaturated flow through a strongly adsorbing A and B horizon. The well recognized retention mechanisms for inorganic nutrients combine with adsorption of DOM and hydrologic pathway to efficiently prevent leaching of both soluble inorganic and organic nutrients in this watershed.
Abbreviations: DOC - dissolved organic carbon DOM - dissolved organic matter DON - dissolved organic nitrogen DOP - dissolved organic phosphorous
Introduction *
I Much of the emphasis on the cycling and leaching of nutrients in forests has been focused on inorganic nutrients. Often, essential limiting nutrients bound in organic - forms are not considered as being susceptible to leaching either because living cell membranes efficiently retain organic solutes or because many organic substances
tant role in controlling the leaching of nutrients (Bormann and Likens 1979). In the case of dissolved organic nutrients, however, the mechanisms controlling leaching from the ecosystem have not been clearly defined and are likely to differ because much of the nutrient content of DOM is carried by macromolecules not subject to direct uptake by roots as are NHf;, NO; and H,PO;. We will show that there are important mechanisms at work that prevent the leaching of soluble organic nutri- ents from ecosystems just as there are better known mechanisms preventing the loss of inorganic nutrients.
Our objectives in this study were to:
1. determine fluxes of DOC, DON, and DOP in water draining through each stra- tum or soil horizon of the ecosystem profile of a deciduous forest,
2. compare solution fluxes of dissolved organic vs. inorganic nutrients, 3. identify the strata where the greatest net leaching and removal of DOC, DON,
and DOP occur, 4. determine the degree to which export of DOM from forest floor, soil horizons,
and streamwater is buffered and sustained over time by physicochemical and hydrologic factors, and
5. review and synthesize information from other previously published aspects of this study to describe the physiocochemical and hydrologic factors leading to retention of dissolved organic nutrients in this ecosystem and to contrast them with factors leading to retention of dissolved inorganic N and P. Other aspects of this study that have been presented include: annual fluxes of C, N, and P in just throughfall and forest floor drainage (Qualls et al. 1991), potential rates of biodegradation of DOC and DON (Qualls and Haines 1992b), chemical frac- tionation of DOC and DON (Qualls and Haines 1991), determination of the mechanisms of adsorption of DOC (Qualls 2000), and effects of clearcutting on DOC, DON, and DOP concentrations (Qualls et al. 2000).
Methods
Site description
The study site was Watershed 2 (WS 2) at the Coweeta Hydrologic Laboratory in the Nantahala Range of the Southern Appalachian Mountains of NC, USA (83"26'W, 35'04'N). The long-term average annual precipitation is 177 cm for WS 2, but was 127.6 and 153.4 cm during the first and second years of the study. A deciduous forest dominated by several species of Quercus, Carya spp., Acer nr- brum, and Cornusjorida covered the area. Thickets of Kalmia latifolia and Rhodo- dendron maximum cover portions of the study area. Three soils covered the water- shed: a Tusquittee soil, a fine-loamy, micaceous, mesic Umbric Dystrochrept formed on colluvium in the ravines, a Fannin soil, a fine-loamy, micaceous, mesic 'Qpic Hapludult on the middle slopes and lower ridges, and a Chandler soil, a

Estimation of wafer Jmes
Precipitation, relative humidity, temperature, wind speed, and net solar radiation were measured at a weather station on the edge of the watershed. Water fluxes in throughfall and from the bottom of the Oa horizon were measured as in Qualls et al. (1991). We reasoned that the most accurate long-term measure of the water flux from the bottom of the rooting zone was the streamflow on the gauged watershed (WS 2). The transpiration withdrawal from each depth increment was calculated by distributing the total transpiration (assumed to be precipitation - streadow) among soil increments according to the distribution of fine roots (McGinty 1976). The flux from each depth increment was then estimated as flux from the bottom of the rooting zone plus the transpiration withdrawal from lower soil increments.
The two-year water flux was then multiplied by a flux-weighted average nutri- ent concentration (described below) to obtain the nutrient flux for the two-year pe- riod. The rationale for this method of calculation was: (i) the water flux over the long term from the bottom of the root zone could be accurately measured from streamflow on the gauged watershed, far more accurately than by a soil water bal- ance, and (ii) water fluxes were found to be far more variable over time than solute concentrations. The major assumptions in this estimate for soil horizon fluxes are: (i) that concentrations are flux-weighted at least in proportion to the true flux, (ii) that flu-weighted concentrations from the 17 intensive sampling weeks were rep- resentative of the two year period, (iii) that the 2 year streamflow from WS 2 equaled drainage from the upper C horizon and (iv) that transpiration withdrawals from each horizon were distributed by depth in the same way as were fine roots.
Short-term soil water jluxes
The goal of the measurement of soil hydrologic properties was only to estimate short-term downward water fluxes from the A, AB, B, and the upper 20 cm of the C horizon to use in flux weighting the measured concentrations. Matric water po- tential was measured using tensiometers (Model 2310 Multiple Manometer, Soil- moisture Equipment Corp., Santa Barbara, CA) that bracketed the depths at which water collectors had been placed (one in the A, one in the AB, two 20 cm apart in the B, and two 20 cm apart in the upper C horizons). To measure the water poten- tial gradients in the vector parallel to the hill slope, an additional set of tensiom- eters was located about 10 m directly upslope from each plot that did not have an- other plot located within 20 m upslope from it. Readings of water potential were made at intervals of 3 to 36 h so that changes in water potential during the interval were generally less than 1 H a . On occasions when individual tensiometers failed to work properly, matric potentials were interpolated from other surrounding ten- siometer~ in the plot.
Two soil cores (6.12 cm diarn. and 10 cm length) were collected in each horizon in 5 of the plots. Cores were saturated and placed in a Tempe Pressure Cell (Soil- moisture kuipment Corp.) and curves of matric potential ('Ifm) vs. volumetric wa- ter content (6) were measured. Cores were again saturated and the one-step outflow
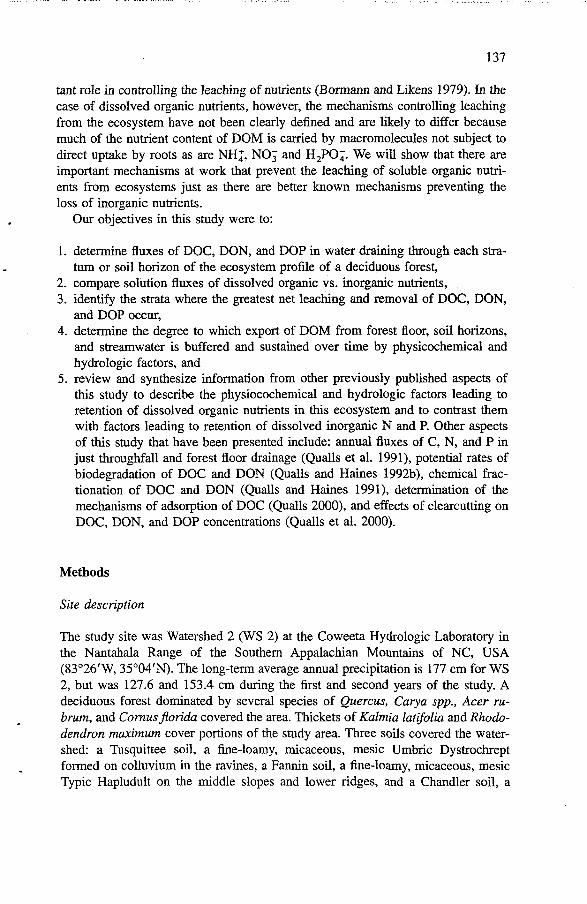
4 F,,, =Net Precipitation (known) 1
ETl -1 A 0, (measured) I
E3-2
ET3
& lower B 8,
4 FM=F43 - A0,D - ET, Figure I. Diagram illustrating the water balance calculation of short term water fluxes. Boxes represent slabs corresponding to the soil horizons (A, AB, upper B, lower B, and upper C horizons). F,, = net precipitation, defined as flux from the Oa horizon into the mineral soil, was known, (calculated inde- pendently). ETi (evapotranspiration withdrawal from the i"' horizon) was estimated independently from the PROSPER model and allocated among horizons in proportion to the distribution of fine roots. A& the change in water volumetric content of the horizon during the time interval. D = the depth interval. F,,,,,, is the flux between horizons.
balance calculation occurred during the passage of wetting fronts in which, for ex- ample, an input of net precipitation during an interval was not entirely accounted for in the change in water content of the A horizon and no change in the AB hori- zon had occurred. In such a case, the water balance method might indicate the un- accounted input as output from the bottom horizon in an unrealistically rapid flux. These errors were likely either due to wetting fronts that were not at horizon boundaries, or hysteresis.
Evapotranspiration, used in the water balance (Figure l), was estimated using PROSPER (Swift et al. 1975), an energy balance-aerodynamic method, which has been shown to predict measured annual streamflow on both mature and clearcut watersheds at Coweeta (Swift et al. 1975; Vose and SWank 1992). Evapotranspira- tion data for WS 2 for most of the two years of this study was shown in Vose and Swank (1992) for the period April 1, 1986 to March 31, 1989.
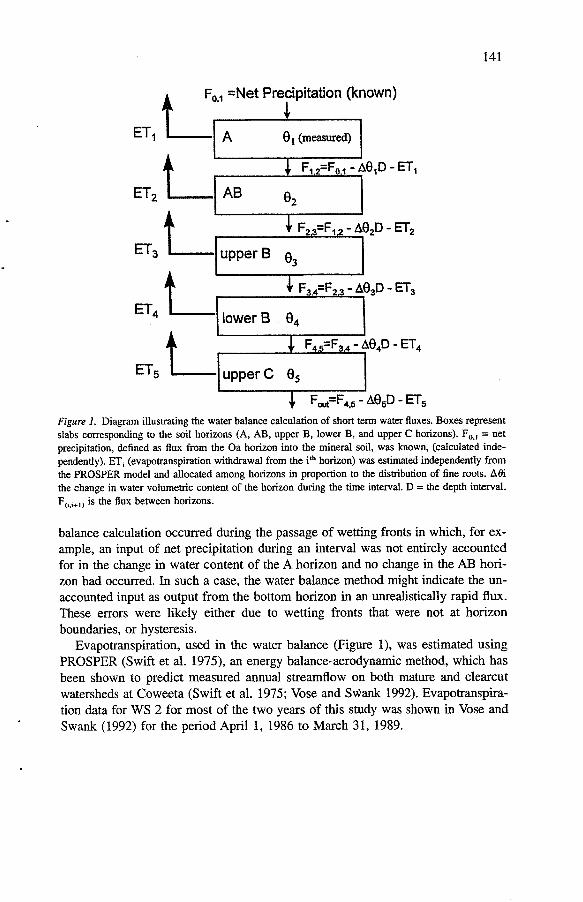
Table 1. Average hydrologic fluxes over the 2 year sampling period (in annual units).
Stratum or Horizon Water fluxes
Precipitation Throughfall Oa A AB B C Stream at Weir
All 'springs that could be located (6) were sampled. Plastic 4 L bottles were cut and buried in the sediment so as to isolate the emerging springwater from water in the channel. Two small subsurface ephemeral channels located beneath the forest floor ("pipesw) and other saturated areas in litter covered colluvium in ephemeral channels were also sampled during storms.
Results
Degree of retention
Over the two year sampling period, precipitation averaged 1.42 m/yr and stream- flow averaged 0.55 d y r (37.8% of precipitation) (Table 1). Of this streamflow, 82.0% was classified as baseflow (delayed flow) occurring outside of stormflow periods, 10.4% as baseflow continuing during periods of storrnflow, and 7.6% as stormflow ("quickflow"). The long term average stormflow was 9.5% of stream- flow (Swift et al. 1988).
While relatively high concentrations and fluxes of DOC, DON, and DOP were generated in the canopy and forest floor, they declined dramatically in the mineral soil (Figures 2, 3 and 4). For example, concentrations of DOC, DON and DOP in the C horizon were only 1.6%, 3.5% and 3.8%, respectively, of those in water draining from the Oa horizon. Because water was also removed by evapotranspi- ration as it passed through the mineral soil, fluxes of DOC, DON, and DOP de- clined to an even greater extent and were only 1.6%, 1.6%, and 1.7%, respectively of those draining from the Oa horizon. There was a net increase in DOC and DON flux in water exiting the watershed as streamwater compared to that draining from - the upper C horizon. Fluxes of DOC and DON in strearnwater were 1.42 times and 1.21 times greater than that draining from the upper C horizon. The DOC concen- tration in streamwater vs. C horizon was significantIy different (p < 0.05) using a T-test for weighted data and using all plots and all times for C horizon data and all times for streamwater data.
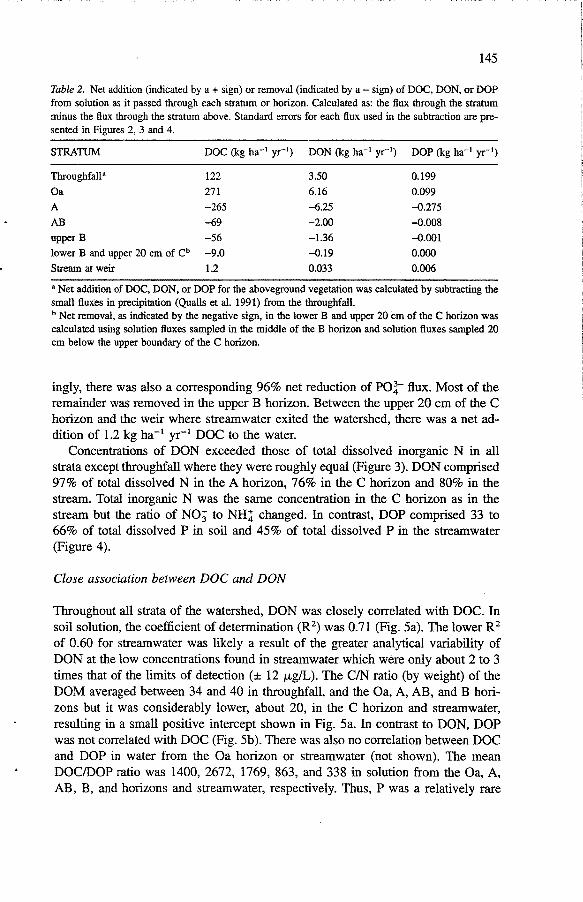
Table 2. Net addition (indicated by a + sign) or removal (indicated by a - sign) of DOC, DON, or DOP from solution as it passed through each stratum or horizon. Calculated as: the flux through the stratum minus the flux through the stratum above. Standard errors for each flux used in the subtraction are pre- sented in Figures 2, 3 and 4.
STRATUM DOC (kg ha-' yr-I) DON (kg ha-' yr-I) DOP (kg ha-' yr-I)
Throughfall" 122 3.50 0.199 Oa 27 1 6.16 0.099 A -265 -6.25 -0.275 AB -69 -2.00 -0.008 upper B -56 - 1.36 -0.001 lower B and upper 20 cm of Cb -9.0 -0.19 0.000 Stream at weir 1.2 0.033 0.006
" Net addition of DOC, DON, or DOP for the aboveground vegetation was calculated by subtracting the small fluxes in precipitation (Qualls et al. 1991) from the throughfall.
Net removal, as indicated by the negative sign, in the lower B and upper 20 cm of the C horizon was calculated using solution fluxes sampled in the middle of the B horizon and solution fluxes sampled 20 cm below the upper boundary of the C horizon.
ingly, there was also a corresponding 96% net reduction of PO:- flux. Most of the remainder was removed in the upper B horizon. Between the upper 20 cm of the C horizon and the weir where streamwater exited the watershed, there was a net ad- dition of 1.2 kg ha-' yr-' DOC to the water.
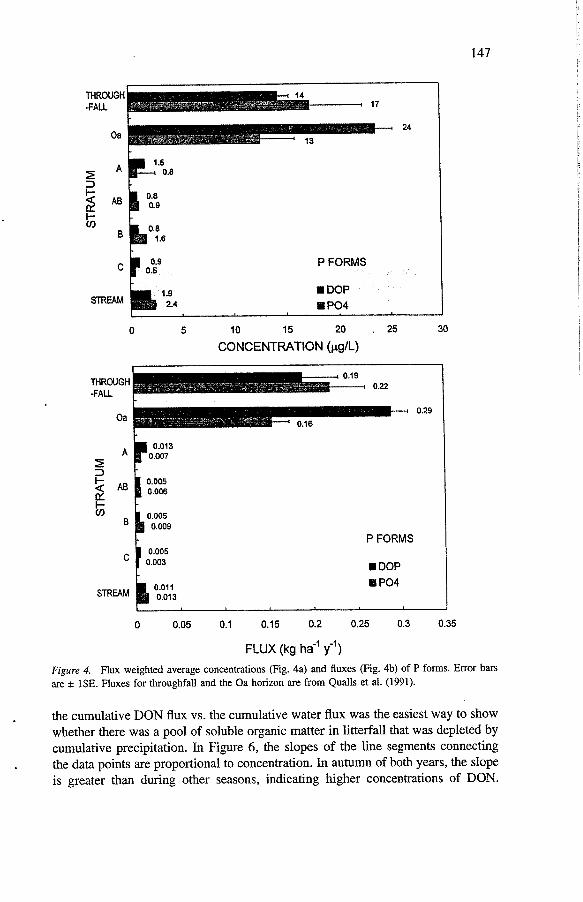
Concentrations of DON exceeded those of total dissolved inorganic N in all strata except throughfall where they were roughly equal (Figure 3). DON comprised 97% of total dissolved N in the A horizon, 76% in the C horizon and 80% in the stream. Total inorganic N was the same concentration in the C horizon as in the stream but the ratio of NO; to NH: changed. In contrast, DOP comprised 33 to 66% of total dissolved P in soil and 45% of total dissolved P in the streamwater (Figure 4).
Close association between DOC and DON
Throughout all strata of the watershed, DON was closely correlated with DOC. In soil solution, the coefficient of determination (R2) was 0.71 (Fig. 5a). The lower R2 of 0.60 for streamwater was likely a result of the greater analytical variability of DON at the low concentrations found in streamwater which were only about 2 to 3 times that of the limits of detection (rt 12 pg/L). The CJN ratio (by weight) of the DOM averaged between 34 and 40 in throughfall, and the Oa, A, AB, and B hori- zons but it was considerably lower, about 20, in the C horizon and streamwater, resulting in a small positive intercept shown in Fig. 5a. In contrast to DON, DOP was not correlated with DOC (Fig. 5b). There was also no correlation between DOC and DOP in water from the Oa horizon or streamwater (not shown). The mean DOCIDOP ratio was 1400, 2672, 1769, 863, and 338 in solution from the Oa, A, AB, B, and horizons and streamwater, respectively. Thus, P was a relatively rare
THROUGH -FALL
24 Oa
P FORMS
.I DOP Po4
029
P FORMS . DOP ti PO4
FLUX (kg haV' y")
Figure 4. Flux weighted average concentrations (Fig. 4a) and fluxes (Fig. 4b) of P forms. Error bars are rt ISE. Fluxes for throughfall and the Oa horizon are from Qualls et al. (1991).
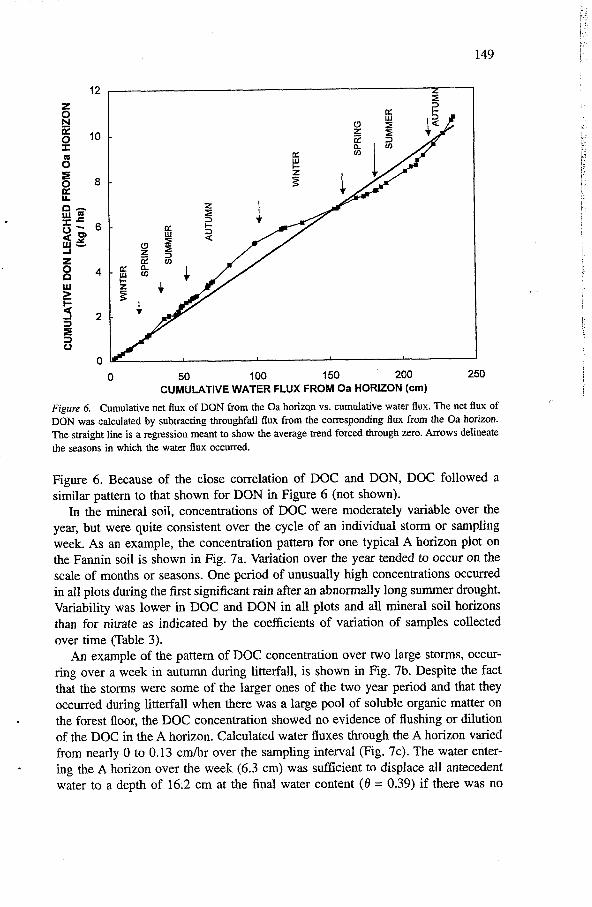
. the cumulative DON flux vs. the cumulative water flux was the easiest way to show whether there was a pool of soluble organic matter in litterfall that was depleted by cumulative precipitation. In Figure 6, the slopes of the line segments connecting
. the data points are proportional to concentration. In autumn of both years, the slope is greater than during other seasons, indicating higher concentrations of DON.
0 50 100 150 200 250 CUMULATIVE WATER FLUX FROM Oa HORIZON (cm)
Figure 6. Cumulative net flu of DON from the Oa horizqn vs. cumulative water flu. The net flux of DON was calculated by subtracting throughfall fiux from the corresponding flux from the Oa horizon. The straight line is a regression meant to show the average trend forced through zero. Arrows delineate the seasons in which the water flux occurred.
Figure 6. Because of the close correlation of DOC and DON, DOC followed a similar pattern to that shown for DON in Figure 6 (not shown).
In the mineral soil, concentrations of DOC were moderately variable over the year, but were quite consistent over the cycle of an individual storm or sampling week. As an example, the concentration pattern for one typical A horizon plot on the Fannin soil is shown in Fig. 7a. Variation over the year tended to occur on the scale of months or seasons. One period of unusually high concentrations occurred in all plots during the first significant rain after an abnormally long summer drought. Variability was lower in DOC and DON in all plots and all mineral soil horizons than for nitrate as indicated by the coefficients of variation of samples collected over time (Table 3).
An example of the pattern of DOC concentration over two large storms, occur- ring over a week in autumn during litterfall, is shown in Fig. 7b. Despite the fact that the storms were some of the larger ones of the two year period and that they occurred during litterfall when there was a large pool of soluble organic matter on the forest floor, the DOC concentration showed no evidence of flushing or dilution of the DOC in the A horizon. Calculated water fluxes through the A horizon varied from nearly 0 to 0.13 cmlhr over the sampling interval (Fig. 7c). The water enter- - ing the A horizon over the week (6.3 cm) was sufficient to displace all antecedent water to a depth of 16.2 cm at the find water content ( 6 = 0.39) if there was no
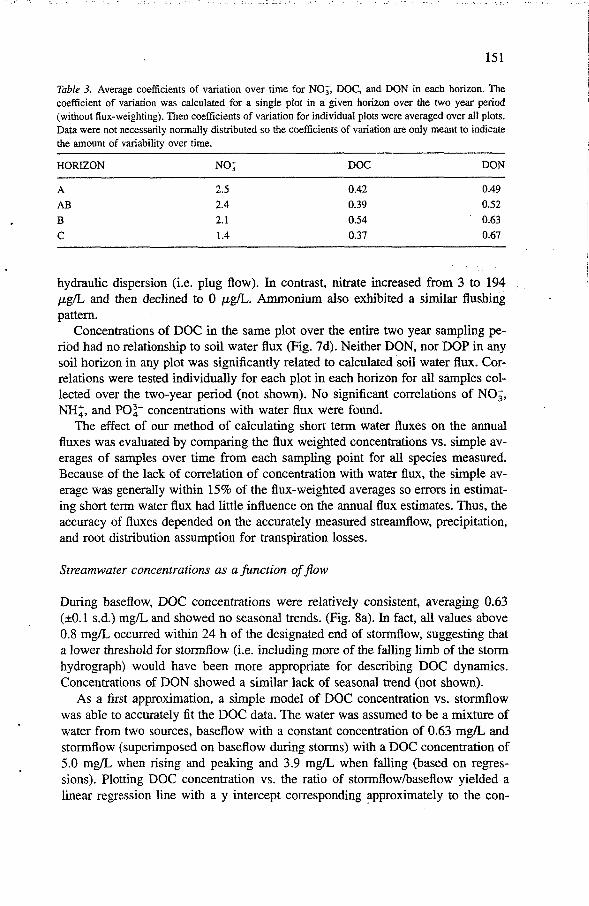
Table 3. Average coefficients of variation over time for NO;, DOC, and DON in each horizon. The coefficient of variation was calculated for a single plot in a given horizon over the two year period (without flux-weighting). Then coefficients of variation for individual plots were averaged over all plots. Data were not necessarily normally distributed so the coefficients of variation are only meant to indicate the amount of variability over time.
HORIZON NO; DOC DON
hydraulic dispersion (i.e. plug flow). In contrast, nitrate increased from 3 to 194 pg/L and then declined to 0 p&. Ammonium also exhibited a similar flushing pattern.
Concentrations of DOC in the same plot over the entire two year sampling pe- riod had no relationship to soil water flux (Fig. 7d). Neither DON, nor DOP in any soil horizon in any plot was significantly related to calculated soil water flux. Cor- relations were tested individually for each plot in each horizon for all samples col- lected over the two-year period (not shown). No significant correlations of NO;, NH;, and PO? concentrations with water flux were found.
The effect of our method of calculating short term water fluxes on the annual fluxes was evaluated by comparing the flux weighted concentrations vs. simple av- erages of samples over time from each sampling point for all species measured. Because of the lack of correlation of concentration with water flux, the simple av- erage was generally within 15% of the flux-weighted averages so errors in estimat- ing short term water flux had IittIe influence on the annual flux estimates. Thus, the accuracy of fluxes depended on the accurately measured streamflow, precipitation, and root distribution assumption for transpiration losses.
Streamwater concentrations as a function offlow
During baseflow, DOC concentrations were relatively consistent, averaging 0.63 (&. 1 s.d.) mg/L and showed no seasonal trends. (Fig. 8a). In fact, all values above 0.8 mgiL occurred within 24 h of the designated end of stormflow, suggesting that a lower threshold for stormflow (i.e. including more of the falling limb of the storm hydrograph) would have been more appropriate for describing DOC dynamics. Concentrations of DON showed a similar lack of seasonal trend (not shown).
As a first approximation, a simple model of DOC concentration vs. stormflow was able to accurately fit the DOC data. The water was assumed to be a mixture of water from two sources, baseflow with a constant concentration of 0.63 mg/L and stormflow (superimposed on baseflow during storms) with a DOC concentration of 5.0 mgL when rising and peaking and 3.9 mg/L when falling (based on regres- sions). Plotting DOC concentration vs. the ratio of stormflow/baseflow yielded a linear regression line with a y intercept corresponding approximately to the con-
a slightly curvilinear relationship (see Figs. 8b and c) provided a better fit than the linear relationship. Several different models were tested (such as DOC concentra- tion vs. discharge) but this model provided the better predictions. For example, us- ing discharge as an independent variable failed because a peak stormflow in sum- mer might have a discharge similar to baseflow in late winter when baseflow tended to be high. While there were no significant differences in the regressions for grow- ing season vs. dormant season (excluding autumn), autumn storms during litterfall appeared to have higher DOC for a 'given stormflow/baseflow ratio where DOC = 6.9 mg/L for 100% stormflow on the rising limb.
Comparison of potential sources of streamwater DOC
During periods of baseflow, the DOC concentration in springs and the riparian C horizon were considerably lower than DOC concentration in streamwater at the weir (Table 4). During storms, springs and the riparian C horizon soil solution still remained very low in DOC concentration, failing to account for any of the rise in concentration seen in streamwater. In contrast, limited areas in which litter or thin soil covered an ephemeral stream channel had much higher concentrations of DOC in water that flowed during storms. The time for a wetting front to be detected by tensiometers located in the riparian C horizon varied from about 37 to 39 hours afier the stormflow began in the stream and these wetting fronts did not reach the C horizon until after the end of the stormflow event in the stream (not shown). Furthermore, the riparian C horizon at the depths of 1.2 to 1.5 m did not appear to be receiving large amounts water from upslope since the water contents began to decrease (drain after the wetting cycle) on the same time scale as the midslope and upslope plots. Consequently, net downslope movement of water toward the stream appeared to occur at lower depths in the soil.
Discussion
Degree of retention of soluble organic nutrients
' In litterfall and throughfall, 2330, 39.8, and 2.19 kg ha-' yr-' of organic C, N, and P were deposited on the forest floor. Eighteen, 28, and 14%, respectively, of the C, N, and P in litterfall plus throughfall percolated in dissolved organic forms from the bottom of the forest floor into the mineral soil (Qualls et al. 1991). Of this flux of nutrients from the forest floor 99.0, 98.1, and 96.3%, of the DOC, DON, and DOP, respectively, was removed from solution before it left the watershed in streamwater at the weir. The percentage removed between the forest floor and the C horizon was even greater: 99.3,98.4, and 98.3% respectively, of the solution flux from the forest floor.
There was apparently a net generation of soluble organic nutrients in the stream or some unmeasured hydrologic source area of the stream, since the riparian C ho-
kg ha-' yr-' for a mixed oak-hickory forest site at Coweeta (Davis 1997). What- ever the accuracy of this estimate, it is dwarfed by fluxes in foliar litterfall and canopy leaching. The input of soluble organic matter in senesced root litter is likely to be a far greater input than exudates from live roots since fine root productivity was estimated at 10950 kg ha-' yr-' (Davis 1997) but we know of no study that has estimated leaching from root litter. Adding all these rbzown sources of soluble organic matter inputs from net primary production (NIT), we calculate that 595 kg ha-' yr-' of soluble organic C, 3.2 kg ha-' yr-' soluble organic N, and 8.6 kg ha-' yr-' of soluble organic P were produced. Thus, the ecosystem retained 99.3, 97.3, and 99.0% of soluble organic C, N and P, respectively, produced in litterfall, throughfall, and root exudates before it was lost in streamwater. We will show Iater that the greater loss of soluble organic N than C was largely a product of the rapid microbial decomposition of IabiIe carbohydrates in Litter and, perhaps, some micro- bial dissolution of organic N that was not soluble in fresh litter.
We have treated soluble organic matter produced from microbial dissolution of otherwise insoluble organic matter as a different category of soluble organic matter (Figure 9). However, it may also be subject to leaching and transport just as is soluble organic matter originating in net primary production. We reason that all of the insoluble macromolecular substances in plant detritus (e.g. cellulose, hemicel- lulose, lignin, lipids, etc.) must eventually be dissoIved by exoenzymes to be taken inside the cell membrane. Since litterfall (2330 kg ha-I yr-') plus fine root produc- tivity ( - 5040 kg ha-' yr-') was 7370 kg ha-' yr-', and the soluble portion of this was 5950 kg ha-' yr-', then the rate of microbial dissolution of the insoluble sub- stances was about 6780 kg ha-' yr-' assuming that decomposition balances litter inputs. Obviously, little of this large flux ever diffuses away from the immediate vicinity of the microbial cell membrane.
We know of no studies in which the total input of soluble organic nutrients has been measured. Several studies have documented the fluxes of soluble organic nu- trients from the forest floor and the corresponding fluxes in streamwater. McDow- ell and Likens (1988) reported a flux of 207 kg ha-' yr-' of DOC from the forest floor and a flux in streamwater of 20.8 kg ha-' yr-' in Bear Brook watershed at Hubbard Brook Forest, a removal of 90% of DOC. At Coweeta, the corresponding removal was 99%. At Hubbard Brook, concentrations of DOC in the upper B ho- rizon (3 rn&), seeps (1.7 mg/L), and streamwater (1.8 to 3.1 mg& depending on period) were all higher than those at Coweeta. Using data given in McDowell and Liens (1988), we can sum the soluble organic C produced in the same way we did for the Coweeta Forest as 310 kg ha-' yr-I. Thus, the Bear Brook watershed re- tained 93.3% of the soluble organic C produced (aboveground). Sollins and Mc- Corison (1981) reported only concentrations of DOC and DON rather than fluxes. In their control watershed at H.J. Andrews Forest, in forest floor leachate the av- erage concentration of DON was 379 p a , much lower than the corresponding concentration at Coweeta, and in streamwater, it was 58 CLgn, which was higher than the corresponding concentration at Coweeta. Furthermore concentrations were reduced less in the soil profile compared to Coweeta. Consequently, it seems likely that the watershed at H.J. Andrews Forest was less efficient at retaining the DON
(whose molecular weight distributions suggested was mostly DON) in two grazed watersheds in Australia One watershed had sand over clay soils while another had loam over clay soils. The watershed with sand over clay soils exported in stream- water 60 kg ha-' yr-' DOC and 5.4 kg ha-' yr-' dissolved Kjeldahl N, 15 and 28 times, respectively, that of Coweeta. Export from the watershed with loam over clay soils was about one third those of the watershed with sandier soil. While we cannot directly compare the removal of soluble organic nutrients produced within the Aus- tralian watersheds, it is obvious that the degree of retention was much lower than at Coweeta.
While we did not measure suspended particulate matter in streamwater in our study, data from other studies of similar watersheds at Coweeta can allow us to make some general comparisons. The export of particulate C in suspended matter and bedload from a nearby mature hardwood watershed was 3.08 kg ha-' yr-', as- suming the organic matter measured was 50% C (Swank and Waide 1988). The export of particulate C was 3.65 kg ha-' yr-' and export of particulate N was 0.23 kg ha-' yr-' from another similar watershed, based on the measurement of sedi- ment accumulation in the stilling pond of a weir, again assuming organic matter was 50% C (Monk 1975). Thus, if these studies are also representative of WS 2, DOC export (4.1 kg ha-' yr-') would be roughly of the same magnitude as par- ticulate C export and DON export (0.19 kg ha-' yr-') would comprise about 40% of total N export in streamwater.
Many studies have reviewed DOC concentrations in streamwater (Moeller et al. 1979; Tate and Meyer 1983; McDowell and Likens 1988) and the DOC concentra- tion in the stream draining WS 2 is at the low end of the range. Only recently have there been enough studies in which export of DON has been measured to make generalizations (Lewis et al. 1999). The mean export of DON from 20 undisturbed tropical watersheds was 2.40 kg ha-' yr-l, about 13 times the export from WS 2. DON comprised an average of 67% of total dissolved N in 1st and 2nd order streams but was about 50% for all watersheds. Particulate N comprised only 17% of total N in 1st and 2nd order streams ranging to 37% in rivers of the highest order.
Adsorption of soluble organic nutrients: organic horizons
Since most litter fell during autumn, it might be expected that very soluble sub- stances in litter would be leached in a pulse in autumn. Instead, soluble organic matter was leached only very gradually from litter. We found that while the flux of DOC and DON from the forest floor was highest shortly after litterfall, the major- ity of the annual flux occurred at sustained rates that declined only gradually over the year. Such behavior could be explained by several alternative hypotheses:
1. solubility is regulated by simple dissolution of sparingly soluble substances, 2. diffusion limits dissolution from particle matrices, 3. microbial dissolution generates soluble organic matter gradually during decom-
position,
3) and the moderation of variability in concentration over time. Physicochemical adsorption, largely by Fe and A1 oxyhydroxides can rapidly remove DOC from so- lution (Jardine et al. 1989; Qualls and Haines 1992a) and can buffer differences in input concentration (McDowell and Wood 1984; Qualls and Haines 1992a). Using soil from the AB horizon of the Typic Hapludult soil in one of the plots of this study, Qualls and Haines (1992a) performed adsorption isotherms experiments us- ing continuous flow through intact soil cores as well as conventional batch experi- ments. These experiments showed that DOC was reduced from 32 mg/L to about 4 mg/L and approached equilibrium after one pass through a core. This concentration was close to the average concentration in soil water drawn from the AB horizon in this plot. This example showed that the buffering of input concentrations ranging from 0.2 to 32 mg/L DOC resulted in equilibrium concentrations of a much nar- rower range of about 0.6 to 4. Furthermore, this adsorption was rapid compared to the time necessary for decomposition. In batch adsorption experiments, the DOC reached near steady state within hours. This rapid sorption on the scale of minutes or hours has been observed by McDowell and Wood (1984) and Kaiser and Zech (1998). Consequently, it is unlikely that a large proportion of the reduction in con- centration of DOC and DON as water moves through the mineral soil was caused by decomposition in the dissolved phase because the DOC and DON from our plots was very slow to mineralize in biodegradation experiments (Qualls and Haines 1992b).
Qualls and Haines (1992a) also showed that the adsorption was linear within the range of naturally encountered input concentrations, suggesting that the adsorption sites were not near a point of saturation with adsorbed organic matter. Adsorption isotherm curves from other studies show only moderate curvature in the range of natural concentrations (McDowell and Wood 1984; Nodvin et al. 1986). This obser- vation is important in the example of the AB horizon, because it suggests that the contribution of sorbed organic matter to organic matter content of the AB horizon is partly regulated by equilibrium with the dissolved phase. Conversely, the reason that a portion of the DOM remains in solution is not simply that all available sorp- tion sites are coated in a particular layer of the A horizon. However, much of the DOC was irreversibly adsorbed as shown by protracted leaching after adsorbing DOC onto the soil (Qualls and Haines 1992a).
In the case of DOP and PO:- the relatively high concentrations draining from the forest floor were reduced to low levels abruptly in the A horizon. This may reflect the strong tendency of H,PO, (Walbridge et al. 1991), and perhaps phos- phate esters, to adsorb to these Fe and A1 rich soils. A large proportion of the dis- solved organic P occurs in the negatively charged hydrophilic acid fraction, one whose behavior may be dominated by phosphate monoester functional groups (Qualls and Haines 1991), which are likely to adsorb strongly to Fe and A1 rich mineral soils.
Decomposition of soluble organic matter
There is evidence that the majority of DOM in the bulk soil solution from terres- trial environments is refractory. Qualls and Haines (1992b) used incubations of DOM from throughfall, forest floor water, soil water, and streamwater to investi- gate biodegradability. While throughfall in one season and freshly fallen dead litter contained a large portion of rapidly biodegradable DOM, that draining from the forest floor and DOM in soil solution was largely refractory in winter, spring and summer samples. Curves of DOC lost vs. time were distinctly biphasic, typically indicating a small proportion that decayed rapidly and a larger proportion that de- cayed much more slowly. In freshly fallen leaf litter, there is a large portion that is very biodegradable (McDowell and Fisher 1976; Qualls and Haines 1992b). In the study of Qualls and Haines (1992b), much of the labile soluble organic matter, largely carbohydrates, appeared to be decomposed before being leached from the litter since forest floor leachate collected shortly after litterfall contained far less of the labile fraction of soluble organic matter than did freshly fallen litter. Nykvist (1963) found that simple sugars, aliphatic acids, and free amino acids alone com- prised 10 to 25% of the water soluble substances in freshly senesced litter.
Yano et al. (1998) used a flow-through bioreactor colonized by microbes to measure a biodegradable fraction of forest floor solution from the Harvard Forest. In forest floor solutions from plots representing "average" biodegradability, about 12 to 15% of the DOC was designated biodegradable. This percentage is similar to the range of 6 to 19% for the "rapidly decaying fraction" in Oa horizon solution in the study of Qualls and Haines (1992b). Two samples from plots subjected to long term N application, however, had a biodegradable fraction of about 40% (Yano et al. 1998).
A disjoint distribution of half decay times of soluble organic matter produced in the forest ecosystem
We can use our data on the amount of soluble organic nutrients produced in the forest along with data from a study on biodegradability of DOC from this same forest (Qualls and Haines 1992b) to show a distribution of half decay times for various fractions from different sources Figure 10). There is a large portion of very labile soluble organic matter in throughfall and senesced litter and a slightly smaller amount of soluble organic matter with half decay times on the order of thousands of days. However, there is little or no soluble organic matter with intermediate bio- degradation rates. Thus, there is an extremely disjoint distribution of half decay times. The sharply resolved biphasic decay curves (Qualls and Haines 1992b) with an excellent fit to the biphasic decay model resulted in this disjoint distribution.
Adsorption vs. biodegradation as mechanisms of retention
Adsorption and biodegradation might be regarded as competing processes that both reduced leaching of soluble organic nutrients. The labile fractions of soluble C
Hydrologic factors
Inorganic nutrient forms, especially H,PO, and NH; are subject to sorption on soil surfaces in the mineral soil (Brady 1990). Likewise, several studies have shown that, at least in some ecosystems, most macromolecular DOM is adsorbed in some horizon of the mineral soil, especially horizons rich in Fe or A1 oxyhydroxides. Our discussion of adsorption has largely been based on adsorption equilibrium. How- ever, the removal of this DOM by a solid surface somewhere in the ecosystem pro- file depends on sorption equilibria, kinetics, and pathways. The capacity for the so- lution phase to come to equilibrium with adsorbing surfaces in some horizon is influenced by several hydrologic factors that are listed below in order of scale:
1. sorption kinetics on surfaces that might be slow relative to hydrologic residence time,
2. diffusion through particles that may limit the time to reach equilibrium, 3. preferential flow that may "short circuit" exposure of entire soil surface, 4. on a larger scale, flow paths through a watershed that may bypass the most
strongly adsorbing horizons, e.g. surface flow, lateral flow, throughfall on stream channels, leaves falling into channel, and finally
5. the soil profiles that may simply lack a strongly adsorbing horizon.
There is evidence for the importance of these hydrologic factors that control the ability of the soil solution to equilibrate with the most strongly adsorbing horizon. The DOC concentration varied little in lysimeter samples collected in the A hori- zon over short time periods as water flux varied greatly over a week of storms (Figure 7). In addition, they were much lower than concentrations draining from the forest floor, and neither DOC nor DON concentration correlated with the rate of water flux. It is possibIe that preferential flow through macropores was under- represented in the porous cup water samplers. However, tensiometers indicated that viaually all flow through the A horizon was as unsaturated flow. These results sug- gested that adsorption of the DOC equilibrated rapidly and in less time than the hydrologic residence time in the horizon. Furthermore, in continuous flow-through adsorption experiments using the same soil, the DOC concentration approached equilibrium after the first cycle of solution passed through the core. Thus, in the mineral soils tested, it appears that kinetics and diffusion into particles are fast rela- tive to hydrologic residence times.
In the forest floor, however, the large and irregular size of particles, along with the remains of hydrophobic cuticles, may well be expected to increase the time necessary for diffusion out of particles and the tendency for preferential flow. Dur- ing batch sorption isotherm experiments (Qualls 2000), the DOC concentration leached from ground pine Iitter equilibrated by the second 24 h period. The same litter, when intact in cores, did not reach steady state until the second day of a 4 h/d simulated rain. Preferential flow has been demonstrated by the advection of dyes or other tracers artificial rain applied to a forest floor (Burcar et al. 1994). The com- bination of the sorption equilibria, the slowness of diffusion from particles on the
organic matter in the stream and hyporheic zone. In the context of hydrologic flow- path, on WS 2 our results suggested that most seeps were not very responsive to stormflow, and movement of water through most hillslopes was too slow and the concentrations of DOC too low to contribute to the elevated concentrations during stormflow. We hypothesize that the elevated concentrations of DOC largely origi- nate from the "variable source areas" which Hibbert and Troendle (1988) viewed as the source of stormflow on these watersheds, where there are surface or subsur- face ephemeral channels without sufficient mineral soil overlying them leading to . hydrologic bypassing.
In calculating the short-term water fluxes, net downslope movement of water may have caused errors in our nutrient flux calculations but we believe this error had little effect on our final results. The annual fluxes were based on streamfiow and represent a vertical projection of the watershed area. Downslope flow of water would have the effect of skewing the relative weighting of concentrations but since there was no correlation of concentrations with calculated water fluxes, these errors are unlikely to have created a significant bias.
Retention of dissolved organic nutrients as a function of soil type and hydrologic jlowpath
The hypothetical relationship of hydrologic flowpath and soil adsorption capacity to the tendency of dissolved organic nutrients to Ieach from the ecosystem is ilIus- trated in Figure 11. It depicts geochemical and hydrological controls dominating the tendency of an ecosystem to retain soluble organic nutrients produced by bio- logical processes. Ecosystems may be compared on this diagram with respect to these characteristics. Geochemical processes controlling retention are largely de- pendent on the presence or absence of Fe and A1 oxyhydroxides or certain clays. One end member of this series along the geochemical axis might be represented by sand dunes and other sandy soils such as the dune chronosequence examined by Walker et al. (1981) or the Indiana Dunes chronosequence (Olson 1958). Another end member- might be represented by soils high in oxyhydroxides (such as at Coweeta) or volcanic soils with allophane that strongly adsorbs humic substances. Hydrologic short circuiting of B horizons high in metal oxyhydroxides can also bypass the adsorbing effects of soils, represented in the extreme by surface flow or surface flow wetlands. Streams may even be visualized within this framework as a case of surface flow. We can also represent the changes during pedogenesis as vec- tors within this diagram (for example, as weathering produces metal oxyhydrox- ides or as podzolization progresses). The production of soluble organic matter is another factor determining export and may be represented along an axis perpen- dicular to the other two axes in Figure 11-.
Comparison of the behavior of soluble organic vs. inorganic nutrients
A set of hypotheses comparing the factors controlling the retention of soluble or- ganic vs. inorganic nutrients has been presented (Qualls 2000) which is applicable
Hence, geochemical factors more important in controlling leaching of dissolved or- ganic nutrients.
Electrostatic charge is another property of the predominant soluble inorganic forms of N and P, making them susceptible to sorption on cation or anion exchange sites. Many of the salts formed with counter-ions are soluble, but some, such as the calcium salts of P at high pH are insoluble (Brady 1990). In addition, the presence of hydroxyl group on the phosphate ions make them susceptible to ligand exchange which may often be the most important factor in preventing leaching of phosphate
a ions. XI..--. , Properties of the soluble organic macromolecules besides size which determine
their behavior are: (1) that they are predominately negatively charged (although a significant fraction is neutral) (Qualls and Haines 1991), (2) that the presence of carboxyl and phenolic hydroxyl groups make interactions such as ligand exchange and hydrogen bonding important, and (3) 'that molecules are multidentate making bonds more stable. In addition, the N atoms in the humic and hydrophilic acids do not contribute substantial positive charges in the macromolecules as they do in peptides. Instead, the carboxyl and phenolic hydroxyl groups largely determine the behavior of the nitrogen carried more or less "passively" by the humic and hydro- philic acids (Qualls and Haines 1991). In the case of dissolved organic P, most macromolecules containing P behave as anions, but whether the negatively charged P ester groups or the carboxylic acids determine this behavior has not been deter- mined (Qualls and Haines 1991).
As in the case for phosphate, ligand exchange is likely to be responsible for re- moval of a large portion of the macromolecular dissolved organic molecules in mineral soils. Thus the geochemical mechanisms for retaining phosphate, DOC, DON, and DOP are similar. These mechanisms are capable of maintaining rela- tively low levels in solution. Organic-organic mechanisms such as hydrogen bond- ing or van der Waals forces may also remove these macromolecules in organic ho- rizons but these mechanisms function to maintain concentrations at higher levels.
We can classify the various mechanisms of retention as geochemical, hydrologic, and biological. In the case of N, the mechanisms controlling the loss of N in the form of nitrate are largely biological and hydrologic. We propose that the loss of DON is controlled by geochemical and hydrologic mechanisms. The production of soluble organic nutrients is, of course, biological but dissolution and sorption are geochemical mechanisms.
We hypothesize that the most important geochemical mechanisms leading to the retention of dissolved organic nutrients are: (i) the slow sustained release of poten- tially soluble organic matter caused by slow dissolution, equilibrium controlled de- sorption from organic surfaces, and gradual exposure of surfaces to percolating wa- ter during fragmentation, and (ii) equilibrium adsorption to Fe and A1 oxyhydrox-
a
* ides and clays. The slow gradual release of potentially soluble organic matter from detritus can be compared to factors tending to delay nitrification (sensu Vitousek et al. (1979)). Sorption helps retain the soluble organic matter to be decomposed slowly on surfaces and finally, hydrologic factors control the capacity for this ad-
Grieve LC. 1984. Concentrations and annual loading of dissolved organic matter in a small moorland stream. Freshwater Biol. 14: 533-537.
Grieve LC. 1991. A model of dissolved organic carbon concentrations in soil and stream waters. Hydrol. Processes 5: 301-307.
Grover B.L. and Lamborn R.E. 1970. Preparation of porous ceramic cups to be used for extraction of soil water having low solute concentrations. Soil Sci. Soc. of Am. Proc. 34: 706-708.
Hedin L.O., Annesto J.J. and Johnson A.H. 1995. Patterns of nutrient loss from unpolluted old-growth temperate forests: an evaluation of a biogeochemical theory. Ecology 76: 493-509.
Hibbert A.R. and Troendle C.A. 1988. Streamflow generation. In: Swank W.T. and Crossley D.A. Jr. (eds), Forest Hydrology and Ecology at Coweeta. Sp~ger-Verlag, New York, NY, USA, pp. 111-
* 127. -u Jardine P.M., Weber N.L. and McCarthy J.F. 1989. Mechanisms of dissolved organic carbon adsorption
on soil. Soil Sci. Soc. of Am. J. 53: 1378-1385. t Jardine P.M., Wilson G.V. and Mulholland P.J. 1990. Hydrogeochemical response of a forested water-
shed to storms: effects of preferential flow along shallow and deep pathways. Water Resour. Res. 26: 302 1-3036.
Johnson D.W. and Lindberg S.E. (eds) 1992. Atmospheric Deposition and Forest Nutrient Cycling: a Synthesis of the Integrated Forest Study. Springer-Verlag, New York
Jordan C.F. 1985. Nutrient Cycling in Tropical Forest Ecosystems. Wiley, Chichester, England. Kaiser K. and Zech W. 1998. Rates of dissolved organic matter release and sorption in forest soils. Soil
Sci. 163: 714-725. Kielland K. 1994. Amino acid uptake by arctic plants. Ecology 75: 2373-2383. KIinge H. 1967. Podzol soils: a source of black water in Amazonia Atas do Simposio sobre a Biota
Amazonia, Rio de Janeiro. Limnologia 3: 117-125. Leenheer J.A. 1991. Organic substance structures that facilitate contaminant transport and transfonna-
tions in aquatic sediments. In: Baker R.A. (ed.), Organic Substances and Sediments in Water, Hu- mics and Soils. Vol. 1. Lewis Publishers, Chelsea, MI, pp. 3-22.
Lewis W.M. Jr., Melack J.M., McDowell W.H., McClain M. and Richey J.E. 1999. Nitrogen yields from undisturbed watersheds in the Americas. Biogeochem 46: 149-162.
Marks P.L. 1974. The role of pin cherry in the maintenance of stability in Northern hardwood forest ecosystems. Ecol. Monogr. 44. 73-88.
McDowell W.H. and Fisher S.G. 1976. Autumnal processing of dissolved organic matter in a small woodland stream ecosystem. Ecology 57: 561-569.
McDowell W.H. 1985. Kinetics and mechanisms of dissolved organic carbon retention in a headwater stream. Biogeochem 1: 329-352.
McDowell W.H. and Wood T. 1984. Podzolization: soil processes control dissolved organic carbon in stream water. Soil Sci. 137: 23-32.
McDowell W.H. and Likens G.E. 1988. Origin, composition, and flux of dissolved organic matter in the Hubbard B m k valley. Ecol. Monogr. 58: 177-195.
McGinty D.T. 1976. Comparative root and soil dynamics on a white pine watershed in the hardwood forest in the Coweeta Basin. Dissertation, University of Georgia, Athens, Greece.
Meyer J.L. and Tate C.M. 1983. The effects of watershed disturbance on dissolved organic carbon dy- namics of a stream. Ecology 64: 32-44.
Monk C.D. 1975. Nutrient losses in particulate form as weir pond sediments from four unit watersheds in the Southern Appalachians. In: Howell F.G., Gentry J.B. and Smith M.H. (eds), Mineral Cycling in Southeastern Ecosystems. US Energy Research Development Admin, Washington DC.
Michalzik B. and Matzner E. 1999. Dynamics of dissolved organic nitrogen and carbon in a Central European Norway spruce ecosystem. European J. Soil Sci. 50: 579-590.
$r Moeller J.R., Minshall G.W., Cummins K.W., Petersen R.C., Cushing C.E., Sedell J.R. et al. 1979. Transport of dissolved organic carbon in streams of differing physiographic characteristics. Org. Geochem. 1: 139-150.
v
Tate C.M. and Meyer J.L. 1983. Influence of hydrologic conditions and successional state on dissolved organic carbon export from forested watersheds. Ecology 64: 25-32.
Theng B.K.G. 1979. Formation and Properties of Clay-Polymer Complexes. Hilger, London. Thurman E.M. 1985. Organic Geochemistry of Natural Waters. NijhoffIJunk Publishers, Dordrecht. Uselman S.M., Qualls R.G. and Thomas R.B. 2000. Effects of increased atmospheric CO,, temperature,
and soil N availability on root exudation of dissolved organic carbon by a N-fixing tree (Robinia pseudoacacia L.). Plant Soil 222: 191-202.
Vjtousek PM., Gosz J.R., Grier C.C., Mellillo J.M., Reiners W.A. and Todd R.L. 1979. Nitrate losses from disturbed ecosystems. Science 204: 469-474.
Vose J.M. and Swank W.T. 1992. Water balances. In: Johnson D.W. and Lindberg S.E. (eds), Atmo- e spheric Deposition and Forest Nutrient Cycling: A Synthesis of the Integrated Forest Study. Springer- *: * Verlag, New York pp. 27-49.
Walbridge M.R., Richardson C.J. and Swank W.T. 1991. Vertical distribution of biological and geochem- ical phosphorus subcycles in two southern Appalachian forest soils. Biogeochem 13: 61-85.
Walker J., Thompson C.H., Fergus I.F. and Tunstall B.R. 1981. Plant succession and soil development in coastal sand dunes of subtropical eastern Australia. In: West D.C., Shugart H.H. and Botkin D.B. (eds), Forest Succession, Concepts and Application. Springer-Verlag, New York, pp. 107-131.
Walker T.W. and Syers J.K. 1976. The fate of phosphorus during pedogenesis. Geoderma 15: 1-19. Wood T., Bormann F.H. and Voigt G.K. 1984. Phosphorus cycling in a northern hardwood forest: Bio-
logical and chemical control. Science 223: 3991-3393. Yano Y., McDowell W.H. and Kinner N.E. 1998. Quantification of biodegradable dissolved organic car-
bon in soil solution with flow-through bioreactors. Soil Sci. Soc. Am. J. 62: 1556-1564. Yavitt J.B. and Fahey T.J. 1986. Long-term litter decay and leaching from the forest in Pinus contorra
(lodgepole pine) ecosystems. J. Ecol. 74: 525-545.