sulphur biogeochemistry of agro ecosystems
TRANSCRIPT

Sulphur biogeochemistry of agro-ecosystems
Ramesh Kumar SinghRoll no. 10260
Division of Agronomy, IARI

Contents
Biogeochemistry
Introduction to S biogeochemistry
Processes involved in S biogeochemistry
S Biogeochemistry of agro-ecosystems
Conclusion
Future work

Study of Biogeochemistry
Connected to the role of living organisms in the migration and distribution of chemical elements in the Earth’s crust
Recognizes the importance of the biology and the geology of a particular environment in controlling chemical transformations
Understanding the role each component in regulating elemental cycling

Sulphur biogeochemistry 5th most abundant (by weight) element in the
universe & the 13th most abundant element in
the Earth's crust
Valence states ranging from +6 to -2
Mostly found in sedimentary rocks
Aerobic environments, S weathered from
rocks is converted to its most highly oxidized
form – SO42−
SO42− : assimilated by plant and microbial
SO42− can accumulate, as gypsum in
illuviation zones of semiarid and arid soils
Likens, 2002

Imm
obili
zatio
n
SOM & biomassR-C-S & R-O-SO4
SO4 in solution
Elemental S
Sulphide (S2-)
Mineralization
Oxidation
Reducti
on
Oxidation
Reduction
Minera
lizati
on
Oxidation
Reduction
Sulphide soil mineral
Solution
Solid phase of soilLeaching
Des
orpt
ion
Ads
orpt
ion
Earth surface
Coal & Fuel burning
Sulphur gasesSO2, H2S, COS
Vol
atil
izat
ion
loss
SO2--->SO42-
Direct absorption
Fertilizer & pesticides
Wet & dry deposition
Animal &
Human
Residue
SO42- soil
mineral
Erosion& Runoff
S Bigeochemical Cycle in Agro-ecosystem

Processes involved in S biogeochemistry in agro-ecosystem
Mineralization
Immobilization
Oxidation-reduction
Adsorption-desorption
Mineral weathering
Leaching
Volatilization
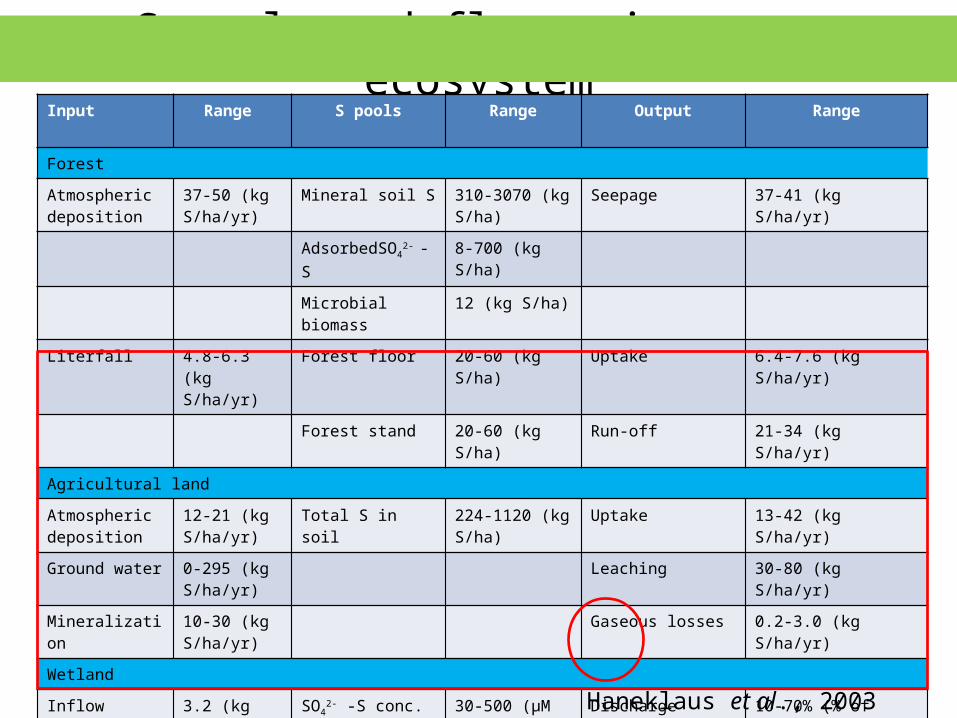
S pools and fluxes in agro-ecosystemInput Range S pools Range Output Range
Forest
Atmospheric deposition
37-50 (kg S/ha/yr)
Mineral soil S 310-3070 (kg S/ha)
Seepage 37-41 (kg S/ha/yr)
AdsorbedSO42- -S 8-700 (kg S/ha)
Microbial biomass 12 (kg S/ha)
Literfall 4.8-6.3 (kg S/ha/yr)
Forest floor 20-60 (kg S/ha) Uptake 6.4-7.6 (kg S/ha/yr)
Forest stand 20-60 (kg S/ha) Run-off 21-34 (kg S/ha/yr)
Agricultural land
Atmospheric deposition
12-21 (kg S/ha/yr)
Total S in soil 224-1120 (kg S/ha)
Uptake 13-42 (kg S/ha/yr)
Ground water 0-295 (kg S/ha/yr)
Leaching 30-80 (kg S/ha/yr)
Mineralization 10-30 (kg S/ha/yr)
Gaseous losses 0.2-3.0 (kg S/ha/yr)
Wetland
Inflow 3.2 (kg S/ha/yr)
SO42- -S conc. in
water30-500 (µM SO4
2-)Discharge 10-70% (% of input)
Burial sediments 0.03-32 (kg S/ha/yr)
H2S 0.01-26 (kg S/ha/yr)
DMS 0.004-1.8(kg S/ha/yr)
Haneklaus et al., 2003

S deficiency in Indian soils
S deficiencies are a critical problem in 40-45% of districts of the country
S deficiency covers 57-64 mha of net sown area
The deficit to the tune of 1 mt/annum
http://www.sulphurindia.com/link3.html
Northern Region (15323)
Western Region (12474)
Eastern Region (10108)
Southern Region (11289)
All India (49194)0
10
20
30
40
50
60
70
Low Medium High
% d
efic
ien
t s
oil s
amp
les

Literature search
Key words: sulfur biogeochemistry, agroecosystem, India

Selected literatureS. No. Country Author (s) Name Journal
1. United Kingdom Hendrik Schafer, Natalia Myronova & Rich Boden
Journal of Experimental Botany
2. India Indranil Das, A. Datta, Koushik Ghosh, Sourov Chatterjee & A. Chakraborty
Archives of Agronomy and Soil Science
3. China Y. Jiang, Y. Zhang, W. Liang Agricultural Journal
4. Columbia Dawit Solomon, Johannes Lehmann, Katrin Knoth de Zarruk, Julia Dathe, James Kinyangi, Biqing Liang & Stephen Machado
Journal of Environmental Quality
5. Sweden K . Boyea , G. Almvist, S. I. Nilsson, J. Eriksen & I . Persson
European Journal of Soil Science
6. China Wei Zhou, Ping He, Shutian Li, Bao Lin Geoderma
7. Thailand N. Janjirawuttkul, M. Umitsu & S. Tawornpruek
Internation Journal of Soil Science
8. India K.N. Das, Anjali Basumatari & Bikram Borkotoki
Journal of the Indian Society of Soil Science
9. India Pradip Kumar Giri, Mintu Sahab, Murari Prasad Halder & Debatosh Mukherjee
International Journal of Plant, Animal and Environmental Sciences
10. India S.P. Singh , Room Singh , M.P. Singh & V.P. Singh
Journal of Plant Nutrition
11. Denmark Jorgen Eriksen Soil Biology & Biochemistry
12. Sweden K. Boye, J.Eriksen , S. I. Nilsson &L. Mattsson
Plant Soil

S biogeochemistry of agro-ecosystems
S biogeochemistry in upland soils Pedogenesis Land use/cropping Fertilization/residue management Pesticide application
S biogeochemistry in flooded soils S emission

Effect of pedogenesis on
sulphur biogeochemistry

Dobrovolsky (1994)
Reservoir 1018 g S
Atmosphere 0.0000028
Seawater 1280
Sedimentary rocks
Evaporites 2470
Shales 4970
Land plants 0.0085
Soil organic matter 0.0155
Total 8720
Reservoirs of S near the surface of the Earth

Pedogenesis of acid sulphate soil
Janjirawuttkul et al., 2011
Sampling site and distribution acid sulphate soil in Thailand

A model of 15 soil profiles
Janjirawuttkul et al., 2011
Profile A: Post-active acid sulphate soilProfile B: Deep potential acid sulphate soilProfile C: Non-acid sulphate soilProfile D: Shallow potential acid sulphate soil

Physical analysis by optical micrograph
Janjirawuttkul et al., 2011
2Cg in L3 profile
BCjg in L4 profile
Bjg2 in L3 profile

Janjirawuttkul et al., 2011
Chemical composition
Profiles
Pyri
te (
%)
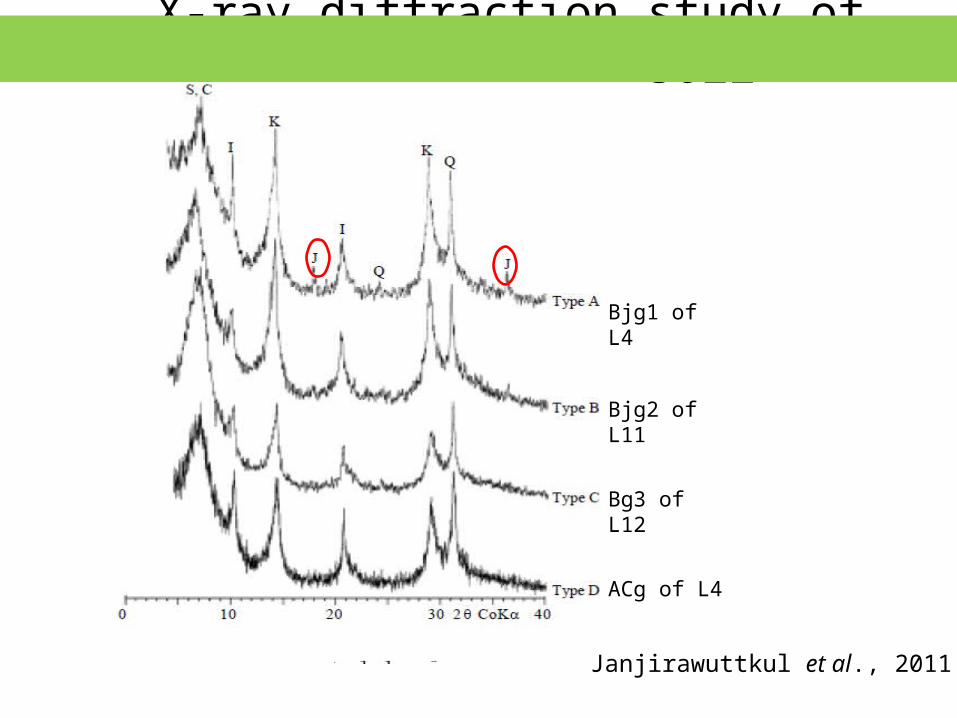
X-ray diffraction study of acid sulphate soil
Bjg1 of L4
Bjg2 of L11
Bg3 of L12
ACg of L4
Janjirawuttkul et al., 2011

Hysteresis curves of sulphate sorption/desorption
Sulphate sorption/desorption behaviour of S deficient soils of WB
Das et al., 2009

S added to the soil (mg/l)
Quantity intensity parameters during sorption run
ToofanganjAeric Haplaquept
DebagramFluventic Ustochrept
KaliagangTypic Fluvaquent
PundibariTypic Ustorthent
SP EBC SP EBC SP EBC SP EBC
30 2.80 0.945 2.36 1.17 2.96 0.765 3.25 1.06
45 3.76 0.595 3.39 0.998 4.16 0.625 4.86 0.820
60 3.84 0.425 4.23 0.826 4.94 0.508 5.90 0.634
75 5.88 0.298 5.16 0.708 5.88 0.425 6.88 0.504
Quantity intensity parameters during desorption run
30 1.76 0.558 1.08 1.48 2.38 0.802 13.86 1.49
45 1.98 0.461 1.55 1.16 3.58 0.656 16.51 0.903
60 2.29 0.302 1.73 0.996 3.56 0.627 17.31 0.814
75 2.25 0.307 2.24 0.929 4.08 0.589 18.20 0.736
Sulphate sorption/desorption behaviour of S deficient soils of WB
Das et al., 2009
SP: Supply parameterEBC: Equilibrium buffering capacity

Effect of land use on sulphur biogeochemistry

Profile distribution of S under different land use Land use: Paddy field (>14 yrs), maize field (14 yrs), fallow field (9 yrs) &
woodland (Poplur, 14 yrs)
Soil total S content under different land uses (g/kg)
Jiang et al., 2007
0 to 5 5 to 10 10 to 20 20 to 30 30 to 40 40 to 60 0
0.05
0.1
0.15
0.2
0.25
0.3
0.35
0.4
0.45
0.5
Paddy field Maize field Fallow field Woodland
Soi
l tot
al S
(g/
kg)
Soil depth (cm)

Relationships of Soil Total Sulphur (STS) with organic carbon (SOC)
Land use Regression model R square (p=<0.01)
Paddy field STS=1.077 × 10⁻³+2.239 × 10⁻²SOC 0.894
Maize field STS=5.301 × 10⁻²+1.709 × 10⁻²SOC 0.833
Fallow field STS=4.776 × 10⁻²+1.525 × 10⁻²SOC 0.974
Woodland STS=8.004 × 10⁻²+1.282 × 10⁻²SOC 0.953
Soil total S storage under different land use
Jiang et al., 2007Soil depth (cm)
S S
tora
ge (
t/ha
)

Soil available S content under different land use
Jiang et al., 2007
Soil
ava
ilab
le S
(m
g/kg
)
Soil depth (cm)Series1
0
10
20
30
40
50
60
70
Paddy field Maize field Fallow field Woodland
0 to 5 5 to 10 10 to 20 20 to 30 30 to 40 40 to 60

Sulphur fractions & S availability index (SAI)in some Rapeseed-growing soils of Assam
District Total S Organic S Non-SO4-S Adsorbed S Available S SAI
Golaghat 614 399.9 170 19.5 37.3 16.3
Jorhat 573 379.9 159 17.8 33.8 15.1
Sibsagar 444 310.0 100 12.0 27.7 10.8
Dibrugarh 552 441.7 80.6 5.10 29.8 12.9
Das et al., 2012
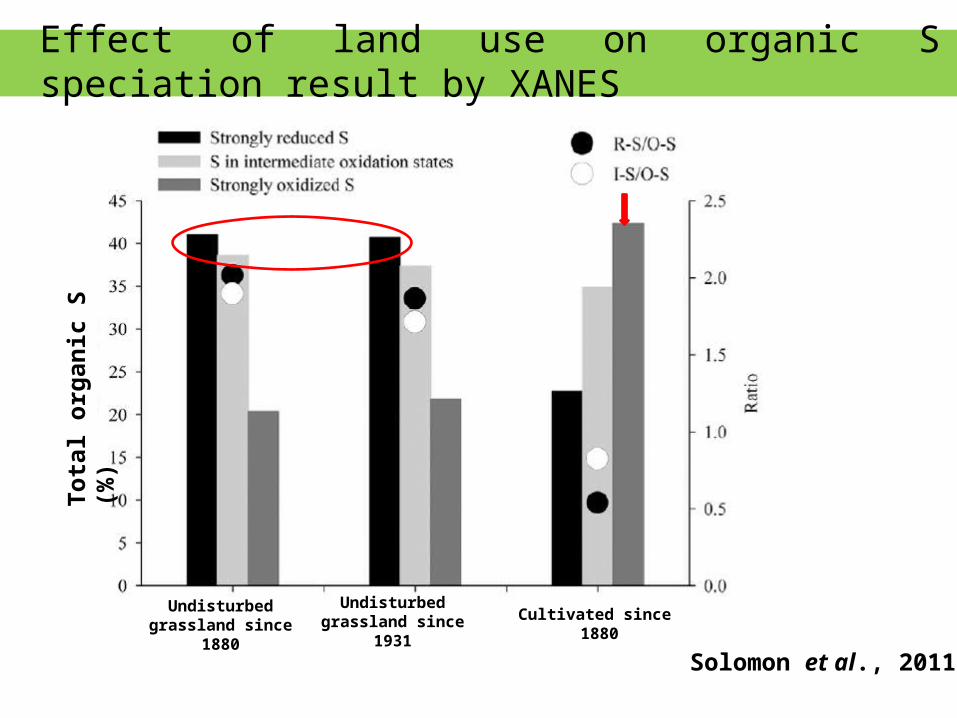
Effect of land use on organic S speciation result by XANES
Solomon et al., 2011
Undisturbed grassland since 1880
Undisturbed grassland since 1931 Cultivated since 1880
Tot
al o
rgan
ic S
(%
)

Sulphur biogeochemistry as affected
by fertilization & residue management

-S FYM -S CR +S FYM +S CR
Plant
-S FYM -S CR +S FYM +S CR
Soil
Specific 35S-activity (% of recovered 35S per mg S) in rye grass biomass and soil fraction
Shoots at 1st (dark grey) and 2nd (light grey) harvest, stubble (white), roots (black)
Sol-S (white with black dots), Org-non prot. S (light grey with black dots), Org-prot. S (dark grey with black dots) & residual S (black with white dots)
Boye et al., 2010
Fo: Silt loam, Or: Sandy loam

Net flow of soil S in soil-plant system (mg S/kg dry soil)
Soil Treatment Inorganic to plants S
Organic to plant S
Inorganic to Organic S
Silt loam (Fo) FYM 0.2 4.1 0.2
CR 0.1 3.0 0.1
Sandy loam (Or)
FYM 3.0 6.7 1.8
CR 1.3 4.8 0.6
Boye et al., 2010
CR- Crop residueFYM: Farm yard manure

S mineralisation and immobilisation over 5 days incorporation of plant materials
Eriksen et al., 2005

Relationship between C:S ratio & lignin on S transformation over 5 days of residue incorporation
Eriksen et al., 2005

Model spectra of S species under organic amended soil
FYM Crop residue
Soil (solid black) Unprotected S (light grey)Protected S (dark grey) Residual S (dashed black)
Boye et al., 2011

Agronomic efficiency (AE), apparent S recovery (ASR) & % response in wheat-soybean cropping sequence
Singh et al., 2014
AE
, AS
R &
% R
espo
nse
S levels

Vertical distribution of S after harvest of wheat & soybean
Wheat
Soybean
Singh et al., 2014

Effect f Pesticides on sulphur
biogeochemistry

Effect of pesticides on available sulphur content in soil
Effect of pesticides on the population of thiosulphate oxidizing bacteria
Giri et al., 2011
Ava
ilab
le S
(m
g/k
g)C
FU
x 1
03 /g
soil

TreatmentsDays after incubation
5th 10th 15th 30th 60th 90th
Control 2.34 2.52 2.81 3.07 3.46 3.16
Endosulfan 1.86 2.14 2.42 2.91 2.79 2.64
Diathane M-45
2.36 3.01 3.39 3.41 3.14 2.97
2, 4-D 2.51 3.12 3.21 3.68 3.94 3.86
Effect of pesticides on aryl sulphatase activity (n kat 100/g) in soil
Giri et al., 2011
Relationship between R2
Available sulphur vs aryl sulfatase activity 0.97
Available sulphur vs thiosulphate oxidizing bacteria 0.98
Aryl sulfatase activity vs thiosulphate oxidizing bacteria 0.98

Sulphur biogeochemistry ofFlooded agro-ecosystem
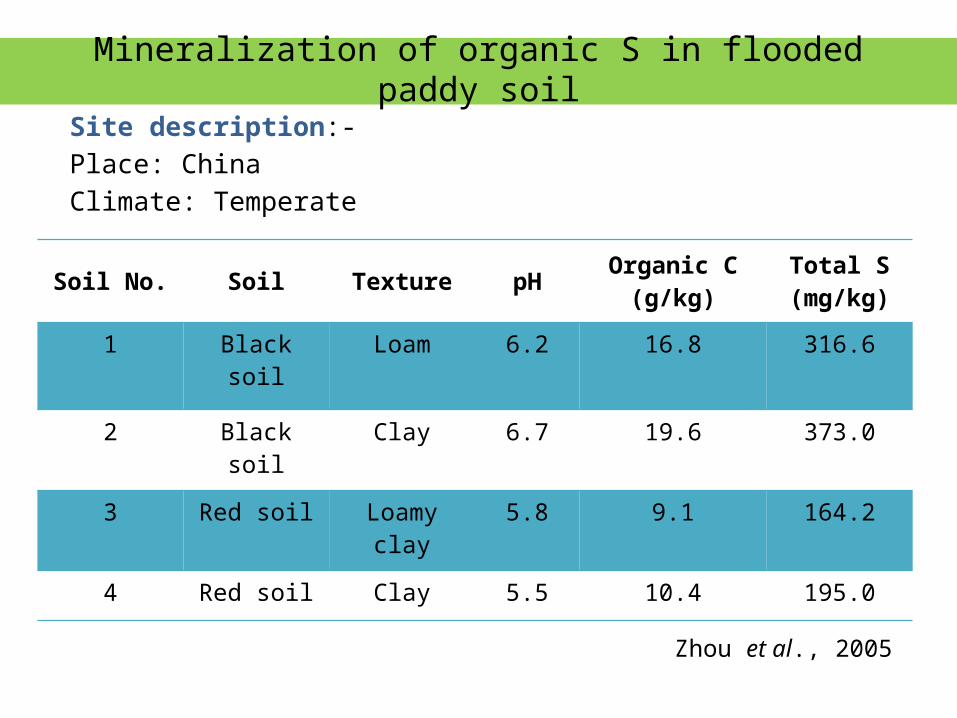
Mineralization of organic S in flooded paddy soilSite description:-
Place: China
Climate: Temperate
Soil No. Soil Texture pH Organic C(g/kg)
Total S (mg/kg)
1 Blacksoil
Loam 6.2 16.8 316.6
2 Black soil Clay 6.7 19.6 373.0
3 Red soil Loamy clay 5.8 9.1 164.2
4 Red soil Clay 5.5 10.4 195.0
Zhou et al., 2005

S mineralization in incubated paddy soil
Incubation period in week
Incubation period in week Incubation period in week
Cum
ulat
ive
min
eral
ized
S (
mg/
kg)
Cum
ulat
ive
min
eral
ized
S (
mg/
kg)
Sulphate-S OI-S
TI-S
Zhou et al., 2005
OI-S: other inorg.STI-S: total inorg. S
Cum
ulat
ive
min
eral
ized
S (
mg/
kg)

Changes in soil S pools in incubated flooded paddy soil
Zhou et al., 2005
C-O-S: ester sulphateNRO-S: non reducible org.-S
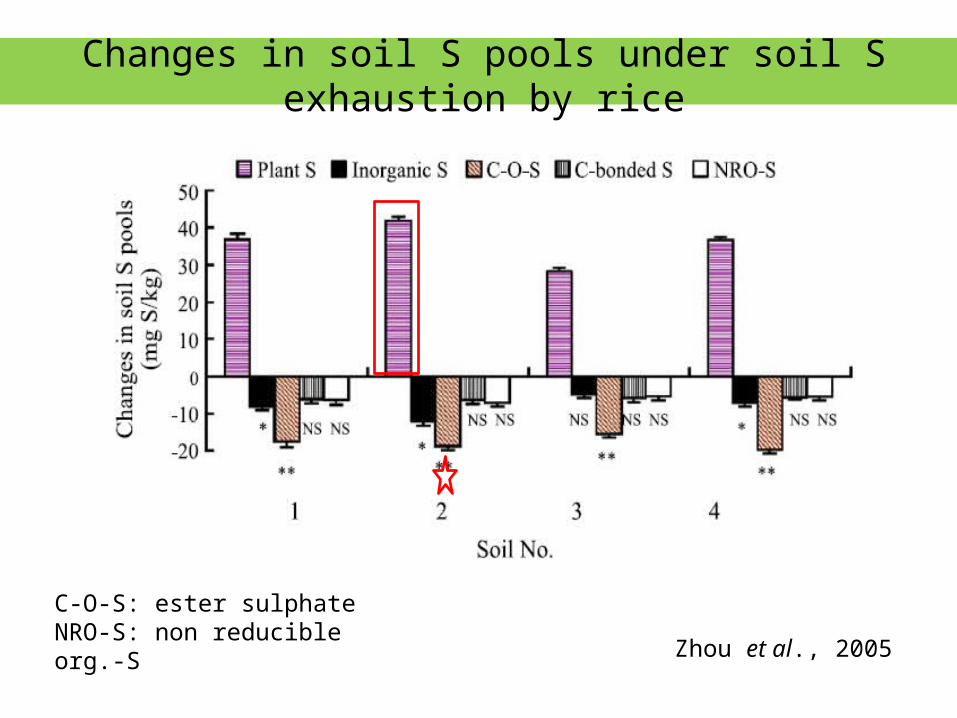
Changes in soil S pools under soil S exhaustion by rice
Zhou et al., 2005
C-O-S: ester sulphateNRO-S: non reducible org.-S

Effect of sulphur emissionon sulphur biogeochemistry

Microbial degradation of DMS & related C1-S compound
Importance:-• Dimethylsulphide (DMS) plays a major role in the global sulphur cycle• Important implications for atmospheric chemistry, climate regulation, and
sulphur transport from the marine to the atmospheric and terrestrial environments
Sources of DMS:-
1. Marine environment
Major pathways of DMS production and transformation in the marine environment
DMS emission into the atmosphere is a source of heat-reflecting aerosols that can serve as cloud condensation nuclei and thereby affect the radiative balance of the Earth, thus linking DMS production to climate regulation. Atmospheric transport of DMS and its oxidation products and deposition in the terrestrial environment provides an important link in the global sulphur cycle.
2. Terrestrial sources• Soils may also emit volatile organic sulphur compounds, including DMS, and fluxes can be enhanced by waterlogging• The decomposition of plant residues in soil, especially those of crucifer species with a high content of sulphur-containing glucosinolates, can generate a number of volatile sulphur compounds3. Production by plant4. Anthropogenic sources
Schafer et al., 2010

Sinks for DMS
Microbial metabolism of DMS
Three principle:-(i) Utilization of DMS as a carbon and energy source(ii) Oxidation to DMSO by phototrophic or heterotrophic organisms(iii) Utilization as a sulphur source
Schafer et al., 2010

Phylogenetic tree
Depicting the genetic diversity of bacterial isolates capable of assimilating carbon from DMS (overlaid in pink) or degrading DMS to DMSO (green). Schafer et al., 2010

Conclusion
Woodland have the potential to make a significant contribution to soil total
S storage as compared to cropping
The majority of mineralized S was derived from the C–O–S pool by rice
plant under flooded condition
Higher hystersis effect was more for S deficient soils, (i.e. Aeric
Haplaquept and Typic Ustorthent soil) adequate S fertilization is needed to
ensure optimum plant growth and yield
The AE and ASR by wheat-soybean system decreased with increase in S
application, while the percent response increased with increase in levels of
S
Conversion of undisturbed grassland towards cultivation leads to formation
of strongly oxidized S

Future work
Challenge of optimizing S availability & use efficiency in cropping systems in
synchrony with plant demand and in the required form and quantity
The emission of DMS from terrestrial and freshwater sources has not been
studied as intensively as that from the marine environment
Future research should include evaluation of all components of S cycle
collaborating with others to asses environmental impact and sustainability of
feedstock production.

Thank you