biogeochemistry wrap-up k. limburg lecture notes, 12 february 2002
TRANSCRIPT

Biogeochemistry wrap-up
K. Limburg lecture notes, 12 February 2002

Outline:
Biogeochemistry of
• carbon cycle
• phosphorus cycle
Relevance at the watershed scale

Carbon is, by definition, the basic element of life on Earth
The major pools:
LOCATIONAmount
(x1015 gC)Carbonate rocks 65,000,000
Fossil fuels 15,600,000Oceans 38,000Soils 1,500Atmosphere* 750Land plants 560
After Schlesinger 1997

After Schlesinger 1997

Schlesinger 1997

World Soil Resources (USDA)

Clearly, one of the major factors driving carbon cycling is primary production – reflected in the annual patterns of atmospheric CO2
Ecosystem
Area
(1012 m2)
Plant B
(kg C/m2)
NPP
(g C/m2/yr)
Soil O.M.
(kg C/m2)
% of soil C in surface
litterTropical forest 18.1 11.4 723 10.4 1.4
Trop. woodland/savanna 24.6 2.0 450 3.7 2.7Temperate forest 9.2 8.0 650 11.8 10.2
Temperate grassland 15.1 3.0 320 19.2 1.0Boreal forest 15.0 9.5 430 14.9 13.4
Desert 18.2 0.3 80 5.6 0.2Tundra 11.0 0.8 130 21.6 2.3
Cultivated land 15.9 1.4 760 12.7 4.1Rock & ice 15.2 0 0 0.1 0.6
Global Primary Production, Biomass, and Soil Organic Matter
After Schlesinger 1997


Global terrestrial NPP
U. Montana EOS Center
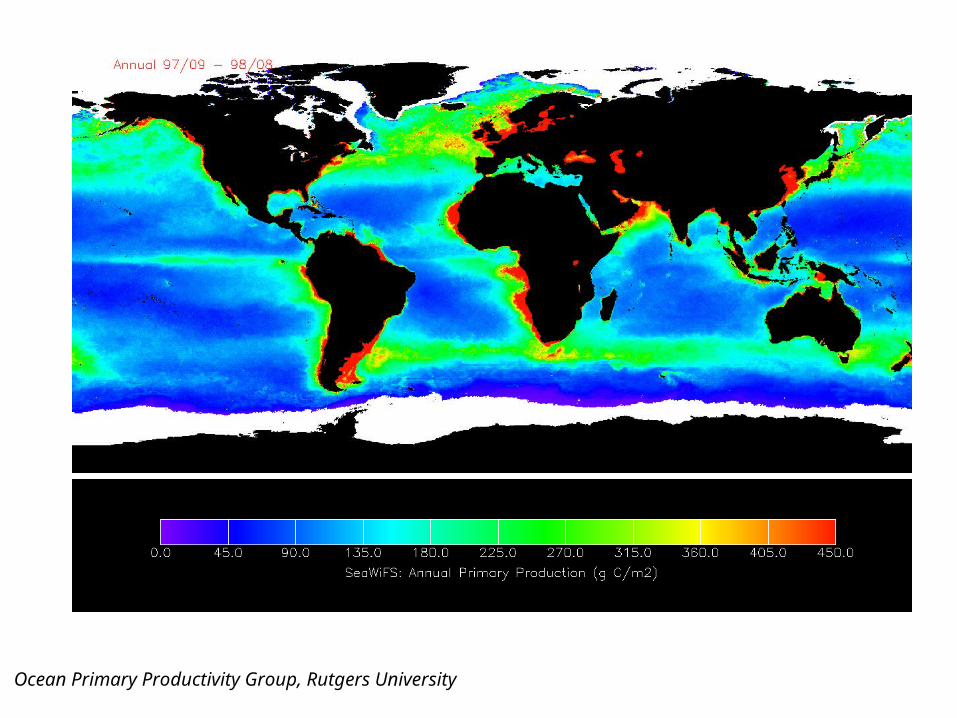
Ocean Primary Productivity Group, Rutgers University

Some important biomolecules:
Lehninger (1977) Bioenergetics
Engines of photosynthesis


Decomposition of plant matter yields complex molecules – humic and fulvic acids
Dr. R. Town, School of Chemistry, Queens Univ. Belfast
Oak Ridge National Laboratory
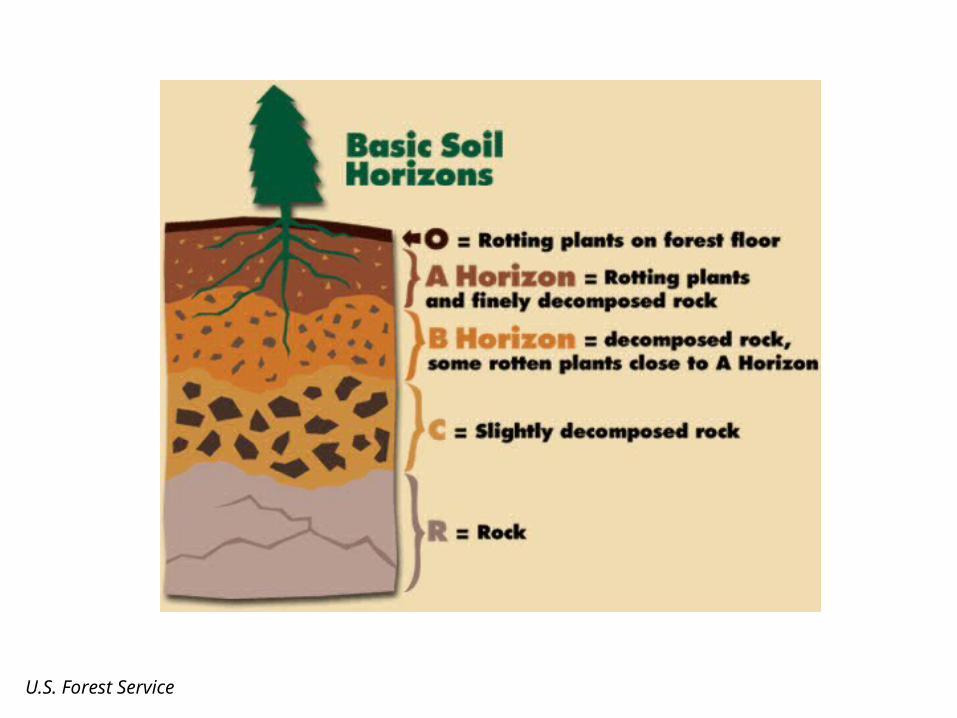
U.S. Forest Service

Skinner et al. 1999. Blue Planet. Wiley.

World Soil Resources (USDA)

World Soil Resources (USDA)

Production/respiration + fossil fuel burning increase in “greenhouse effect”
C-fluxes to the atmosphere

Sources (1015 g C/yr) Sinks (1015 g C/yr)Fossil fuel emissions 6.0
Atmospheric increase 3.2
Net destruction of vegetation 0.9 Ocean uptake 2.0
Unknown 1.7
Sources and sinks of CO2 -- the "missing sink"
After Schlesinger 1997
Limited by mixing rate of deep and surface waters

Sources 1012 g CH4/yrNatural
Wetlands 115Termites 20Oceans 10Freshwater 5Geological 10
AnthropogenicFossil fuel related 100Landfills, sewage 65Animal waste 25Flatulence 85Biomass burning 40Rice paddies 60
Total sources 535
Sinks 1012 g CH4/yr
Reaction with OH 445Removal - stratosphere 40Removal - soils 30
Total sinks 515
Atmospheric increase: 30
Methane production.
Methane (CH4) is another greenhouse gas
Less abundant than CO2, but potentially 25X as effective at trapping heat in atmosphere
Increasing 1%/yr
After Schlesinger 1997

The phosphorus cycle.
Phosphorus (P) is one of the more abundant of elements on earth, but by no means the most biologically available. P
Figure source: “Global Change” course notes, University of Michigan

19

The phosphorus cycle differs from other major elemental cycles in one important way: there is no atmospheric pathway (except for dust transport).
www.toms.nasa.gov

Where does P come from?
The origin of phosphorus in the biosphere comes from volcanic eruptions. Although P is part of many minerals, the most common form is apatite:
Ca5(PO4)3 (F, Cl, OH)
Ca5(PO4)3F - fluorapatite
Ca5(PO4)3Cl – chlorapatite
Ca5(PO4)3OH – hydroxylapatite
The mineral apatite is an essential component of bones and teeth

Phosphorus becomes available in the lithoshere via two main pathways:
Rock weathering
Rock mining
Mechanical weathering is important in extreme environments where rock is exposed to seasonal extremes of temperature, moisture, wind, etc.
Chemical weathering occurs when rocks and soils react with acids and oxidizing agents. Typically, minerals are dissolved and ions exist in solution that can be taken up by organisms or, more often, bound in soils. Rates of weathering depend on the mineral types, moisture, temperature, and pH.

One very important chemical reaction that promotes weathering is the carbonation reaction:
H2O + CO2 H+ + HCO3- H2CO3 .
Microbial activity (decomposition of organic matter) can increase the CO2 concentration in soil waters far above its atmospheric concentration (360 ppm or 0.036%).
For example, [CO2] in soils beneath wheat fields in Missouri were reported to reach > 7% (= 70,000 ppm) This sets up a strong gradient that drives the
reaction to the right:
H2O + CO2 H+ + HCO3- H2CO3 (carbonic acid)

Apatite can undergo weathering via a congruent reaction (co-occurs with carbonation) that releases P:
H2O + CO2 H+ + HCO3- H2CO3
Ca5(PO4)3OH + 4H2CO3 5Ca2+ + 3HPO42-
+ 4HCO3- + H2O
The HPO42- is called orthophosphate and is
a form readily taken up by plants.

The availability of orthophosphate is strongly governed by pH:
P is most biologically available at pH values near 7. That’s why farmers have to lime their fields, if they are acidic.

Most P is precipitated into unavailable forms, particularly if oxides of Fe or Al are present.
(Because such oxides are widespread in tropical soils, P is relatively unavailable there.) • P bound by FeOH or AlOH is termed occluded because it is held in the interior of the oxide crystals and is thus biologically unavailable.
• Nonoccluded P forms can be bound onto the surfaces of soil minerals.

Over a long period of time, the weathering of apatite goes from occluded and nonoccluded forms being most abundant, to occluded and organic-P forms (i.e., biologically fixed P). Very old weathered soils are called laterites (clay-like soils) and contain essentially no available P.
Photo: J.R. Smyth, U. Colo.

Other important features of soil chemistry that determine rates of chemical weathering include
• cation exchange capacity (important in temperate soils) affecting soil buffering
• anion adsorption capacity (mostly important in tropical soils)
Phosphate anion (PO43-) is one of the most
strongly adsorbed onto tropical soil particles, which explains its low bioavailability.
P in many tropical ecosystems is thus almost exclusively recycled organic P.

Phosphate rock mining – the other source of P
Phosphate ore deposits are fairly widespread throughout the continents, and so are available for mining.
Global production (mining) of phosphate rock from 1995-1999 averaged 138.8 x 10⁶ metric tons, equivalent to around 19 x 106 metric tons of P.

The US is the single largest producer of mined phosphate (27.3% of world production, 1995-99), and these come from 18 mines. However, 86% of this production comes from 12 mines in Florida and 1 mine (the world’s largest phosphate mine) in Beaufort, North Carolina.
Photos: Aurora Potash Corp of Saskatchewan

Phosphorus Mining in the US 1970-99
0
10,000
20,000
30,000
40,000
50,000
60,000
1970 1975 1980 1985 1990 1995 2000
Me
tric
to
ns
0
5
10
15
20
25
30
35
(source: USGS)
Do
llars
Production Value ($ per metric ton f.o.b.)
Most (93%) is used to produce chemical fertilizers and animal feed supplements. So-called superphosphate is produced by crushing the parent rock, mixing it into a slurry with H2SO4, and extracting the phosphate.
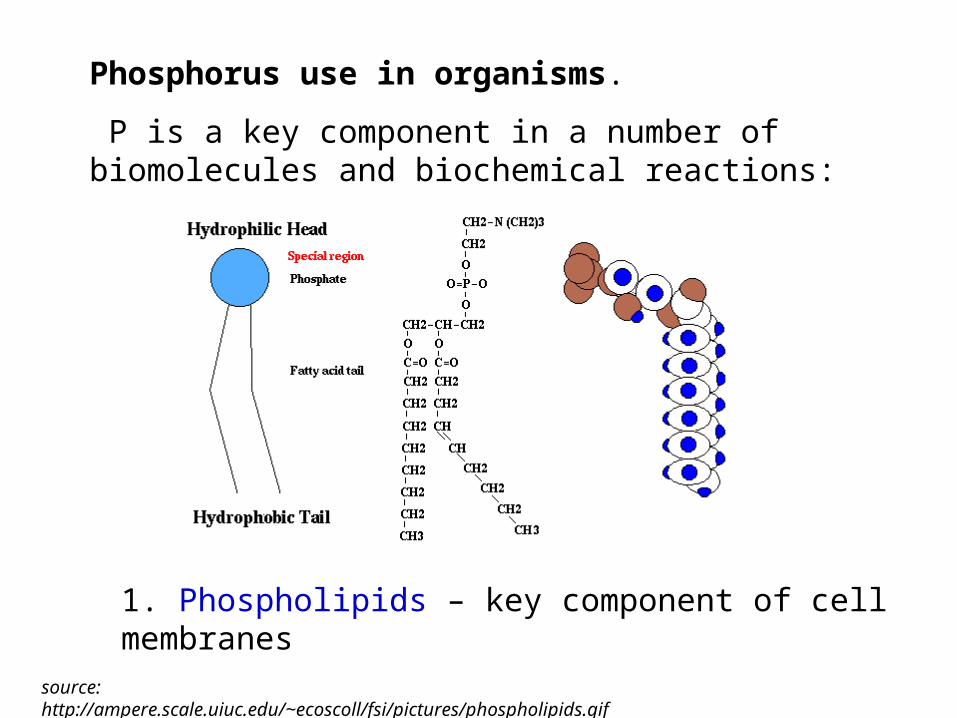
Phosphorus use in organisms.
P is a key component in a number of biomolecules and biochemical reactions:
1. Phospholipids – key component of cell membranes
source: http://ampere.scale.uiuc.edu/~ecoscoll/fsi/pictures/phospholipids.gif

2. DNA, RNA
Phospho-diester bridges link nucleotides
3. ATP, ADP, AMP – the energy molecules of organisms

Because P is involved in important biochemical processes, and because it can be unavailable due to soil chemical characteristics, it is often a limiting nutrient. Continents Rivers Element
Surficial rock conc. (mg/g)
Soil concentration (mg/g)
Particulate conc. (mg/g)
Dissolved Conc. (mg/L)
Particulate load (106 tons/yr)
Dissolved load (106 tons/yr)
Al 69.3 71.0 94.0 0.05 1457 2 Ca 45.0 15.0 21.5 13.4 333 501 Fe 35.9 40.0 48.0 .04 744 1.5 K 24.4 14.0 20.0 1.3 310 49
Mg 16.4 5.0 11.8 3.35 183 125 Na 14.2 5.0 7.1 5.15 110 193 Si 275.0 330.0 285.0 4.85 4418 181 P 0.61 0.8 1.15 0.025 18 1.0
(after Schlesinger, 1997)

Redfield’s (more complete) stoichiometric equation of photosynthesis in the ocean plankton:
106CO2 + 16NO3- + HPO4
2- + 122H2O + 18H+
(CH2O)106(NH3)16(H3PO4) + 138O2 .
Redfield ratio:
106 atoms C per 16 atoms N per 1 atom P.
This ratio is a good indicator of nutrient limitation, at least in aquatic ecosystems.
P required for primary production:

What’s important about C, N, P, and other elements in a watershed context?• patterns of production
• nutrient transformation (what chemical species, and where are they?
• nutrient transfers (fluxes)
• nutrient ratios
• structural influences on fluxes
• biotic influences on fluxes

What’s important about C, N, P, and other elements in a watershed context?• knowledge of the effects of:
• land use
• land use change
• position in the landscape (?)
• location of “hot spots” (?)