economic impacts of a 65 ppb national ambient air … naaqs in the range of 65 ppb to 70 ppb, in...
TRANSCRIPT

Economic Impacts of a 65 ppb National Ambient
Air Quality Standard for Ozone
Prepared for:
National Association of Manufacturers
February 2015

pPro
NERA Economic Consulting
Project Directors
David Harrison, Jr., Ph.D.
Anne E. Smith, Ph.D.
Project Team
Scott Bloomberg
Sugandha Tuladhar, Ph.D.
Andrew Stuntz
Conor Coughlin
Julia Greenberger
Carl McPherson
Christopher D’Angelo
Mei Yuan, Ph.D.
NERA Economic Consulting
200 Clarendon St, 11th Floor
Boston, Massachusetts 02116 Tel: +1 617 927 4500
Fax: +1 617 927 4501
1255 23rd St, NW, Suite 600
Washington, D.C. 20037
Tel: +1 202 466 3510 Fax: +1 202 466 3605
www.nera.com

pPro
NERA Economic Consulting
Report Qualifications/Assumptions and Limiting Conditions
Information furnished by others, upon which all or portions of this report are based, is believed
to be reliable, but has not been independently verified, unless otherwise expressly indicated.
Public information and industry and statistical data are from sources we deem to be reliable;
however, we make no representation as to the accuracy or completeness of such information.
The findings contained in this report may contain predictions based on current data and historical
trends. Any such predictions are subject to inherent risks and uncertainties. NERA Economic
Consulting accepts no responsibility for actual results or future events.
The opinions expressed in this report are valid only for the purpose stated herein and as of the
date of this report. No obligation is assumed to revise this report to reflect changes, events or
conditions, which occur subsequent to the date hereof. The opinions expressed in this report are
those of the authors and do not necessarily represent the views of NERA Economic Consulting,
other NERA consultants, or NERA’s clients.
All decisions in connection with the implementation or use of advice or recommendations
contained in this report are the sole responsibility of the client. This report does not represent
investment advice nor does it provide an opinion regarding the fairness of any transaction to any
and all parties.

pPro
NERA Economic Consulting
1
ECONOMIC IMPACTS OF A 65 PPB NATIONAL AMBIENT AIR
QUALITY STANDARD FOR OZONE
This study evaluates the potential compliance costs and impacts on the U.S. economy if the U.S.
Environmental Protection Agency (EPA) were to set a National Ambient Air Quality Standard
(NAAQS) for ozone of 65 parts per billion (ppb). Employing our integrated energy-economic
macroeconomic model (NewERA), we estimate that the potential emissions control costs could
reduce U.S. Gross Domestic Product (GDP) by about $140 billion per year on average over the
period from 2017 through 2040 and by about $1.7 trillion over that period in present value
terms.1 The potential labor market impacts represent an average annual loss employment income
equivalent to 1.4 million jobs (i.e., job-equivalents).2
These results represent updated values from the results in our July 2014 report (NERA 2014),
which developed estimates of the potential costs and economic impacts of achieving a 60 ppb
ozone standard using the best information then available. In November 2014, the U.S.
Environmental Protection Agency (EPA) released updated emissions and cost information
supporting their proposal to revise the ozone standard (EPA 2014a); we have used that new
information to update our analysis. Also, given that the proposed rule suggests setting a revised
ozone NAAQS in the range of 65 ppb to 70 ppb, in this update we assess the economic impacts
of a potential 65 ppb ozone NAAQS. This report begins with a summary of the differences
between the information and methodology in our July 2014 report and those used in this updated
study. It then provides summaries of our estimates of the costs and economic impacts of
attaining a potential ozone NAAQS of 65 ppb.
Changes in Data and Methodology Since the July 2014 Report
The methodology used for this study is largely similar to the methodology used in our July 2014
report. This section discusses changes to the three components of our analysis:
1. The methodology for estimating emission reductions. This study used updated EPA
information on the future NOX and VOC emissions levels needed to comply with a
potential 65 ppb standard (rather than a 60 ppb standard as in our July 2014 report).
1 All dollar values in this report are in 2014 dollars unless otherwise noted. The present value reflects impacts from
2017 through 2040, as of 2014 discounted at a 5% real discount rate; this discount rate falls in the 3% to 7% range
recommended in EPA’s Guidelines for Preparing Economic Analyses (2010a, p. 6-19), and it is consistent with the
discount rate used in the NewERA model.
2 “Job-equivalents” is defined as total labor income change divided by the average annual income per job. This
measure does not represent a projection of numbers of workers that may need to change jobs and/or be
unemployed, as some or all of the loss could be spread across workers who remain employed, thereby impacting
many more that 1.4 million workers, but with lesser impacts per worker.

pPro
NERA Economic Consulting
2
Additionally, we used updated cost and effectiveness information about emission controls
that have been identified by EPA.
2. The methodology for estimating compliance costs. We updated the costs of the known
controls that EPA identified to attain the 65 ppb standard using EPA’s new cost data.
However, even for a 65 ppb standard, more than half of the emissions reductions needed
across the country would come from measures that EPA still has not identified. Using
the same evidence-based approach for developing a cost curve that we used in our July
analysis (but using the more recent inventory data, and updating the calculations for a
later year of compliance spending), we calculated the costs of the set of further emissions
reduction needs that EPA has left unidentified in its current analysis. We also updated all
dollar figures from 2013 to 2014 dollars.
3. The methodology for estimating economic impacts. We used the same version of
NERA’s NewERA macroeconomic model as our previous study to estimate the economic
impacts of our estimated costs for reducing emissions in the amount necessary to attain a
65 ppb ozone standard. In contrast to EPA’s analysis, we excluded the proposed EPA
Clean Power Plan rule from our modeling baseline.
In our July 2014 report, we performed a sensitivity analysis on the possibility that nonattainment,
especially in rural areas of the U.S., could create barriers to continued growth in oil and gas
extraction. A national policy question that remains in a state of flux is whether or not new
permitting requirements hinder growth in energy production. A tightened ozone standard has the
potential to cause nonattainment areas to expand into relatively rural areas, where there are few
or no existing emissions sources that could be controlled to offset increased emissions from new
activity. If nonattainment expands into rural areas that are active in U.S. oil and gas extraction, a
shortage of potential offsets may translate into a significant barrier to obtaining permits for the
new wells and pipelines needed to expand (or even maintain) our domestic oil and gas
production levels. The sensitivity analysis in our July 2014 report resulted in much larger natural
gas price effects, and raised macroeconomic impacts of our base case by about 30 to 50%.
Limitations of time have prevented us from conducting a similar sensitivity analysis for this
update.
Methodology for Estimating Emission Reductions
The July 2014 report relied on projected 2018 baseline VOC and NOX emissions and EPA
information from its 2008 and 2010 Regulatory Impact Analyses (RIAs) to estimate reductions
required for all regions of the U.S. to come into compliance with a 60 ppb standard. The updated
EPA information that we rely on in this study includes projected 2018 and 2025 base case and
baseline emissions as well as EPA’s estimates of reductions required from the 2025 baseline
emissions to achieve a 65 ppb standard (EPA 2014a-g). We use the updated EPA estimates of

pPro
NERA Economic Consulting
3
state-by-state emissions reductions from the 2025 baseline as the principal basis for our estimates
of NOX emissions levels that would allow a 65 ppb standard to be attained nationwide.3 In order
to reach and maintain this level of NOX emissions consistent with a 65 ppb ozone concentration,
states would need to reduce emissions at existing sources and prevent any net increases in
emissions from new or expanded sources. We also rely on EPA’s revised data on the cost of
emissions reductions for “known” control measures, which are provided by source sector and
state.
Our methodology for estimating costs of emission reductions is similar to our July 2014 study. In
both studies, we substituted our base case estimates of electricity generating unit (EGU)
emissions for those of EPA, for consistency with our economic impact model, which estimates
costs from EGU emissions reductions endogenously. As before, we adopted EPA’s cost
estimates for those controls that EPA identifies as “known”—that is specific controls for which
EPA had developed emission reduction and cost information—and we applied our own more
evidence-based approach for estimating costs for the many required reductions that EPA treats as
“unknown.” For estimating the impacts to the U.S. economy of our estimates of compliance
costs, we assigned each state’s projected cost to specific calendar years, using assessments of
their likely attainment dates. Also consistent with our prior study, we assigned the costs to
specific sectors in each state; for the “known” control measures these assignments were based on
the sector-specific information available in EPA’s data and for the “unknown” control measures,
these assignments were based on emissions inventory data on the relative contribution of each
source category to the remaining emissions in each state.
Methodology for Estimating Compliance Costs
Our methodology for developing estimates of compliance costs in this study is the same as in our
July 2014 report, although of course the numerical values are different reflecting the additional
information now available. As noted, EPA developed updated estimates of the annualized costs
from “known” controls, and we used this updated information on “known” controls.
As in the July 2014 analysis, emission reductions from “known” controls were not sufficient to
achieve attainment, in this case with a 65 ppb ozone standard. EPA has filled the gap with a
rough estimate of costs of “unknown” controls, i.e., controls for which no cost information was
developed. In contrast to the two cost estimation methodologies presented in its 2008 and 2010
RIAs, this time EPA used a single simplistic assumption that annualized control costs for these
“unknown” controls would be equal to $15,000 per ton, regardless of the state, the sector, or the
amount of emission reduction required. This estimate was not based upon any evidence-based
3 We focused our analysis on NOX emissions, but we also included EPA’s estimates of VOC emission control costs
in our modeling.

pPro
NERA Economic Consulting
4
analyses of the nature of the emissions that remain after “known” controls are in place, or of the
costs of potential additional controls for these sources.
Our compliance cost estimates are based upon a synthesis of EPA estimates of emission
reduction, our modifications of EPA’s assumptions regarding baseline reductions, EPA’s
estimates of the costs of “known” controls, and our more detailed estimates of the costs of
“unknown” controls. As in our July 2014 report, our “unknown” cost estimates are more
evidence-based than EPA’s, as we use detailed information on the types of sources that account
for the remaining emissions (EGUs, other point sources, on-road sources, off-road mobile
sources, and area sources) as well as estimates of the potential costs of reducing emissions by
scrapping existing emission sources prematurely. We updated our estimates of the costs of
scrapping light-duty motor vehicles using up-to-date information. We also used updated
information to assess the implications of these dollar-per-ton values for the marginal cost curve
for reductions needed to achieve compliance. As in the July 2014 study, the result is a set of
estimates of the costs for each state to comply with a more stringent ozone standard based upon
the use of specific information to assess “unknown” control costs.
Methodology for Estimating Economic Impacts
Our methodology for estimating economic impacts of the estimated costs of compliance with a
65 ppb ozone standard is the same as in the July 2014 study for a 60 ppb standard, using NERA’s
NewERA macroeconomic model. In the NewERA model, expenditures on emissions control
measures to comply with a new ozone standard reduce investment in other productive sectors of
the economy, which results in decreases in economic output in subsequent years. The capital
costs associated with compliance spending are assumed to be incurred from 2017 until 2036 (the
last projected compliance date, for extreme areas), while each state’s estimated operating and
maintenance (O&M) costs are incurred for all years after the state’s attainment date. Our
economic impact analysis accounts for the effects of costs projected to be incurred through 2040.
NewERA is an economy-wide integrated energy and economic model that includes a bottom-up,
unit-specific representation of the electric sector, as well as a representation of all other sectors
of the economy and households. It assesses, on an integrated basis, the effects of major policies
on individual sectors as well as the overall economy. It has substantial detail for all of the
energy sources used by the economy, with separate sectors for coal production, crude oil
extraction, electricity generation, refined petroleum products, and natural gas production. The
model performs its analysis with regional detail. As discussed above, this particular analysis
uses state-specific cost inputs, and NewERA has been run to assess economic impacts for each
state. Appendix A of the July 2014 report provides a detailed description of the NewERA model.
The macroeconomic analysis requires a baseline that projects economic outcomes in the absence
of the incremental spending to attain the tighter ozone NAAQS. For this study, NewERA’s

pPro
NERA Economic Consulting
5
baseline conditions were calibrated to reflect projections developed by Federal government
agencies, notably the Energy Information Administration (EIA) as defined in its Annual Energy
Outlook 2014 (AEO 2014) Reference case. This baseline includes the effects of environmental
regulations that have already been promulgated as well as other factors that lead to changes over
time in the U.S. economy and the various sectors. Our baseline does not include the effects of
proposed regulations, such as the Clean Power Plan (CPP), although we do include power sector
closures as an available way to attain the NAAQS, to the extent that we find such closures to be
cost-effective elements of each state’s control strategy.4
The July 2014 report and appendices provide details on the various aspects of our methodology,
subject to the changes noted above. Although this report describes results for the United States
as a whole and disaggregated to 11 regions,5 the inputs and the results are built up using detailed
state-specific and sector-specific cost information. The costs and impacts of a more stringent
ozone standard differ substantially among states.
Summary of National Results
Emission Reductions Required to Achieve a 65 ppb Ozone Standard
As Figure S-1 illustrates, national NOX emissions have already been reduced substantially, from
about 25.2 million tons in 1990 to 12.9 million tons in 2013 (EPA 2014b). EPA currently
projects that U.S. NOX emissions will be further reduced by existing rules and regulations to 8.2
million tons by 2025 (supplemented with NewERA’s projected baseline EGU emissions, which
does not include the proposed CPP). Those additional emissions reductions between 2013 and
2025 will involve costs beyond the compliance costs estimated in this study. Economic activity
(as measured by real GDP) in 2025 is projected to be more than double the level in 1990 (CEA
2014, Table B-3 and OMB 2013, Table 2), suggesting that U.S. NOX sources will have been
controlled by more than 80% by 2025, without the additional controls needed to attain a tighter
ozone NAAQS.
4 EPA’s inclusion of the CPP in its baseline was inconsistent with its standard practice of only including
promulgated regulations. This deviation from standard procedure seems particularly unjustified given the enormous
uncertainty in what carbon limits may actually be applied and how states would comply, and hence what NOX
emission reductions might actually occur as a result of this carbon regulation.
5 “U.S.” results are, formally, only for the lower 48 states, and exclude Alaska and Hawaii, as well as Washington
DC. We refer to the lower 48 states as “U.S.” hereafter.

pPro
NERA Economic Consulting
6
Based on the EPA information, total U.S. NOX emissions would have to be reduced to about 6.2
million tons by 2022 and 5.6 million tons by 2036 to meet a 65 ppb standard throughout the
nation. This reduction appears as the red line above in Figure S-1, which also shows our
prognosis of the timing of those reductions, based on our estimates of the likely severity
classifications of the different states.6
Figure S-2 shows our estimates of emissions and emission reductions for the 34 states that would
not attain a 65 ppb under baseline conditions. Despite the extensive controls already expected to
6 Nonattainment areas are given different classifications—marginal, moderate, serious, severe or extreme—
depending on how far out of attainment they are with the NAAQS at the time that designations must be made, two
years after promulgation.
Figure S-1: U.S. NOX Emissions to Attain 65 ppb NAAQS Compared to Historical NOX
Notes: Blue solid line: Estimated historical emissions.
Blue dotted line: Projected further declines through 2018 and 2025 (linear interpolation).
Red line: Emissions to attain 65 ppb on attainment schedule, with states not requiring reductions for 65
ppb held constant after 2025.
The slight increase in U.S. NOX emissions from 2001 to 2002 primarily reflects changes in EPA’s
emission modeling methodology for onroad and nonroad sources (switching from MOBILE6 to the
National Mobile Inventory Model and MOVES)
Source: NERA calculations as explained in text

pPro
NERA Economic Consulting
7
occur in the future, we estimate that about 2.6 million additional tons (in aggregate) would need
to be eliminated by 2022 and an additional 300,000 tons would need to be eliminated by 2036 in
order for those states to come into attainment on schedule. This is equivalent to roughly another
25% reduction from the reduction estimated solely based on those states’ 2025 NOX emissions.
It implies almost a 90% total reduction from all sizes and types of NOX-emitting sources from
the relatively uncontrolled emissions rates in 1990 (after adjusting for growth).
Figure S-3 shows the mix of emission reductions needed across 34 states that EPA projects will
face compliance costs to achieve a 65 ppb ozone standard, including our estimates of the
allocation of “unknown controls” to individual source categories. The dark green shows EPA’s
Figure S-2: NOX Emissions and Categories of NOX Reductions to Attain 65 ppb NAAQS (for 34
Non-Attaining States Only)
Note: Emissions and reductions include only states requiring emission reductions for compliance with a new
ozone NAAQS of 65 ppb in this analysis.
*The NERA Base Case reflects 2022 conditions in each state requiring reductions, with two exceptions:
The Base Case for UT and CA reflect conditions in 2031 and 2036, respectively, based on higher likely
severity classifications in those two states.
Source: NERA calculations as explained in text

pPro
NERA Economic Consulting
8
“known controls” and the light green shows NERA’s evidence-based assumptions regarding
where “unknown controls” will likely come from.7 The remaining sum (shown in the blue bars)
is 3.7 million tons—the aggregate limit for those 34 states to achieve attainment in all the states
projected to be in nonattainment under baseline conditions. This 3.7 million ton aggregate limit
needs to be met by the attainment deadlines, which we assume to be 2022 for all states except
California and Utah, which are assumed to have much later attainment dates.8
As noted above, NERA’s estimates of what the “unknown” controls will comprise includes deep
cuts in the EGU sector, where emissions are concentrated in a few sources and costs per ton are
thus lower than for the many smaller sources among the non-point source categories (i.e., area,
onroad mobile and nonroad mobile). NERA estimates that the remaining “unknown” controls
outside of the EGU sector will involve much smaller incremental percentage reductions than
from EGUs, because these will require programs such as scrapping a portion of vehicles and
other small sources. These controls are also projected to come at a substantially higher cost per
ton than the EGU controls—even though we assume that the small-source scrapping programs
will only target the oldest, highest-emitting of each type of NOX-emitting equipment.9
7 This figure does not show the amount of EGU controls (mostly from installation of SCRs) that EPA has identified
as “known” control in that sector because our analysis shows that one of the most cost-effective forms of control
that EPA has called “unknown” will be to close those EGUs instead. Thus, we assume that the SCRs in EPA’s list
of “known” controls will not actually be installed, and replace their reductions with the much larger reductions that
would come from EGU closures that are cost-effective for meeting a 65 ppb NAAQS (which appear as the light
green area on the EGU bar).
8 States that will be classified as marginal nonattainment in 2017 will face a 2020 attainment date, or will be re-
designated as moderate, and then must be in attainment by 2023. Our analysis suggests that some of the marginal
states may reach attainment by 2020 without incremental controls other than the baseline reductions, and they face
no compliance cost in our analysis. We have assumed that marginal states that would not attain by 2020 under
their baseline forecast will not undertake early costly action to avoid reclassification as moderate, and will attain by
the moderate attainment date along with states that will have been classified as moderate in 2017.
9 For example, our estimates of costs and tons removed by scrappage of light-duty cars is limited to vehicles still on
the road in 2022 that are of a pre-2008 model year (i.e., pre-Tier 2 vehicles). We estimate that those older vintages
of cars will account for about 40% of projected light-duty vehicle emissions in 2022.

pPro
NERA Economic Consulting
9
Compliance Costs to Achieve a 65 ppb Ozone Standard
We estimate that the potential costs of achieving a 65 ppb ozone standard could have a present
value of almost $1.1 trillion as of 2014 (based upon costs incurred from 2017 through 2040), not
including any costs for forcing a massive cutback in generation from coal-fired EGUs to reduce
NOX emissions from the power sector (whose costs are endogenously determined in the
economic impact model).10
These costs are reported in Figure S-4. As a rough point of
10
Although the precise costs of the EGU closures is determined in the model, we used preliminary model runs to
identify which closures would be as or more cost-effective than other unknown controls in our analysis. Based on
this exercise, we estimate that the majority of the NOX emission reductions associated with the EGU closures cost
an average of about $16,000 per ton, and range well above $30,000 per ton in some states. The result of the
constraints that we applied was 34 GW of outright unit retirements, but a substantial number of additional GW of
coal-fired capacity is left on-line but no longer generates in the model. This means that more than 34 GW is
effectively closed down in our analysis.
Figure S-3: NERA Analysis’s Allocation of Additional Reductions Necessary to Attain a 65 ppb
NAAQS to Categories of Emissions Sources in the 34 Non-Attaining States
Source: NERA calculations as explained in text

pPro
NERA Economic Consulting
10
comparison, we estimate that EPA’s annualized cost estimate implies a present value of about
$167 billion.11
The primary difference in our methodologies is the extrapolation method used to
estimate the cost of “unknown” controls; we attempted to assess the kinds of controls that would
be required after “known” controls and based our method on the estimated costs per ton of one
such control (vehicle scrappage), whereas EPA relied on an arbitrary constant value.
Allocating the estimated capital costs to spending in years prior to each state’s projected
compliance deadline, and allocating O&M costs to years after the respective compliance
deadlines, Figure S-5 shows the pattern of annual compliance spending across all states (except
for the endogenously-determined costs of coal unit retirements.)
11
This estimate assumes that EPA’s total annualized cost estimate of $17 billion (including California) is incurred
over a period of 20 years; that these 20 years begin in 2020, except in California where they begin in 2030; that
these annual costs are converted to a present value in 2014 using a real annual discount rate of 5%; and that the
present value is converted from 2011 dollars to 2014 dollars. Note that there are many differences in the EPA and
NERA calculations so this estimate can only be viewed as providing a rough comparison.
Figure S-4: Potential U.S. Compliance Spending Costs for 65 ppb Ozone Standard
Present Value (Billions of 2014$) Cumulative
Capital O&M Total Coal
Retirements
Compliance Costs $430 $630 $1,050 34 GW
Notes: Total is not equal to the sum of capital and O&M due to independent rounding. Present value is from
2017 through 2040, discounted to 2014 at a 5% real discount rate.
Cumulative coal retirements are incremental to baseline. These retirements are primarily due to assumed
emission control measures but may also include indirect electric sector impacts of the ozone standards.
This number is understated because it reflects only those plants that the model literally closes, while
substantial additional GW of coal unit capacity is not reported by the model as “retired” but nevertheless
is forced into a position of near-zero utilization.
Source: NERA calculations as explained in text

pPro
NERA Economic Consulting
11
Potential Impacts on the U.S. Economy and U.S. Households
The potential costs we estimated for a 65 ppb ozone standard are projected to have substantial
impacts on the U.S. economy and U.S. households. Figure S-6 shows the potential
macroeconomic effects as measured by GDP and U.S. household consumption. The 65 ppb
ozone standard is projected to reduce GDP from the baseline levels by about $1.7 trillion on a
present value basis from 2017 to 2040 (as of 2014, and in 2014 dollars) and by $140 billion per
year on a levelized average basis over that period (i.e., when spread evenly over years but
retaining the same present value). Average annual household consumption over those same
years could be reduced by an average of about $830 per household per year.
Figure S-5: Potential Annual U.S. Compliance Spending Costs for 65 ppb Ozone Standard
Notes: Figure does not include compliance costs associated control measures in the electric power sector
(scrappage of coal-fired power plants), which are modeled in NewERA.
Source: NERA calculations as explained in text
Figure S-6: Potential Impacts of 65 ppb Ozone Standard on U.S. Gross Domestic Product and
Household Consumption
Annualized Present Value
GDP Loss (Billions of 2014$) $140/year $1,720
Consumption Loss per Household (2014$) $830/year N/A
Notes: Present value is from 2017 through 2040, discounted at a 5% real discount rate. Consumption per
household is an annualized (or levelized) value calculated using a 5% real discount rate.
Source: NERA calculations as explained in text

pPro
NERA Economic Consulting
12
Figure S-7 focuses on several dimensions of projected impacts on income from labor (“worker
income”) as a result of the 65 ppb ozone standard. Relative to baseline levels, real wages decline
by about 0.6% on average over the period and labor income declines by about 0.9% on average,
resulting in job-equivalent losses that average about 1.4 million job-equivalents. (Job-
equivalents are defined as the change in labor income divided by the annual baseline income for
the average job (see Figure S-7)). A loss of one job-equivalent does not necessarily mean one
less employed person—it may be manifested as a combination of fewer people working and less
income per worker. However, this measure allows us to express employment-related impacts in
terms of an equivalent number of employees earning the average prevailing wage.12
These are
the net effects on labor and include the positive benefits of increased labor demand in sectors
providing pollution control equipment and technologies.
Potential Effects on U.S. Energy Prices
Emissions reduction costs of a 65 ppb ozone standard also is likely to have impacts on U.S.
energy sectors, largely because the more stringent ozone standard is projected to lead to the
premature retirement of many additional coal-fired power plants. Figure S-8 shows average
energy price projections under the baseline and the 65 ppb ozone standard. The average
delivered residential electricity price is projected to increase by an average of 1.7% over the
period from 2017 through 2040 relative to what they could otherwise be in each year (which is
12
The NewERA model, like many other similar economic models, does not develop projections of unemployment
rates or layoffs associated with reductions in labor income. Modeling such largely transitional phenomena requires
a different type of modeling methodology; our methodology considers only the long-run, equilibrium impact
levels.
Figure S-7: Potential Impacts of 65 ppb Ozone Standard on Labor
Avg.
Baseline Annual Job-Equivalents (millions) 156
65 ppb Case:
Real Wage Rate (% Change from Baseline) -0.6%
Change in Labor Income (% Change from Baseline) -0.9%
Job-Equivalents (Change from Baseline, millions) -1.4
Notes: Average (Avg.) is the simple average over 2017-2040. “Job-equivalents” is defined as total labor
income change divided by the average annual income per job. This measure does not represent a
projection of numbers of workers that may need to change jobs and/or be unemployed, as some
or all of the loss could be spread across workers who remain employed
Source: NERA calculations as explained in text
pPro
NERA Economic Consulting
13
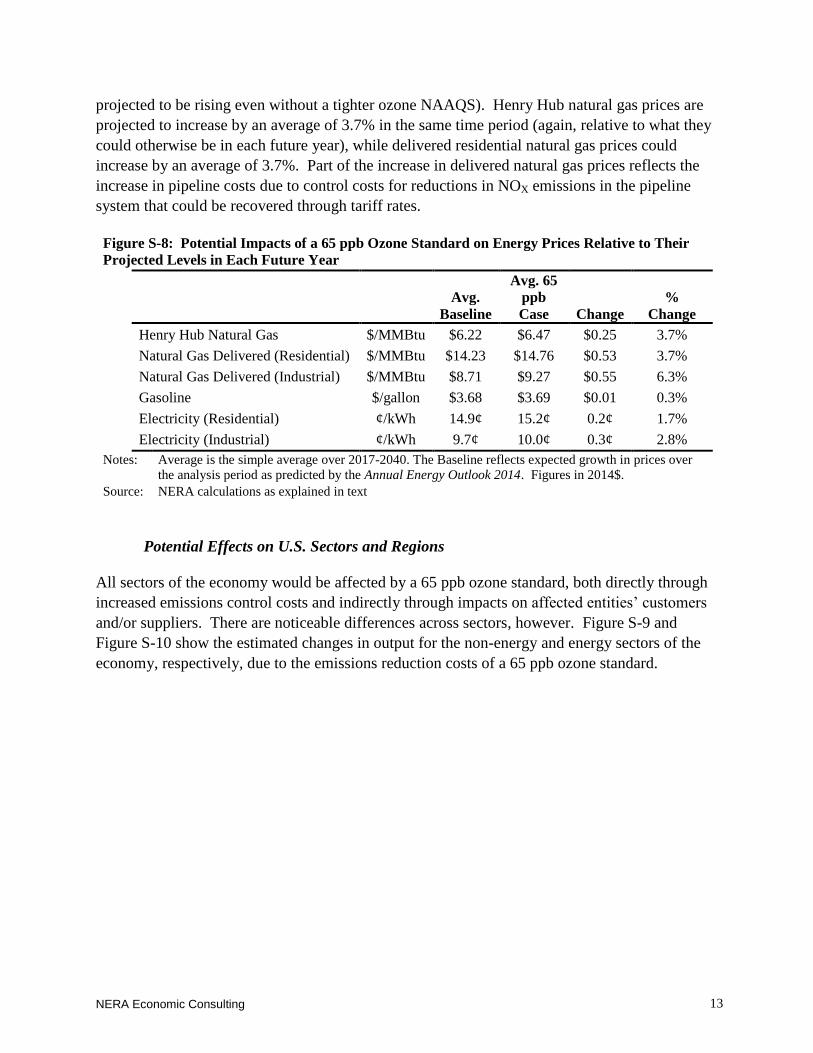
projected to be rising even without a tighter ozone NAAQS). Henry Hub natural gas prices are
projected to increase by an average of 3.7% in the same time period (again, relative to what they
could otherwise be in each future year), while delivered residential natural gas prices could
increase by an average of 3.7%. Part of the increase in delivered natural gas prices reflects the
increase in pipeline costs due to control costs for reductions in NOX emissions in the pipeline
system that could be recovered through tariff rates.
Potential Effects on U.S. Sectors and Regions
All sectors of the economy would be affected by a 65 ppb ozone standard, both directly through
increased emissions control costs and indirectly through impacts on affected entities’ customers
and/or suppliers. There are noticeable differences across sectors, however. Figure S-9 and
Figure S-10 show the estimated changes in output for the non-energy and energy sectors of the
economy, respectively, due to the emissions reduction costs of a 65 ppb ozone standard.
Figure S-8: Potential Impacts of a 65 ppb Ozone Standard on Energy Prices Relative to Their
Projected Levels in Each Future Year
Avg.
Baseline
Avg. 65
ppb
Case Change
%
Change
Henry Hub Natural Gas $/MMBtu $6.22 $6.47 $0.25 3.7%
Natural Gas Delivered (Residential) $/MMBtu $14.23 $14.76 $0.53 3.7%
Natural Gas Delivered (Industrial) $/MMBtu $8.71 $9.27 $0.55 6.3%
Gasoline $/gallon $3.68 $3.69 $0.01 0.3%
Electricity (Residential) ¢/kWh 14.9¢ 15.2¢ 0.2¢ 1.7%
Electricity (Industrial) ¢/kWh 9.7¢ 10.0¢ 0.3¢ 2.8%
Notes: Average is the simple average over 2017-2040. The Baseline reflects expected growth in prices over
the analysis period as predicted by the Annual Energy Outlook 2014. Figures in 2014$.
Source: NERA calculations as explained in text

pPro
NERA Economic Consulting
14
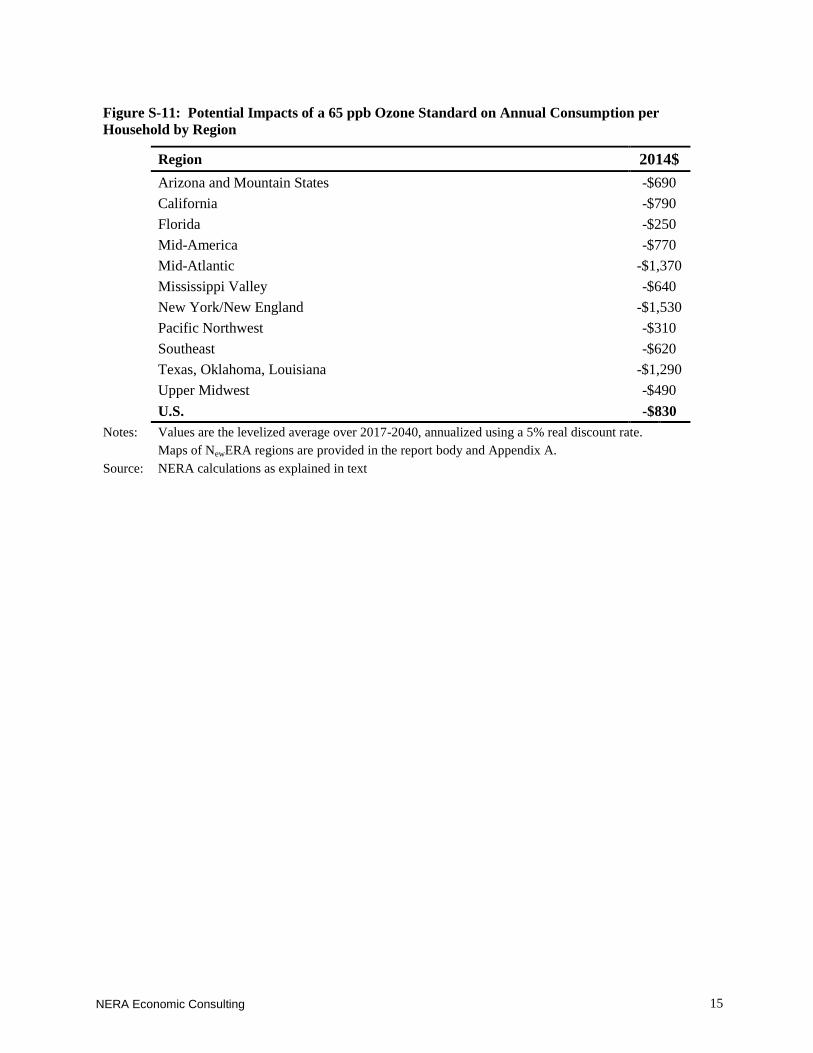
Figure S-11 shows the estimated average annual change in consumption per household for
individual NewERA regions. A region’s attainment costs and its sectoral output mix determine to
a large extent whether a region fares better or worse than the U.S. average, but all regions could
experience lower household consumption.
Figure S-9: Potential Impacts of 65 ppb Ozone Standard on Output of Non-Energy Sectors
(Percentage Changes from Baseline)
Agriculture
Commercial/
Services Manufacturing
Commercial
Transportation
Commercial
Trucking
Average -0.9% -0.4% -0.3% -0.9% -0.5%
(2017-2040)
Note: Values are the simple average of percentage change over 2017-2040. Source: NERA calculations as explained in text
Figure S-10: Potential Impacts of a 65 ppb Ozone Standard on Output of Energy Sectors
(Percentage Changes from Baseline)
Coal Natural Gas Crude Oil/Refining Electricity
Average -28% 3.9% -0.8% -1.5%
(2017-2040)
Note: Values are the simple average of percentage change over 2017-2040. Source: NERA calculations as explained in text
pPro
NERA Economic Consulting
15
Figure S-11: Potential Impacts of a 65 ppb Ozone Standard on Annual Consumption per
Household by Region
Region 2014$
Arizona and Mountain States -$690
California -$790
Florida -$250
Mid-America -$770
Mid-Atlantic -$1,370
Mississippi Valley -$640
New York/New England -$1,530
Pacific Northwest -$310
Southeast -$620
Texas, Oklahoma, Louisiana -$1,290
Upper Midwest -$490
U.S. -$830
Notes: Values are the levelized average over 2017-2040, annualized using a 5% real discount rate. Maps of NewERA regions are provided in the report body and Appendix A.
Source: NERA calculations as explained in text

pPro
NERA Economic Consulting
REFERENCES
NERA Economic Consulting (NERA). 2014. “Assessing Economic Impacts of a Stricter
National Ambient Air Quality Standard for Ozone.” July.
http://www.nera.com/publications/archive/2014/assessing-economic-impacts-of-a-
stricter-national-ambient-air-qu.html
U.S. Energy Information Administration (EIA). 2014. Annual Energy Outlook 2014.
U.S Environmental Protection Agency (EPA). 2014a. Regulatory Impact Analysis (RIA) of the
Proposed Revisions to the National Ambient Air Quality Standards (NAAQS) for Ground-
Level Ozone. http://www.epa.gov/ttnecas1/regdata/RIAs/20141125ria.pdf
U.S Environmental Protection Agency (EPA). 2014b. 2011 and 2025 NOX Emissions County
Sector Comparison.
ftp://ftp.epa.gov/EmisInventory/2011v6/ozone_naaqs/reports/2011ef_2025ef_county_sec
tor_comparison_NOX.xlsx
U.S Environmental Protection Agency (EPA). 2014c. 2011 and 2025 VOC Emissions County
Sector Comparison.
ftp://ftp.epa.gov/EmisInventory/2011v6/ozone_naaqs/reports/2011ef_2025ef_county_sec
tor_comparison_VOC.xlsx
U.S Environmental Protection Agency (EPA). 2014d. 2011, 2018, and 2025 Emissions State
Sector Comparison.
ftp://ftp.epa.gov/EmisInventory/2011v6/ozone_naaqs/reports/2011ef_2018ef_2025ef_stat
e_sector_comparison.xlsx
U.S Environmental Protection Agency (EPA). 2014e. Proposed Clean Power Plan: IPM State-
Level Emissions, Base Case. http://www.regulations.gov/#!documentDetail;D=EPA-HQ-
OAR-2013-0602-0224
U.S Environmental Protection Agency (EPA). 2014f. Proposed Clean Power Plan: IPM State-
Level Emissions, Option 1 State. http://www.regulations.gov/#!documentDetail;D=EPA-
HQ-OAR-2013-0602-0228
U.S Environmental Protection Agency (EPA). 2014g. O3 NAAQS RIA Control Strategy Results
NOX Controls for 65ppb Analysis Incremental to Baseline.
http://www.regulations.gov/#!documentDetail;D=EPA-HQ-OAR-2013-0169-0015

200 Clarendon Street
11th Floor
Boston, MA 02116
617-927-4500
1255 23rd St, NW
Suite 600
Washington, D.C. 20037
202-466-3510
www.nera.com