ecological indicators - uliege.be et al...270 n. luy et al. / ecological indicators 18 (2012)...
TRANSCRIPT
Co
NJa
b
a
ARRA
KTSPMPI
1
Mdlaaec(aoc(pd2
(
1d
Ecological Indicators 18 (2012) 269–277
Contents lists available at SciVerse ScienceDirect
Ecological Indicators
jo ur nal homep age: www.elsev ier .com/ locate /eco l ind
hemical contamination along the Mediterranean French coast using Posidoniaceanica (L.) Delile above-ground tissues: a multiple trace element study
icolas Luya,∗, Sylvie Goberta, Stéphane Sartorettob, Renzo Biondoa, Jean-Marie Bouquegneaua,onathan Richira
MARE Centre, Laboratoire d’Océanologie, Université de Liège, Sart-Tilman B6c, 4000 Liège, BelgiumIFREMER, Zone Portuaire de Brégaillon, 83500 La Seyne-sur-mer, France
r t i c l e i n f o
rticle history:eceived 26 July 2010eceived in revised form 4 November 2011ccepted 7 November 2011
eywords:race elementeagrassosidonia oceanica
a b s t r a c t
Levels of Be, Al, V, Mn, Co, As, Se, Mo, Ag, Sn, Sb, Bi as well as of Cr, Fe, Ni, Cu, Zn, Cd and Pb in Posido-nia oceanica (L.) Delile from the Mediterranean French coast were analysed using DRC ICP-MS. The firsttwelve elements have not been well studied and can be considered to be potential pollutants as a resultof potentially increased levels resulting from anthropogenic activities. Spatial variation and/or compart-mentalization were found for all trace elements. Except for Al, Cr, Fe, Cu and Ag, most trace elementswere preferentially accumulated in photosynthetic tissues, suggesting uptake from the water column.Moreover, for Be, V, Mn, Co, Ni, As, Mo, Sb, Sn and Pb, adult leaves had higher levels than intermediateleaves, suggesting low kinetics of accumulation. Levels in the third intermediate leaf were representative
editerraneanollutionCP-MS
of the average levels of the integral shoot, and thus can be used alone in chemical biomonitoring. Formost of the twelve little-studied trace elements, the background levels of the northwestern Mediter-ranean Sea can be measured, and their spatial variation can be related to anthropogenic activities. Levelsof the seven widely studied trace elements seem to decrease or stabilize over time, probably due to theirreduced anthropogenic use. These observations show that P. oceanica is a sensitive bioindicator for themonitoring of chemical contamination of a large number of trace elements.
. Introduction
Posidonia oceanica (L.) Delile, the endemic seagrass of theediterranean, forms monospecific meadows from the surface to
epths of 40 m (Boudouresque and Meinesz, 1982). They coverarge areas in clear coastal regions estimated to be between 2.5nd 5 million hectares (Pasqualini et al., 1998). They constituten engineering ecosystem playing major ecological, geological andconomic roles, but are sensitive to human disturbances such asoastal development, pollution, high water turbidity and trawlingBoudouresque et al., 2006). In 2000, P. oceanica was selected as
Biological Quality Element (BQE; Med-GIG, 2009) representativef aquatic Mediterranean angiosperms for monitoring the ecologi-al status of coastal waters under the Water Framework DirectiveEC, 2000). Therefore, many indices based on physiological, mor-
hological and/or structural descriptors of P. oceanica have beeneveloped, e.g. POMI (Romero et al., 2007a,b), PREI (Gobert et al.,009), BiPo (Lopez y Royo et al., 2010), etc.∗ Corresponding author. Tel.: +32 43 66 28 36; fax: +33 43 66 51 47.E-mail addresses: [email protected] (N. Luy), [email protected]
J. Richir).
470-160X/$ – see front matter © 2011 Elsevier Ltd. All rights reserved.oi:10.1016/j.ecolind.2011.11.005
© 2011 Elsevier Ltd. All rights reserved.
Metals are regarded as serious pollutants of the aquatic environ-ment because of their toxicity, their persistence, their difficulty inbiodegrading and their tendency to concentrate in aquatic organ-isms (Ikem and Egiebor, 2005). Many metalloids (As, Sb, etc.) andsome non-metals (Se, etc.) can also be considered as serious pol-lutants of the aquatic environment. However, some of these areneeded for seagrass subsistence (micronutrients) such as Fe, Mn,Co, Ni, Cu and Zn (Babula et al., 2008). In agreement with Duffus(2002), we use the term “trace element” (TE) for those elementsthat are present in trace amounts in the environment.
Levels of some TEs (Cd, Hg, Cu, Cr, Pb, Zn, Fe and Ni) have beenlargely studied in P. oceanica tissues (see Supplementary Table)and both below- and above-ground tissues have been analysed. Inparticular, P. oceanica leaves can give an indication of TE levels inseawater over a short period with accuracy (Pergent-Martini et al.,2005). Furthermore, Romero et al. (2007b) suggested that the thirdintermediate leaf alone (bearing few epiphytes and between 100and 150 days old) can be used for TE monitoring instead of theintegral shoot.
The development of new equipment and techniques now allowsus to measure many TEs found at very low levels (Wieser andSchwieters, 2005); moreover, recent technological and industrialdevelopments still modify levels of TEs naturally present in the

2 Indica
eonabt(pesimS
tCctavNtf
2
2
wPCs
2
tfw(a(tmTtvuIerpm
2
p(ila1
5
70 N. Luy et al. / Ecological
nvironment (Ravindra et al., 2004). Environmental quantificationf other previously unstudied potential pollutants is henceforthow possible and relevant: (i) V is used in many fields: railway,erospace, catalysis, etc. It is found in large amounts in hydrocar-on fuels, the main source of this pollutant, and it can be used as aracer for petrol pollutions such as oil spills (Amiard et al., 2003);ii) Sb is a component of many alloys, and is often used as fire-roofing additive. This TE is released in large amounts during itsxtraction, smelting, as well as during waste incineration and fos-il energy combustion (Filella et al., 2002); (iii) Bi is mainly usedn specialized industry; Karlsson et al. (2007) determined that the
ajor worldwide atmospheric deposition of Bi took place after theecond World War.
The objectives of this study were firstly to measure levels of TEshat were little or never studied in P. oceanica tissues (Be, Al, V, Mn,o, As, Se, Mo, Ag, Sn, Sb and Bi) along the Mediterranean Frenchoast, to examine compartmentalization and spatial variation, ando evaluate the potential use of P. oceanica above-ground tissuess bioindicators. Secondly, we investigated spatial and temporalariations of TEs classically investigated (Cd, Cu, Cr, Pb, Zn, Fe andi), as well as their compartmentalization. Finally, the ability to use
he P. oceanica third intermediate leaf instead of the integral shootor the biomonitoring of these nineteen TEs was investigated.
. Materials and methods
.1. Sampling location and design
In April 2007, 15 shoots of P. oceanica, each spaced apart 5 m,ere sampled at a depth of 15 ± 1 m at 18 sites located along the
rovence-Alpes-Côte d’Azur (PACA) and Corsican coasts (Fig. 1).ollected samples were placed in acid-rinsed sample bags andtored at −28 ◦C.
.2. Sample treatment
For each site, P. oceanica shoots were dissected according tohe method proposed by Giraud (1979). Epiphytes were scrapedrom leaves using a ceramic scalpel blade. Furthermore, each shootas sorted and recorded as follows: third intermediate leaves
3IL), other intermediate leaves (OIL), blades of adult leaves (BAL)nd sheaths of adult leaves (SAL). Sorted tissues were lyophilizedBenchTop 3L, VirTis Company Inc.), weighed and then groupedogether (by site) to constitute pools of dried tissues weighing a
inimum of 300 mg (mostly 5 pools, sometimes down to 3 for SAL).hese pools were ground with liquid nitrogen in an agate mor-ar and then re-lyophilized to eliminate condensed ambient waterapour. Dried powders were finally mineralized in Teflon bombssing a closed microwave digestion labstation (Ethos D, Milestone
nc.). Two digestion procedures were performed: a nitric acid min-ralization (HNO3/H2O2; all TEs except Sn and Sb) and an aquaegia mineralization (HNO3/HCl; Sn and Sb). Acids and hydrogeneroxide (suprapure grade) were purchased from Merck. Finally,ineralisats were diluted to an appropriate volume of 50 cm3.
.3. Trace element analysis
Trace element levels were determined by inductively coupledlasma mass spectrometry (ICP-MS) using dynamic reaction cellDRC) technology (ICP-MS ELAN DRC II, PerkinElmer Inc.). Thisnstrument uses ion-molecule reactions to overcome spectral over-
aps and requires selection of the appropriate reaction gas (Olesiknd Jones, 2006): no reaction gas in standard mode (for 9Be, 95Mo,07Ag, 111Cd, 118Sn, 121Sb, 208Pb and 209Bi), NH3 (for 27Al, 51V, 52Cr,4Fe, 55Mn, 59Co, 60Ni and 66Zn) or H2 (for 75As and 78Se) in DRCtors 18 (2012) 269–277
modes. Analytical accuracy was checked by analysing certified ref-erence materials (Table 1A): BCR 60 (Lagarosiphon major), BCR 62(Olea europaea), GBW 07603 (brush branch and leaves) and V463(maize).
2.4. Statistical analysis
General trends of TE levels (compartmentalization and shootaverage levels, Table 1B) were calculated for all sites together,excluding extreme values: only values between the 10th and 90thpercentiles were included. Each replicate (Fig. 2 Posidonia oceanicacompartmentalization and Table 1B tissue trends) represents theTE level of an individual pooled subsample, obtained by poolingthe same tissues from 3 shoots (up to 5 for SAL) from the samesite. TE levels measured in the 4 compartments of P. oceanica werebalanced by their respective dry weight to calculate shoot TE lev-els (Table 1B shoot trends, Table 1C). For each element, detectiondecision (LC), detection limit (LD) and quantification limit (LQ) werecalculated according to Currie (IUPAC et al., 1998; Currie, 1999)or Grinzaid et al. (1977), depending on their specific blank distri-bution. One-way analysis of variance (ANOVA) followed by TukeyHSD pairwise comparison test of means with unequal n’s (p < 0.05)were performed (Fig. 2 and Table 1B tissue trends), after testing forhomogeneity of variances (Levene test) on raw or log-transformeddata. Non-parametric analysis of variance (Kruskal–Wallis test)was only performed for V, Sb and Pb (Table 1B; assumptions priorto unbalanced ANOVAs not encountered), followed by Dunn pair-wise comparison test of means (p < 0.05) (STATISTICA 8.0, StatSoftInc.).
3. Results and discussion
Based on general trends of average levels found in shoots(Table 1B), TE levels decreased in the following order: Zn, Fe,Al > Mn > Ni > Cu > V > Co, Cd, Pb, Mo, As > Ag > Cr, Se, Sb > Sn > Bi, Be.This sequence completes and confirms the sequence commonlyobserved in P. oceanica: Zn > Ni > Cu > Cd, Pb > Cr (Pergent-Martini,1994; Warnau et al., 1995; Schlacher-Hoenlinger and Schlacher,1998; Campanella et al., 2001; Conti et al., 2010).
3.1. Posidonia oceanica compartmentalization
General trends of compartmentalization are reported inTable 1B. Additionally, compartmentalization of V, Zn, Cr and Cu areshown for the four contrasted sites being compared, with respect totheir TE levels (Fig. 2). Compartmentalization profiles of the otherTEs are similar to one of these four characteristic profiles.
Most TEs were preferentially concentrated in photosynthetictissues (i.e. 3IL, OIL and BAL) rather than in non-photosynthetictissue (SAL): V, Mn, Co, Ni, Zn, As, Se, Mo, Cd, Sb, Pb and Bi (levelstwice as high, except for As and Se). Furthermore, Mn, Co, Ni, As,Mo, Sb, Pb, Bi, and particularly V, were present in higher levels inBAL (e.g. V in Fig. 2a), contrary to Zn, Se and Cd, present in similarlevels in all photosynthetic tissues (e.g. Zn in Fig. 2b), regardless ofsite. In the particular case of Be, the general trend of compartmen-talization was not confirmed when observing sites independentlyfrom each other. For Sn, a signal could be clearly measured only inBAL. On the other hand, Al, Fe, Ag and Cu were preferentially accu-mulated in non-photosynthetic tissues. More precisely, Al, Fe andAg, as well as Cr levels were systematically higher in SAL only insites where the highest levels were recorded (e.g. Cr in Fig. 2c). Con-cerning Cu, levels in SAL were systematically higher than in other
tissues, but differences were quite small (Fig. 2d).These findings are in agreement with previous studies: Pergent-Martini (1994) for Cr, Fe, Cu, Zn, Cd and Pb; Campanella et al. (2001)for Cr, Zn, Cd and Pb, but not for Cu; Kljakovic-Gaspic et al. (2004)
N.
Luy et
al. /
Ecological Indicators
18 (2012)
269–277
271
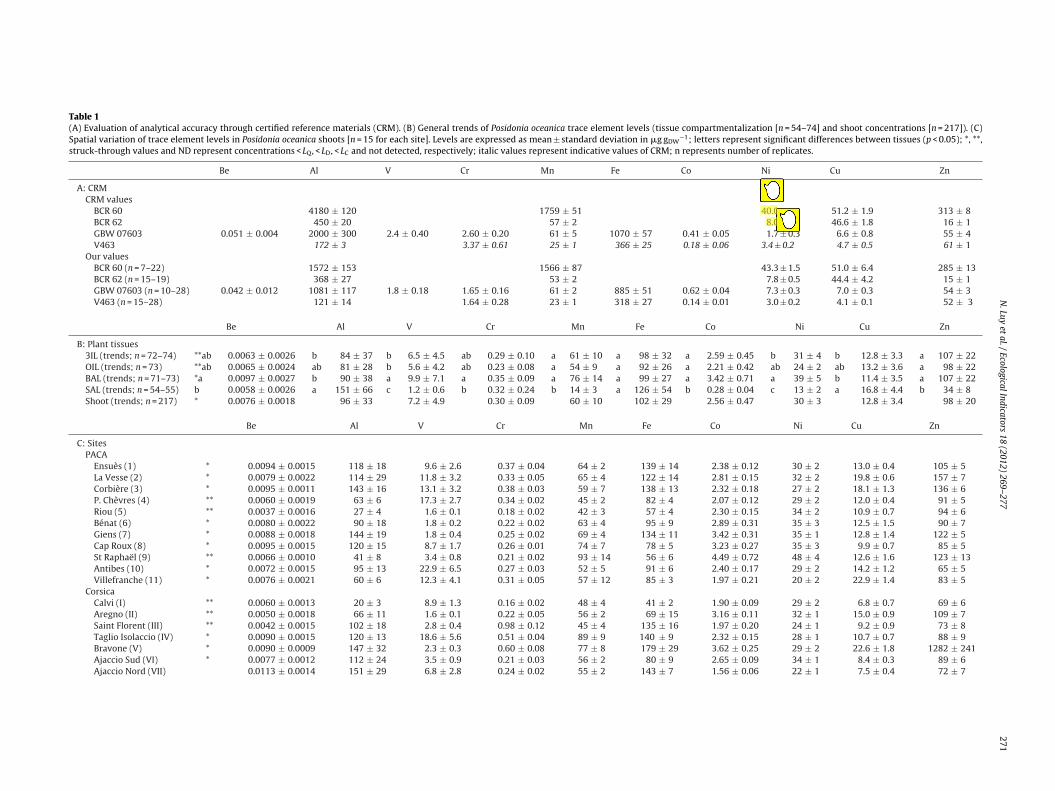
Table 1(A) Evaluation of analytical accuracy through certified reference materials (CRM). (B) General trends of Posidonia oceanica trace element levels (tissue compartmentalization [n = 54–74] and shoot concentrations [n = 217]). (C)Spatial variation of trace element levels in Posidonia oceanica shoots [n = 15 for each site]. Levels are expressed as mean ± standard deviation in �g gDW
−1; letters represent significant differences between tissues (p < 0.05); *, **,struck-through values and ND represent concentrations < LQ, < LD, < LC and not detected, respectively; italic values represent indicative values of CRM; n represents number of replicates.
Be Al V Cr Mn Fe Co Ni Cu Zn
A: CRMCRM values
BCR 60 4180 ± 120 1759 ± 51 40.0 51.2 ± 1.9 313 ± 8BCR 62 450 ± 20 57 ± 2 8.0 46.6 ± 1.8 16 ± 1GBW 07603 0.051 ± 0.004 2000 ± 300 2.4 ± 0.40 2.60 ± 0.20 61 ± 5 1070 ± 57 0.41 ± 0.05 1.7 ± 0.3 6.6 ± 0.8 55 ± 4V463 172 ± 3 3.37 ± 0.61 25 ± 1 366 ± 25 0.18 ± 0.06 3.4 ± 0.2 4.7 ± 0.5 61 ± 1
Our valuesBCR 60 (n = 7–22) 1572 ± 153 1566 ± 87 43.3 ± 1.5 51.0 ± 6.4 285 ± 13BCR 62 (n = 15–19) 368 ± 27 53 ± 2 7.8 ± 0.5 44.4 ± 4.2 15 ± 1GBW 07603 (n = 10–28) 0.042 ± 0.012 1081 ± 117 1.8 ± 0.18 1.65 ± 0.16 61 ± 2 885 ± 51 0.62 ± 0.04 7.3 ± 0.3 7.0 ± 0.3 54 ± 3V463 (n = 15–28) 121 ± 14 1.64 ± 0.28 23 ± 1 318 ± 27 0.14 ± 0.01 3.0 ± 0.2 4.1 ± 0.1 52 ± 3
Be Al V Cr Mn Fe Co Ni Cu Zn
B: Plant tissues3IL (trends; n = 72–74) **ab 0.0063 ± 0.0026 b 84 ± 37 b 6.5 ± 4.5 ab 0.29 ± 0.10 a 61 ± 10 a 98 ± 32 a 2.59 ± 0.45 b 31 ± 4 b 12.8 ± 3.3 a 107 ± 22OIL (trends; n = 73) **ab 0.0065 ± 0.0024 ab 81 ± 28 b 5.6 ± 4.2 ab 0.23 ± 0.08 a 54 ± 9 a 92 ± 26 a 2.21 ± 0.42 ab 24 ± 2 ab 13.2 ± 3.6 a 98 ± 22BAL (trends; n = 71–73) *a 0.0097 ± 0.0027 b 90 ± 38 a 9.9 ± 7.1 a 0.35 ± 0.09 a 76 ± 14 a 99 ± 27 a 3.42 ± 0.71 a 39 ± 5 b 11.4 ± 3.5 a 107 ± 22SAL (trends; n = 54–55) b 0.0058 ± 0.0026 a 151 ± 66 c 1.2 ± 0.6 b 0.32 ± 0.24 b 14 ± 3 a 126 ± 54 b 0.28 ± 0.04 c 13 ± 2 a 16.8 ± 4.4 b 34 ± 8Shoot (trends; n = 217) * 0.0076 ± 0.0018 96 ± 33 7.2 ± 4.9 0.30 ± 0.09 60 ± 10 102 ± 29 2.56 ± 0.47 30 ± 3 12.8 ± 3.4 98 ± 20
Be Al V Cr Mn Fe Co Ni Cu Zn
C: SitesPACA
Ensuès (1) * 0.0094 ± 0.0015 118 ± 18 9.6 ± 2.6 0.37 ± 0.04 64 ± 2 139 ± 14 2.38 ± 0.12 30 ± 2 13.0 ± 0.4 105 ± 5La Vesse (2) * 0.0079 ± 0.0022 114 ± 29 11.8 ± 3.2 0.33 ± 0.05 65 ± 4 122 ± 14 2.81 ± 0.15 32 ± 2 19.8 ± 0.6 157 ± 7Corbière (3) * 0.0095 ± 0.0011 143 ± 16 13.1 ± 3.2 0.38 ± 0.03 59 ± 7 138 ± 13 2.32 ± 0.18 27 ± 2 18.1 ± 1.3 136 ± 6P. Chèvres (4) ** 0.0060 ± 0.0019 63 ± 6 17.3 ± 2.7 0.34 ± 0.02 45 ± 2 82 ± 4 2.07 ± 0.12 29 ± 2 12.0 ± 0.4 91 ± 5Riou (5) ** 0.0037 ± 0.0016 27 ± 4 1.6 ± 0.1 0.18 ± 0.02 42 ± 3 57 ± 4 2.30 ± 0.15 34 ± 2 10.9 ± 0.7 94 ± 6Bénat (6) * 0.0080 ± 0.0022 90 ± 18 1.8 ± 0.2 0.22 ± 0.02 63 ± 4 95 ± 9 2.89 ± 0.31 35 ± 3 12.5 ± 1.5 90 ± 7Giens (7) * 0.0088 ± 0.0018 144 ± 19 1.8 ± 0.4 0.25 ± 0.02 69 ± 4 134 ± 11 3.42 ± 0.31 35 ± 1 12.8 ± 1.4 122 ± 5Cap Roux (8) * 0.0095 ± 0.0015 120 ± 15 8.7 ± 1.7 0.26 ± 0.01 74 ± 7 78 ± 5 3.23 ± 0.27 35 ± 3 9.9 ± 0.7 85 ± 5St Raphaël (9) ** 0.0066 ± 0.0010 41 ± 8 3.4 ± 0.8 0.21 ± 0.02 93 ± 14 56 ± 6 4.49 ± 0.72 48 ± 4 12.6 ± 1.6 123 ± 13Antibes (10) * 0.0072 ± 0.0015 95 ± 13 22.9 ± 6.5 0.27 ± 0.03 52 ± 5 91 ± 6 2.40 ± 0.17 29 ± 2 14.2 ± 1.2 65 ± 5Villefranche (11) * 0.0076 ± 0.0021 60 ± 6 12.3 ± 4.1 0.31 ± 0.05 57 ± 12 85 ± 3 1.97 ± 0.21 20 ± 2 22.9 ± 1.4 83 ± 5
CorsicaCalvi (I) ** 0.0060 ± 0.0013 20 ± 3 8.9 ± 1.3 0.16 ± 0.02 48 ± 4 41 ± 2 1.90 ± 0.09 29 ± 2 6.8 ± 0.7 69 ± 6Aregno (II) ** 0.0050 ± 0.0018 66 ± 11 1.6 ± 0.1 0.22 ± 0.05 56 ± 2 69 ± 15 3.16 ± 0.11 32 ± 1 15.0 ± 0.9 109 ± 7Saint Florent (III) ** 0.0042 ± 0.0015 102 ± 18 2.8 ± 0.4 0.98 ± 0.12 45 ± 4 135 ± 16 1.97 ± 0.20 24 ± 1 9.2 ± 0.9 73 ± 8Taglio Isolaccio (IV) * 0.0090 ± 0.0015 120 ± 13 18.6 ± 5.6 0.51 ± 0.04 89 ± 9 140 ± 9 2.32 ± 0.15 28 ± 1 10.7 ± 0.7 88 ± 9Bravone (V) * 0.0090 ± 0.0009 147 ± 32 2.3 ± 0.3 0.60 ± 0.08 77 ± 8 179 ± 29 3.62 ± 0.25 29 ± 2 22.6 ± 1.8 1282 ± 241Ajaccio Sud (VI) * 0.0077 ± 0.0012 112 ± 24 3.5 ± 0.9 0.21 ± 0.03 56 ± 2 80 ± 9 2.65 ± 0.09 34 ± 1 8.4 ± 0.3 89 ± 6Ajaccio Nord (VII) 0.0113 ± 0.0014 151 ± 29 6.8 ± 2.8 0.24 ± 0.02 55 ± 2 143 ± 7 1.56 ± 0.06 22 ± 1 7.5 ± 0.4 72 ± 7
272
N.
Luy et
al. /
Ecological Indicators
18 (2012)
269–277
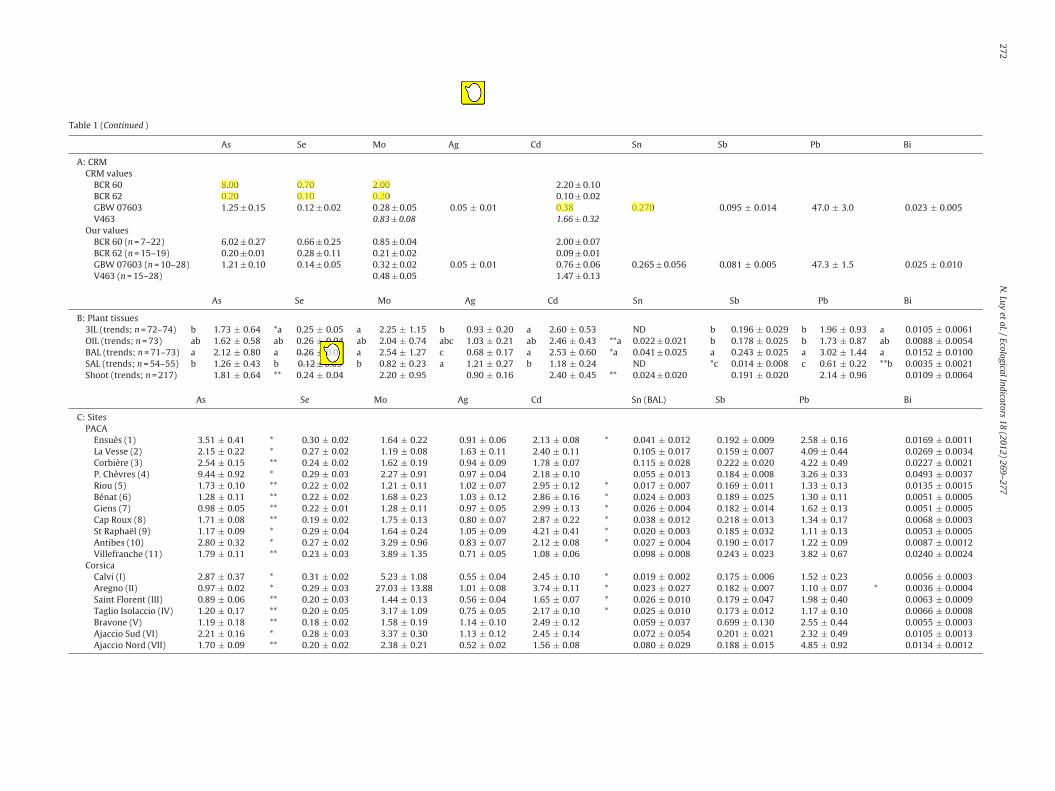
Table 1 (Continued )
As Se Mo Ag Cd Sn Sb Pb Bi
A: CRMCRM values
BCR 60 8.00 0.70 2.00 2.20 ± 0.10BCR 62 0.20 0.10 0.20 0.10 ± 0.02GBW 07603 1.25 ± 0.15 0.12 ± 0.02 0.28 ± 0.05 0.05 ± 0.01 0.38 0.270 0.095 ± 0.014 47.0 ± 3.0 0.023 ± 0.005V463 0.83 ± 0.08 1.66 ± 0.32
Our valuesBCR 60 (n = 7–22) 6.02 ± 0.27 0.66 ± 0.25 0.85 ± 0.04 2.00 ± 0.07BCR 62 (n = 15–19) 0.20 ± 0.01 0.28 ± 0.11 0.21 ± 0.02 0.09 ± 0.01GBW 07603 (n = 10–28) 1.21 ± 0.10 0.14 ± 0.05 0.32 ± 0.02 0.05 ± 0.01 0.76 ± 0.06 0.265 ± 0.056 0.081 ± 0.005 47.3 ± 1.5 0.025 ± 0.010V463 (n = 15–28) 0.48 ± 0.05 1.47 ± 0.13
As Se Mo Ag Cd Sn Sb Pb Bi
B: Plant tissues3IL (trends; n = 72–74) b 1.73 ± 0.64 *a 0.25 ± 0.05 a 2.25 ± 1.15 b 0.93 ± 0.20 a 2.60 ± 0.53 ND b 0.196 ± 0.029 b 1.96 ± 0.93 a 0.0105 ± 0.0061OIL (trends; n = 73) ab 1.62 ± 0.58 ab 0.26 ± 0.04 ab 2.04 ± 0.74 abc 1.03 ± 0.21 ab 2.46 ± 0.43 **a 0.022 ± 0.021 b 0.178 ± 0.025 b 1.73 ± 0.87 ab 0.0088 ± 0.0054BAL (trends; n = 71–73) a 2.12 ± 0.80 a 0.26 ± 0.05 a 2.54 ± 1.27 c 0.68 ± 0.17 a 2.53 ± 0.60 *a 0.041 ± 0.025 a 0.243 ± 0.025 a 3.02 ± 1.44 a 0.0152 ± 0.0100SAL (trends; n = 54–55) b 1.26 ± 0.43 b 0.12 ± 0.05 b 0.82 ± 0.23 a 1.21 ± 0.27 b 1.18 ± 0.24 ND *c 0.014 ± 0.008 c 0.61 ± 0.22 **b 0.0035 ± 0.0021Shoot (trends; n = 217) 1.81 ± 0.64 ** 0.24 ± 0.04 2.20 ± 0.95 0.90 ± 0.16 2.40 ± 0.45 ** 0.024 ± 0.020 0.191 ± 0.020 2.14 ± 0.96 0.0109 ± 0.0064
As Se Mo Ag Cd Sn (BAL) Sb Pb Bi
C: SitesPACA
Ensuès (1) 3.51 ± 0.41 * 0.30 ± 0.02 1.64 ± 0.22 0.91 ± 0.06 2.13 ± 0.08 * 0.041 ± 0.012 0.192 ± 0.009 2.58 ± 0.16 0.0169 ± 0.0011La Vesse (2) 2.15 ± 0.22 * 0.27 ± 0.02 1.19 ± 0.08 1.63 ± 0.11 2.40 ± 0.11 0.105 ± 0.017 0.159 ± 0.007 4.09 ± 0.44 0.0269 ± 0.0034Corbière (3) 2.54 ± 0.15 ** 0.24 ± 0.02 1.62 ± 0.19 0.94 ± 0.09 1.78 ± 0.07 0.115 ± 0.028 0.222 ± 0.020 4.22 ± 0.49 0.0227 ± 0.0021P. Chèvres (4) 9.44 ± 0.92 * 0.29 ± 0.03 2.27 ± 0.91 0.97 ± 0.04 2.18 ± 0.10 0.055 ± 0.013 0.184 ± 0.008 3.26 ± 0.33 0.0493 ± 0.0037Riou (5) 1.73 ± 0.10 ** 0.22 ± 0.02 1.21 ± 0.11 1.02 ± 0.07 2.95 ± 0.12 * 0.017 ± 0.007 0.169 ± 0.011 1.33 ± 0.13 0.0135 ± 0.0015Bénat (6) 1.28 ± 0.11 ** 0.22 ± 0.02 1.68 ± 0.23 1.03 ± 0.12 2.86 ± 0.16 * 0.024 ± 0.003 0.189 ± 0.025 1.30 ± 0.11 0.0051 ± 0.0005Giens (7) 0.98 ± 0.05 ** 0.22 ± 0.01 1.28 ± 0.11 0.97 ± 0.05 2.99 ± 0.13 * 0.026 ± 0.004 0.182 ± 0.014 1.62 ± 0.13 0.0051 ± 0.0005Cap Roux (8) 1.71 ± 0.08 ** 0.19 ± 0.02 1.75 ± 0.13 0.80 ± 0.07 2.87 ± 0.22 * 0.038 ± 0.012 0.218 ± 0.013 1.34 ± 0.17 0.0068 ± 0.0003St Raphaël (9) 1.17 ± 0.09 * 0.29 ± 0.04 1.64 ± 0.24 1.05 ± 0.09 4.21 ± 0.41 * 0.020 ± 0.003 0.185 ± 0.032 1.11 ± 0.13 0.0053 ± 0.0005Antibes (10) 2.80 ± 0.32 * 0.27 ± 0.02 3.29 ± 0.96 0.83 ± 0.07 2.12 ± 0.08 * 0.027 ± 0.004 0.190 ± 0.017 1.22 ± 0.09 0.0087 ± 0.0012Villefranche (11) 1.79 ± 0.11 ** 0.23 ± 0.03 3.89 ± 1.35 0.71 ± 0.05 1.08 ± 0.06 0.098 ± 0.008 0.243 ± 0.023 3.82 ± 0.67 0.0240 ± 0.0024
CorsicaCalvi (I) 2.87 ± 0.37 * 0.31 ± 0.02 5.23 ± 1.08 0.55 ± 0.04 2.45 ± 0.10 * 0.019 ± 0.002 0.175 ± 0.006 1.52 ± 0.23 0.0056 ± 0.0003Aregno (II) 0.97 ± 0.02 * 0.29 ± 0.03 27.03 ± 13.88 1.01 ± 0.08 3.74 ± 0.11 * 0.023 ± 0.027 0.182 ± 0.007 1.10 ± 0.07 * 0.0036 ± 0.0004Saint Florent (III) 0.89 ± 0.06 ** 0.20 ± 0.03 1.44 ± 0.13 0.56 ± 0.04 1.65 ± 0.07 * 0.026 ± 0.010 0.179 ± 0.047 1.98 ± 0.40 0.0063 ± 0.0009Taglio Isolaccio (IV) 1.20 ± 0.17 ** 0.20 ± 0.05 3.17 ± 1.09 0.75 ± 0.05 2.17 ± 0.10 * 0.025 ± 0.010 0.173 ± 0.012 1.17 ± 0.10 0.0066 ± 0.0008Bravone (V) 1.19 ± 0.18 ** 0.18 ± 0.02 1.58 ± 0.19 1.14 ± 0.10 2.49 ± 0.12 0.059 ± 0.037 0.699 ± 0.130 2.55 ± 0.44 0.0055 ± 0.0003Ajaccio Sud (VI) 2.21 ± 0.16 * 0.28 ± 0.03 3.37 ± 0.30 1.13 ± 0.12 2.45 ± 0.14 0.072 ± 0.054 0.201 ± 0.021 2.32 ± 0.49 0.0105 ± 0.0013Ajaccio Nord (VII) 1.70 ± 0.09 ** 0.20 ± 0.02 2.38 ± 0.21 0.52 ± 0.02 1.56 ± 0.08 0.080 ± 0.029 0.188 ± 0.015 4.85 ± 0.92 0.0134 ± 0.0012

N. Luy et al. / Ecological Indicators 18 (2012) 269–277 273
g the
fe
tfcsML
be
Fs(
Fig. 1. Map showing the locations of the study sites alon
or Cd and Pb; Lafabrie et al. (2008) for Cr, Co, Ni, Cd and Pb; Contit al. (2010) for Cr, Cu, Zn, Cd and Pb.
Assimilation of TEs among rooted aquatic plants occurs throughwo pathways: uptake by leaves from the water column or by rootsrom interstitial water. A preferential assimilation from the waterolumn to photosynthetic tissues can be assumed for TEs whichhow higher levels in these tissues. This is particularly true for V,n, Co, Ni, Zn, Mo, Cd, Sb, Pb and Bi, which was also suggested by
afabrie et al. (2008) for Co, Ni, Cd, Hg and Pb.At least two hypotheses can be used to explain the differences
etween photosynthetic tissues (upper values in BAL): (i) longerxposure to TEs loaded in the ambient habitat, as suggested by
ig. 2. Posidonia oceanica compartmentalization of V, Zn, Cr and Cu (a–d) at 4 of the 18 siteignificant differences between tissues (p < 0.05): third intermediate leaves (3IL), other iSAL); numbers in parentheses represent number of replicates.
Provence-Alpes-Côte d’Azur (PACA) and Corsican coasts.
Warnau et al. (1996) for adult leaves compared to intermediateleaves, and by Campanella et al. (2001) for the tip of the leaf com-pared to its younger basal part; (ii) dilution effect due to the highergrowth rate of intermediate leaves. These hypotheses can only playa major role for TEs characterized by low kinetics of accumulationand little regulation such as Mn, Co, Ni, As, Mo, Sb, Pb, Bi and V.
On the other hand, the different behaviour of TEs preferen-tially accumulated in SAL suggests different uptake and distribution
routes. For the particular case of Cu, the systematic but quite lim-ited upper level in SAL (as opposed to BAL) could be explained by anincrease in metabolic activity during growth, when Cu (an essentialmicronutrient) is needed, as mentioned by Conti et al. (2010).s; levels are expressed as mean ± standard deviation in �g gDW−1; letters represent
ntermediate leaves (OIL), blades of adult leaves (BAL) and sheaths of adult leaves
2 Indica
etskmdpsts
3
(saA
3
aqreiLelJedw
3
rtlsViirtBbciieae
3
eroLs1At(
74 N. Luy et al. / Ecological
Physiological metrics vary with the tissue age and are influ-nced by the presence of epiphytes. However, this work supportshe hypothesis of Romero et al. (2007b) concerning 3IL, except forites widely contaminated by TEs which are characterized by lowinetics of accumulation from the water column, such as V. Forost of the TEs analysed, future analyses of TE levels could be
one using this single 3IL sample. This will simplify the laboratoryretreatment process and also permit a non-destructive samplingtrategy: only P. oceanica leaves will have to be cut in situ close toheir basal part, which avoids uprooting the shoots and permits theubsequent regrowing of leaves (Gobert, pers. comm.).
.2. Spatial (temporal) variation of trace element levels
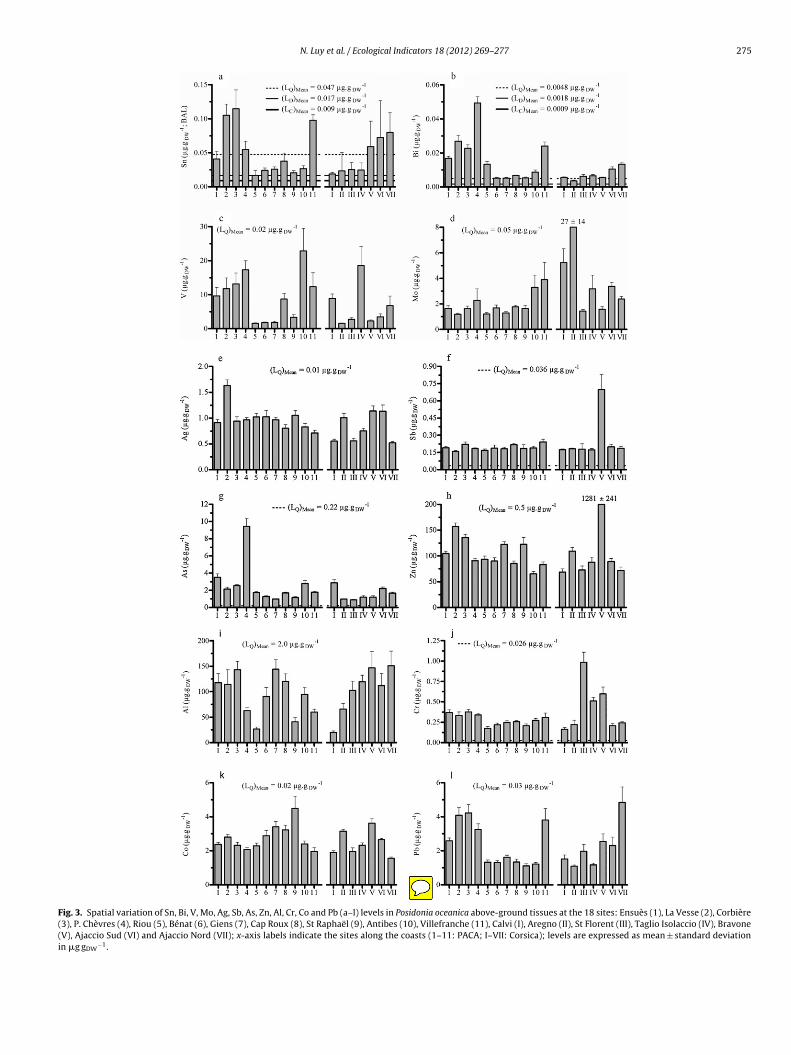
Some TEs exhibit spatial variation of their levels in P. oceanicahigher than a factor 10 for Mo, Zn, V, Bi, Sn and As), while othershow moderate (by a factor of between 4 and 10 for Al, Cr, Fe, Pbnd Sb) and several exhibit small (lower than a factor 4 for Cd, Cu,g, Be, Co, Ni, Mn and Se) spatial variation (Table 1C and Fig. 3).
.2.1. Be–SeIn all sites and tissues, Be and Se signals could be detected
nd measured, but the differences between sites were not reallyuantifiable as levels were close to LD (0.007 and 0.27 �g gDW
−1,espectively). Barwick and Maher (2003) determined upper Se lev-ls in one seagrass (Zostera capricornii; 0.38 ± 0.08 �g gDW
−1) andn one green macroalga (Enteromorpha sp.; 0.34 ± 0.09 �g gDW
−1) inake Macquarie (New South Wales, Australia), an estuary consid-red to be contaminated, whereas Baldwin et al. (1996) determinedower Se levels in Posidonia australis (0.064 ± 0.009 �g gDW
−1) inervis Bay (Australia), an estuary considered to be unpolluted. Lev-ls recorded in the present study, which do not differ much betweenifferent sites, appear to reflect the background level of the north-estern Mediterranean Sea.
.2.2. Sn (Fig. 3a)–Bi (Fig. 3b)Sn and Bi had levels close to LQ (0.07 and 0.005 �g gDW
−1,espectively); contrary to levels of Be and Se, a significant spa-ial variation was perceptible and quantifiable. Moreover, elevatedevels were recorded for both elements at the same sites: Mar-eilles Bay (Ensuès, La Vesse, Corbière and Plateau des Chèvres),illefranche and Ajaccio. Since they are principally used in special-
zed industry (Bi is also used in medicine and Sn was largely usedn antifouling paints as tributyltin or TBT), it is not surprising toecord elevated values in industrialized areas and harbours. Lit-le data are available concerning Bi levels in aquatic macrophytes.ertine et al. (1996) determined a similar range of levels in somerown and red algae (from 0.0046 to 0.0480 �gBi gDW
−1). Sn and itsompounds (mainly TBT) are largely studied in molluscs, since TBTs an endocrine disruptor in gastropods (e.g. Nucella lapillus) ands particularly persistent in sediment (Santos et al., 2002). How-ver, macrophytes, including the seagrass Ruppia maritima, are alsoffected by TBT stored in sediment (Jensen et al., 2004) in realisticnvironmental levels (10 �gTBT-Sn kgDW
−1).
.2.3. V (Fig. 3c)Since V is a tracer of oil spill (hydrocarbon) pollutants (Amiard
t al., 2003; Alfonso et al., 2008), the presence of four oilefineries in the 13th French district (Bouches-du-Rhône), an oldil-exporting harbour at Antibes and the petroleum depot atucciana (Taglio Isolaccio) can explain the high V levels in Mar-eilles Bay, Antibes and Taglio Isolaccio. V levels varied from
.6 ± 0.1 �g gDW−1 at Riou and Aregno, to 22.9 ± 6.5 �g gDW−1 at
ntibes. Alfonso et al. (2008) found higher V levels in below-groundissues (4.49–15.14 �g gDW
−1) than in above-ground tissues1.09–2.20 �g gDW
−1) of Thalassia testudinum. They attributed the
tors 18 (2012) 269–277
highest levels in root-rhizomes to petroleum refining and trans-portation activities. Furthermore, the highest levels determinedby Amiard et al. (2003) in three mollusc species: Mytilus edulis(0.98 �g gDW
−1), Nucella lapillus (0.57 �g gDW−1) and Littorina lit-
torea (1.42 �g gDW−1) along the south coast of Brittany (France),
after the sinking of the tanker Erika, are in the lower range of the lev-els determined in this study. These observations confirm the use ofP. oceanica as a good biological indicator of hydrocarbon pollution.
3.2.4. Mn–Mo (Fig. 3d)The spatial variation of Mn levels was small. Furthermore,
our levels (42–93 �g gDW−1), and particularly our SAL levels
(8–28 �g gDW−1), were in the lower range of the values determined
by Ancora et al. (2004) in P. oceanica scales in the Gulf of Naples(5–200 �g gDW
−1). Mo is an essential micronutrient for citrus cul-ture (Srivastava and Shyam, 2007). Aregno, known for its cultureof oranges and almonds, is located in the small catchment basin ofNonza, an agricultural valley that opens onto the sea. The particu-larly high Mo levels measured at Aregno are probably due to thisspecific agricultural activity. However, the levels at the 17 othersites are lower than those determined by Augier et al. (1991) inP. oceanica leaves (5.2 ± 0.6 �g gDW
−1) at the uncontaminated siteof La Palu (Port Cros Island, France). So, measured levels of thesetwo TEs (Mn: 60 ± 10 �g gDW
−1; Mo: 2.20 ± 0.95 �g gDW−1) should
reflect the background levels of the northwestern MediterraneanSea.
3.2.5. Ag (Fig. 3e)Chiffoleau et al. (2005) used wide mussels (Mytilus edulis and
Mytilus galloprovincialis) and determined contamination by Agalong the French Mediterranean coast as homogeneous and lim-ited compared to the Atlantic coast. However, the lowest valuesrecorded from this study (∼0.5 �g gDW
−1) were found in Cor-sica, and corroborate the low values measured by Lopez y Royoet al. (2009) in the northwestern Mediterranean Sea. Hence, theselow levels should reflect the Ag background level of this area.Higher values in Corsica (∼1 �g gDW
−1) correspond to the lowerones of the PACA region. This could stem from diffuse urbanor industrialized contamination, with the exception of La Vesse(1.63 ± 0.11 �g gDW
−1) which seems to be more locally contam-inated, as observed by Lopez y Royo et al. (2009) at Ile Rousse(1.55 ± 0.20 �g gDW
−1).
3.2.6. Sb (Fig. 3f)–As (Fig. 3g)–Zn (Fig. 3h)With the exception of Bravone (Sb and Zn) and Plateau des
Chèvres (As), these TEs have relatively small spatial variation. Lev-els of Zn and As found in this study correspond to unpollutedsites when compared to the literature (Tranchina et al., 2004;Fourqurean et al., 2007). The high Sb levels detected only at Bravonecould be attributed to the As/Sb deposit at Matra. This mine, whichclosed in 1946, is crossed by the Presa River, a tributary of theBravone River which flows into the open sea close to the city ofthe same name (Bravone). However, if the high Sb levels are asso-ciated with high Zn levels (which could also be attributed to theMatra deposit), it is not the case with As, as shown in mussels byAndral et al. (2004). On the other hand, the high As levels detectedonly at Plateau des Chèvres corroborate the observation made byAndral et al. (2004), and could be attributed to the industrial his-tory of the south of Marseilles, chronically contaminated by As andPb, as suggested by Lassalle (2007).
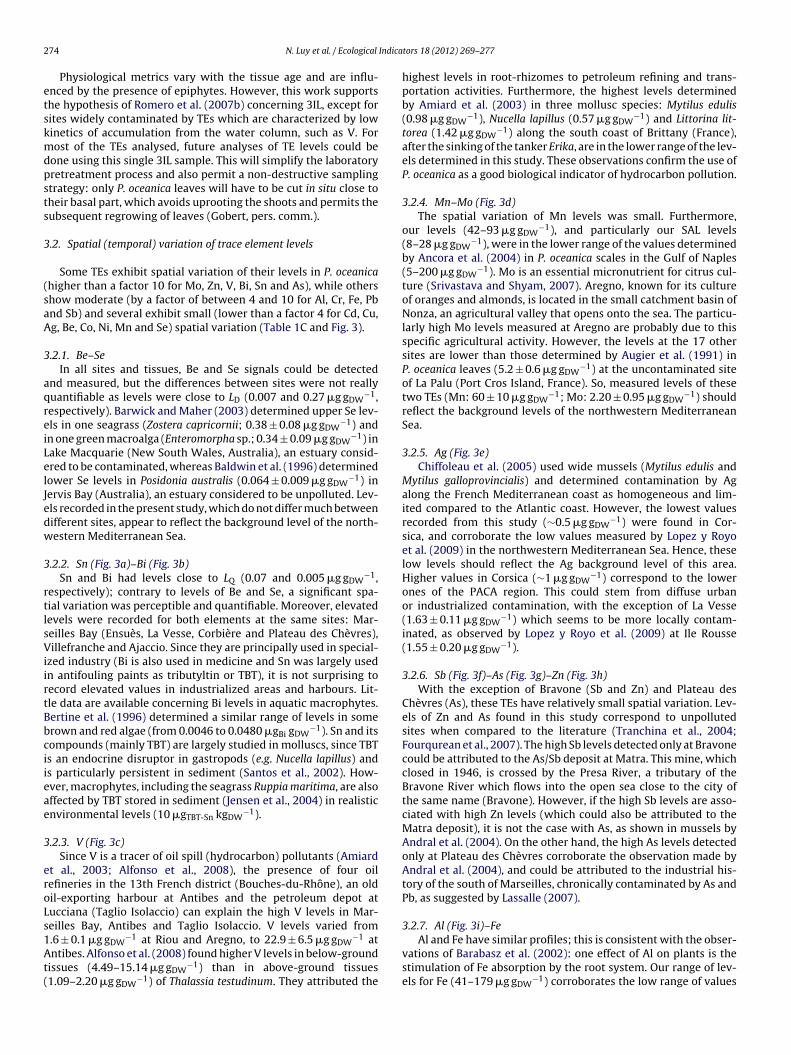
3.2.7. Al (Fig. 3i)–Fe
Al and Fe have similar profiles; this is consistent with the obser-vations of Barabasz et al. (2002): one effect of Al on plants is thestimulation of Fe absorption by the root system. Our range of lev-els for Fe (41–179 �g gDW
−1) corroborates the low range of values
N. Luy et al. / Ecological Indicators 18 (2012) 269–277 275
Fig. 3. Spatial variation of Sn, Bi, V, Mo, Ag, Sb, As, Zn, Al, Cr, Co and Pb (a–l) levels in Posidonia oceanica above-ground tissues at the 18 sites: Ensuès (1), La Vesse (2), Corbière(3), P. Chèvres (4), Riou (5), Bénat (6), Giens (7), Cap Roux (8), St Raphaël (9), Antibes (10), Villefranche (11), Calvi (I), Aregno (II), St Florent (III), Taglio Isolaccio (IV), Bravone(V), Ajaccio Sud (VI) and Ajaccio Nord (VII); x-axis labels indicate the sites along the coasts (1–11: PACA; I–VII: Corsica); levels are expressed as mean ± standard deviationin �g gDW
−1.
2 Indica
d(amattasbnbc“la
3
(m(tvmoAatFmCtla(
3
oemsfsmSlc
3
Nat(naciadtos
76 N. Luy et al. / Ecological
etermined by Fourqurean et al. (2007) in the Balearic IslandsSpain), and by Warnau et al. (1995) and Pergent-Martini (1994)t Calvi and Marseilles. However, no extreme level was deter-ined at the 18 selected sites, as measured by Warnau et al. (1995)
t Lacco Ameno (419 ± 431 �g gDW−1; Ischia Island, Italy). Hence,
hese observations allow us to hypothesize that the spatial distribu-ion results from a natural heterogeneity rather than anthropogenicctivities. Fe deficiencies (<100 �gFe gDW
−1) have been found ineagrasses growing above carbonate sediment (Duarte et al., 1995),ut the low Fe levels determined at Calvi (48 ± 4 �g gDW
−1) doot negatively affect P. oceanica growth. Indeed, P. oceanica shootiomass and leaf chlorophyll levels were high at Calvi (Gobert, pers.omm.), and the state of the P. oceanica meadow was determined asgood” according to PREI (Gobert et al., 2009). Furthermore, the lowevels of other micronutrients (Mn, Co, Ni, Cu and Zn) determinedt Calvi seem also not to be deficient for P. oceanica.
.2.8. Cr (Fig. 3j)–Co (Fig. 3k)–Ni–CdThe high Cr levels determined at Saint Florent
0.98 ± 0.12 �g gDW−1) corroborate similar high values deter-
ined west of Cap Corse (1.07 ± 0.07 �g gDW−1) by Lafabrie et al.
2008) using P. oceanica leaves and by Andral et al. (2004) usinghe RINBIO biointegrator network based on mussel caging. Thesealues have been linked to waste from the disused Canari asbestosine, closed in 1965, located at the northwestern area of the Gulf
f Saint Florent. However, contrary to Lafabrie et al. (2008) andndral et al. (2004), the high Cr levels at Saint Florent were notssociated with high levels of Co or Ni, which were presumedo be linked to waste from the disused Canari asbestos mine.urthermore, the spatial distribution of Co and Ni appeared to beore similar to that of Cd than to that of Cr. However, Co, Ni and
d had low spatial variation and the ranges of levels for thesehree TEs were quite narrow, which reflect similar contaminationevels across sites. Moreover, a decrease in Cd levels is observedt Calvi, St Florent and Ajaccio, when compared to Lafabrie et al.2008).
.2.9. CuCu has several uses, including use as conductor, a constituent
f alloys, as a copolymer, in antifouling paint, in ship rustproofnamel, and as a fungicide, an algaecide, fertilizer, etc. Hence, thereay be multiple sources of contamination which are yet to be
pecified in the more contaminated sites of Bravone, Aregno, Ville-ranche, La Vesse and Corbière. However, levels determined in thistudy (7.5–22.9 �g gDW
−1) were clearly lower than those deter-ined by Conti et al. (2007) at Ustica Island (31.9 ± 15.8 �g gDW
−1;icily, Italy) where TE contamination was estimated at a medium-ow level according to the literature. All sites sampled can thus beonsidered as having a low level of Cu contamination.
.2.10. Pb (Fig. 3l)Pb, not highly soluble in sea water, accumulates in sediments.
evertheless, Mayes et al. (1977) suggested for another rootedquatic plant (Elodea canadensis) that movement of Pb from con-aminated sediment to leaves probably occurs through the waterreleased from the sediment by turbulence), and not through inter-al transport (acropetal translocation). Since its prohibited use asn anti-knock additive in gasoline (lead alkyls) and as the principalomponent of water pipes, contamination levels of Pb have beenn decline, as determined by Ancora et al. (2004) between 1989nd 1999 in the Gulf of Naples. Moreover, Tranchina et al. (2005)
etermined that Pb levels measured in P. oceanica scales were sta-istically correlated to Pb emissions in the air and reflected the levelf Pb pollution in the coastal marine environment. However, itsignificant environmental persistence in the sediment explains thetors 18 (2012) 269–277
relatively higher values determined in the highest industrializedsites (Marseilles Bay, Villefranche and Ajaccio).
4. Conclusion
The general trends of compartmentalization in P. oceanica allowus to propose hypotheses concerning the uptake and distributionroutes of these nineteen TEs. However, such hypotheses have yetto be confirmed either by means of analysis of different partsof the same leaf (whole leaf, leaf tip and leaf basal tissue), orby means of analysis of both above- (leaves) and below-ground(rhizomes, scales and roots) tissues. Alternatively, experimentalcontamination in controlled mesocosms would allow us to clarifythe uptake and distribution routes of TEs and to quantify the kinet-ics of accumulation and excretion. Furthermore, this study supportsthe hypothesis that future analyses of most TEs in P. oceanica inthe spring could be undertaken only on the single third interme-diate leaf, except for sites widely contaminated by TEs, such as V,characterized by very low kinetics of accumulation from the watercolumn. On the scale of the Mediterranean French coast, the nat-ural levels of most of the twelve little-studied TEs measured in P.oceanica could be determined, and their spatial variation as well astheir contamination sources could be explained. P. oceanica effec-tively concentrates Be, Al, V, Mn, Co, As, Se, Mo, Ag, Sn, Sb and Bifrom its surrounding environment, and might be used de facto asa sentinel species for their coastal monitoring. Special attentionshould be given to these twelve potentially toxic TEs due to theirlocal (Mo), diffuse (Ag) and/or chronic (As) observed contamina-tion. On the other hand, the levels of the seven widely studied TEs(Cr, Fe, Ni, Cu, Zn, Cd and Pb) seem to decrease or stabilize overtime, probably due to their reduced anthropogenic inflows. Theseobservations taken together suggest that P. oceanica is a sensitivebioindicator for the monitoring of chemical contamination for thenineteen TEs studied.
Acknowledgements
Funding was provided by Agence de l’eau, FRS-FNRS (FRFC2.4.502.08) and French Community of Belgium (ARC Race 05/10-333). Authors are also grateful to IFREMER and STARESO forsampling of biological material and to Susan Marsh-Rollo forimproving the language of the manuscript. This publication has theMARE publication number MARE215.
Appendix A. Supplementary data
Supplementary data associated with this article can be found, inthe online version, at doi:10.1016/j.ecolind.2011.11.005.
References
Alfonso, J.A., Azocar, J., LaBrecque, J.J., Garcia, B., Palacios, D., Benzo, Z., 2008. Tracemetals in bivalves and seagrass collected from Venezuelan coastal sites. Revistade biología tropical 56, 215–222.
Amiard, J.-C., Bacheley, H., Barillé, A.-L., Barillé, L., Geffard, A., Himery, N., 2003. Tem-poral changes in nickel and vanadium concentrations and in condition index andmetallothionein levels in three species of molluscs following the “Erika” oil spill.Aquatic Living Resources 17, 281–288.
Ancora, S., Bianchi, N., Butini, A., Buia, M.C., Gambi, M.C., Leonzio, C., 2004. Posidoniaoceanica as a biomonitor of trace elements in the Gulf of Naples: temporal trendsby lepidochronology. Environmental Toxicology and Chemistry 23, 1093–1099.
Andral, B., Stanisiere, J.Y., Sauzade, D., Damier, E., Thebault, H., Galgani, F., Boissery,P., 2004. Monitoring chemical contamination levels in the Mediterranean based
on the use of mussel caging. Marine Pollution Bulletin 49, 704–712.Augier, H., Ronneau, C., Roucoux, P., Lion, R., Charlent, O., 1991. Neutron-activationanalysis of the elementary composition of the marine phanerogam Posidoniaoceanica from a reference area in Port Cros National Park (French Mediter-ranean). Marine Biology 109, 345–353.
Indica
B
B
B
B
B
B
B
C
C
C
C
C
D
D
E
F
F
G
G
G
I
I
J
K
N. Luy et al. / Ecological
abula, P., Adam, V., Opatrilova, R., Zehnalek, J., Havel, L., Kizek, R., 2008. Uncom-mon heavy metals, metalloids and their plant toxicity: a review. EnvironmentalChemistry Letters 6, 189–213.
aldwin, S., Maher, W., Kleber, E., Krikowa, F., 1996. Selenium in marine organismsof seagrass habitats (Posidonia australis) of Jervis Bay, Australia. Marine PollutionBulletin 32, 310–316.
arabasz, W., Albinska, D., Jaskowska, M., Lipiec, J., 2002. Ecotoxicology of alu-minium. Polish Journal of Environmental Studies 11, 199–203.
arwick, M., Maher, W., 2003. Biotransference and biomagnification of seleniumcopper, cadmium, zinc, arsenic and lead in a temperate seagrass ecosystem fromLake Macquarie Estuary, NSW, Australia. Marine Environmental Research 56,471–502.
ertine, K., Koide, M., Goldberg, E., 1996. Comparative marine chemistries of sometrivalent metals – bismuth, rhodium and rare earth elements. Marine Chemistry53, 89–100.
oudouresque, C.F., Bernard, G., Bonhomme, P., Charbonnel, E., Diviacco, G., Meinesz,A., Pergent, G., Pergent-Martini, C., Ruitton, S., Tunesi, L., 2006. Préservation etconservation des herbiers à Posidonia oceanica. Ramoge Pub, pp. 1–202.
oudouresque, C.F., Meinesz, A., 1982. Découverte de l’herbier de posidonie. In: Parcnational de Port-Cros, Parc naturel régional de la Corse and GIS Posidonie, pp.1–79.
ampanella, L., Conti, M.E., Cubadda, F., Sucapane, C., 2001. Trace metals in sea-grass, algae and molluscs from an uncontaminated area in the Mediterranean.Environmental Pollution 111, 117–126.
hiffoleau, J.F., Auger, D., Roux, N., Rozuel, E., Santini, A., 2005. Distribution of silver inmussels and oysters along the French coasts: data from the national monitoringprogram. Marine Pollution Bulletin 50, 1719–1723.
onti, M., Bocca, B., Iacobucci, M., Finoia, M., Mecozzi, M., Pino, A., 2010. Baselinetrace metals in seagrass, algae, and mollusks in a Southern Tyrrhenian Ecosystem(Linosa Island, Sicily). Archives of Environmental Contamination and Toxicology58, 79–95.
onti, M., Iacobucci, M., Cecchetti, G., 2007. A biomonitoring study: trace metals inseagrass, algae and molluscs in a marine reference ecosystem (Southern Tyrrhe-nian Sea). International Journal of Environment and Pollution 29, 308–332.
urrie, L., 1999. Nomenclature in evaluation of analytical methods including detec-tion and quantification capabilities (IUPAC Recommendations 1995). AnalyticaChimica Acta 391, 105–126.
uarte, C.M., Merino, M., Gallegos, M., 1995. Evidence of iron deficiency in sea-grasses growing above carbonate sediments. Limnology and Oceanography 40,1153–1158.
uffus, J.H, 2002. “Heavy metals” – a meaningless term? (IUPAC technical report).Pure and Applied Chemistry 74, 793–807.
C, 2000. Directive 2000/60/EC of the European Parliament and the Council of 23October 2000 establishing a framework for Community action in the field ofwater policy. Official Journal of the European Communities, OJ L 327, 22.12.2000,pp. 1–73.
ilella, M., Belzile, N., Chen, Y.W., 2002. Antimony in the environment: a reviewfocused on natural waters – I: occurrence. Earth-Science Reviews 57, 125–176.
ourqurean, J., Marba, N., Duarte, C., Diaz-Almela, E., Ruiz-Halpern, S., 2007. Spatialand temporal variation in the elemental and stable isotopic content of the sea-grasses Posidonia oceanica and Cymodocea nodosa from the Illes Balears, Spain.Marine Biology 151, 219–232.
iraud, G., 1979. Sur une méthode de mesure et de comptage des structures foliairesde Posidonia oceanica (Linnaeus) Delile. Bulletin du Muséum d’histoire naturellede Marseille 39, 33–39.
obert, S., Sartoretto, S., Rico-Raimondino, V., Andral, B., Chery, A., Lejeune, P., Bois-sery, P., 2009. Assessment of the ecological status of Mediterranean Frenchcoastal waters as required by the Water Framework Directive using the Posidoniaoceanica Rapid Easy Index: PREI. Marine Pollution Bulletin 58, 1727–1733.
rinzaid, E.L., Zil’bershtein, K.I., Nadezhina, L.S., Yufa, B.Y., 1977. Terms and methodsof estimating detection limits in various analytical methods. Journal of AnalyticalChemistry USSR 32, 1678–1684.
kem, A., Egiebor, N.O., 2005. Assessment of trace elements in canned fishes (mack-erel, tuna, salmon, sardines and herrings) marketed in Georgia and Alabama(United States of America). Journal of Food Composition and Analysis 18,771–787.
UPAC, Inczédy, J., Lengyel, T., Ure, A.M., Gelencsér, A., Hulanicki, A., 1998. Com-pendium of Analytical Nomenclature, 3rd ed. Blackwell, Oxford.
ensen, H., Holmer, M., Dahllof, I., 2004. Effects of tributyltin (TBT) on the seagrass
Ruppia maritima. Marine Pollution Bulletin 49, 564–573.arlsson, S., Duker, A., Grahn, E., 2007. Sediment chronologies of As, Bi, and Ga inSweden – impact of industrialisation. Journal of Environmental Science andHealth. Part A, Toxic/Hazardous Substances & Environmental Engineering 42,155–164.
tors 18 (2012) 269–277 277
Kljakovic-Gaspic, Z., Antolic, B., Zvonaric, T., Baric, A., 2004. Distribution of cadmiumand lead in Posidonia oceanica (L.) Delile from the middle Adriatic sea. FreseniusEnvironmental Bulletin 13, 1210–1215.
Lafabrie, C., Pergent-Martini, C., Pergent, G., 2008. Metal contamination of Posidoniaoceanica meadows along the Corsican coastline (Mediterranean). EnvironmentalPollution 151, 262–268.
Lassalle, J.L., 2007. Présence de plomb et d’arsenic sur le littoral sud de Marseille:une étude de santé. Institut de Veille Sanitaire, Saint-Maurice, pp. 1–44.
Lopez y Royo, C., Casazza, G., Pergent-Martini, C., Pergent, G., Royo, L., 2010. A bioticindex using the seagrass Posidonia oceanica (BiPo), to evaluate ecological statusof coastal waters. Ecological Indicators 10, 380–389.
Lopez Royo, C., Silvestri, C., Salivas-Decaux, M., Pergent, G., Casazza, G., 2009. Appli-cation of an angiosperm-based classification system (BiPo) to Mediterraneancoastal waters: Using spatial analysis and data on metal contamination of plantsin identifying sources of pressure. Hydrobiologia 633, 169–179.
Mayes, R., McIntosh, A., Anderson, V., 1977. Uptake of cadmium and lead by a rootedaquatic macrophyte (Elodea canadensis). Ecology 58, 1176–1180.
Med-GIG, 2009. WFD Intercalibration technical report for coastal and transitionalwaters in the Mediterranean ecoregion. In: WFD Intercalibration TechnicalReport – Part 3: Coastal and Transitional Waters. Luxembourg, 10.
Olesik, J., Jones, D., 2006. Strategies to develop methods using ion-molecule reac-tions in a quadrupole reaction cell to overcome spectral overlaps in inductivelycoupled plasma mass spectrometry. Journal of Analytical Atomic Spectrometry21, 141–159.
Pasqualini, V., Pergent-Martini, C., Clabaut, P., Pergent, G., 1998. Mapping of Posidoniaoceanica using aerial photographs and side scan sonar: application off the Islandof Corsica (France). Estuarine. Coastal and Shelf Science 47, 359–367.
Pergent-Martini, C., 1994. Impact d’un rejet d’eaux uses urbaines sur l’herbier àPosidonia oceanica, avant et après la mise en service d’une station d’épuration.Docteur en Ecologie Marine, Faculté des Sciences, Université de Corse, 208.
Pergent-Martini, C., Leoni, V., Pasqualini, V., Ardizzone, G.D., Balestri, E., Bedini, R.,Belluscio, A., Belsher, T., Borg, J., Boudouresque, C.F., Boumaza, S., Bouquegneau,J.M., Buia, M.C., Calvo, S., Cebrian, J., Charbonnel, E., Cinelli, F., Cossu, A., Di Maida,G., Dural, B., Francour, P., Gobert, S., Lepoint, G., Meinesz, A., Molenaar, H., Man-sour, H.M., Panayotidis, P., Peirano, A., Pergent, G., Piazzi, L., Pirrotta, M., Relini,G., Romero, J., Sanchez-Lizaso, J.L., Semroud, R., Shembri, P., Shili, A., Tomasello,A., Velimirov, B., 2005. Descriptors of Posidonia oceanica meadows: use andapplication. Ecological Indicators 5, 213–230.
Ravindra, K., Bencs, L., Van Grieken, R., 2004. Platinum group elements in the envi-ronment and their health risk. The Science of the Total Environment 318, 1–43.
Romero, J., Martinez-Crego, B., Alcoverro, T., Perez, M., 2007a. Corrigendum to “Amultivariate index based on the seagrass Posidonia oceanica (POMI) to assessecological status of coastal waters under the water framework directive (WFD)”.Marine Pollution Bulletin 54, 631.
Romero, J., Martinez-Crego, B., Alcoverro, T., Perez, M., 2007b. A multivariate indexbased on the seagrass Posidonia oceanica (POMI) to assess ecological status ofcoastal waters under the water framework directive (WFD). Marine PollutionBulletin 55, 196–204.
Santos, M., Hallers-Tjabbes, C.T., Santos, A., Vieira, N., 2002. Imposex in Nucellalapillus, a bioindicator for TBT contamination: re-survey along the Portuguesecoast to monitor the effectiveness of EU regulation. Journal of Sea Research 48,217–223.
Schlacher-Hoenlinger, M.A, Schlacher, T.A., 1998. Accumulation, contamination, andseasonal variability of trace metals in the coastal zone - Patterns in a seagrassmeadow from the Mediterranean. Marine Biology 131, 401–410.
Srivastava, A., Shyam, S., 2007. Edaphology of molybdenum nutrition in citrus: areview. Agricultural Reviews 28, 93–106.
Tranchina, L., Bellia, S., Brai, M., Hauser, S., Rizzo, S., Bartolotta, A., Basile, S., 2004.Chemistry, mineralogy and radioactivity in “Posidonia oceanica” meadows fromNorth-Western Sicily. Chemical Ecology 20, 203–214.
Tranchina, L., Micciche, S., Bartolotta, A., Brai, M., Mantegna, R.N., 2005. Posidoniaoceanica as a historical monitor device of lead concentration in marine environ-ment. Environmental Science and Technology 39, 3006–3012.
Warnau, M., Fowler, S.W., Teyssie, J.L., 1996. Biokinetics of selected heavy met-als and radionuclides in two marine macrophytes: the seagrass Posidoniaoceanica and the alga Caulerpa taxifolia. Marine Environmental Research 41,343–362.
Warnau, M., Ledent, G., Temara, A., Bouquegneau, J., Jangoux, M., Dubois, P., 1995.Heavy metals in Posidonia oceanica and Paracentrotus lividus from seagrass beds
of the north-western Mediterranean. The Science of the Total Environment 171,95–99.Wieser, M.E., Schwieters, J.B., 2005. The development of multiple collector massspectrometry for isotope ratio measurements. International Journal of MassSpectrometry 242, 97–115.
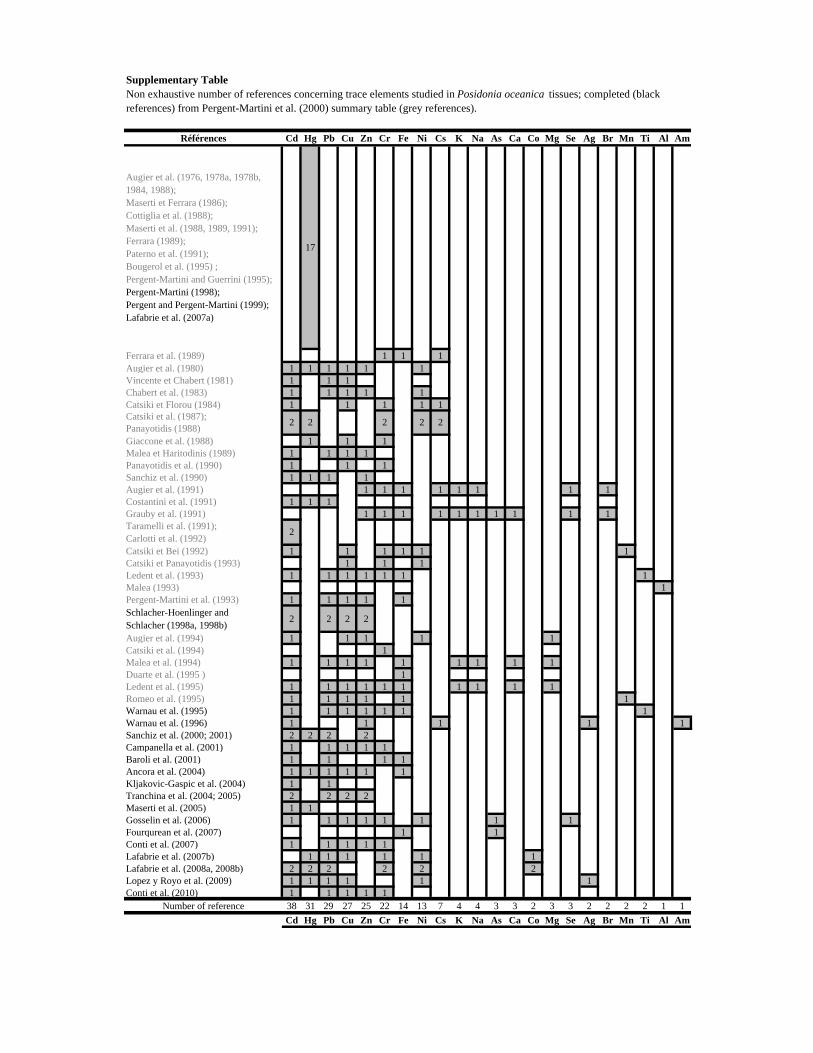
Références Cd Hg Pb Cu Zn Cr Fe Ni Cs K Na As Ca Co Mg Se Ag Br Mn Ti Al Am
Augier et al. (1976, 1978a, 1978b, 1984, 1988);Maserti et Ferrara (1986);Cottiglia et al. (1988);Maserti et al. (1988, 1989, 1991);Ferrara (1989);Paterno et al. (1991);Bougerol et al. (1995) ;Pergent-Martini and Guerrini (1995);Pergent-Martini (1998);Pergent and Pergent-Martini (1999);Lafabrie et al. (2007a)
17
Ferrara et al. (1989) 1 1 1Augier et al. (1980) 1 1 1 1 1 1Vincente et Chabert (1981) 1 1 1Chabert et al. (1983) 1 1 1 1 1Catsiki et Florou (1984) 1 1 1 1 1Catsiki et al. (1987);Panayotidis (1988)Giaccone et al. (1988) 1 1 1Malea et Haritodinis (1989) 1 1 1 1Panayotidis et al. (1990) 1 1 1Sanchiz et al. (1990) 1 1 1 1Augier et al. (1991) 1 1 1 1 1 1 1 1Costantini et al. (1991) 1 1 1Grauby et al. (1991) 1 1 1 1 1 1 1 1 1 1Taramelli et al. (1991);Carlotti et al. (1992)Catsiki et Bei (1992) 1 1 1 1 1 1Catsiki et Panayotidis (1993) 1 1 1Ledent et al. (1993) 1 1 1 1 1 1 1Malea (1993) 1Pergent-Martini et al. (1993) 1 1 1 1 1Schlacher-Hoenlinger and Schlacher (1998a, 1998b) 2 2 2 2
Augier et al. (1994) 1 1 1 1 1Catsiki et al. (1994) 1Malea et al. (1994) 1 1 1 1 1 1 1 1 1Duarte et al. (1995 ) 1Ledent et al. (1995) 1 1 1 1 1 1 1 1 1 1Romeo et al. (1995) 1 1 1 1 1 1Warnau et al. (1995) 1 1 1 1 1 1 1Warnau et al. (1996) 1 1 1 1 1Sanchiz et al. (2000; 2001) 2 2 2 2Campanella et al. (2001) 1 1 1 1 1Baroli et al. (2001) 1 1 1 1Ancora et al. (2004) 1 1 1 1 1 1Kljakovic-Gaspic et al. (2004) 1 1Tranchina et al. (2004; 2005) 2 2 2 2Maserti et al. (2005) 1 1Gosselin et al. (2006) 1 1 1 1 1 1 1 1Fourqurean et al. (2007) 1 1Conti et al. (2007) 1 1 1 1 1Lafabrie et al. (2007b) 1 1 1 1 1 1Lafabrie et al. (2008a, 2008b) 2 2 2 2 2 2Lopez y Royo et al. (2009) 1 1 1 1 1 1Conti et al. (2010) 1 1 1 1 1
Number of reference 38 31 29 27 25 22 14 13 7 4 4 3 3 2 3 3 2 2 2 2 1 1Cd Hg Pb Cu Zn Cr Fe Ni Cs K Na As Ca Co Mg Se Ag Br Mn Ti Al Am
2
2 22
Supplementary TableNon exhaustive number of references concerning trace elements studied in Posidonia oceanica tissues; completed (black references) from Pergent-Martini et al. (2000) summary table (grey references).
2 2
Supplementary references
Ancora, S., N. Bianchi, A. Butini, M.C. Buia, M.C. Gambi and C. Leonzio, 2004. Posidonia oceanica as a biomonitor of trace elements in the Gulf of Naples: temporal trends by lepidochronology. Environmental Toxicology and Chemistry 23(5), 1093-1099.
Augier, H., G. Gilles and G. Ramonda, 1976. Recherches sur la pollution mercurielle en rade d’Hyères et dans l’archipel des Stoechades (Méditerranée, France). 1 - Teneur en mercure des eaux, des sédiments et des phanérogames marines de milieu lagunaire de l’anse de Port-Cros (Parc National). Travaux scientifiques Parc national de Port-Cros 2, 23-28.
Augier, H., G. Gilles and G. Ramonda, 1978a. Recherche sur la pollution mercurielle du milieu maritime dans la région de Marseille (Méditerranée, France): degré de contamination par le mercure de la Phanérogame marine Posidonia oceanica Delile à proximité du complexe portuaire et dans la zone de rejet du grand collecteur d’égout de la ville de Marseille. Environmental Pollution 17, 269-285.
Augier, H., G. Gilles and G. Ramonda, 1978b. Recherche sur la pollution mercurielle dans le golfe de Fos (Méditerranée, France): degré de contamination par le mercure des Phanérogames marines Posidonia oceanica Delile, Zostera noltii Horneman et Zostera marina (L.). Revue International d’Océanographie Médicale 51-52, 55-69.
Augier, H., G. Gilles and G. Ramonda, 1980. Recherches sur la pollution mercurielle en rade d’Hyères et dans l’archipel des Stoechades (Méditerranée, France). 6 - Teneur en mercure de la flore et de la faune marines benthiques de la crique de la Licastre. Travaux scientifiques Parc national de Port-Cros 6, 133-145.
Augier, H., G. Gilles and G. Ramonda, 1984. L’herbier de Posidonia oceanica et la pollution par le mercure sur le littoral des Bouches-du-Rhône et du Var (France), in: C. F. Boudouresque, A. Jeudy de Grissac and J. Olivier, International Workshop Posidonia oceanica Beds, GIS Posidonie publ., Marseille, 156.
Augier, H., J. M. Harmand and G. Ramonda, 1994. Pleasure harbours are responsible for the metallic contamination of Posidonia oceanica meadows, in: E. Ozhan, First International Conference on the Mediterranean Coastal Environment, MEDCOAST 93, MEDCOAST Secretariat, Middle East Technical University publ., Ankara, 127-141.
Augier, H., G. Ramonda, M. Santimone and C. Taglioni, 1988. Etude de la contamination mercurielle de la phanérogame marine Posidonia oceanica (L.) Delile dans la zone d’épandage des eaux usées de l’émissaire de Giens (Var, Méditerranée, France). Rapport Commission Internationale pour l’Exploration Scientifique de la Méditerranée 31(2), 156.
Augier, H., C. Ronneau, P. Roucoux, R. Lion and O. Charlent, 1991. Neutron-activation analysis of the elementary composition of the marine phanerogam Posidonia oceanica from a reference area in Port Cros National Park (French Mediterranean). Marine Biology 109(2), 345-353.
Baroli, M., A. Cristini, A. Cossu, G. de Falco, V. Gazale, C. Pergent-Martini and G. Pergent, 2001. Concentrations of trace metals (Cd, Cu, Fe and Pb) in Posidonia oceanica seagrass of Liscia Bay, Sardinia (Italy), in: Springer-Verlag, Mediterranean Ecosystems: structures and processes, Italy, Ch 13: 95-99.
Bougerol, X., G. Pergent and J. Gilbert, 1995. Compared bioaccumulation of mercury between the marine phanerogam Posidonia oceanica and the herbivorous fish Sarpa salpa: preliminary results. Rapport Commission Internationale pour l’Exploration Scientifique de la Méditerranée 34, 135.
Campanella, L., M. E. Conti, F. Cubadda and C. Sucapane, 2001. Trace metals in seagrass, algae and molluscs from an uncontaminated area in the Mediterranean. Environmental Pollution 111(1), 117-126.
Carlotti, P., C. F. Boudouresque and D. Calmet, 1992. Mémorisation du cadmium et de radioéléments par les rhizomes et les écailles de Posidonia oceanica (Potamogetonaceae). Travaux Scientifiques du Parc Naturel Régional et Réserves naturelles de Corse 36, pp. 1-34.
Catsiki, V. A. and H. Florou, 1984. Bioaccumulation des métaux Cr, Cd, Ni, et Cu dans le golfe de Gera, Ile de Lesvos, Mer Egée, Grèce (Note préliminaire). Journées d’études sur les pollutions marines en Méditerranée, Lucerne, C.I.E.S.M., 317-320.
Catsiki, V. A., P. Panayotidis and E. Papathanassiou, 1987. Bioaccumulation of heavy metals by seagrasses in Greek coastal waters. Posidonia Newsletter 1(2), 21-30.
Catsiki, V. A. and F. Bei, 1992. Determination of trace metals in benthic organisms from an unpolluted area: Cyclades Islands (Aegean Sea). Fresenius Environmental Bulletin 1, 60-65.
Catsiki, V. and P. Panayotidis, 1993. Copper, chromium and nickel in tissues of the Mediterranean seagrasses Posidonia oceanica and Cymodocea nodosa (Potamogetonaceae) from Greek coastal areas. Chemosphere 26(5), 963-978.
Catsiki, V., C. Katsilieri and V. Gialamas, 1994. Chromium distribution in benthic species from a gulf receiving tanney wastes (Gulf of Geras Lesbos Island, Greece). The Science of the Total Environment 145(1-2), 173-185.
Chabert, D., N. Vicente and W. Huang, 1983. La pollution par les métaux lourds dans les rades du Parc national de Port-Cros. II. Contrôle pluriannuel. Travaux scientifiques Parc national de Port-Cros 9, 17-34.
Conti, M., M. Iacobucci and G. Cecchetti, 2007. A biomonitoring study: trace metals in seagrass, algae and molluscs in a marine reference ecosystem (Southern Tyrrhenian Sea). International Journal of Environment and Pollution 29(1-3), 308-332.
Conti, M., B. Bocca, M. Iacobucci, M. Finoia, M. Mecozzi and A. Pino, 2010. Baseline trace metals in seagrass, algae, and mollusks in a Southern Tyrrhenian Ecosystem (Linosa Island, Sicily). Archives of Environmental Contamination and Toxicology 58(1), 79-95.
Costantini, S., R. Giordano, L. Ciaralli and E. Beccaloni, 1991. Mercury, cadmium and lead evaluation in Posidonia oceanica and Codium tomentuosum. Marine Pollution Bulletin 22(7), 362-363.
Cottiglia, M., C. Mascia, M. Porcu and L. Spanedda, 1988. Distribution and dynamics of mercury in organisms of Posidonia oceanica beds. Annuar. Ist . Mus. Zool. Univ. Napoli 26, 1-30.
Duarte, C. M., M. Merino and M. Gallegos, 1995. Evidence of iron deficiency in seagrasses growing above carbonate sediments. Limnology and Oceanography 40(6), 1153-1158.
Ferrara, R., B. E. Maserti and P. Paterno, 1989. Mercury distribution in marine sediment and its correlation with the Posidonia oceanica prairie in a coastal area affected by a chlor-alkali complex. Toxicological and Environmental Chemistry 22, 131-134.
Fourqurean, J., N. Marba, C. Duarte, E. Diaz-Almela and S. Ruiz-Halpern, 2007. Spatial and temporal variation in the elemental and stable isotopic content of the seagrasses Posidonia oceanica and Cymodocea nodosa from the Illes Balears, Spain. Marine Biology 151(1), 219-232.
Giaccone, G., A. Cossu, R. Delorenzo, D. Drago and P. N. Muscetta, 1988. Studio di impatto ambientale nell’area portuale antistante lo stabilimento industriale EniChem di Porto Torres. Boll. Soc. Sarda Sci. Nat. 26, 43-67.
Gosselin, M., J.-M. Bouquegneau, F. Lefèbvre, G. Lepoint, G. Pergent, C. Pergent-Martini and S. Gobert, 2006. Trace metal concentrations in Posidonia oceanica of North Corsica (northwestern Mediterranean Sea): use as a biological monitor? BMC Ecology 6(12), 1-19.
Grauby, H., H. Augier, R. Lion and O. Charlent, 1991. Neutron activation analysis of elemental composition in marine phanerogam, Posidonia oceanica (L.) Delile: a biological indicator of pollution. Environmental and Experimental Botany 31(3), 255-263.
Kljakovic-Gaspic, Z., B. Antolic, T. Zvonaric and A. Baric, 2004. Distribution of cadmium and lead in Posidonia oceanica (L.) Delile from the middle Adriatic Sea. Fresenius Environmental Bulletin 13(11B), 1210-1215.
Lafabrie, C., G. Pergent, C. Pergent-Martini and A. Capiomont, 2007a. Posidonia oceanica: a tracer of past mercury contamination. Environmental Pollution 148(2), 688-692.
Lafabrie, C., G. Pergent, R. Kantin, C. Pergent-Martini and J.L. Gonzalez, 2007b. Trace metals assessment in water, sediment, mussel and seagrass species - Validation of the use of Posidonia oceanica as a metal biomonitor. Chemosphere 68(11), 2033-2039.
Lafabrie, C., C. Pergent-Martini and G. Pergent, 2008a. Metal contamination of Posidonia oceanica meadows along the Corsican coastline (Mediterranean). Environmental Pollution 151, 262-268.
Lafabrie, C., C. Pergent-Martini and G. Pergent, 2008b. First results on the study of metal contamination along the Corsican coastline using Posidonia oceanica. Marine Pollution Bulletin 57(1-5), 155-159.
Ledent, G., M. Warnau, A. Temara, M. Jangoux and P. Dubois 1993. Contamination par les métaux lourds et dynamiques de l’accumulation du cadmium chez la phanérogame marine Posidonia oceanica, in: C. F. Boudouresque, M. Avon and C. Pergent-Martini, Qualité du milieu marin - Indicateurs biologiques et physico chimiques, GIS Posidonie publ. Marseille, 249-259.
Ledent, G., M. A. Mateo, M. Warnau, A. Temara, J. Romero and P. Dubois, 1995. Element losses following distilled water rinsing of leaves of the seagrass Posidonia oceanica (L.) Delile. Aquatic Botany 5(3), 229-235.
Lopez y Royo, C., C. Silvestri, M. Salivas-Decaux, G. Pergent and G. Casazza, 2009. Application of an angiosperm-based classification system (BiPo) to Mediterranean coastal waters: using spatial analysis and data on metal contamination of plants in identifying sources of pressure. Hydrobiologia 633(1), 169-179.
Malea, P. and S. Haritonidis, 1989. Uptake of Cu, Cd, Zn and Pb in Posidonia oceanica (Linnaeus) from Antikyra Gulf, Greece: preliminary note. Marine Environmental Research 28, 495-498.
Malea, P., 1993. Bioaccumulation of aluminium in the seagrasses Cymodocea nodosa (Ucria) Aschers and Posidonia oceanica (L.) Delile and in macroalgae of the gulf of Antikyra (Greece). Botanica Marina 36(5), 423-431.
Malea, P., S. Haritonidis and T. Kevrekidis, 1994. Seasonal and local variation of metal concentrations in the seagrass Posidonia oceanica (L.) Delile in the Antikyra Gulf, Greece. The Science of the Total Environment 153(3), 225-235.
Maserti, B. E. and R. Ferrara, 1986. Observations on mercury uptake in Posidonia oceanica (L.) Delile. Rapport de la Communauté Internationale de la Mer Méditerranée 30(2), 24.
Maserti, B. E., R. Ferrara and P. Paterno, 1988. Posidonia as an indicator of mercury contamination. Marine Pollution Bulletin 19(8), 381-382.
Maserti, B. E., R. Ferrara and P. Paterno, 1989. Contributo della communità epifita alla mobilizzazione del mercurio nelle praterie di Posidonia oceanica (L.) Delile. Oebalia 15(1), 183-187.
Maserti, B. E., R. Ferrara and M. Morelli, 1991. Posidonia oceanica: uptake and mobilization of mercury in the Mediterranean basin. FAO/UNEP/IAEA consultation meeting on the accumulation and transformation of chemical contaminants by biotic and abiotic processes in the marine environment. MAP Technical Reports 59, 1-392.
Maserti, B. E., V. Ferrillo, O. Avdis, U. Nesti, A. Di Garbo, A. Catsiki and P. L. Maestrini, 2005. Relationship of non-protein thiol pools and accumulated Cd or Hg in the marine macrophyte Posidonia oceanica (L.) Delile. Aquatic Toxicology 75(3), 288-292.
Panayotidis, P., 1988. Etude de l’impact de la pollution sur les herbiers de Posidonia oceanica (Linnaeus) Delile, dans le golfe Saronikos (Mer Egée, Grèce), in: Etude des modifications de l’écosystème dans les zones soumises à l’influence des polluants (Activité 1), UNEP. MAP Technical Reports 22, 85-104.
Panayotidis, P., P. Makris and V.A. Catsiki, 1990. Cycle de bioaccumulation du Cu, Cd et Cr dans les écailles de Posidonia oceanica. Rapport Commission Internationale pour l’Exploration Scientifique de la Méditerranée 32(1), 13.
Paterno, P., G. Cardellicchio, G. Leone, C. Marra and S. Piraino, 1991. Mercury and tin distribution in Posidonia oceanica (L.) Delile into the Taranto Gulf (Italy). Oebalia 17(1), 265-277.
Pergent-Martini, C., 1998. Posidonia oceanica: a biological indicator of past and present mercury contamination in the Mediterranean Sea. Marine Environmental Research 45(2), 101-111.
Pergent-Martini, C., V. Rico-Raimondino, G. Pergent, C. F. Boudouresque, J. M. Bouquegneau and A. Arnoux, 1993. Mémorisation des métaux-traces par Posidonia oceanica, in: C. F. Boudouresque, M. Avon and C. Pergent-Martini, Qualité du milieu marin - Indicateurs biologiques et physico chimiques, Rencontres scientifiques de la Côte Bleue, GIS Posidonie publ., Marseille, 3, 105-120 .
Pergent-Martini, C. and P. Guerrini, 1995. Concentration of mercury in marine phanerogam Posidonia oceanica, preliminary results. Rapport Commission Internationale pour l’Exploration Scientifique de la Méditerranée 34, 143.
Pergent, G. and C. Pergent-Martini, 1999. Mercury levels and fluxes in Posidonia oceanica meadows. Environmental Pollution 106(1), 33-37.
Pergent-Martini, C. and G. Pergent, 2000. Marine phanerogams as a tool in the evaluation of marine trace-metal contamination: an example from the Mediterranean. International Journal of Environment and Pollution 13(1-6), 126-147.
Roméo, M., M. Gnassiabarelli, T. Juhel and A. Meinesz, 1995. Memorization of heavy metals by scales of the seagrass Posidonia oceanica, collected in the NW Mediterranean. Marine Ecology - Progress Series 120(1-3), 211-218.
Sanchiz, C., V. Benedito, A. Pastor and A. M. Gracia-Carrascosa, 1990. Bioaccumulation of heavy metals in Posidonia oceanica (L.) Delile and Cymodocea nodosa (Ucria) Aschers at an uncontaminated site on the east coast of Spain. Rapport Commission Internationale pour l’Exploration Scientifique de la Méditerranée 32, 13.
Sanchiz, C., A. M. Garcia-Carrascosa and A. Pastor, 2000. Heavy metal contents in soft-bottom marine macrophytes and sediments along the Mediterranean coast of Spain. Marine Ecology - Publicazioni della Stazionie Zoologica di Napoli 21(1), 1-16.
Sanchiz, C., A. M. Garcia-Carrascosa and A. Pastor, 2001. Relationships between sediment physico-chemical characteristics and heavy metal bioaccumulation in Mediterranean soft-bottom macrophytes. Aquatic Botany 69(1), 63-73.
Schlacher-Hoenlinger, M. A. and T. A. Schlacher, 1998a. Accumulation, contamination, and seasonal variability of trace metals in the coastal zone - patterns in a seagrass meadow from the Mediterranean. Marine Biology 131(3), 401-410.
Schlacher-Hoenlinger, M. A. and T. A. Schlacher, 1998b. Differential accumulation patterns of heavy metals among the dominant macrophytes of a Mediterranean seagrass meadow. Chemosphere 37(8), 1511-1519.
Taramelli, E., S. Costantini, R. Giordano, N. Olivieri and R. Pericardo, 1991. Cadmium in water, sediments and benthic organisms from a stretch of coast facing the thermoelectric power plant at Torvaldaliga (Civitavecchia, Rome), in: Rapports finaux sur les projets de recherches traitant de la bioaccumulation et de la toxicité des polluants chimiques , UNEP. MAP Technical Reports 52, 15-32.
Tranchina, L., S. Bellia, M. Brai, S. Hauser, S. Rizzo, A. Bartolotta and S. Basile, 2004. Chemistry, mineralogy and radioactivity in “Posidonia oceanica” meadows from North-Western Sicily. Chemical Ecology 20, 203-214.
Tranchina, L., M. Brai, F. D’Agostino, A. Bartolotta and G. Rizzo, 2005. Trace metals in Posidonia oceanica seagrass from south-eastern Sicily. Chemistry in Ecology 21(2), 109-118.
Vicente, N. and D. Chabert, 1981. La pollution par les métaux lourds dans les rades du Parc National de Port-Cros. 1 - Etude préliminaire. Travaux scientifiques Parc national de Port-Cros 7, 25-34.
Warnau, M., S. W. Fowler and J.L. Teyssie, 1996. Biokinetics of selected heavy metals and radionuclides in two marine macrophytes: the seagrass Posidonia oceanica and the alga Caulerpa taxifolia. Marine Environmental Research 41(4), 343-362.
Warnau, M., G. Ledent, A. Temara, J. Bouquegneau, M. Jangoux and P. Dubois, 1995. Heavy metals in Posidonia oceanica and Paracentrotus lividus from seagrass beds of the north-western Mediterranean. The Science of the Total Environment 171(1-3), 95-99.
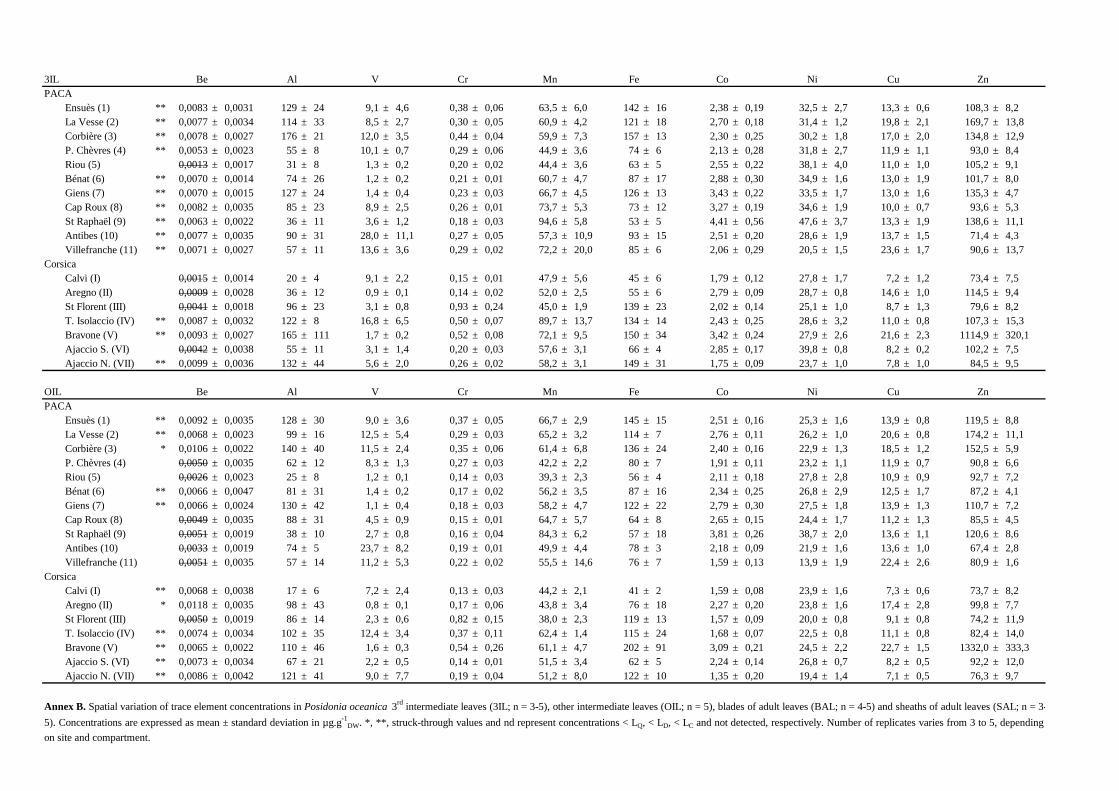
3IL Be Al V Cr Mn Fe Co Ni Cu ZnPACA
Ensuès (1) ** 0,0083 ± 0,0031 129 ± 24 9,1 ± 4,6 0,38 ± 0,06 63,5 ± 6,0 142 ± 16 2,38 ± 0,19 32,5 ± 2,7 13,3 ± 0,6 108,3± 8,2La Vesse (2) ** 0,0077 ± 0,0034 114 ± 33 8,5 ± 2,7 0,30 ± 0,05 60,9 ± 4,2 121 ± 18 2,70 ± 0,18 31,4 ± 1,2 19,8 ±2,1 169,7 ± 13,8Corbière (3) ** 0,0078 ± 0,0027 176 ± 21 12,0 ± 3,5 0,44 ± 0,04 59,9 ± 7,3 157 ± 13 2,30 ± 0,25 30,2 ± 1,8 17,0 ± 2,0 134,8 ± 12,9P. Chèvres (4) ** 0,0053 ± 0,0023 55 ± 8 10,1 ± 0,7 0,29 ± 0,06 44,9 ± 3,6 74 ± 6 2,13 ± 0,28 31,8 ± 2,7 11,9± 1,1 93,0 ± 8,4Riou (5) 0,0013± 0,0017 31 ± 8 1,3 ± 0,2 0,20 ± 0,02 44,4 ± 3,6 63 ± 5 2,55 ± 0,22 38,1 ± 4,0 11,0 ± 1,0 105,2 ± 9,1Bénat (6) ** 0,0070 ± 0,0014 74 ± 26 1,2 ± 0,2 0,21 ± 0,01 60,7 ± 4,7 87 ± 17 2,88 ± 0,30 34,9 ± 1,6 13,0 ± 1,9 101,7± 8,0Giens (7) ** 0,0070 ± 0,0015 127 ± 24 1,4 ± 0,4 0,23 ± 0,03 66,7 ± 4,5 126 ± 13 3,43 ± 0,22 33,5 ± 1,7 13,0 ± 1,6 135,3± 4,7Cap Roux (8) ** 0,0082 ± 0,0035 85 ± 23 8,9 ± 2,5 0,26 ± 0,01 73,7 ± 5,3 73 ± 12 3,27 ± 0,19 34,6 ± 1,9 10,0 ± 0,7 93,6 ± 5,3St Raphaël (9) ** 0,0063 ± 0,0022 36 ± 11 3,6 ± 1,2 0,18 ± 0,03 94,6 ± 5,8 53 ± 5 4,41 ± 0,56 47,6 ± 3,7 13,3 ±1,9 138,6 ± 11,1Antibes (10) ** 0,0077 ± 0,0035 90 ± 31 28,0 ± 11,1 0,27 ± 0,05 57,3 ± 10,9 93 ± 15 2,51 ± 0,20 28,6 ± 1,9 13,7 ± 1,5 71,4 ± 4,3Villefranche (11) ** 0,0071 ± 0,0027 57 ± 11 13,6 ± 3,6 0,29 ± 0,02 72,2 ± 20,0 85 ± 6 2,06 ± 0,29 20,5 ± 1,5 23,6 ± 1,7 90,6 ± 13,7
CorsicaCalvi (I) 0,0015± 0,0014 20 ± 4 9,1 ± 2,2 0,15 ± 0,01 47,9 ± 5,6 45 ± 6 1,79 ± 0,12 27,8 ± 1,7 7,2 ± 1,2 73,4 ± 7,5Aregno (II) 0,0009± 0,0028 36 ± 12 0,9 ± 0,1 0,14 ± 0,02 52,0 ± 2,5 55 ± 6 2,79 ± 0,09 28,7 ± 0,8 14,6 ± 1,0 114,5 ± 9,4St Florent (III) 0,0041± 0,0018 96 ± 23 3,1 ± 0,8 0,93 ± 0,24 45,0 ± 1,9 139 ± 23 2,02 ± 0,14 25,1 ± 1,0 8,7 ± 1,3 79,6 ± 8,2T. Isolaccio (IV) ** 0,0087 ± 0,0032 122 ± 8 16,8 ± 6,5 0,50 ± 0,07 89,7 ± 13,7 134 ± 14 2,43 ± 0,25 28,6± 3,2 11,0 ± 0,8 107,3 ± 15,3Bravone (V) ** 0,0093 ± 0,0027 165 ± 111 1,7 ± 0,2 0,52 ± 0,08 72,1 ± 9,5 150 ± 34 3,42 ± 0,24 27,9 ± 2,6 21,6 ± 2,3 1114,9 ± 320,1Ajaccio S. (VI) 0,0042± 0,0038 55 ± 11 3,1 ± 1,4 0,20 ± 0,03 57,6 ± 3,1 66 ± 4 2,85 ± 0,17 39,8 ± 0,8 8,2 ± 0,2 102,2 ± 7,5Ajaccio N. (VII) ** 0,0099 ± 0,0036 132 ± 44 5,6 ± 2,0 0,26 ± 0,02 58,2 ± 3,1 149 ± 31 1,75 ± 0,09 23,7 ±1,0 7,8 ± 1,0 84,5 ± 9,5
OIL Be Al V Cr Mn Fe Co Ni Cu ZnPACA
Ensuès (1) ** 0,0092 ± 0,0035 128 ± 30 9,0 ± 3,6 0,37 ± 0,05 66,7 ± 2,9 145 ± 15 2,51 ± 0,16 25,3 ± 1,6 13,9 ± 0,8 119,5± 8,8La Vesse (2) ** 0,0068 ± 0,0023 99 ± 16 12,5 ± 5,4 0,29 ± 0,03 65,2 ± 3,2 114 ± 7 2,76 ± 0,11 26,2 ± 1,0 20,6 ±0,8 174,2 ± 11,1Corbière (3) * 0,0106 ± 0,0022 140 ± 40 11,5 ± 2,4 0,35 ± 0,06 61,4 ± 6,8 136 ± 24 2,40 ± 0,16 22,9 ± 1,3 18,5 ± 1,2 152,5 ± 5,9P. Chèvres (4) 0,0050± 0,0035 62 ± 12 8,3 ± 1,3 0,27 ± 0,03 42,2 ± 2,2 80 ± 7 1,91 ± 0,11 23,2 ± 1,1 11,9 ± 0,7 90,8 ± 6,6Riou (5) 0,0026± 0,0023 25 ± 8 1,2 ± 0,1 0,14 ± 0,03 39,3 ± 2,3 56 ± 4 2,11 ± 0,18 27,8 ± 2,8 10,9 ± 0,9 92,7 ± 7,2Bénat (6) ** 0,0066 ± 0,0047 81 ± 31 1,4 ± 0,2 0,17 ± 0,02 56,2 ± 3,5 87 ± 16 2,34 ± 0,25 26,8 ± 2,9 12,5 ± 1,7 87,2± 4,1Giens (7) ** 0,0066 ± 0,0024 130 ± 42 1,1 ± 0,4 0,18 ± 0,03 58,2 ± 4,7 122 ± 22 2,79 ± 0,30 27,5 ± 1,8 13,9 ± 1,3 110,7± 7,2Cap Roux (8) 0,0049± 0,0035 88 ± 31 4,5 ± 0,9 0,15 ± 0,01 64,7 ± 5,7 64 ± 8 2,65 ± 0,15 24,4 ± 1,7 11,2 ± 1,3 85,5 ± 4,5St Raphaël (9) 0,0051± 0,0019 38 ± 10 2,7 ± 0,8 0,16 ± 0,04 84,3 ± 6,2 57 ± 18 3,81 ± 0,26 38,7 ± 2,0 13,6 ± 1,1 120,6 ± 8,6Antibes (10) 0,0033± 0,0019 74 ± 5 23,7 ± 8,2 0,19 ± 0,01 49,9 ± 4,4 78 ± 3 2,18 ± 0,09 21,9 ± 1,6 13,6 ± 1,0 67,4 ± 2,8Villefranche (11) 0,0051± 0,0035 57 ± 14 11,2 ± 5,3 0,22 ± 0,02 55,5 ± 14,6 76 ± 7 1,59 ± 0,13 13,9 ± 1,9 22,4 ± 2,6 80,9 ± 1,6
CorsicaCalvi (I) ** 0,0068 ± 0,0038 17 ± 6 7,2 ± 2,4 0,13 ± 0,03 44,2 ± 2,1 41 ± 2 1,59 ± 0,08 23,9 ± 1,6 7,3 ± 0,6 73,7 ± 8,2Aregno (II) * 0,0118 ± 0,0035 98 ± 43 0,8 ± 0,1 0,17 ± 0,06 43,8 ± 3,4 76 ± 18 2,27 ± 0,20 23,8 ± 1,6 17,4 ± 2,8 99,8 ± 7,7St Florent (III) 0,0050± 0,0019 86 ± 14 2,3 ± 0,6 0,82 ± 0,15 38,0 ± 2,3 119 ± 13 1,57 ± 0,09 20,0 ± 0,8 9,1 ± 0,8 74,2 ± 11,9T. Isolaccio (IV) ** 0,0074 ± 0,0034 102 ± 35 12,4 ± 3,4 0,37 ± 0,11 62,4 ± 1,4 115 ± 24 1,68 ± 0,07 22,5± 0,8 11,1 ± 0,8 82,4 ± 14,0Bravone (V) ** 0,0065 ± 0,0022 110 ± 46 1,6 ± 0,3 0,54 ± 0,26 61,1 ± 4,7 202 ± 91 3,09 ± 0,21 24,5 ± 2,2 22,7 ± 1,5 1332,0 ± 333,3Ajaccio S. (VI) ** 0,0073 ± 0,0034 67 ± 21 2,2 ± 0,5 0,14 ± 0,01 51,5 ± 3,4 62 ± 5 2,24 ± 0,14 26,8 ± 0,7 8,2 ± 0,5 92,2 ± 12,0Ajaccio N. (VII) ** 0,0086 ± 0,0042 121 ± 41 9,0 ± 7,7 0,19 ± 0,04 51,2 ± 8,0 122 ± 10 1,35 ± 0,20 19,4 ±1,4 7,1 ± 0,5 76,3 ± 9,7
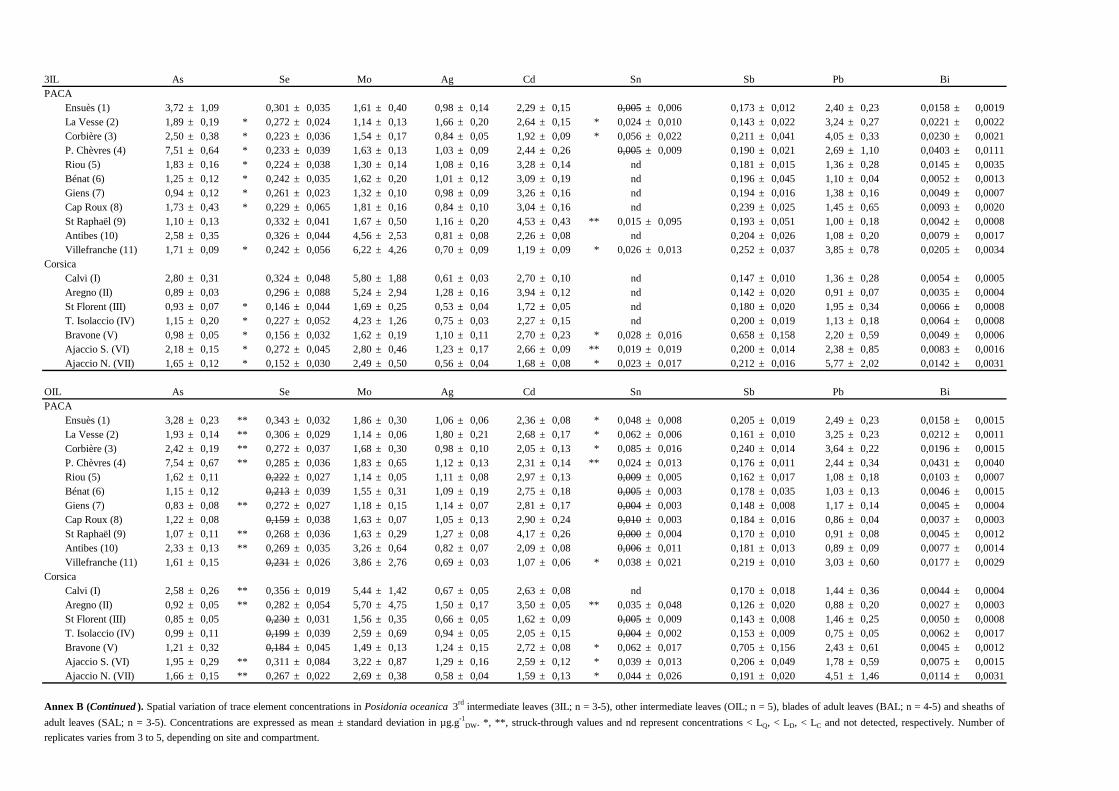
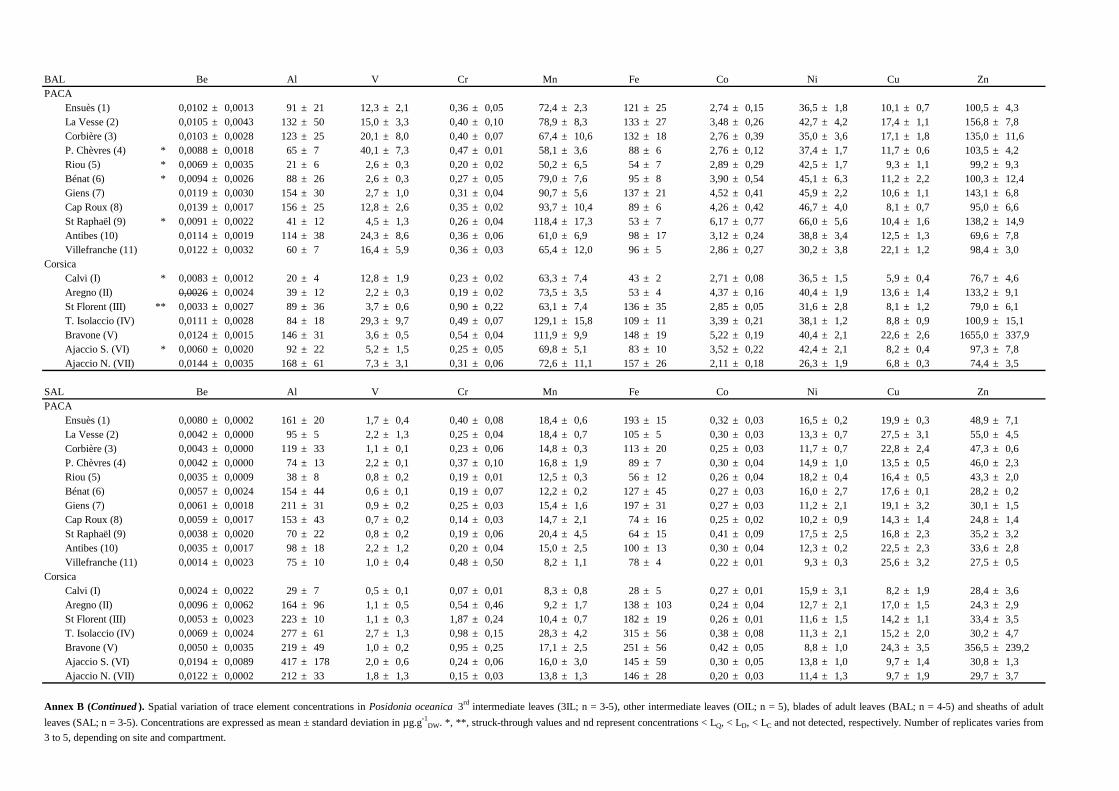
Annex B. Spatial variation of trace element concentrations inPosidonia oceanica 3rd intermediate leaves (3IL; n = 3-5), other intermediate leaves (OIL; n= 5), blades of adult leaves (BAL; n = 4-5) and sheaths of adult leaves (SAL; n= 3-
5). Concentrations are expressed as mean ± standard deviation in µg.g-1DW. *, **, struck-through values and nd represent concentrations < LQ, < LD, < LC and not detected, respectively. Number of replicates varies from 3 to5, depending
on site and compartment.
3IL As Se Mo Ag Cd Sn Sb Pb BiPACA
Ensuès (1) 3,72 ± 1,09 0,301 ± 0,035 1,61 ± 0,40 0,98 ± 0,14 2,29 ± 0,15 0,005± 0,006 0,173 ± 0,012 2,40 ± 0,23 0,0158 ± 0,0019La Vesse (2) 1,89 ± 0,19 * 0,272 ± 0,024 1,14 ± 0,13 1,66 ± 0,20 2,64 ± 0,15 * 0,024 ± 0,010 0,143 ± 0,022 3,24 ±0,27 0,0221 ± 0,0022Corbière (3) 2,50 ± 0,38 * 0,223 ± 0,036 1,54 ± 0,17 0,84 ± 0,05 1,92 ± 0,09 * 0,056 ± 0,022 0,211 ± 0,041 4,05 ± 0,33 0,0230 ± 0,0021P. Chèvres (4) 7,51 ± 0,64 * 0,233 ± 0,039 1,63 ± 0,13 1,03 ± 0,09 2,44 ± 0,26 0,005± 0,009 0,190 ± 0,021 2,69 ± 1,10 0,0403 ± 0,0111Riou (5) 1,83 ± 0,16 * 0,224 ± 0,038 1,30 ± 0,14 1,08 ± 0,16 3,28 ± 0,14 nd 0,181 ± 0,015 1,36 ± 0,28 0,0145 ± 0,0035Bénat (6) 1,25 ± 0,12 * 0,242 ± 0,035 1,62 ± 0,20 1,01 ± 0,12 3,09 ± 0,19 nd 0,196 ± 0,045 1,10 ± 0,04 0,0052 ± 0,0013Giens (7) 0,94 ± 0,12 * 0,261 ± 0,023 1,32 ± 0,10 0,98 ± 0,09 3,26 ± 0,16 nd 0,194 ± 0,016 1,38 ± 0,16 0,0049 ± 0,0007Cap Roux (8) 1,73 ± 0,43 * 0,229 ± 0,065 1,81 ± 0,16 0,84 ± 0,10 3,04 ± 0,16 nd 0,239 ± 0,025 1,45 ± 0,65 0,0093 ± 0,0020St Raphaël (9) 1,10 ± 0,13 0,332 ± 0,041 1,67 ± 0,50 1,16 ± 0,20 4,53 ± 0,43 ** 0,015 ± 0,095 0,193 ± 0,051 1,00 ± 0,18 0,0042 ± 0,0008Antibes (10) 2,58 ± 0,35 0,326 ± 0,044 4,56 ± 2,53 0,81 ± 0,08 2,26 ± 0,08 nd 0,204 ± 0,026 1,08 ± 0,20 0,0079 ± 0,0017Villefranche (11) 1,71 ± 0,09 * 0,242 ± 0,056 6,22 ± 4,26 0,70 ± 0,09 1,19 ± 0,09 * 0,026 ± 0,013 0,252 ± 0,037 3,85 ± 0,78 0,0205 ± 0,0034
CorsicaCalvi (I) 2,80 ± 0,31 0,324 ± 0,048 5,80 ± 1,88 0,61 ± 0,03 2,70 ± 0,10 nd 0,147 ± 0,010 1,36 ± 0,28 0,0054 ± 0,0005Aregno (II) 0,89 ± 0,03 0,296 ± 0,088 5,24 ± 2,94 1,28 ± 0,16 3,94 ± 0,12 nd 0,142 ± 0,020 0,91 ± 0,07 0,0035 ± 0,0004St Florent (III) 0,93 ± 0,07 * 0,146 ± 0,044 1,69 ± 0,25 0,53 ± 0,04 1,72 ± 0,05 nd 0,180 ± 0,020 1,95 ± 0,34 0,0066 ± 0,0008T. Isolaccio (IV) 1,15 ± 0,20 * 0,227 ± 0,052 4,23 ± 1,26 0,75 ± 0,03 2,27 ± 0,15 nd 0,200 ± 0,019 1,13± 0,18 0,0064 ± 0,0008Bravone (V) 0,98 ± 0,05 * 0,156 ± 0,032 1,62 ± 0,19 1,10 ± 0,11 2,70 ± 0,23 * 0,028 ± 0,016 0,658 ± 0,158 2,20 ± 0,59 0,0049 ± 0,0006Ajaccio S. (VI) 2,18 ± 0,15 * 0,272 ± 0,045 2,80 ± 0,46 1,23 ± 0,17 2,66 ± 0,09 ** 0,019 ± 0,019 0,200 ± 0,014 2,38 ± 0,85 0,0083 ± 0,0016Ajaccio N. (VII) 1,65 ± 0,12 * 0,152 ± 0,030 2,49 ± 0,50 0,56 ± 0,04 1,68 ± 0,08 * 0,023 ± 0,017 0,212 ±0,016 5,77 ± 2,02 0,0142 ± 0,0031
OIL As Se Mo Ag Cd Sn Sb Pb BiPACA
Ensuès (1) 3,28 ± 0,23 ** 0,343 ± 0,032 1,86 ± 0,30 1,06 ± 0,06 2,36 ± 0,08 * 0,048 ± 0,008 0,205 ± 0,019 2,49 ± 0,23 0,0158± 0,0015La Vesse (2) 1,93 ± 0,14 ** 0,306 ± 0,029 1,14 ± 0,06 1,80 ± 0,21 2,68 ± 0,17 * 0,062 ± 0,006 0,161 ± 0,010 3,25 ±0,23 0,0212 ± 0,0011Corbière (3) 2,42 ± 0,19 ** 0,272 ± 0,037 1,68 ± 0,30 0,98 ± 0,10 2,05 ± 0,13 * 0,085 ± 0,016 0,240 ± 0,014 3,64 ± 0,22 0,0196 ± 0,0015P. Chèvres (4) 7,54 ± 0,67 ** 0,285 ± 0,036 1,83 ± 0,65 1,12 ± 0,13 2,31 ± 0,14 ** 0,024 ± 0,013 0,176 ± 0,011 2,44± 0,34 0,0431 ± 0,0040Riou (5) 1,62 ± 0,11 0,222± 0,027 1,14 ± 0,05 1,11 ± 0,08 2,97 ± 0,13 0,009± 0,005 0,162 ± 0,017 1,08 ± 0,18 0,0103 ± 0,0007Bénat (6) 1,15 ± 0,12 0,213± 0,039 1,55 ± 0,31 1,09 ± 0,19 2,75 ± 0,18 0,005± 0,003 0,178 ± 0,035 1,03 ± 0,13 0,0046 ± 0,0015Giens (7) 0,83 ± 0,08 ** 0,272 ± 0,027 1,18 ± 0,15 1,14 ± 0,07 2,81 ± 0,17 0,004± 0,003 0,148 ± 0,008 1,17 ± 0,14 0,0045 ± 0,0004Cap Roux (8) 1,22 ± 0,08 0,159± 0,038 1,63 ± 0,07 1,05 ± 0,13 2,90 ± 0,24 0,010± 0,003 0,184 ± 0,016 0,86 ± 0,04 0,0037 ± 0,0003St Raphaël (9) 1,07 ± 0,11 ** 0,268 ± 0,036 1,63 ± 0,29 1,27 ± 0,08 4,17 ± 0,26 0,000± 0,004 0,170 ± 0,010 0,91 ± 0,08 0,0045 ± 0,0012Antibes (10) 2,33 ± 0,13 ** 0,269 ± 0,035 3,26 ± 0,64 0,82 ± 0,07 2,09 ± 0,08 0,006± 0,011 0,181 ± 0,013 0,89 ± 0,09 0,0077 ± 0,0014Villefranche (11) 1,61 ± 0,15 0,231± 0,026 3,86 ± 2,76 0,69 ± 0,03 1,07 ± 0,06 * 0,038 ± 0,021 0,219 ± 0,010 3,03 ± 0,60 0,0177 ± 0,0029
CorsicaCalvi (I) 2,58 ± 0,26 ** 0,356 ± 0,019 5,44 ± 1,42 0,67 ± 0,05 2,63 ± 0,08 nd 0,170 ± 0,018 1,44 ± 0,36 0,0044 ± 0,0004Aregno (II) 0,92 ± 0,05 ** 0,282 ± 0,054 5,70 ± 4,75 1,50 ± 0,17 3,50 ± 0,05 ** 0,035 ± 0,048 0,126 ± 0,020 0,88 ± 0,20 0,0027 ± 0,0003St Florent (III) 0,85 ± 0,05 0,230± 0,031 1,56 ± 0,35 0,66 ± 0,05 1,62 ± 0,09 0,005± 0,009 0,143 ± 0,008 1,46 ± 0,25 0,0050 ± 0,0008T. Isolaccio (IV) 0,99 ± 0,11 0,199± 0,039 2,59 ± 0,69 0,94 ± 0,05 2,05 ± 0,15 0,004± 0,002 0,153 ± 0,009 0,75 ± 0,05 0,0062 ± 0,0017Bravone (V) 1,21 ± 0,32 0,184± 0,045 1,49 ± 0,13 1,24 ± 0,15 2,72 ± 0,08 * 0,062 ± 0,017 0,705 ± 0,156 2,43 ± 0,61 0,0045 ± 0,0012Ajaccio S. (VI) 1,95 ± 0,29 ** 0,311 ± 0,084 3,22 ± 0,87 1,29 ± 0,16 2,59 ± 0,12 * 0,039 ± 0,013 0,206 ± 0,049 1,78 ± 0,59 0,0075 ± 0,0015Ajaccio N. (VII) 1,66 ± 0,15 ** 0,267 ± 0,022 2,69 ± 0,38 0,58 ± 0,04 1,59 ± 0,13 * 0,044 ± 0,026 0,191 ±0,020 4,51 ± 1,46 0,0114 ± 0,0031
Annex B (Continued ). Spatial variation of trace element concentrations inPosidonia oceanica 3rd intermediate leaves (3IL; n = 3-5), other intermediate leaves (OIL; n= 5), blades of adult leaves (BAL; n = 4-5) and sheaths of
adult leaves (SAL; n = 3-5). Concentrations are expressed as mean ± standard deviation in µg.g-1DW. *, **, struck-through values and nd represent concentrations < LQ, < LD, < LC and not detected, respectively. Number of
replicates varies from 3 to 5, depending on site and compartment.
BAL Be Al V Cr Mn Fe Co Ni Cu ZnPACA
Ensuès (1) 0,0102 ± 0,0013 91 ± 21 12,3 ± 2,1 0,36 ± 0,05 72,4 ± 2,3 121 ± 25 2,74 ± 0,15 36,5 ± 1,8 10,1 ± 0,7 100,5 ±4,3La Vesse (2) 0,0105 ± 0,0043 132 ± 50 15,0 ± 3,3 0,40 ± 0,10 78,9 ± 8,3 133 ± 27 3,48 ± 0,26 42,7 ± 4,2 17,4 ± 1,1 156,8 ± 7,8Corbière (3) 0,0103 ± 0,0028 123 ± 25 20,1 ± 8,0 0,40 ± 0,07 67,4 ± 10,6 132 ± 18 2,76 ± 0,39 35,0 ± 3,6 17,1 ± 1,8135,0 ± 11,6P. Chèvres (4) * 0,0088 ± 0,0018 65 ± 7 40,1 ± 7,3 0,47 ± 0,01 58,1 ± 3,6 88 ± 6 2,76 ± 0,12 37,4 ± 1,7 11,7± 0,6 103,5 ± 4,2Riou (5) * 0,0069 ± 0,0035 21 ± 6 2,6 ± 0,3 0,20 ± 0,02 50,2 ± 6,5 54 ± 7 2,89 ± 0,29 42,5 ± 1,7 9,3 ± 1,1 99,2 ±9,3Bénat (6) * 0,0094 ± 0,0026 88 ± 26 2,6 ± 0,3 0,27 ± 0,05 79,0 ± 7,6 95 ± 8 3,90 ± 0,54 45,1 ± 6,3 11,2 ± 2,2 100,3± 12,4Giens (7) 0,0119 ± 0,0030 154 ± 30 2,7 ± 1,0 0,31 ± 0,04 90,7 ± 5,6 137 ± 21 4,52 ± 0,41 45,9 ± 2,2 10,6 ± 1,1 143,1 ±6,8Cap Roux (8) 0,0139 ± 0,0017 156 ± 25 12,8 ± 2,6 0,35 ± 0,02 93,7 ± 10,4 89 ± 6 4,26 ± 0,42 46,7 ± 4,0 8,1 ± 0,7 95,0± 6,6St Raphaël (9) * 0,0091 ± 0,0022 41 ± 12 4,5 ± 1,3 0,26 ± 0,04 118,4 ± 17,3 53 ± 7 6,17 ± 0,77 66,0 ± 5,6 10,4 ±1,6 138,2 ± 14,9Antibes (10) 0,0114 ± 0,0019 114 ± 38 24,3 ± 8,6 0,36 ± 0,06 61,0 ± 6,9 98 ± 17 3,12 ± 0,24 38,8 ± 3,4 12,5 ± 1,3 69,6± 7,8Villefranche (11) 0,0122 ± 0,0032 60 ± 7 16,4 ± 5,9 0,36 ± 0,03 65,4 ± 12,0 96 ± 5 2,86 ± 0,27 30,2 ± 3,8 22,1± 1,2 98,4 ± 3,0
CorsicaCalvi (I) * 0,0083 ± 0,0012 20 ± 4 12,8 ± 1,9 0,23 ± 0,02 63,3 ± 7,4 43 ± 2 2,71 ± 0,08 36,5 ± 1,5 5,9 ± 0,4 76,7 ± 4,6Aregno (II) 0,0026± 0,0024 39 ± 12 2,2 ± 0,3 0,19 ± 0,02 73,5 ± 3,5 53 ± 4 4,37 ± 0,16 40,4 ± 1,9 13,6 ± 1,4 133,2 ± 9,1St Florent (III) ** 0,0033 ± 0,0027 89 ± 36 3,7 ± 0,6 0,90 ± 0,22 63,1 ± 7,4 136 ± 35 2,85 ± 0,05 31,6 ± 2,8 8,1 ± 1,2 79,0 ± 6,1T. Isolaccio (IV) 0,0111 ± 0,0028 84 ± 18 29,3 ± 9,7 0,49 ± 0,07 129,1 ± 15,8 109 ± 11 3,39 ± 0,21 38,1 ±1,2 8,8 ± 0,9 100,9 ± 15,1Bravone (V) 0,0124 ± 0,0015 146 ± 31 3,6 ± 0,5 0,54 ± 0,04 111,9 ± 9,9 148 ± 19 5,22 ± 0,19 40,4 ± 2,1 22,6 ± 2,61655,0 ± 337,9Ajaccio S. (VI) * 0,0060 ± 0,0020 92 ± 22 5,2 ± 1,5 0,25 ± 0,05 69,8 ± 5,1 83 ± 10 3,52 ± 0,22 42,4 ± 2,1 8,2 ± 0,4 97,3 ± 7,8Ajaccio N. (VII) 0,0144 ± 0,0035 168 ± 61 7,3 ± 3,1 0,31 ± 0,06 72,6 ± 11,1 157 ± 26 2,11 ± 0,18 26,3 ± 1,9 6,8 ± 0,3 74,4 ± 3,5
SAL Be Al V Cr Mn Fe Co Ni Cu ZnPACA
Ensuès (1) 0,0080 ± 0,0002 161 ± 20 1,7 ± 0,4 0,40 ± 0,08 18,4 ± 0,6 193 ± 15 0,32 ± 0,03 16,5 ± 0,2 19,9 ± 0,3 48,9 ±7,1La Vesse (2) 0,0042 ± 0,0000 95 ± 5 2,2 ± 1,3 0,25 ± 0,04 18,4 ± 0,7 105 ± 5 0,30 ± 0,03 13,3 ± 0,7 27,5 ± 3,1 55,0 ± 4,5Corbière (3) 0,0043 ± 0,0000 119 ± 33 1,1 ± 0,1 0,23 ± 0,06 14,8 ± 0,3 113 ± 20 0,25 ± 0,03 11,7 ± 0,7 22,8 ± 2,4 47,3 ± 0,6P. Chèvres (4) 0,0042 ± 0,0000 74 ± 13 2,2 ± 0,1 0,37 ± 0,10 16,8 ± 1,9 89 ± 7 0,30 ± 0,04 14,9 ± 1,0 13,5 ±0,5 46,0 ± 2,3Riou (5) 0,0035 ± 0,0009 38 ± 8 0,8 ± 0,2 0,19 ± 0,01 12,5 ± 0,3 56 ± 12 0,26 ± 0,04 18,2 ± 0,4 16,4 ± 0,5 43,3 ± 2,0Bénat (6) 0,0057 ± 0,0024 154 ± 44 0,6 ± 0,1 0,19 ± 0,07 12,2 ± 0,2 127 ± 45 0,27 ± 0,03 16,0 ± 2,7 17,6 ± 0,1 28,2 ±0,2Giens (7) 0,0061 ± 0,0018 211 ± 31 0,9 ± 0,2 0,25 ± 0,03 15,4 ± 1,6 197 ± 31 0,27 ± 0,03 11,2 ± 2,1 19,1 ± 3,2 30,1 ±1,5Cap Roux (8) 0,0059 ± 0,0017 153 ± 43 0,7 ± 0,2 0,14 ± 0,03 14,7 ± 2,1 74 ± 16 0,25 ± 0,02 10,2 ± 0,9 14,3 ± 1,4 24,8± 1,4St Raphaël (9) 0,0038 ± 0,0020 70 ± 22 0,8 ± 0,2 0,19 ± 0,06 20,4 ± 4,5 64 ± 15 0,41 ± 0,09 17,5 ± 2,5 16,8 ± 2,3 35,2 ± 3,2Antibes (10) 0,0035 ± 0,0017 98 ± 18 2,2 ± 1,2 0,20 ± 0,04 15,0 ± 2,5 100 ± 13 0,30 ± 0,04 12,3 ± 0,2 22,5 ± 2,3 33,6± 2,8Villefranche (11) 0,0014 ± 0,0023 75 ± 10 1,0 ± 0,4 0,48 ± 0,50 8,2 ± 1,1 78 ± 4 0,22 ± 0,01 9,3 ± 0,3 25,6± 3,2 27,5 ± 0,5
CorsicaCalvi (I) 0,0024 ± 0,0022 29 ± 7 0,5 ± 0,1 0,07 ± 0,01 8,3 ± 0,8 28 ± 5 0,27 ± 0,01 15,9 ± 3,1 8,2 ± 1,9 28,4 ± 3,6Aregno (II) 0,0096 ± 0,0062 164 ± 96 1,1 ± 0,5 0,54 ± 0,46 9,2 ± 1,7 138 ± 103 0,24 ± 0,04 12,7 ± 2,1 17,0 ± 1,5 24,3 ± 2,9St Florent (III) 0,0053 ± 0,0023 223 ± 10 1,1 ± 0,3 1,87 ± 0,24 10,4 ± 0,7 182 ± 19 0,26 ± 0,01 11,6 ± 1,5 14,2 ± 1,1 33,4 ± 3,5T. Isolaccio (IV) 0,0069 ± 0,0024 277 ± 61 2,7 ± 1,3 0,98 ± 0,15 28,3 ± 4,2 315 ± 56 0,38 ± 0,08 11,3 ±2,1 15,2 ± 2,0 30,2 ± 4,7Bravone (V) 0,0050 ± 0,0035 219 ± 49 1,0 ± 0,2 0,95 ± 0,25 17,1 ± 2,5 251 ± 56 0,42 ± 0,05 8,8 ± 1,0 24,3 ± 3,5356,5 ± 239,2Ajaccio S. (VI) 0,0194 ± 0,0089 417 ± 178 2,0 ± 0,6 0,24 ± 0,06 16,0 ± 3,0 145 ± 59 0,30 ± 0,05 13,8 ± 1,0 9,7 ± 1,4 30,8 ± 1,3Ajaccio N. (VII) 0,0122 ± 0,0002 212 ± 33 1,8 ± 1,3 0,15 ± 0,03 13,8 ± 1,3 146 ± 28 0,20 ± 0,03 11,4 ± 1,3 9,7 ± 1,9 29,7 ± 3,7
Annex B (Continued ). Spatial variation of trace element concentrations inPosidonia oceanica 3rd intermediate leaves (3IL; n = 3-5), other intermediate leaves (OIL; n= 5), blades of adult leaves (BAL; n = 4-5) and sheaths of adult
leaves (SAL; n = 3-5). Concentrations are expressed as mean ± standard deviation in µg.g-1DW. *, **, struck-through values and nd represent concentrations < LQ, < LD, < LC and not detected, respectively. Number of replicates varies from
3 to 5, depending on site and compartment.
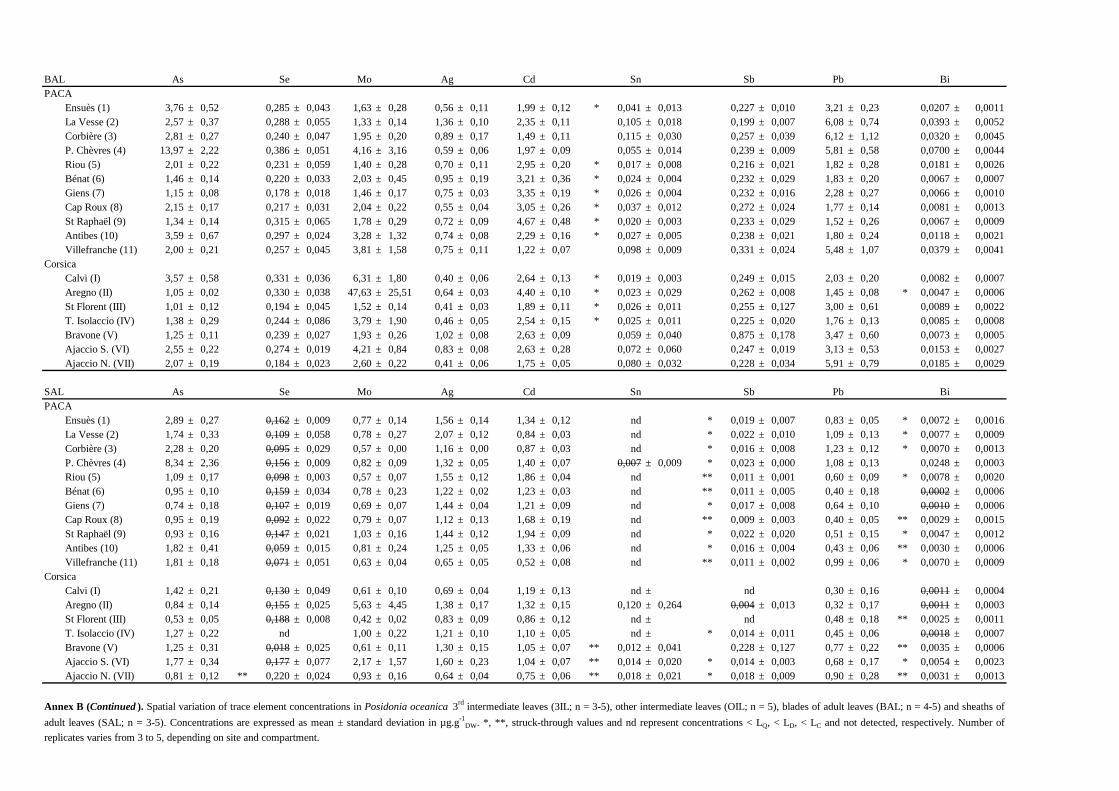
BAL As Se Mo Ag Cd Sn Sb Pb BiPACA
Ensuès (1) 3,76 ± 0,52 0,285 ± 0,043 1,63 ± 0,28 0,56 ± 0,11 1,99 ± 0,12 * 0,041 ± 0,013 0,227 ± 0,010 3,21 ± 0,23 0,0207 ±0,0011La Vesse (2) 2,57 ± 0,37 0,288 ± 0,055 1,33 ± 0,14 1,36 ± 0,10 2,35 ± 0,11 0,105 ± 0,018 0,199 ± 0,007 6,08 ± 0,740,0393 ± 0,0052Corbière (3) 2,81 ± 0,27 0,240 ± 0,047 1,95 ± 0,20 0,89 ± 0,17 1,49 ± 0,11 0,115 ± 0,030 0,257 ± 0,039 6,12 ± 1,12 0,0320 ± 0,0045P. Chèvres (4) 13,97 ± 2,22 0,386 ± 0,051 4,16 ± 3,16 0,59 ± 0,06 1,97 ± 0,09 0,055 ± 0,014 0,239 ± 0,009 5,81 ± 0,58 0,0700 ± 0,0044Riou (5) 2,01 ± 0,22 0,231 ± 0,059 1,40 ± 0,28 0,70 ± 0,11 2,95 ± 0,20 * 0,017 ± 0,008 0,216 ± 0,021 1,82 ± 0,28 0,0181 ± 0,0026Bénat (6) 1,46 ± 0,14 0,220 ± 0,033 2,03 ± 0,45 0,95 ± 0,19 3,21 ± 0,36 * 0,024 ± 0,004 0,232 ± 0,029 1,83 ± 0,20 0,0067 ±0,0007Giens (7) 1,15 ± 0,08 0,178 ± 0,018 1,46 ± 0,17 0,75 ± 0,03 3,35 ± 0,19 * 0,026 ± 0,004 0,232 ± 0,016 2,28 ± 0,27 0,0066 ±0,0010Cap Roux (8) 2,15 ± 0,17 0,217 ± 0,031 2,04 ± 0,22 0,55 ± 0,04 3,05 ± 0,26 * 0,037 ± 0,012 0,272 ± 0,024 1,77 ± 0,14 0,0081± 0,0013St Raphaël (9) 1,34 ± 0,14 0,315 ± 0,065 1,78 ± 0,29 0,72 ± 0,09 4,67 ± 0,48 * 0,020 ± 0,003 0,233 ± 0,029 1,52 ± 0,26 0,0067 ± 0,0009Antibes (10) 3,59 ± 0,67 0,297 ± 0,024 3,28 ± 1,32 0,74 ± 0,08 2,29 ± 0,16 * 0,027 ± 0,005 0,238 ± 0,021 1,80 ± 0,24 0,0118± 0,0021Villefranche (11) 2,00 ± 0,21 0,257 ± 0,045 3,81 ± 1,58 0,75 ± 0,11 1,22 ± 0,07 0,098 ± 0,009 0,331 ± 0,024 5,48 ±1,07 0,0379 ± 0,0041
CorsicaCalvi (I) 3,57 ± 0,58 0,331 ± 0,036 6,31 ± 1,80 0,40 ± 0,06 2,64 ± 0,13 * 0,019 ± 0,003 0,249 ± 0,015 2,03 ± 0,20 0,0082 ± 0,0007Aregno (II) 1,05 ± 0,02 0,330 ± 0,038 47,63 ± 25,51 0,64 ± 0,03 4,40 ± 0,10 * 0,023 ± 0,029 0,262 ± 0,008 1,45 ± 0,08* 0,0047 ± 0,0006St Florent (III) 1,01 ± 0,12 0,194 ± 0,045 1,52 ± 0,14 0,41 ± 0,03 1,89 ± 0,11 * 0,026 ± 0,011 0,255 ± 0,1273,00 ± 0,61 0,0089 ± 0,0022T. Isolaccio (IV) 1,38 ± 0,29 0,244 ± 0,086 3,79 ± 1,90 0,46 ± 0,05 2,54 ± 0,15 * 0,025 ± 0,011 0,225 ±0,020 1,76 ± 0,13 0,0085 ± 0,0008Bravone (V) 1,25 ± 0,11 0,239 ± 0,027 1,93 ± 0,26 1,02 ± 0,08 2,63 ± 0,09 0,059 ± 0,040 0,875 ± 0,178 3,47 ± 0,60 0,0073 ± 0,0005Ajaccio S. (VI) 2,55 ± 0,22 0,274 ± 0,019 4,21 ± 0,84 0,83 ± 0,08 2,63 ± 0,28 0,072 ± 0,060 0,247 ± 0,019 3,13 ± 0,53 0,0153 ± 0,0027Ajaccio N. (VII) 2,07 ± 0,19 0,184 ± 0,023 2,60 ± 0,22 0,41 ± 0,06 1,75 ± 0,05 0,080 ± 0,032 0,228 ± 0,0345,91 ± 0,79 0,0185 ± 0,0029
SAL As Se Mo Ag Cd Sn Sb Pb BiPACA
Ensuès (1) 2,89 ± 0,27 0,162± 0,009 0,77 ± 0,14 1,56 ± 0,14 1,34 ± 0,12 nd * 0,019 ± 0,007 0,83 ± 0,05 * 0,0072 ± 0,0016La Vesse (2) 1,74 ± 0,33 0,109± 0,058 0,78 ± 0,27 2,07 ± 0,12 0,84 ± 0,03 nd * 0,022 ± 0,010 1,09 ± 0,13 * 0,0077 ± 0,0009Corbière (3) 2,28 ± 0,20 0,095± 0,029 0,57 ± 0,00 1,16 ± 0,00 0,87 ± 0,03 nd * 0,016 ± 0,008 1,23 ± 0,12 * 0,0070 ± 0,0013P. Chèvres (4) 8,34 ± 2,36 0,156± 0,009 0,82 ± 0,09 1,32 ± 0,05 1,40 ± 0,07 0,007± 0,009 * 0,023 ± 0,000 1,08 ± 0,13 0,0248 ± 0,0003Riou (5) 1,09 ± 0,17 0,098± 0,003 0,57 ± 0,07 1,55 ± 0,12 1,86 ± 0,04 nd ** 0,011 ± 0,001 0,60 ± 0,09 * 0,0078 ± 0,0020Bénat (6) 0,95 ± 0,10 0,159± 0,034 0,78 ± 0,23 1,22 ± 0,02 1,23 ± 0,03 nd ** 0,011 ± 0,005 0,40 ± 0,18 0,0002± 0,0006Giens (7) 0,74 ± 0,18 0,107± 0,019 0,69 ± 0,07 1,44 ± 0,04 1,21 ± 0,09 nd * 0,017 ± 0,008 0,64 ± 0,10 0,0010± 0,0006Cap Roux (8) 0,95 ± 0,19 0,092± 0,022 0,79 ± 0,07 1,12 ± 0,13 1,68 ± 0,19 nd ** 0,009 ± 0,003 0,40 ± 0,05 ** 0,0029 ± 0,0015St Raphaël (9) 0,93 ± 0,16 0,147± 0,021 1,03 ± 0,16 1,44 ± 0,12 1,94 ± 0,09 nd * 0,022 ± 0,020 0,51 ± 0,15 * 0,0047 ± 0,0012Antibes (10) 1,82 ± 0,41 0,059± 0,015 0,81 ± 0,24 1,25 ± 0,05 1,33 ± 0,06 nd * 0,016 ± 0,004 0,43 ± 0,06 ** 0,0030 ± 0,0006Villefranche (11) 1,81 ± 0,18 0,071± 0,051 0,63 ± 0,04 0,65 ± 0,05 0,52 ± 0,08 nd ** 0,011 ± 0,002 0,99 ± 0,06 * 0,0070 ± 0,0009
CorsicaCalvi (I) 1,42 ± 0,21 0,130± 0,049 0,61 ± 0,10 0,69 ± 0,04 1,19 ± 0,13 nd ± nd 0,30 ± 0,16 0,0011± 0,0004Aregno (II) 0,84 ± 0,14 0,155± 0,025 5,63 ± 4,45 1,38 ± 0,17 1,32 ± 0,15 0,120 ± 0,264 0,004± 0,013 0,32 ± 0,17 0,0011± 0,0003St Florent (III) 0,53 ± 0,05 0,188± 0,008 0,42 ± 0,02 0,83 ± 0,09 0,86 ± 0,12 nd ± nd 0,48 ± 0,18 ** 0,0025 ± 0,0011T. Isolaccio (IV) 1,27 ± 0,22 nd 1,00 ± 0,22 1,21 ± 0,10 1,10 ± 0,05 nd ± * 0,014 ± 0,011 0,45 ± 0,06 0,0018± 0,0007Bravone (V) 1,25 ± 0,31 0,018± 0,025 0,61 ± 0,11 1,30 ± 0,15 1,05 ± 0,07 ** 0,012 ± 0,041 0,228 ± 0,127 0,77 ± 0,22 ** 0,0035 ± 0,0006Ajaccio S. (VI) 1,77 ± 0,34 0,177± 0,077 2,17 ± 1,57 1,60 ± 0,23 1,04 ± 0,07 ** 0,014 ± 0,020 * 0,014 ± 0,003 0,68 ± 0,17 * 0,0054 ± 0,0023Ajaccio N. (VII) 0,81 ± 0,12 ** 0,220 ± 0,024 0,93 ± 0,16 0,64 ± 0,04 0,75 ± 0,06 ** 0,018 ± 0,021 * 0,018± 0,009 0,90 ± 0,28 ** 0,0031 ± 0,0013
Annex B (Continued ). Spatial variation of trace element concentrations inPosidonia oceanica 3rd intermediate leaves (3IL; n = 3-5), other intermediate leaves (OIL; n= 5), blades of adult leaves (BAL; n = 4-5) and sheaths of
adult leaves (SAL; n = 3-5). Concentrations are expressed as mean ± standard deviation in µg.g-1DW. *, **, struck-through values and nd represent concentrations < LQ, < LD, < LC and not detected, respectively. Number of
replicates varies from 3 to 5, depending on site and compartment.
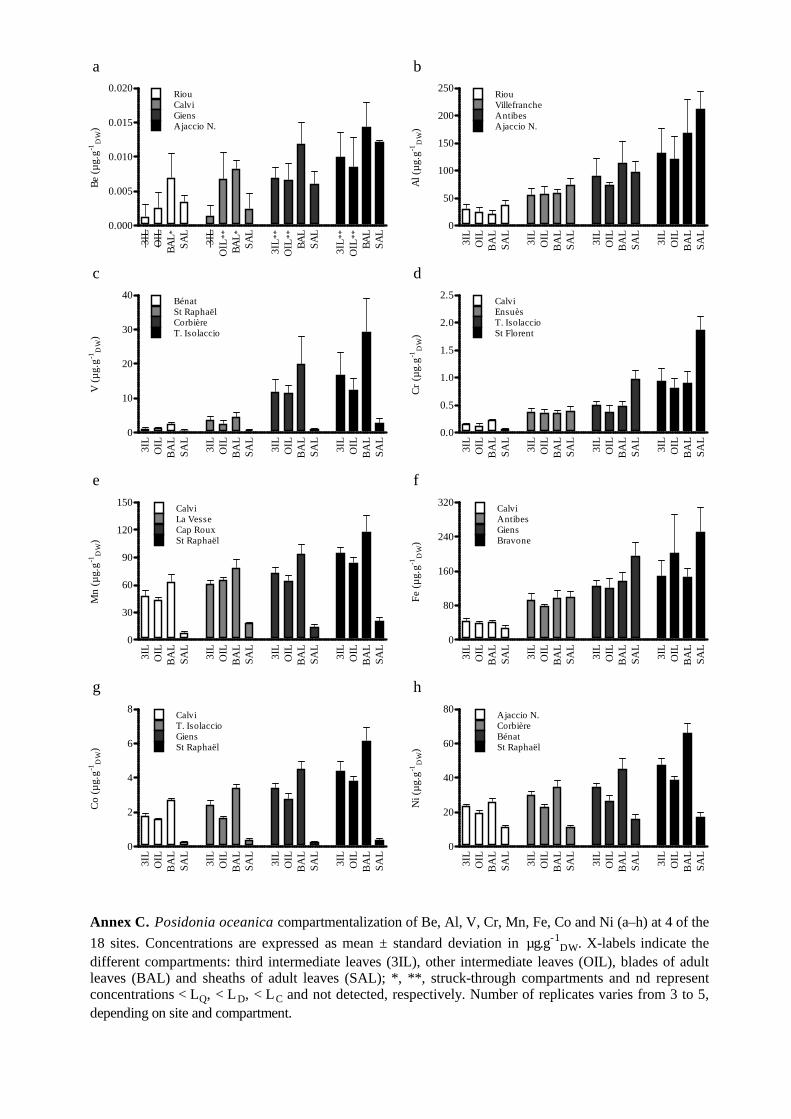
a
e f
Annex C. Posidonia oceanica compartmentalization of Be, Al, V, Cr, Mn, Fe, Co and Ni (a–h) at 4 of the
18 sites. Concentrations are expressed as mean ± standard deviation in µg.g-1DW. X-labels indicate the
different compartments: third intermediate leaves (3IL), other intermediate leaves (OIL), blades of adultleaves (BAL) and sheaths of adult leaves (SAL); *, **, struck-through compartments and nd representconcentrations < LQ, < LD, < LC and not detected, respectively. Number of replicates varies from 3 to 5,depending on site and compartment.
0.000
0.005
0.010
0.015
0.020
3IL
OIL
BA
L*
SA
L
3IL
OIL
**
BA
L*
SA
L
3IL
**
OIL
**
BA
LS
AL
3IL
**
OIL
**
BA
LS
AL
RiouCalviGiensAjaccio N.
Be
(µg.
g-1D
W)
3IL
OIL
BA
LS
AL
3IL
OIL
BA
LS
AL
3IL
OIL
BA
LS
AL
3IL
OIL
BA
LS
AL
0
50
100
150
200
250RiouVillefrancheAntibesAjaccio N.
Al (
µg.
g-1D
W)
3IL
OIL
BA
LS
AL
3IL
OIL
BA
LS
AL
3IL
OIL
BA
LS
AL
3IL
OIL
BA
LS
AL
0
10
20
30
40BénatSt RaphaëlCorbièreT. Isolaccio
V (
µg.
g-1D
W)
3IL
OIL
BA
LS
AL
3IL
OIL
BA
LS
AL
3IL
OIL
BA
LS
AL
3IL
OIL
BA
LS
AL
0.0
0.5
1.0
1.5
2.0
2.5CalviEnsuèsT. IsolaccioSt Florent
Cr
(µg.
g-1D
W)
3IL
OIL
BA
LS
AL
3IL
OIL
BA
LS
AL
3IL
OIL
BA
LS
AL
3IL
OIL
BA
LS
AL
0
30
60
90
120
150CalviLa VesseCap RouxSt Raphaël
Mn
(µg.
g-1D
W)
3IL
OIL
BA
LS
AL
3IL
OIL
BA
LS
AL
3IL
OIL
BA
LS
AL
3IL
OIL
BA
LS
AL
0
80
160
240
320CalviAntibesGiensBravone
Fe
(µg.
g-1D
W)
3IL
OIL
BA
LS
AL
3IL
OIL
BA
LS
AL
3IL
OIL
BA
LS
AL
3IL
OIL
BA
LS
AL
0
2
4
6
8CalviT. IsolaccioGiensSt Raphaël
Co
(µg.
g-1D
W)
3IL
OIL
BA
LS
AL
3IL
OIL
BA
LS
AL
3IL
OIL
BA
LS
AL
3IL
OIL
BA
LS
AL
0
20
40
60
80Ajaccio N.CorbièreBénatSt Raphaël
Ni (
µg.
g-1D
W)
b
c d
g h
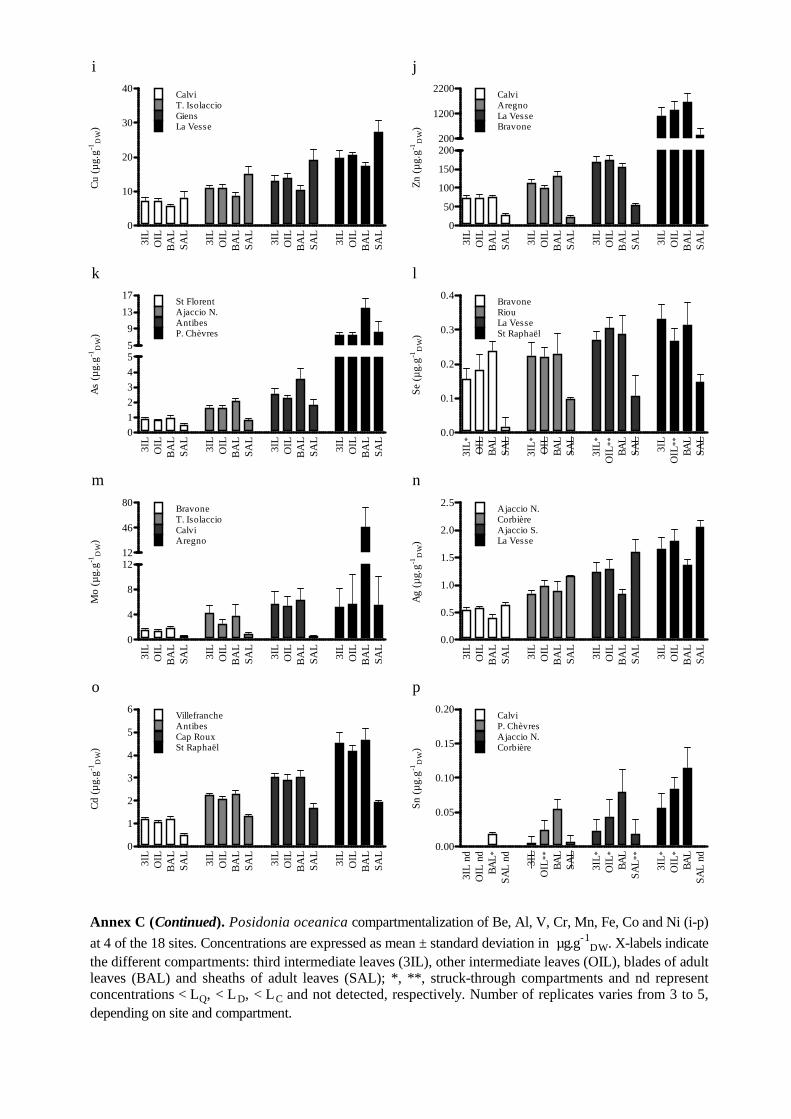
i
m n
Annex C (Continued). Posidonia oceanica compartmentalization of Be, Al, V, Cr, Mn, Fe, Co and Ni (i-p)
at 4 of the 18 sites. Concentrations are expressed as mean ± standard deviation in µg.g-1DW. X-labels indicate
the different compartments: third intermediate leaves (3IL), other intermediate leaves (OIL), blades of adultleaves (BAL) and sheaths of adult leaves (SAL); *, **, struck-through compartments and nd representconcentrations < LQ, < LD, < LC and not detected, respectively. Number of replicates varies from 3 to 5,depending on site and compartment.
3IL
OIL
BA
LS
AL
3IL
OIL
BA
LS
AL
3IL
OIL
BA
LS
AL
3IL
OIL
BA
LS
AL
0
10
20
30
40CalviT. IsolaccioGiensLa Vesse
Cu
(µg.
g-1D
W)
3IL
OIL
BA
LS
AL
3IL
OIL
BA
LS
AL
3IL
OIL
BA
LS
AL
3IL
OIL
BA
LS
AL
0
50
100
150
200200
1200
2200CalviAregnoLa VesseBravone
Zn
(µg.
g-1D
W)
3IL
OIL
BA
LS
AL
3IL
OIL
BA
LS
AL
3IL
OIL
BA
LS
AL
3IL
OIL
BA
LS
AL
0
1
2
3
4
55
9
13
17St FlorentAjaccio N.AntibesP. Chèvres
As
(µg.
g-1D
W)
0.0
0.1
0.2
0.3
0.4
3IL
*
OIL
BA
LS
AL
3IL
*
OIL
BA
LS
AL
3IL
*
OIL
**
BA
LS
AL
3IL
OIL
**
BA
LS
AL
BravoneRiouLa VesseSt Raphaël
Se
(µg.
g-1D
W)
3IL
OIL
BA
LS
AL
3IL
OIL
BA
LS
AL
3IL
OIL
BA
LS
AL
3IL
OIL
BA
LS
AL
0
4
8
1212
46
80BravoneT. IsolaccioCalviAregno
Mo
(µg.
g-1D
W)
3IL
OIL
BA
LS
AL
3IL
OIL
BA
LS
AL
3IL
OIL
BA
LS
AL
3IL
OIL
BA
LS
AL
0.0
0.5
1.0
1.5
2.0
2.5Ajaccio N.CorbièreAjaccio S.La Vesse
Ag
(µg.
g-1D
W)
3IL
OIL
BA
LS
AL
3IL
OIL
BA
LS
AL
3IL
OIL
BA
LS
AL
3IL
OIL
BA
LS
AL
0
1
2
3
4
5
6VillefrancheAntibesCap RouxSt Raphaël
Cd
(µg.
g-1D
W)
0.00
0.05
0.10
0.15
0.20
3IL
ndO
IL n
dB
AL
*
SA
L nd 3IL
OIL
**
BA
LS
AL
3IL
*
OIL
*
BA
LS
AL *
*
3IL
*
OIL
*
BA
LS
AL
nd
CalviP. ChèvresAjaccio N.Corbière
Sn
(µg.
g-1D
W)
j
k l
o p
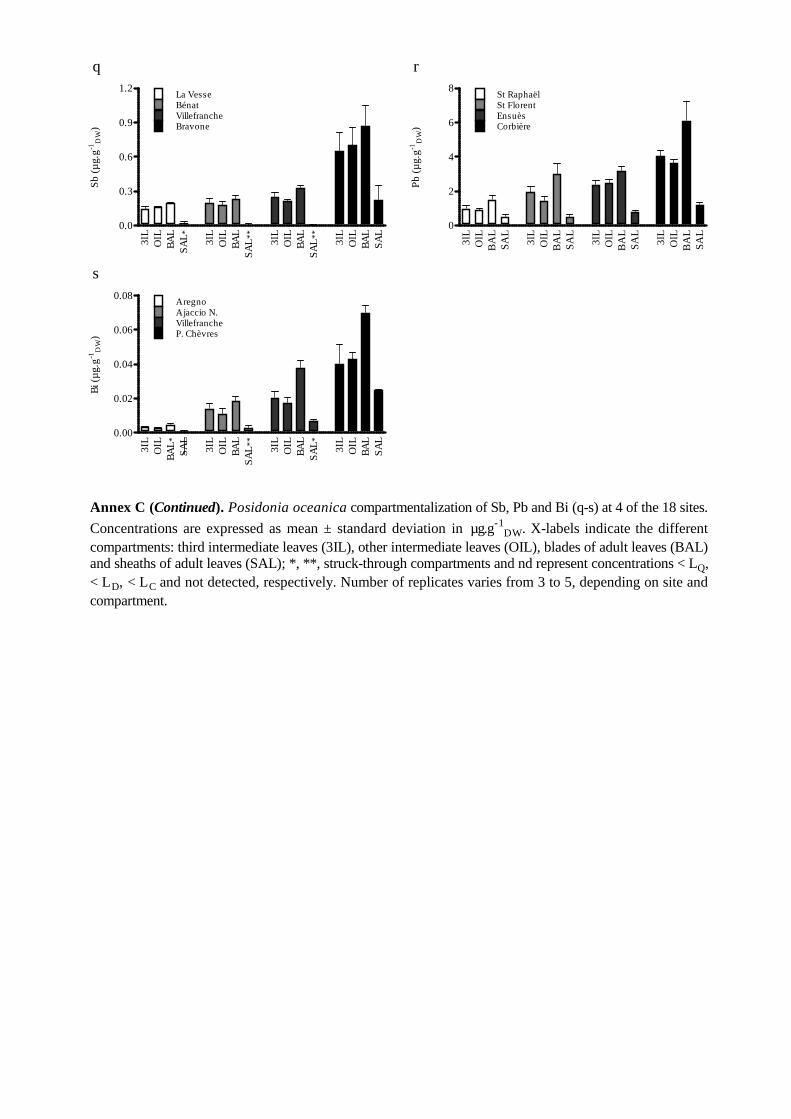
q
Annex C (Continued). Posidonia oceanica compartmentalization of Sb, Pb and Bi (q-s) at 4 of the 18 sites.
Concentrations are expressed as mean ± standard deviation in µg.g-1DW. X-labels indicate the differentcompartments: third intermediate leaves (3IL), other intermediate leaves (OIL), blades of adult leaves (BAL)and sheaths of adult leaves (SAL); *, **, struck-through compartments and nd represent concentrations < LQ,< LD, < LC and not detected, respectively. Number of replicates varies from 3 to 5, depending on site andcompartment.
0.0
0.3
0.6
0.9
1.2La VesseBénatVillefrancheBravone
3IL
OIL
BA
LS
AL * 3IL
OIL
BA
LS
AL *
*
3IL
OIL
BA
LS
AL *
*
3IL
OIL
BA
LS
AL
Sb
(µg.
g-1D
W)
3IL
OIL
BA
LS
AL
3IL
OIL
BA
LS
AL
3IL
OIL
BA
LS
AL
3IL
OIL
BA
LS
AL
0
2
4
6
8St RaphaëlSt FlorentEnsuèsCorbière
Pb
(µg.
g-1D
W)
0.00
0.02
0.04
0.06
0.08
3IL
OIL
BA
L*
SA
L
3IL
OIL
BA
LS
AL *
*
3IL
OIL
BA
LS
AL * 3IL
OIL
BA
LS
AL
AregnoAjaccio N.VillefrancheP. Chèvres
Bi (
µg.
g-1D
W)
r
s

1 2 3 4 5 6 7 8 9 10 11 I II III IV V VI VII0.000
0.006
0.012
0.018 (LQ)Mean = 0.011 µg.g-1DW
(LD)Mean = 0.007 µg.g-1DW
(LC)Mean = 0.003 µg.g-1DW
Be
(µg.
g-1D
W)
1 2 3 4 5 6 7 8 9 10 11 I II III IV V VI VII0
50
100
150
200 (LQ)Mean = 2.0 µg.g-1DW
Al (
µg.
g-1D
W)
1 2 3 4 5 6 7 8 9 10 11 I II III IV V VI VII0
5
10
15
20
25
30 (LQ)Mean = 0.021 µg.g-1DW
V (
µg.
g-1D
W)
1 2 3 4 5 6 7 8 9 10 11 I II III IV V VI VII0.00
0.25
0.50
0.75
1.00
1.25(LQ)Mean = 0.026 µg.g-1DW
Cr
(µg.
g-1D
W)
1 2 3 4 5 6 7 8 9 10 11 I II III IV V VI VII0
30
60
90
120 (LQ)Mean = 0.11 µg.g-1DW
Mn
(µg.
g DW
-1)
1 2 3 4 5 6 7 8 9 10 11 I II III IV V VI VII0
50
100
150
200
250 (LQ)Mean = 0.58 µg.g-1DW
Fe
(µg.
g DW
-1)
1 2 3 4 5 6 7 8 9 10 11 I II III IV V VI VII0
1
2
3
4
5
6(LQ)Mean = 0.021 µg.g-1DW
Co
(µg.
g-1D
W)
1 2 3 4 5 6 7 8 9 10 11 I II III IV V VI VII0
10
20
30
40
50
60 (LQ)Mean = 0.30 µg.g-1DW
Ni (
µg.
g-1D
W)
a b
c d
e f
g h
Annex D. Spatial variation of Be, Al, V, Cr, Mn, Fe, Co and Ni (a–h) concentrations inPosidonia oceanicashoots at the 18 sites: Ensuès (1), La Vesse (2), Corbière (3), Plateau des Chèvres (4), Riou (5), Bénat (6),Giens (7), Cap Roux (8), St Raphaël (9), Antibes (10), Villefranche (11), Calvi (I), Aregno (II), St Florent(III), Taglio Isolaccio (IV), Bravone (V), Ajaccio Sud (VI) and Ajaccio Nord (VII). X-axis labels indicate thesites along the coasts (1–11: PACA; I–VII: Corsica). Concentrations are expressed as mean ± standard
deviation in µg.g-1DW.

1 2 3 4 5 6 7 8 9 1011 I II III IV V VI VII0
5
10
15
20
25(LQ)Mean = 0.14 µg.g-1DW
Cu
(µg.
g-1D
W)
1 2 3 4 5 6 7 8 9 1011 I II III IV V VIVII0
50
100
150
200(LQ)Mean = 0.45 µg.g-1DW
1281± 241
Zn
(µg.
g-1D
W)
1 2 3 4 5 6 7 8 9 10 11 I II III IV V VI VII0
2
4
6
8
10
12(LQ)Mean = 0.022 µg.g-1DW
As
(µg.
g-1D
W)
1 2 3 4 5 6 7 8 9 10 11 I II III IV V VI VII0.0
0.2
0.4
0.6
0.8
(LQ)Mean = 0.75 µg.g-1DW
(LD)Mean = 0.27 µg.g-1DW
(LC)Mean = 0.14 µg.g-1DW
Se
(µg.
g-1D
W)
1 2 3 4 5 6 7 8 9 1011 I II III IV V VIVII0
2
4
6
8(LQ)Mean = 0.055 µg.gDW
-1
27 ± 14
Mo
(µg.
g-1D
W)
1 2 3 4 5 6 7 8 9 1011 I II III IV V VI VII0.0
0.5
1.0
1.5
2.0(LQ)Mean = 0.0095 µg.g-1DW
Ag
(µg.
g-1D
W)
1 2 3 4 5 6 7 8 9 1011 I II III IV V VI VII0
1
2
3
4
5(LQ)Mean = 0.010 µg.g-1DW
Cd
(µg.
g-1D
W)
1 2 3 4 5 6 7 8 9 1011 I II III IV V VI VII0.00
0.05
0.10
0.15(LQ)Mean = 0.047 µg.g-1DW
(LD)Mean = 0.017 µg.g-1DW
(LC)Mean = 0.009 µg.g-1DW
Sn
(µg.
g-1D
W; B
AL)
i j
k l
m n
o p
Annex D (Continued). Spatial variation of Cu, Zn, As, Se, Mo, Ag, Cd and Sn (BAL) (i-p) concentrations inPosidonia oceanica shoots at the 18 sites: Ensuès (1), La Vesse (2), Corbière (3), Plateau des Chèvres (4),Riou (5), Bénat (6), Giens (7), Cap Roux (8), St Raphaël (9), Antibes (10), Villefranche (11), Calvi (I),Aregno (II), St Florent (III), Taglio Isolaccio (IV), Bravone (V), Ajaccio Sud (VI) and Ajaccio Nord (VII).X-axis labels indicate the sites along the coasts (1–11: PACA; I–VII: Corsica). Concentrations are expressed
as mean ± standard deviation in µg.g-1DW.

1 2 3 4 5 6 7 8 9 1011 I II III IV V VI VII0.00
0.15
0.30
0.45
0.60
0.75
0.90(LQ)Mean = 0.036 µg.g-1DW
Sb
(µg.
g-1D
W)
1 2 3 4 5 6 7 8 9 10 11 I II III IV V VI VII0
1
2
3
4
5
6(LQ)Mean = 0.033 µg.gDW
-1
Pb
(µg.
g DW
-1)
1 2 3 4 5 6 7 8 9 1011 I II III IV V VI VII0.00
0.02
0.04
0.06(LQ)Mean = 0.0048 µg.g-1DW
(LD)Mean = 0.0018 µg.g-1DW
(LC)Mean = 0.0009 µg.g-1DW
Bi (
µg.
g-1D
W)
q r
s
Annex D (Continued). Spatial variation of Sb, Pb and Bi (q–s) concentrations inPosidonia oceanica shootsat the 18 sites: Ensuès (1), La Vesse (2), Corbière (3), Plateau des Chèvres (4), Riou (5), Bénat (6), Giens(7), Cap Roux (8), St Raphaël (9), Antibes (10), Villefranche (11), Calvi (I), Aregno (II), St Florent (III),Taglio Isolaccio (IV), Bravone (V), Ajaccio Sud (VI) and Ajaccio Nord (VII). X-axis labels indicate the sitesalong the coasts (1–11: PACA; I–VII: Corsica). Concentrations are expressed as mean ± standard deviation
in µg.g-1DW.