skeletal indicators of ecological specialization in pika
TRANSCRIPT
Skeletal Indicators of Ecological Specialization in Pika(Mammalia, Ochotonidae)
Aspen T. Reese,1,2* Hayley C. Lanier,3 and Eric J. Sargis1,2,4
1Division of Vertebrate Zoology, Yale Peabody Museum of Natural History, New Haven, Connecticut 065202Department of Ecology and Evolutionary Biology, Yale University, New Haven, Connecticut 065203Department of Ecology and Evolutionary Biology, Museum of Zoology, University of Michigan,Ann Arbor, Michigan 481094Department of Anthropology, Yale University, New Haven, Connecticut 06520
ABSTRACT Pika species generally fall into two eco-types, meadow-dwelling (burrowing) or talus-dwelling, aclassification that distinguishes a suite of different eco-logical, behavioral, and life history traits. Despite thesedifferences, little morphological variation has previouslybeen documented to distinguish among ecotypes. Theaim of this study was to test whether postcranial fea-tures related to burrowing are present in meadow-dwell-ing species and whether talus-dwelling species exhibitpostcranial modifications related to frequent leapingbetween rocks. To test this, the scapula, humerus, ulna,radius, innominate, femur, tibia, and calcaneus of 15 spe-cies were studied and measured. Twenty-three measure-ments were taken on 199 skeletons, and 19 indices wereconstructed from these measurements. Indices were com-pared between the two ecotypes using Student’s t-test.Comparisons among ecotypes, species, and subgenerawere made using one-way ANOVA with the Tukey honestsignificant difference post hoc test. Multivariate resultswere generated using principal components analyses.Thirteen forelimb and hind limb indices proved signifi-cant in distinguishing the meadow-dwelling, talus-dwell-ing, and intermediate forms. A number of these indicesare associated with burrowing or leaping in other mam-mals, providing some support for the hypothesis thatpostcranial modifications in pika are related to locomotordifferences. This evidence of morphological responses toecological specialization will be useful for reconstructingthe paleobiology of extinct taxa, assessing the behavioralvariability of extant species, and improving our under-standing of the evolutionary history of pikas. J. Morphol.274:585–602, 2013. � 2013 Wiley Periodicals, Inc.
KEY WORDS: digging; forelimb; functional morphology;hind limb; Ochotona
INTRODUCTION
Postcranial morphology is expected to reflect dif-ferences in ecology and positional behaviors, such asdigging or leaping. Despite the fact that digging andleaping behaviors have evolved several times withinmammals, many of the same traits are found acrossa wide range of species (Salton and Sargis, 2008,2009). Similar digging adaptations in the postcra-nium have been identified in several fossorial mam-mals (Hildebrand, 1985), small mammals such as
treeshrews and tenrecs (Sargis, 2002a,b; Salton andSargis, 2008, 2009), and, in isolated cases, fossillagomorphs (e.g., Averianov, 1995). Skeletal adapta-tions of the hind limbs for leaping have also beendemonstrated in several mammals, particularly pri-mates (Gabriel, 1984; Anemone, 1990; Connouret al., 2000; James et al., 2007). Such traits associ-ated with digging and leaping may have evolvedmultiple times within pikas (see Fig. 1; Yu et al.,2000).
Pikas (Lagomorpha: Ochotonidae: Ochotona) aresmall, generalist herbivores currently distributedin the northern hemisphere (Smith et al., 1990).They are typically considered to belong to one oftwo ecotypes, each associated with a suite of dis-tinct life history traits and behaviors (Smith, 1988,2008). Meadow-dwellers, often referred to as bur-rowing pikas, excavate and occupy burrows insteppe, forest, or shrub habitats. They are short-lived, highly social, and highly fecund, and theyexhibit large demographic fluctuations (Smith etal., 1990). Although they are known to burrow, lit-tle is known about the burrowing behavior of pikaor the mechanics of their burrowing. Current evi-dence indicates that they primarily employscratch-digging. They appear to use their fore- andhind feet to move dirt backwards out of the burrow(G. Schaller pers. comm.), and pika that are cap-tured sometimes have a lot of soil on their forefeet(A. Lissovsky pers. comm.). Talus-dwelling speciesinhabit boulder, talus, or scree fields. They aregenerally nonburrowing, relatively long-lived, and
Additional Supporting Information may be found in the onlineversion of this article.
*Correspondence to: Aspen T. Reese, Department of Biology, DukeUniversity, Box 90338, Durham, NC 27705.E-mail: [email protected]
Received 22 August 2012; Revised 16 November 2012;Accepted 16 December 2012
Published online 5 February 2013 inWiley Online Library (wileyonlinelibrary.com)DOI: 10.1002/jmor.20127
JOURNAL OF MORPHOLOGY 274:585–602 (2013)
� 2013 WILEY PERIODICALS, INC.

asocial, and they exhibit much lower fecundity(Smith et al., 1990). Leaping (four-footed jumpingbetween rocks that covers horizontal, and some-times vertical, distances from a few centimeters tomore than three times their body length) is a note-worthy component of their locomotor repertoire(pers. obs.). Previously, the only differencesdescribed to distinguish pika ecotypes were longervibrissae and sharp, bent claws in the talus-dwell-ing forms, and shorter vibrissae and flat, broadclaws in the meadow-dwelling forms (Fedosenko,1974; Formozov, 1981).
Of the 30 named species, both American species(O. princeps and O. collaris) and approximatelyhalf of the Asian species are talus-dwelling,whereas the rest of the Asian species are steppe-,forest-, or shrub-dwelling (henceforth referred toas meadow-dwelling; Smith et al., 1990; Yu et al.,2000; Smith, 2008). A few species, such as Pallas’sPika (O. pallasi) and the Afghan Pika (O. rufes-cens), exhibit the life history characteristics ofmeadow-dwelling species (Smith, 1988) but areknown to occur in both steppe and rocky environ-ments, where they exhibit the behaviors associatedwith those habitats (Smith, 2008). They are thustermed ‘‘intermediate’’ species (Smith, 1988).
Pika species exhibit little morphological variationin body size or shape (Smith et al., 1990; Yu et al.,2000), but high intraspecific variation (particularlyin pelage) has been noted (Corbet, 1978). Earlyattempts to explore the phylogenetic relationshipsof Ochotona focused on cranial attributes (Corbet,1978; Weston, 1982; Yu et al., 1992) and offered littleconsistent taxonomic resolution (see Yu et al., 2000).Four recent molecular studies completed since 2000(Yu et al., 2000; Niu et al., 2004; Lissovksy et al.,2007; Lanier and Olson, 2009), as well as a studythat combined cranial and mandibular data (Fosto-wicz-Frelik et al., 2010), have provided more phylo-genetic resolution within the genus.
Historically separated by palatal characteristics(Weston, 1982), three subgenera are currently rec-ognized in Ochotona based on molecular results:Pika, Ochotona, and Conothoa (Lanier and Olson,2009). However, there is continued debate regard-ing their constituent members (e.g., see Fostowicz-Frelik et al., 2010). Pika includes talus-dwellingspecies such as the two North American taxa, O.collaris, and O. princeps, as well as the intermedi-ate species O. pallasi. The subgenus Ochotonacomprises exclusively burrowing meadow-dwellingspecies. Conothoa is mixed, with approximately
Fig. 1. Phylogeny of the genus Ochotona (after Lanier and Olson, 2009). Black circles denotetalus-dwellers included in this study; dark gray squares denote meadow-dwellers included inthis study; and light gray rectangles denote intermediate taxa included in this study.
586 A.T. REESE ET AL.
Journal of Morphology
33% meadow-dwellers and 66% talus-dwellers, aswell as the intermediate species O. rufescens (seeFig. 1). These groupings accentuate the fact thatthe two ecotypes evolved multiple times, so varia-tion may exist in the specializations of differentlineages (subgenera and species) to their behav-ioral regimes (e.g., see Sargis et al., 2008). To date,no survey of pika systematics has included ananalysis of the postcranial skeleton.
Although digging has been recorded in isolatedcases for some American talus-dwelling species(Markham and Whicker, 1972), it represents anexceedingly small proportion of observed behaviors.It is expected that morphological modificationsrelated to digging, such as a long olecranon processof the ulna and medial epicondyle of the humerus(Hildebrand, 1985), will be more pronounced in bur-rowing species, which perform this behavior habitu-ally. In contrast, talus-dwelling species may exhibitmore extensive hind limb modifications, includinglonger limb bones and feet, which may be advanta-geous in frequent leaping from rock to rock. Suitesof characteristics associated with both of thesebehaviors are described in the literature on mam-malian postcranial morphology (see Salton and Sar-gis, 2008, 2009), but the entire suite is not expectedto be present in every burrowing or leaping groupor taxon.
We analyzed the postcranial morphology of pikasrepresenting both ecotypes, as well as intermedi-ate species, from across the three recognized sub-genera to test for morphological variation associ-ated with the specific behavioral regimes. Identify-
ing whether such specializations exist could helpto determine how behaviorally specialized thesetaxa are; allow for reconstructing the paleobiologyof extinct species; improve our understanding ofhow different species within each ecotype vary intheir postcranial specializations for similar locomo-tor behaviors (e.g., Sargis et al., 2008); and con-tribute to our understanding of the function of cer-tain postcranial characters, which may be used infuture phylogenetic analyses of this still poorlyresolved taxon (Hoffman and Smith, 2005).
MATERIALS AND METHODS
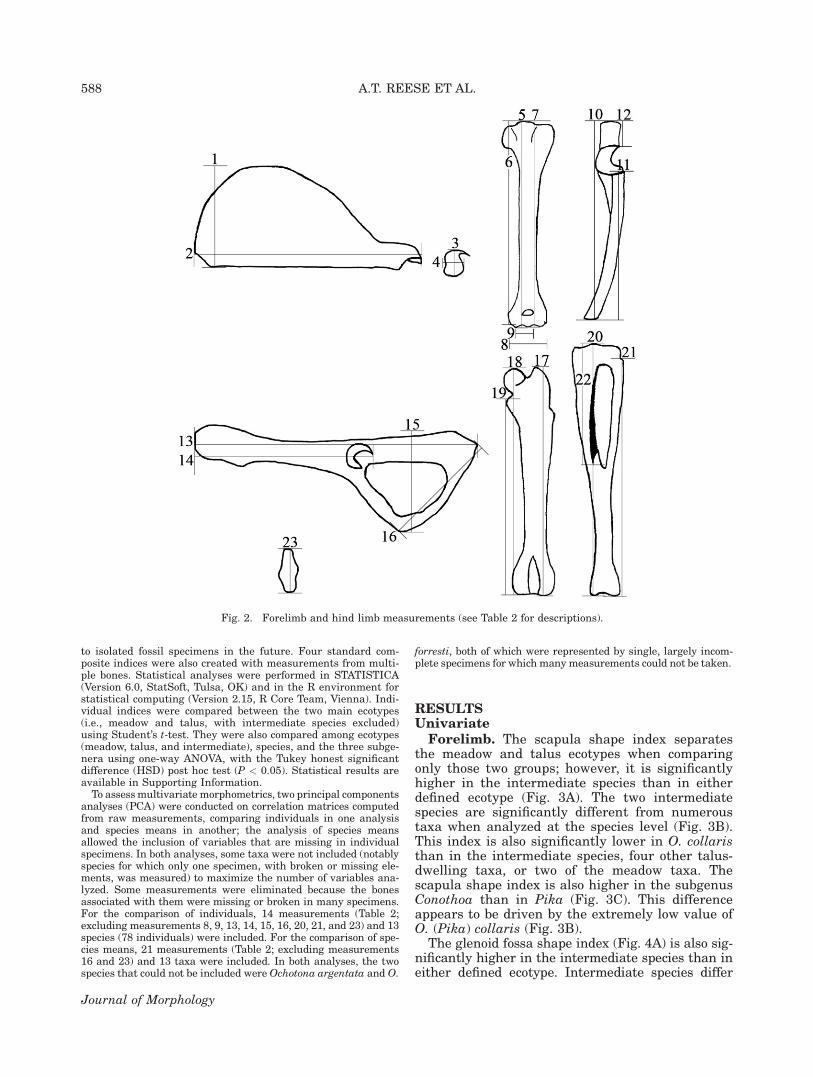
The scapula, humerus, ulna, radius, innominate, femur, tibia,and calcaneus (Fig. 2) of 199 specimens (Supporting Informa-tion), representing 15 species (Table 1), were studied and meas-ured with fine-point digital calipers. Skeletal specimens wereanalyzed at the American Museum of Natural History, Cana-dian Museum of Nature, The Natural History Museum, Univer-sity of Kansas Natural History Museum, United StatesNational Museum of Natural History, University of MichiganMuseum of Zoology, and Yale Peabody Museum of Natural His-tory. Additional specimens were borrowed from the HarvardUniversity Museum of Comparative Zoology, Museum of South-western Biology, University of California Berkeley Museum ofVertebrate Zoology, and University of Washington Burke Mu-seum and measured at the Yale Peabody Museum. Only adultspecimens, as identified by full epiphyseal fusion, dental erup-tion, and the presence of a mandibular crest for masseterattachment (Lissovsky, 2004), were measured.
Up to 23 linear measurements (Table 2, Fig. 2) were taken oneach specimen. To control for size differences between species,measurements were transformed into 19 indices (Table 3). Mostindices were created with measurements from a single bone,which allowed specimens with limited available elements to beincluded in the indices, and which will also allow comparisons
TABLE 1. Ochotona species included in this study
Species Subgenus Ecotype Rangea Body length (cm) Abbrev. n
O. alpina (Pallas, 1773) Pika Talus China; Kazakhstan;Mongolia; Russia
15.2–23.5a AL 4
O. argentata Howell, 1928 Pika Talus China 20.8–23.5a AR 1O. collaris (Nelson, 1893) Pika Talus Canada; United States 18.9b CO 81O. gloveri Thomas, 1922 Conothoa Talus China 16–22a G 1O. hyperborea (Pallas, 1811) Pika Talus China; Japan; North Korea;
Mongolia; Russia15–20.4a H 5
O. macrotis (Gunther, 1875) Conothoa Talus Afghanistan; Bhutan; China;India; Kazakhstan;Kyrgyzstan; Nepal;Pakistan; Tajikistan
15–20.4a M 12
O. princeps (Richardson, 1828) Pika Talus Canada; United States 16.2–21.6c PR 23O. roylei (Ogilby, 1839) Conothoa Talus China; India; Nepal; Pakistan 15.5–20.4a RO 10O. cansus Lyon, 1907 Ochotona Meadow China 11.6–16.5a CA 6O. curzoniae (Hodgson, 1858) Ochotona Meadow China; India; Nepal 14–19.2a CU 8O. forresti Thomas, 1923 Conothoa Meadow Bhutan; China; India; Myanmar 15.5–18.5a F 1O. ladacensis (Gunther, 1875) Conothoa Meadow China; India; Pakistan 18–22.9a L 1O. thibetana (Milne-Edwards,
1871)Ochotona Meadow Bhutan; China; India; Myanmar 14–18a T 17
O. pallasi (Gray, 1867) Pika Intermediate China; Kazakhstan;Mongolia; Russia
16–22a PA 3
O. rufescens (Gray, 1842) Conothoa Intermediate Afghanistan; Iran; Pakistan;Turkmenistan
11–25d RU 26
aIUCN, 2011.bMacDonald and Jones, 1987.cSmith and Weston, 1990.dFulk and Khokar, 1980.
ECOLOGICAL SPECIALIZATION IN PIKA 587
Journal of Morphology
to isolated fossil specimens in the future. Four standard com-posite indices were also created with measurements from multi-ple bones. Statistical analyses were performed in STATISTICA(Version 6.0, StatSoft, Tulsa, OK) and in the R environment forstatistical computing (Version 2.15, R Core Team, Vienna). Indi-vidual indices were compared between the two main ecotypes(i.e., meadow and talus, with intermediate species excluded)using Student’s t-test. They were also compared among ecotypes(meadow, talus, and intermediate), species, and the three subge-nera using one-way ANOVA, with the Tukey honest significantdifference (HSD) post hoc test (P < 0.05). Statistical results areavailable in Supporting Information.To assessmultivariate morphometrics, two principal components
analyses (PCA) were conducted on correlation matrices computedfrom raw measurements, comparing individuals in one analysisand species means in another; the analysis of species meansallowed the inclusion of variables that are missing in individualspecimens. In both analyses, some taxa were not included (notablyspecies for which only one specimen, with broken or missing ele-ments, was measured) to maximize the number of variables ana-lyzed. Some measurements were eliminated because the bonesassociated with them were missing or broken in many specimens.For the comparison of individuals, 14 measurements (Table 2;excluding measurements 8, 9, 13, 14, 15, 16, 20, 21, and 23) and 13species (78 individuals) were included. For the comparison of spe-cies means, 21 measurements (Table 2; excluding measurements16 and 23) and 13 taxa were included. In both analyses, the twospecies that could not be included wereOchotona argentata and O.
forresti, both of which were represented by single, largely incom-plete specimens for which many measurements could not be taken.
RESULTSUnivariate
Forelimb. The scapula shape index separatesthe meadow and talus ecotypes when comparingonly those two groups; however, it is significantlyhigher in the intermediate species than in eitherdefined ecotype (Fig. 3A). The two intermediatespecies are significantly different from numeroustaxa when analyzed at the species level (Fig. 3B).This index is also significantly lower in O. collaristhan in the intermediate species, four other talus-dwelling taxa, or two of the meadow taxa. Thescapula shape index is also higher in the subgenusConothoa than in Pika (Fig. 3C). This differenceappears to be driven by the extremely low value ofO. (Pika) collaris (Fig. 3B).
The glenoid fossa shape index (Fig. 4A) is also sig-nificantly higher in the intermediate species than ineither defined ecotype. Intermediate species differ
Fig. 2. Forelimb and hind limb measurements (see Table 2 for descriptions).
588 A.T. REESE ET AL.
Journal of Morphology

significantly in the glenoid fossa shape index at thespecies level from two taxa, O. collaris and O. curzo-niae (Fig. 4B). This index is also significantly higherin the meadow taxon O. thibetana than in either thetalus-dweller O. collaris or the meadow-dweller O.curzoniae. In addition, the glenoid fossa shape indexis significantly higher in the subgenus Conothoathan in Pika (Fig. 4C). This is most likely driven bythe high values inO. (Conothoa) rufescens (Fig. 4B).
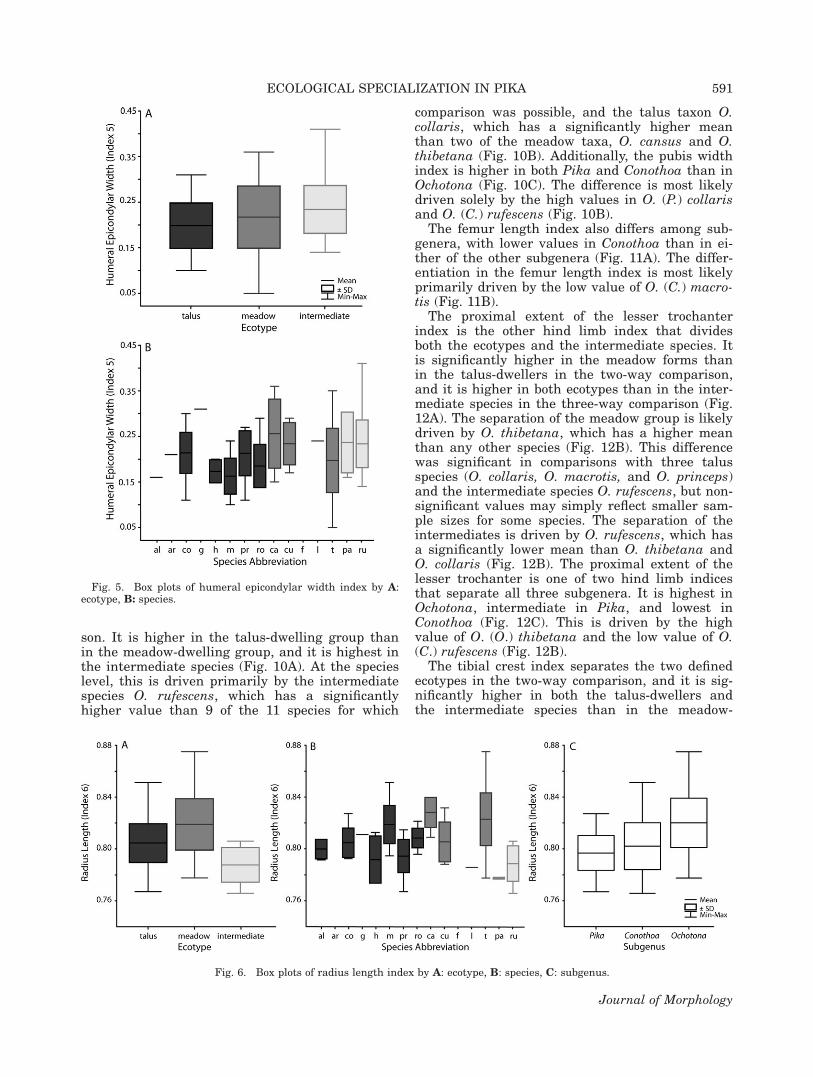
The humeral epicondylar width index is signifi-cantly lower in the talus group than in the inter-mediate forms (Fig. 5A). This reflects the specieslevel difference between O. rufescens and O. mac-
rotis (Fig. 5B). The index is also higher in meadowforms than in talus forms, but the difference is notsignificant (Fig. 5A).
The radius length index is one of two indicesthat separate the two ecotypes from each other, aswell as from the intermediate species in the three-way comparison. It is significantly higher in themeadow group than in the talus group, which issignificantly higher than in the intermediate spe-cies (Fig. 6A). Two meadow taxa, O. cansus and O.thibetana, are primarily driving the separationbetween the meadow taxa and the other forms(Fig. 6B). Both, when analyzed by species, show
TABLE 2. Measurements (see Fig. 2 for illustrations)
1) Scapula width Cranial angle to caudal angle with vertebral border oriented nearlyvertically and the scapular spine oriented nearly horizontally
2) Scapula length Supraglenoid tubercle to vertebral border with vertebral borderoriented nearly vertically and the scapular spine orientednearly horizontally
3) Glenoid fossa length Cranial edge to caudal edge4) Glenoid fossa width Medial edge to lateral edge on caudal part of fossa5) Humerus length to trochlea Proximal edge of humeral head to distal edge of trochlea6) Humerus length to medial epicondyle Proximal edge of humeral head to distal edge of medial epicondyle7) Humerus length to capitulum Proximal edge of humeral head to distal edge of capitulum8) Humeral distal end width Medial edge of medial epicondyle to lateral edge of lateral epicondyle9) Humeral distal articular surface width Medial edge of trochlea to lateral edge of capitulum10) Ulna length Proximal edge of olecranon process to distal edge of styloid process11) Radius length Proximal edge of radial head to distal edge of styloid process12) Olecranon process length Proximal edge of olecranon process to proximal edge of trochlear notch
(olecranon beak)13) Innominate length Cranial edge of ilium (iliac crest) to caudal edge of ischium14) Distal extent of acetabulum Cranial edge of ilium (iliac crest) to caudal edge of acetabulum15) Ischium to pubis length Ischial tuberosity to pubic symphysis16) Pubis width Ischial ramus to pubic symphysis with innominate oriented horizontally17) Maximum femoral length Proximal edge of greater trochanter to distal edge of lateral condyle18) Femur length Proximal edge of femoral head to distal edge of medial condyle19) Proximal extent of lesser trochanter Proximal edge of lesser trochanter to distal edge of medial condyle20) Tibia length Proximal edge of intercondylar tubercle to distal edge of medial malleolus21) Fibula length Proximal edge of fibular head to distal edge of lateral malleolus22) Tibial crest length Proximal edge of intercondylar tubercle to distal extent of tibial crest23) Calcaneus length Proximal edge of calcaneal tuber to distal edge of cuboid facet
TABLE 3. Indices
1) Scapula shape index Scapula width/scapula length2) Glenoid fossa shape index Glenoid fossa length/glenoid fossa width3) Humerus length 1 index Humerus length to medial epicondyle/humerus length to capitulum4) Humerus length 2 index Humerus length to trochlea/humerus length to capitulum5) Humeral epicondylar width index (Humeral distal end width—humeral distal articular
surface width)/humeral distal end width6) Radius length index Radius length/ulna length7) Olecranon process length index Olecranon process length/ulna length8) Distal extent of the acetabulum index Distal extent of acetabulum/innominate length9) Innominate shape index Ischium to pubis length/innominate length10) Pubis width index Pubis width/innominate length11) Femur length index Femur length/maximum femoral length12) Proximal extent of the lesser
trochanter indexProximal extent of lesser trochanter/maximum femoral length
13) Fibula length index Fibula length/tibia length14) Tibial crest length index Tibial crest length/tibia length15) Calcaneus length index Calcaneus length/tibia length16) Brachial index Radius length/humerus length to trochlea17) Humerofemoral index Humerus length to trochlea/maximum femoral length18) Crural index Tibia length/maximum femoral length19) Intermembral index (Humerus length to trochlea 1 radius length)/(maximum
femoral length 1 tibia length)
ECOLOGICAL SPECIALIZATION IN PIKA 589
Journal of Morphology

significant differences from two talus taxa (i.e., O.hyperborea and O. princeps) as well as the two in-termediate species. The radius length index alsoseparates one subgenus from the other two. It islower in both Pika and Conothoa than in Ochotona(Fig. 6C). This is driven by O. (P.) pallasi, whichhas a significantly lower mean than O. (C.) macro-tis, O. (O.) cansus, and O. (O.) thibetana. Also, O.(P.) hyperborea and O. (P.) princeps both have sig-nificantly lower means than O. (O.) cansus and O.(O.) thibetana (Fig. 6B).
The olecranon process length index also sepa-rates all three groups. It is highest in the interme-diate species and lowest in the meadow taxa (Fig.7A). As with the radius length index, much of thedivergence between the groups is due to theextreme values in O. cansus and O. thibetana (Fig.7B). When comparing among species, this index issignificantly lower in these two taxa than in thetalus-dwelling O. collaris, O. macrotis, and O.princeps, the meadow-dweller O. curzoniae, and
the intermediate species O. rufescens. It is also sig-nificantly lower in O. thibetana than in the talusform O. alpina and the intermediate species O.pallasi. The olecranon process length index alsoseparates the subgenera Pika and Conothoa fromthe subgenus Ochotona, with lower values inOchotona than in the other two subgenera (Fig.7C). The differences in the olecranon processlength index are likely driven by the low values ofO. (O.) cansus and O. (O.) thibetana (Fig. 7B).
Hind Limb. The innominate shape index differssignificantly between the two defined ecotypes inthe two-way comparison, and it is higher in the ta-lus taxa and intermediate species than in themeadow taxa when all three are compared (Fig. 8).The distal extent of the acetabulum index differsonly between the subgenera Ochotona and Cono-thoa (Fig. 9).
The pubis width index is one of two hind limbindices that separate the two defined ecotypes andthe intermediate species in the three-way compari-
Fig. 3. Box plots of scapula shape index by A: ecotype, B: species, C: subgenus.
Fig. 4. Box plots of glenoid fossa shape index by A: ecotype, B: species, C: subgenus.
590 A.T. REESE ET AL.
Journal of Morphology
son. It is higher in the talus-dwelling group thanin the meadow-dwelling group, and it is highest inthe intermediate species (Fig. 10A). At the specieslevel, this is driven primarily by the intermediatespecies O. rufescens, which has a significantlyhigher value than 9 of the 11 species for which
comparison was possible, and the talus taxon O.collaris, which has a significantly higher meanthan two of the meadow taxa, O. cansus and O.thibetana (Fig. 10B). Additionally, the pubis widthindex is higher in both Pika and Conothoa than inOchotona (Fig. 10C). The difference is most likelydriven solely by the high values in O. (P.) collarisand O. (C.) rufescens (Fig. 10B).
The femur length index also differs among sub-genera, with lower values in Conothoa than in ei-ther of the other subgenera (Fig. 11A). The differ-entiation in the femur length index is most likelyprimarily driven by the low value of O. (C.) macro-tis (Fig. 11B).
The proximal extent of the lesser trochanterindex is the other hind limb index that dividesboth the ecotypes and the intermediate species. Itis significantly higher in the meadow forms thanin the talus-dwellers in the two-way comparison,and it is higher in both ecotypes than in the inter-mediate species in the three-way comparison (Fig.12A). The separation of the meadow group is likelydriven by O. thibetana, which has a higher meanthan any other species (Fig. 12B). This differencewas significant in comparisons with three talusspecies (O. collaris, O. macrotis, and O. princeps)and the intermediate species O. rufescens, but non-significant values may simply reflect smaller sam-ple sizes for some species. The separation of theintermediates is driven by O. rufescens, which hasa significantly lower mean than O. thibetana andO. collaris (Fig. 12B). The proximal extent of thelesser trochanter is one of two hind limb indicesthat separate all three subgenera. It is highest inOchotona, intermediate in Pika, and lowest inConothoa (Fig. 12C). This is driven by the highvalue of O. (O.) thibetana and the low value of O.(C.) rufescens (Fig. 12B).
The tibial crest index separates the two definedecotypes in the two-way comparison, and it is sig-nificantly higher in both the talus-dwellers andthe intermediate species than in the meadow-
Fig. 5. Box plots of humeral epicondylar width index by A:ecotype, B: species.
Fig. 6. Box plots of radius length index by A: ecotype, B: species, C: subgenus.
ECOLOGICAL SPECIALIZATION IN PIKA 591
Journal of Morphology

dwellers when all three are compared (Fig. 13A).This separation is driven, primarily, by the highvalues in the talus taxa O. collaris, O. hyperborea,and O. princeps, the relatively high values in theintermediate species, and the low values in themeadow taxa O. cansus and O. thibetana (Fig.13B). The tibial crest index is the other hind limbindex that separates all three subgenera. It ishighest in Pika, intermediate in Conothoa, andlowest in Ochotona (Fig. 13C). This divisionreflects the extremely high values of O. (P.) colla-ris, O. (P.) hyperborea, and O. (P.) princeps, andthe low values of O. (O.) cansus and O. (O.) thibe-tana (Fig. 13B).
Composite. All four of the composite indicesare significantly different between the meadowand talus ecotypes in the two-way comparison.In addition, each index also shows at least somesignificant differences among the intermediatesand the other ecotypes.
The brachial index (radius length/humeruslength) is significantly higher in the meadow eco-
type than in either the intermediate or talus eco-types (Fig. 14A). This is primarily driven by thehigh values of O. curzoniae and O. thibetana (Fig.14B). Additionally, this index is significantly lowerin the subgenus Pika than in either Conothoa orOchotona (Fig. 14C). This is likely driven by thelow value of O. (P.) princeps, which is significantlylower than those of O. (C.) macrotis, O. (C.) roylei,O. (O.) cansus, O. (O.) curzoniae, and O. (O.) thibe-tana (Fig. 14B).
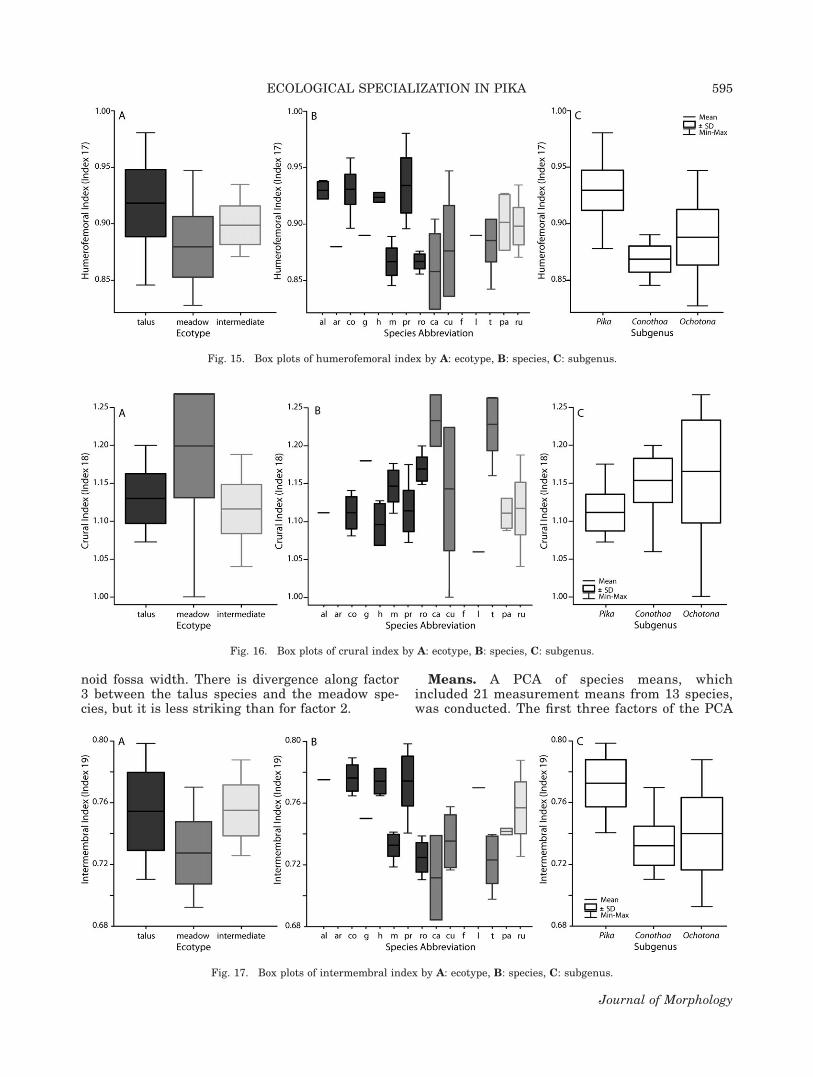
The humerofemoral index (humerus length/fe-mur length) is significantly different among all theecotypes and subgenera. The index is highest inthe talus-dwellers, lowest in the meadow-dwellers,and intermediate in the intermediate ecotype (Fig.15A). These separations are primarily driven bythe high value of O. princeps, the extremely lowvalues of O. cansus and O. curzoniae, and the in-termediate values of both intermediate species(Fig. 15B). The index is highest in the subgenusPika, intermediate in Ochotona, and lowest in
Fig. 7. Box plots of olecranon process length index by A: ecotype, B: species, C: subgenus.
Fig. 8. Box plot of innominate shape index by ecotype. Fig. 9. Box plot of distal extent of the acetabulum index bysubgenus.
592 A.T. REESE ET AL.
Journal of Morphology

Conothoa (Fig. 15C). This separation is primarilydriven by the high values of O. (P.) collaris and O.(P.) princeps and the low values of O. (C.) macrotisand O. (C.) roylei (Fig. 15B).
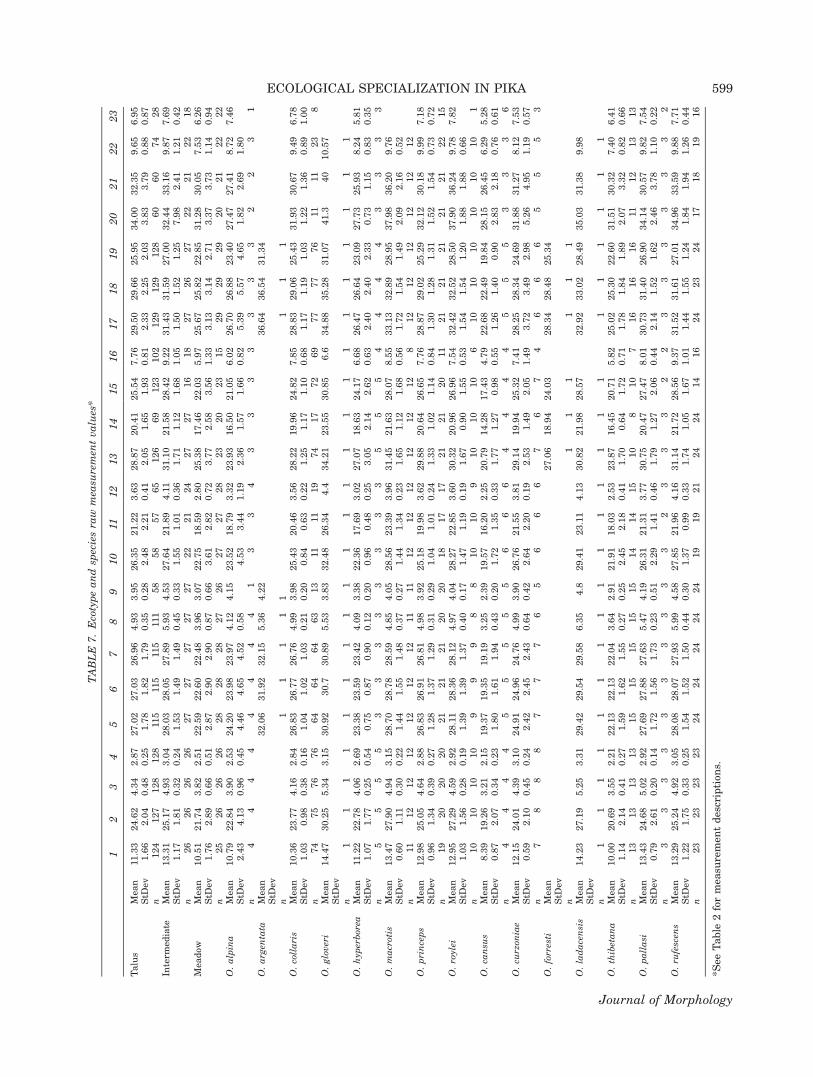
The crural index (tibia length/femur length) issignificantly higher in the meadow-dwellers than
in either the intermediates or the talus-dwellers(Fig. 16A). Most of this separation is likely due tothe high values of O. cansus and O. thibetana (Fig.16B). Additionally, the crural index in the subge-nus Pika is significantly lower than in both Cono-thoa and Ochotona (Fig. 16C). This difference ismost likely driven by the low values of O. (P.) col-laris, O. (P.) hyperborea, and O. (P.) princeps,which are all lower than those of O. (C.) roylei, O.(O.) cansus, and O. (O.) thibetana (Fig. 16B).
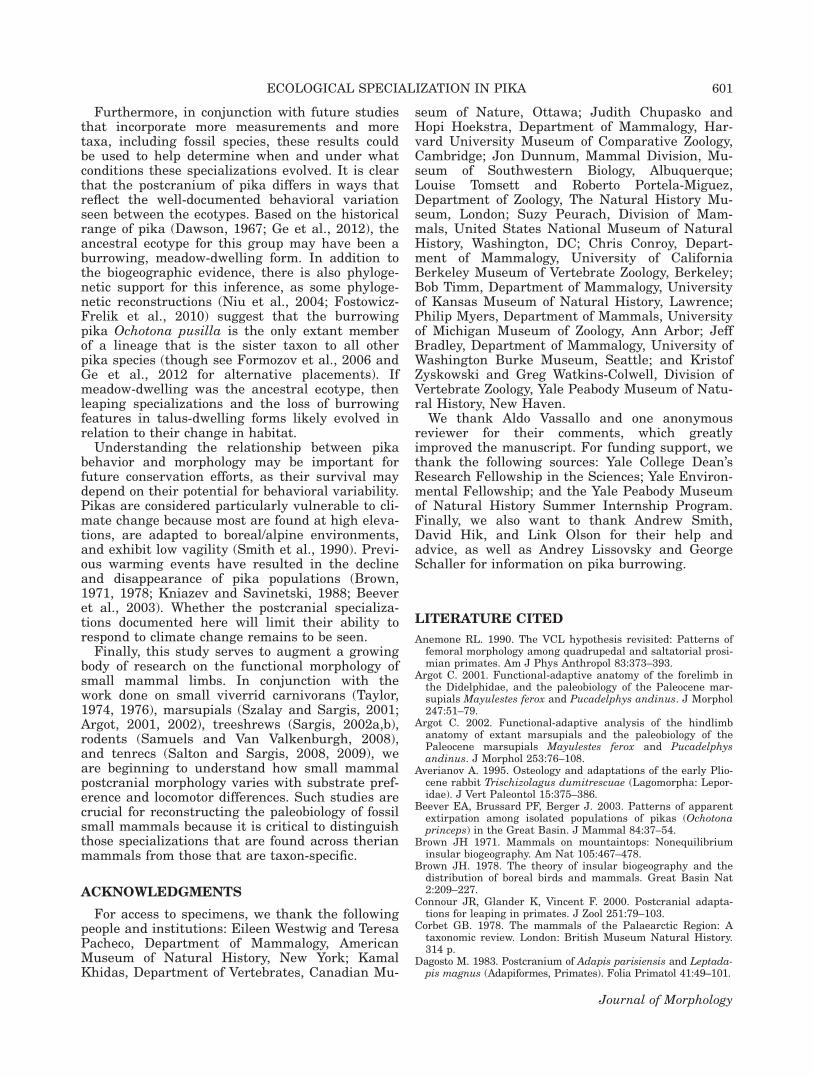
Finally, the intermembral index [(humerus 1 ra-dius length)/(femur 1 tibia length)] is significantlylower in the meadow-dwellers than in the othertwo ecotypes (Fig. 17A). This is most likely primar-ily driven by the extremely low value of O. cansus(Fig. 17B). This index is also significantly higherin the subgenus Pika than in either Conothoa orOchotona (Fig. 17C). The separation of the subge-nus Pika is most likely a reflection of the high val-ues of O. (P.) alpina, O. (P.) collaris, O. (P.) hyper-borea, and O. (P.) princeps (Fig. 17B).
MultivariateIndividuals. A PCA of raw measurement val-
ues was conducted on 14 measurements from 78specimens, representing 13 taxa. The first threefactors of the PCA account for approximately 92%of the variation (Fig. 18). For eigenvalues, seeTable 4; factor loadings and factor coordinates areavailable in Supporting Information.
Factor 1 accounts for almost 84% of the total var-iance and is most likely driven by size. It does notclearly separate the individuals by ecotype, phylog-eny, or geography. Factor 2 accounts for almost 5%of the variance. It is driven primarily by the nega-tively weighted tibial crest length measurementand the positively weighted radius length. Whenconsidering phylogeny, factor 2 strongly separatesthe two subgenera that include leapers, Pika andConothoa, but both groups are intersected by the
Fig. 10. Box plots of pubis width index by A: ecotype, B: species, C: subgenus.
Fig. 11. Box plots of femur length index by A: subgenus, B:species.
ECOLOGICAL SPECIALIZATION IN PIKA 593
Journal of Morphology

widely spread subgenus Ochotona. However, whenconsidering ecotype, factor 2 groups the meadowforms, whereas the talus-dwellers and intermedi-ate species are spread broadly (Fig. 18).
Factor 3, which accounts for more than 3% ofthe variance, is also driven by the negativelyweighted tibial crest length in addition to the posi-tively weighted olecranon process length and gle-
Fig. 12. Box plots of proximal extent of the lesser trochanter index by A: ecotype, B: species,C: subgenus.
Fig. 13. Box plots of tibial crest length index by A: ecotype, B: species, C: subgenus.
Fig. 14. Box plots of brachial index by A: ecotype, B: species, C: subgenus.
594 A.T. REESE ET AL.
Journal of Morphology
noid fossa width. There is divergence along factor3 between the talus species and the meadow spe-cies, but it is less striking than for factor 2.
Means. A PCA of species means, whichincluded 21 measurement means from 13 species,was conducted. The first three factors of the PCA
Fig. 15. Box plots of humerofemoral index by A: ecotype, B: species, C: subgenus.
Fig. 17. Box plots of intermembral index by A: ecotype, B: species, C: subgenus.
Fig. 16. Box plots of crural index by A: ecotype, B: species, C: subgenus.
ECOLOGICAL SPECIALIZATION IN PIKA 595
Journal of Morphology

account for over 96% of the total variation(Fig. 19). For eigenvalues, see Table 5; factorloadings and factor coordinates are available inSupporting Information.
Factor 1, which accounts for 89% of the variance,again appears to be driven by size. Factor 2, whichaccounts for approximately 6% of the variation, ismost highly influenced by the positively weightedhumeral distal end and humeral distal articularsurface width measurements and the negativelyweighted tibia and fibula lengths. Neither factordefinitively separates the species by ecotype, phy-logeny, or geography, although the subgenus Pika isseparated from the other two subgenera.
Factor 3, which accounts for almost 1.4% of thevariation, is affected most by the positivelyweighted tibial crest length and the negativelyweighted glenoid fossa width. It is also influencedby four negatively weighted forelimb variables, i.e.,radius length, humeral distal end width, olecranonprocess length, and ulna length, as well as the posi-tively weighted distal extent of the acetabulum vari-able. This factor separates the species between thetwo defined ecotypes, with the intermediate speciesspanning the two groups (Fig. 19). There is lessdivergence when the species are grouped by subge-nus, with Ochotona and Conothoa overlapping, butPika remains separate from these subgenera.
DISCUSSION
We documented a number of the predicted postcra-nial modifications for digging in meadow-dwelling
pikas and for leaping in some of the talus-dwellingforms. However, and perhaps unsurprisingly, becausemeadow-dwelling pikas are not specialized for astrictly fossorial lifestyle and many digging mammalsshow morphological adaptations for other specializedlocomotor modes, we did not find support for all thetypical skeletal features associated with diggingbehavior in these species.
Forelimb
The difference in the scapula shape index (Fig.3; see Tables 6 and 7 for index and measurementmeans) indicates a broader vertebral border, cau-dal angle, and infraspinous fossa in the burrowers.These structures represent the areas of origin forthe teres major and infraspinatus muscles, both ofwhich retract the humerus, which is likely impor-tant during digging, as is stabilization of theshoulder by the infraspinatus (Morgan, 2009). Abroad scapula is also found in other burrowers,including armadillos, some rodents, and some ten-recs (Smith and Savage, 1956; Stein, 2000; Saltonand Sargis, 2008; Morgan, 2009).
The high value of the glenoid fossa shape indexin the burrowers (Fig. 4) is driven by their narrowglenoid fossa. The ovoid shape of their fossa mayrestrict shoulder mobility in relation to parasagit-tal movements during digging (see Sargis, 2002a).Furthermore, the glenoid fossa is typically morerounded in nondiggers than in fossorial forms(Stein, 2000; Salton and Sargis, 2008).
The higher humeral epicondylar width index inburrowers (Fig. 5) is indicative of a large medialepicondyle. This serves as a larger area of originfor the wrist and digital flexor muscles, whichpowerfully flex the manus during digging. Similarenlargement of the medial epicondyle has beendocumented in several other diggers (Hildebrand,1985; Stein, 2000; Sargis, 2002a; Lessa et al.,
Fig. 18. (A) Bivariate plot of factors 1 and 2 from PCA of individuals. (B) Bivariate plot offactors 2 and 3 from PCA of individuals. Area denoted by black circles contains talus-dwellers;dark gray squares denote meadow-dwellers; and light gray rectangles denote intermediates.
TABLE 4. Eigenvalues from PCA of individuals
Factor Eigenvalues% of totalvariance
Cumulativeeigenvalues
Cumulative %of total variance
1 11.74 83.84 11.74 83.842 0.66 4.71 12.40 88.553 0.47 3.35 12.87 91.90
596 A.T. REESE ET AL.
Journal of Morphology

2008; Salton and Sargis, 2008; Samuels and VanValkenburgh, 2008).
A longer olecranon process serves as a longer in-lever for the insertion of the triceps brachii mus-cle, thereby increasing the force that can beexerted by the forearms during burrowing viapowerful extension of the elbow (Hildebrand, 1985;Stein, 2000). This is captured by the most consist-ent skeletal metric for fossorial behavior, i.e., theratio of the length of the olecranon process to thelength of the ulna (Hildebrand, 1985; Stein, 2000;Vizcaıno and Milne, 2002; Lessa et al., 2008;Salton and Sargis, 2008; Samuels and Van Valken-burgh, 2008; Hopkins and Davis, 2009). Contraryto typical morphological specializations for fossor-iality, the olecranon process is significantly shorterin the burrowing species than in the nonburrowingleapers, and both are significantly shorter whencompared to the intermediate species (Fig. 7). Allthree groups have a ratio of olecranon process toulna length (Fig. 7) that is comparable to nonfosso-rial mammals, such as raccoons (< 0.15; Hilde-brand, 1985). Similarly, a low radius to ulnalength ratio should coincide with a long olecranonprocess, but the highest index values were foundin the meadow-dwelling species (Fig. 6). Both ofthese metrics indicate that the meadow-dwellingspecies have not acquired this common skeletalspecialization for fossorial behavior. This is notentirely surprising because the meadow forms arenot fossorial specialists, and the specific mechanicsof pika digging remain unstudied.
Hind Limb
A reduction of pubis width and ischium to pubislength in the meadow-dwelling pikas is capturedin their lower pubis width (Fig. 10) and innomi-nate shape index (Fig. 8) values. Reduced pelvissize is typically found in fossorial forms because itallows for greater maneuverability in tunnels(Stein, 2000; Salton and Sargis, 2009).
A high proximal extent of the lesser trochanterindex value (Fig. 12) indicates that the lesser tro-chanter is close to the proximal end of the femur.The iliopsoas muscle inserts on the lesser trochan-ter, and a more proximal lesser trochanter allowsthis muscle to rapidly flex the thigh (Smith andSavage, 1956; Hildebrand, 1985). Rapid flexion ofthe thigh would be advantageous during leaping inthe talus-dwellers (see Jungers, 1977; Dagosto,1983). In the burrowers, which also have a moreproximal lesser trochanter, rapid thigh flexion maybe advantageous for moving dirt. Because thesame condition is present in both meadow- and ta-lus-dwelling forms, though not in the intermediatespecies, further study will be necessary to under-stand the ancestral condition and determine if anymorphological specialization has occurred.
Finally, the tibial crest is longer in the talus-dwellers (Fig. 13). The quadriceps femoris muscleinserts on the most proximal part of the tibialcrest, the tibial tuberosity, via the quadriceps ten-don and patellar ligament. The longer crest alsoprovides a larger area of attachment for the tibi-alis anterior muscle, which originates from thiscrest. A longer tibial crest may allow for morepowerful extension of the knee by the quadricepsfemoris muscle, which would be advantageous forleaping. Furthermore, tibialis anterior inverts thefoot, which may be important for landing and mov-ing on uneven talus substrates. A large tibial tu-berosity has been documented previously in otherleapers, as well as in terrestrial runners (Taylor,
Fig. 19. (A) Bivariate plot of factors 1 and 2 from PCA of means. (B) Bivariate plot of factors2 and 3 from PCA of means. Area denoted by black circles contains talus-dwellers; dark graysquares denote meadow-dwellers; and light gray rectangles denote intermediates.
TABLE 5. Eigenvalues from PCA of means
Factor Eigenvalues% of totalvariance
Cumulativeeigenvalues
Cumulative % oftotal variance
1 18.71 89.09 18.71 89.092 1.26 5.98 19.97 95.073 0.29 1.37 20.26 96.44
ECOLOGICAL SPECIALIZATION IN PIKA 597
Journal of Morphology

TABLE
6.Ecotypeandsp
eciesindex
values*
12
34
56
78
910
1112
13
14
15
16
17
18
19
Talus
Mea
n0.46
1.51
1.00
1.00
0.20
0.80
0.14
0.69
0.89
0.28
1.01
0.88
0.95
0.29
0.22
0.78
0.92
1.13
0.75
StD
ev0.04
0.13
0.01
0.01
0.05
0.01
0.01
0.02
0.02
0.11
0.01
0.01
0.03
0.03
0.02
0.04
0.03
0.03
0.03
n11
9124
111
111
54
57
52
65
118
96
125
124
56
56
23
56
110
58
48
Interm
ediate
Mea
n0.53
1.63
1.01
1.01
0.23
0.79
0.15
0.69
0.90
0.30
1.00
0.86
0.95
0.29
0.26
0.78
0.90
1.12
0.76
StD
ev0.04
0.11
0.01
0.01
0.05
0.01
0.01
0.02
0.02
0.03
0.02
0.01
0.04
0.03
0.15
0.04
0.02
0.03
0.02
n26
26
27
27
27
21
22
27
16
18
26
27
20
20
17
20
25
19
16
Mea
dow
Mea
n0.48
1.54
1.01
1.01
0.22
0.82
0.12
0.68
0.87
0.25
1.01
0.89
0.96
0.24
0.21
0.82
0.88
1.20
0.73
StD
ev0.04
0.16
0.01
0.01
0.07
0.02
0.02
0.01
0.05
0.03
0.01
0.04
0.05
0.02
0.02
0.05
0.03
0.07
0.02
n25
26
29
29
26
28
28
21
24
16
30
30
21
21
16
26
25
20
17
O.alpina
Mea
n0.47
1.54
1.00
1.01
0.16
0.80
0.14
0.69
0.88
0.25
1.01
0.88
1.00
0.28
0.76
0.93
1.11
0.78
StD
ev0.03
0.16
0.01
0.00
0.01
0.03
0.00
0.02
0.02
0.02
0.00
0.03
0.00
0.02
0.01
n4
44
41
33
33
33
32
23
31
1O.argen
tata
Mea
n0.99
1.00
0.21
1.00
0.86
0.88
StD
evn
11
11
11
O.collaris
Mea
n0.44
1.47
1.00
1.00
0.21
0.80
0.14
0.69
0.88
0.30
1.01
0.88
0.96
0.30
0.23
0.76
0.93
1.11
0.78
StD
ev0.04
0.11
0.01
0.01
0.04
0.01
0.01
0.04
0.02
0.13
0.01
0.01
0.03
0.03
0.03
0.02
0.01
0.02
0.01
n73
76
64
64
13
1111
17
71
68
77
76
1111
511
62
117
O.gloveri
Mea
n0.48
1.70
0.99
1.00
0.31
0.81
0.14
0.69
0.90
0.19
1.01
0.89
0.97
0.26
0.85
0.89
1.18
0.75
StD
evn
11
11
11
11
11
11
11
11
11
O.hyp
erborea
Mea
n0.49
1.54
1.01
1.00
0.17
0.79
0.14
0.69
0.89
0.26
1.01
0.87
0.94
0.30
0.21
0.76
0.92
1.10
0.77
StD
ev0.02
0.21
0.00
0.01
0.03
0.02
0.01
0.01
0.01
0.01
0.01
0.01
0.03
0.02
0.01
0.01
0.00
0.03
0.01
n5
53
33
33
55
44
43
33
33
33
O.macrotis
Mea
n0.49
1.54
1.00
1.00
0.16
0.82
0.14
0.69
0.90
0.27
1.00
0.87
0.96
0.26
0.81
0.87
1.15
0.73
StD
ev0.01
0.06
0.01
0.00
0.05
0.01
0.01
0.01
0.02
0.02
0.01
0.02
0.03
0.01
0.02
0.01
0.02
0.01
n7
88
87
12
88
84
88
88
12
12
12
12
O.princeps
Mea
n0.52
1.62
1.00
1.00
0.21
0.79
0.14
0.69
0.89
0.26
1.01
0.88
0.94
0.31
0.22
0.74
0.93
1.11
0.77
StD
ev0.03
0.15
0.01
0.01
0.05
0.01
0.01
0.02
0.03
0.02
0.01
0.01
0.02
0.02
0.02
0.02
0.02
0.03
0.02
n19
20
21
21
20
17
17
21
20
10
21
21
21
21
14
17
19
20
15
O.roylei
Mea
n0.47
1.57
1.01
1.00
0.19
0.81
0.13
0.69
0.89
0.24
1.00
0.88
0.96
0.26
0.20
0.81
0.87
1.17
0.72
StD
ev0.02
0.06
0.01
0.01
0.05
0.01
0.01
0.01
0.01
0.01
0.01
0.01
0.01
0.01
0.02
0.01
0.02
0.01
n10
10
99
810
910
10
610
10
10
10
19
910
9O.ca
nsu
sMea
n0.44
1.50
1.01
1.01
0.26
0.83
0.11
0.69
0.85
0.23
0.99
0.88
0.94
0.22
0.20
0.83
0.86
1.23
0.71
StD
ev0.01
0.18
0.02
0.01
0.08
0.01
0.01
0.01
0.11
0.02
0.01
0.02
0.02
0.02
0.01
0.03
0.03
0.03
0.03
n4
45
55
66
44
45
53
33
54
32
O.cu
rzon
iae
Mea
n0.49
1.42
1.01
1.01
0.23
0.81
0.14
0.67
0.87
0.27
1.00
0.88
0.98
0.26
0.23
0.84
0.88
1.14
0.74
StD
ev0.03
0.18
0.01
0.01
0.05
0.02
0.01
0.01
0.01
0.04
0.01
0.02
0.05
0.01
0.04
0.04
0.04
0.07
0.01
n7
87
75
66
67
46
65
53
65
54
O.forresti
Mea
n0.70
0.89
1.00
0.89
StD
evn
11
11
O.ladacensis
Mea
n0.52
1.59
1.00
0.99
0.24
0.79
0.14
0.71
0.93
1.00
0.87
0.90
0.28
0.79
0.89
1.06
0.77
StD
evn
11
11
11
11
11
11
11
11
1O.thibetana
Mea
n0.48
1.61
1.00
1.00
0.20
0.82
0.11
0.68
0.87
0.24
1.01
0.90
0.96
0.23
0.20
0.82
0.89
1.23
0.72
StD
ev0.04
0.12
0.01
0.01
0.07
0.02
0.02
0.01
0.02
0.02
0.01
0.05
0.06
0.02
0.01
0.06
0.02
0.03
0.02
n13
13
16
16
15
15
15
911
817
17
12
12
10
14
15
1110
O.pallasi
Mea
n0.55
1.72
1.01
1.00
0.24
0.78
0.14
0.67
0.88
0.26
1.02
0.88
0.89
0.29
0.22
0.76
0.9
1.11
0.74
StD
ev0.06
0.03
0.01
0.01
0.07
0.00
0.02
0.00
0.01
0.03
0.04
0.02
0.05
0.02
0.01
0.01
0.02
0.02
0n
33
33
32
33
22
33
33
32
33
2O.ru
fescen
sMea
n0.53
1.62
1.01
1.01
0.23
0.79
0.15
0.70
0.90
0.30
1.00
0.86
0.96
0.29
0.27
0.78
0.9
1.12
0.76
StD
ev0.04
0.12
0.01
0.01
0.05
0.01
0.01
0.01
0.02
0.02
0.01
0.01
0.03
0.03
0.17
0.04
0.02
0.03
0.02
n23
23
24
24
24
19
19
24
14
16
23
24
17
17
14
18
22
16
14
*See
Table
3forindex
description
s.
598 A.T. REESE ET AL.
Journal of Morphology
TABLE
7.Ecotypeandsp
eciesra
wmea
suremen
tvalues*
12
34
56
78
910
1112
13
14
15
16
17
18
19
20
21
22
23
Talus
Mea
n11
.33
24.62
4.34
2.87
27.02
27.03
26.96
4.93
3.95
26.35
21.22
3.63
28.87
20.41
25.54
7.76
29.50
29.66
25.95
34.00
32.35
9.65
6.95
StD
ev1.66
2.04
0.48
0.25
1.78
1.82
1.79
0.35
0.28
2.48
2.21
0.41
2.05
1.65
1.93
0.81
2.33
2.25
2.03
3.83
3.79
0.88
0.87
n124
127
128
128
115
115
115
111
58
58
57
65
126
69
123
102
129
129
128
60
60
74
28
Interm
ediate
Mea
n13.31
25.17
4.93
3.04
28.03
28.05
27.89
5.93
4.53
27.64
21.89
4.11
31.10
21.58
28.42
9.22
31.43
31.59
27.00
32.44
33.16
9.87
7.69
StD
ev1.17
1.81
0.32
0.24
1.53
1.49
1.49
0.45
0.33
1.55
1.01
0.36
1.71
1.12
1.68
1.05
1.50
1.52
1.25
7.98
2.41
1.21
0.42
n26
26
26
26
27
27
27
27
27
22
21
24
27
27
16
18
27
26
27
22
21
22
18
Mea
dow
Mea
n10.51
21.74
3.82
2.51
22.59
22.60
22.48
3.96
3.07
22.75
18.59
2.80
25.38
17.46
22.03
5.97
25.67
25.82
22.85
31.28
30.05
7.53
6.26
StD
ev1.76
2.89
0.66
0.51
2.87
2.90
2.90
0.87
0.66
3.61
2.82
0.72
3.77
2.58
3.56
1.33
3.13
3.14
2.71
3.37
3.73
1.14
0.94
n25
26
26
26
28
28
28
27
26
27
27
28
23
20
23
15
29
29
29
20
21
22
22
O.alpina
Mea
n10.79
22.84
3.90
2.53
24.20
23.98
23.97
4.12
4.15
23.52
18.79
3.32
23.93
16.50
21.05
6.02
26.70
26.88
23.40
27.47
27.41
8.72
7.46
StD
ev2.43
4.13
0.96
0.45
4.46
4.65
4.52
0.58
4.53
3.44
1.19
2.36
1.57
1.66
0.82
5.39
5.57
4.65
1.82
2.69
1.80
n4
44
44
44
41
33
43
33
33
33
22
31
O.argen
tata
Mea
n32.06
31.92
32.15
5.36
4.22
36.64
36.54
31.34
StD
evn
11
11
11
11
O.collaris
Mea
n10.36
23.77
4.16
2.84
26.83
26.77
26.76
4.99
3.98
25.43
20.46
3.56
28.22
19.96
24.82
7.85
28.83
29.06
25.43
31.93
30.67
9.49
6.78
StD
ev1.03
0.98
0.38
0.16
1.04
1.02
1.03
0.21
0.20
0.84
0.63
0.22
1.25
1.17
1.10
0.68
1.17
1.19
1.03
1.22
1.36
0.89
1.00
n74
75
76
76
64
64
64
63
13
1111
19
74
17
72
69
77
77
76
1111
23
8O.gloveri
Mea
n14.47
30.25
5.34
3.15
30.92
30.7
30.89
5.53
3.83
32.48
26.34
4.4
34.21
23.55
30.85
6.6
34.88
35.28
31.07
41.3
40
10.57
StD
evn
11
11
11
11
11
11
11
11
11
11
11
O.hyp
erborea
Mea
n11
.22
22.78
4.06
2.69
23.38
23.59
23.42
4.09
3.38
22.36
17.69
3.02
27.07
18.63
24.17
6.68
26.47
26.64
23.09
27.73
25.93
8.24
5.81
StD
ev1.07
1.77
0.25
0.54
0.75
0.87
0.90
0.12
0.20
0.96
0.48
0.25
3.05
2.14
2.62
0.63
2.40
2.40
2.33
0.73
1.15
0.83
0.35
n5
55
53
33
33
33
35
55
44
44
33
33
O.macrotis
Mea
n13.47
27.90
4.94
3.15
28.70
28.78
28.59
4.85
4.05
28.56
23.39
3.96
31.45
21.63
28.07
8.55
33.13
32.89
28.95
37.98
36.20
9.76
StD
ev0.60
1.11
0.30
0.22
1.44
1.55
1.48
0.37
0.27
1.44
1.34
0.23
1.65
1.12
1.68
0.56
1.72
1.54
1.49
2.09
2.16
0.52
n11
12
12
12
12
12
12
1111
12
12
12
12
12
12
812
12
12
12
12
12
O.princeps
Mea
n12.98
25.05
4.64
2.88
26.83
26.91
26.81
4.98
3.92
25.18
19.98
3.62
29.88
20.64
26.65
7.76
28.87
29.02
25.29
32.12
30.18
9.99
7.18
StD
ev0.96
1.34
0.39
0.27
1.28
1.37
1.29
0.31
0.29
1.04
1.01
0.24
1.33
1.02
1.14
0.84
1.30
1.28
1.31
1.52
1.54
0.73
0.72
n19
20
20
20
21
21
21
20
20
18
17
17
21
21
20
1121
21
21
21
21
22
15
O.roylei
Mea
n12.95
27.29
4.59
2.92
28.11
28.36
28.12
4.97
4.04
28.27
22.85
3.60
30.32
20.96
26.96
7.54
32.42
32.52
28.50
37.90
36.24
9.78
7.82
StD
ev1.03
1.56
0.28
0.19
1.39
1.39
1.37
0.40
0.17
1.47
1.19
0.19
1.67
0.90
1.55
0.53
1.54
1.54
1.20
1.88
1.88
0.66
n10
10
10
10
99
98
810
10
910
10
10
610
10
10
10
10
10
1O.ca
nsu
sMea
n8.39
19.26
3.21
2.15
19.37
19.35
19.19
3.25
2.39
19.57
16.20
2.25
20.79
14.28
17.43
4.79
22.68
22.49
19.84
28.15
26.45
6.29
5.28
StD
ev0.87
2.07
0.34
0.23
1.80
1.61
1.94
0.43
0.20
1.72
1.35
0.33
1.77
1.27
0.98
0.55
1.26
1.40
0.90
2.83
2.18
0.76
0.61
n4
44
45
55
55
66
64
44
45
55
33
36
O.cu
rzon
iae
Mea
n12.15
24.01
4.39
3.10
24.91
24.96
24.76
4.99
3.90
26.76
21.55
3.81
29.14
19.94
25.32
7.41
28.25
28.34
24.69
31.88
31.27
8.12
7.53
StD
ev0.59
2.10
0.45
0.24
2.42
2.45
2.43
0.64
0.42
2.64
2.20
0.19
2.53
1.49
2.05
1.49
3.72
3.49
2.98
5.26
4.95
1.19
0.57
n7
88
87
77
65
66
67
67
46
66
55
53
O.forresti
Mea
n27.06
18.94
24.03
28.34
28.48
25.34
StD
evn
11
11
11
O.ladacensis
Mea
n14.23
27.19
5.25
3.31
29.42
29.54
29.58
6.35
4.8
29.41
23.11
4.13
30.82
21.98
28.57
32.92
33.02
28.49
35.03
31.38
9.98
StD
evn
11
11
11
11
11
11
11
11
11
11
1O.thibetana
Mea
n10.00
20.69
3.55
2.21
22.13
22.13
22.04
3.64
2.91
21.91
18.03
2.53
23.87
16.45
20.71
5.82
25.02
25.30
22.60
31.51
30.32
7.40
6.41
StD
ev1.14
2.14
0.41
0.27
1.59
1.62
1.55
0.27
0.25
2.45
2.18
0.41
1.70
0.64
1.72
0.71
1.78
1.84
1.89
2.07
3.32
0.82
0.66
n13
13
13
13
15
15
15
15
15
14
14
15
10
810
716
16
16
1112
13
13
O.pallasi
Mea
n13.43
24.68
5.02
2.92
27.69
27.88
27.63
5.47
4.19
26.31
21.31
3.77
30.75
20.47
27.47
8.01
30.73
31.40
26.90
34.14
30.57
9.82
7.54
StD
ev0.79
2.61
0.20
0.14
1.72
1.56
1.73
0.23
0.51
2.29
1.41
0.46
1.79
1.27
2.06
0.44
2.14
1.52
1.62
2.46
3.78
1.10
0.22
n3
33
33
33
33
32
33
32
23
33
33
32
O.ru
fescen
sMea
n13.29
25.24
4.92
3.05
28.08
28.07
27.93
5.99
4.58
27.85
21.96
4.16
31.14
21.72
28.56
9.37
31.52
31.61
27.01
34.96
33.59
9.88
7.71
StD
ev1.22
1.75
0.33
0.25
1.54
1.52
1.50
0.44
0.30
1.37
0.99
0.33
1.74
1.05
1.67
1.01
1.44
1.55
1.24
1.84
1.94
1.26
0.44
n23
23
23
23
24
24
24
24
24
19
19
21
24
24
14
16
24
23
24
17
18
19
16
*See
Table
2formea
suremen
tdescription
s.
ECOLOGICAL SPECIALIZATION IN PIKA 599
Journal of Morphology

1976; Szalay and Sargis, 2001; Argot, 2002; Sargis,2002b; Salton and Sargis, 2009), though the tibialspine index is not related to limb function in cavio-morph rodents (Elissamburu and Vizcaıno, 2004).
Composite and Multivariate
The results of the composite index analyses areless obviously associated with digging or leapingand are somewhat difficult to explain withoutmore detailed information about pika locomotorbehavior. The meadow-dwellers’ higher ratio ofdistal to proximal elements (Figs. 14 and 16) is afeature typically seen in cursorial mammals(Smith and Savage, 1956). Although pikas are notcursorial, this difference may be related to fasterterrestrial locomotion in meadow forms becausethey are running on a more continuous substrate.It could also be related to a lower center of gravityin talus forms, which may be advantageous onangled and discontinuous rocky surfaces. Thehumeri and forelimbs of pika are short relative tothe femora and hind limbs (Figs. 15 and 17),respectively, just as they are in some other smallmammals, such as treeshrews (Sargis, 2002a, fig.2). Talus-dwellers would have been predicted tohave the lowest intermembral indices because lon-ger hind limbs are expected in leapers, so it is sur-prising that the meadow-dwellers have the lowestvalues for this ratio.
Overall, our morphometric analyses of the post-cranium were useful for separating the two pikaecotypes (Figs. 18 and 19). The main features thatcontributed to distinguishing ecotypes in multivar-iate space were: glenoid fossa width, humeral dis-tal end width, humeral distal articular surfacewidth, radius length, olecranon process length,tibia length, fibula length, and tibial crest length.It is notable that although the forearm (ante-brachium) measurements were important metricsfor separating the ecotypes in the multivariateanalyses, they did not always differ in the pre-dicted manner in the univariate analyses.
Somewhat surprisingly, ecologically intermediatespecies were often significantly different from bothecotypes rather than spanning intermediate mor-phospace between the two ecotypes. In some cases,they were at an extreme with the meadow forms(scapula shape, glenoid fossa shape, and humeralepicondylar width indices), but in others they weremore similar to the talus forms (tibial crest length,brachial, crural, and intermembral indices) or iso-lated. Because the intermediate species are knownto burrow (Smith, 1988; Smith, 2008), the indicesin which the intermediate and meadow-dwellingtaxa are most similar are very likely some of thepika specializations for burrowing, whereas thereduction of pubis width and ischium to pubislength seen only in the meadow-dwelling pikasmay contribute less to burrowing or indicate differ-
ences in how these forms perform this behavior oruse burrows.
Variation between the ecotypes cannot be solelyexplained as an artifact of phylogeny. No indicesdiffered solely between the subgenera Ochotonaand Pika, each of which is primarily composed ofone ecotype. It is notable, though, that some indi-ces captured differences between the subgeneraConothoa and Pika (scapula shape and glenoidfossa shape indices) or Conothoa and Ochotona(distal extent of acetabulum index; Fig. 9), so thesemay be useful morphological features for assigningfossil taxa to subgenera. However, most featuresdocumented differences between one subgenus andthe other two (radius length, olecranon processlength, innominate shape, pubis width, femurlength, brachial, crural, and intermembral indices)or among all of the subgenera (proximal extent ofthe lesser trochanter, tibial crest length, andhumerofemoral indices). This lack of consistent dif-ferences among the subgenera contrasted with thedifferences related to ecotype indicates that varia-tion in postcranial morphology is being driven byfunction and not just phylogeny.
The two species most frequently associated withburrowing specializations are O. (O.) cansus andO. (O.) thibetana, which are both members of thesubgenus Ochotona (Lanier and Olson, 2009). Forfive indices, one (glenoid fossa shape and proximalextent of the lesser trochanter indices) or both (ra-dius length, olecranon process length, and pubiswidth indices) of these taxa drove the separationbetween ecotypes. Unfortunately, few representa-tives of meadow-dwelling species in the subgenusConothoa were available for study, thereby limit-ing our ability to determine with certainty if mor-phological features related to burrowing are re-stricted primarily to the subgenus Ochotona orhave evolved convergently in both lineages.
Implications
In summary, many of the metrics associatedwith fossoriality proved useful for differentiatingbetween meadow-dwelling and talus-dwellingforms, though some were either not observed orwere contrary to expectations. Knowledge of therespective postcranial specializations associatedwith pika ecotypes will be helpful in reconstruct-ing the behavior of understudied or extinct species,as well as for assessing the behavioral variabilityof extant species. However, it is important to notethat several of the well-cited mammalian postcra-nial features associated with scratch-digging didnot always correspond to burrowing specializationsin pika (e.g., an elongated olecranon process), sospecial attention to extant close relatives amongOchotona species will be essential for making accu-rate paleobiological inferences in this group.
600 A.T. REESE ET AL.
Journal of Morphology
Furthermore, in conjunction with future studiesthat incorporate more measurements and moretaxa, including fossil species, these results couldbe used to help determine when and under whatconditions these specializations evolved. It is clearthat the postcranium of pika differs in ways thatreflect the well-documented behavioral variationseen between the ecotypes. Based on the historicalrange of pika (Dawson, 1967; Ge et al., 2012), theancestral ecotype for this group may have been aburrowing, meadow-dwelling form. In addition tothe biogeographic evidence, there is also phyloge-netic support for this inference, as some phyloge-netic reconstructions (Niu et al., 2004; Fostowicz-Frelik et al., 2010) suggest that the burrowingpika Ochotona pusilla is the only extant memberof a lineage that is the sister taxon to all otherpika species (though see Formozov et al., 2006 andGe et al., 2012 for alternative placements). Ifmeadow-dwelling was the ancestral ecotype, thenleaping specializations and the loss of burrowingfeatures in talus-dwelling forms likely evolved inrelation to their change in habitat.
Understanding the relationship between pikabehavior and morphology may be important forfuture conservation efforts, as their survival maydepend on their potential for behavioral variability.Pikas are considered particularly vulnerable to cli-mate change because most are found at high eleva-tions, are adapted to boreal/alpine environments,and exhibit low vagility (Smith et al., 1990). Previ-ous warming events have resulted in the declineand disappearance of pika populations (Brown,1971, 1978; Kniazev and Savinetski, 1988; Beeveret al., 2003). Whether the postcranial specializa-tions documented here will limit their ability torespond to climate change remains to be seen.
Finally, this study serves to augment a growingbody of research on the functional morphology ofsmall mammal limbs. In conjunction with thework done on small viverrid carnivorans (Taylor,1974, 1976), marsupials (Szalay and Sargis, 2001;Argot, 2001, 2002), treeshrews (Sargis, 2002a,b),rodents (Samuels and Van Valkenburgh, 2008),and tenrecs (Salton and Sargis, 2008, 2009), weare beginning to understand how small mammalpostcranial morphology varies with substrate pref-erence and locomotor differences. Such studies arecrucial for reconstructing the paleobiology of fossilsmall mammals because it is critical to distinguishthose specializations that are found across therianmammals from those that are taxon-specific.
ACKNOWLEDGMENTS
For access to specimens, we thank the followingpeople and institutions: Eileen Westwig and TeresaPacheco, Department of Mammalogy, AmericanMuseum of Natural History, New York; KamalKhidas, Department of Vertebrates, Canadian Mu-
seum of Nature, Ottawa; Judith Chupasko andHopi Hoekstra, Department of Mammalogy, Har-vard University Museum of Comparative Zoology,Cambridge; Jon Dunnum, Mammal Division, Mu-seum of Southwestern Biology, Albuquerque;Louise Tomsett and Roberto Portela-Miguez,Department of Zoology, The Natural History Mu-seum, London; Suzy Peurach, Division of Mam-mals, United States National Museum of NaturalHistory, Washington, DC; Chris Conroy, Depart-ment of Mammalogy, University of CaliforniaBerkeley Museum of Vertebrate Zoology, Berkeley;Bob Timm, Department of Mammalogy, Universityof Kansas Museum of Natural History, Lawrence;Philip Myers, Department of Mammals, Universityof Michigan Museum of Zoology, Ann Arbor; JeffBradley, Department of Mammalogy, University ofWashington Burke Museum, Seattle; and KristofZyskowski and Greg Watkins-Colwell, Division ofVertebrate Zoology, Yale Peabody Museum of Natu-ral History, New Haven.
We thank Aldo Vassallo and one anonymousreviewer for their comments, which greatlyimproved the manuscript. For funding support, wethank the following sources: Yale College Dean’sResearch Fellowship in the Sciences; Yale Environ-mental Fellowship; and the Yale Peabody Museumof Natural History Summer Internship Program.Finally, we also want to thank Andrew Smith,David Hik, and Link Olson for their help andadvice, as well as Andrey Lissovsky and GeorgeSchaller for information on pika burrowing.
LITERATURE CITED
Anemone RL. 1990. The VCL hypothesis revisited: Patterns offemoral morphology among quadrupedal and saltatorial prosi-mian primates. Am J Phys Anthropol 83:373–393.
Argot C. 2001. Functional-adaptive anatomy of the forelimb inthe Didelphidae, and the paleobiology of the Paleocene mar-supials Mayulestes ferox and Pucadelphys andinus. J Morphol247:51–79.
Argot C. 2002. Functional-adaptive analysis of the hindlimbanatomy of extant marsupials and the paleobiology of thePaleocene marsupials Mayulestes ferox and Pucadelphysandinus. J Morphol 253:76–108.
Averianov A. 1995. Osteology and adaptations of the early Plio-cene rabbit Trischizolagus dumitrescuae (Lagomorpha: Lepor-idae). J Vert Paleontol 15:375–386.
Beever EA, Brussard PF, Berger J. 2003. Patterns of apparentextirpation among isolated populations of pikas (Ochotonaprinceps) in the Great Basin. J Mammal 84:37–54.
Brown JH 1971. Mammals on mountaintops: Nonequilibriuminsular biogeography. Am Nat 105:467–478.
Brown JH. 1978. The theory of insular biogeography and thedistribution of boreal birds and mammals. Great Basin Nat2:209–227.
Connour JR, Glander K, Vincent F. 2000. Postcranial adapta-tions for leaping in primates. J Zool 251:79–103.
Corbet GB. 1978. The mammals of the Palaearctic Region: Ataxonomic review. London: British Museum Natural History.314 p.
Dagosto M. 1983. Postcranium of Adapis parisiensis and Leptada-pis magnus (Adapiformes, Primates). Folia Primatol 41:49–101.
ECOLOGICAL SPECIALIZATION IN PIKA 601
Journal of Morphology

Dawson MR. 1967. Lagomorph history and the stratigraphic re-cord. U Kansas Geol Spec Pub 2:287–316.
Elissamburu A, Vizcaıno SF. 2004. Limb proportions and adap-tations in caviomorph rodents (Rodentia: Caviomorpha). JZool London 262:145–159.
Fedosenko AK. 1974. [Some morphological characteristics ofOchotona.] Zool Zh 53:485–486.
Formozov AN. 1981. [Behavioral adaptations of pikas living inrocky biotopes.] In: Naumov NP, editor. Ecology, PopulationStructure, and Communication Processes in Mammals. Mos-cow: Nauka. pp 245–263.
Formozov NA, Grigor’eva TV, Surin VL. 2006. [Molecular sys-tematics of pikas of the subgenus Pika (Ochotona, Lagomor-pha).] Zool Zh 85:1465–1473.
Fostowicz-Frelik L, Frelik GJ, Gasparik ML. 2010. Morphologicalphylogeny of pikas (Lagomorpha: Ochotona), with a descriptionof a new species from the Pliocene/Pleistocene transition ofHungary. Proc Acad Nat Sci Philadel 159:97–118.
Fulk GW, Khokar AR. 1980. Observations on the natural his-tory of a pika (Ochotona rufescens) from Pakistan. Mammalia44:51–58.
Gabriel JM. 1984. The effect of animal design on jumping per-formance. J Zool London 204:533–539.
Ge D, Zhang Z, Xia L, Zhang Q, Ma Y, Yang Q. 2012. Did theexpansion of C4 plants drive extinction and massive rangecontraction of micromammals? Inferences from food prefer-ence and historical biogeography of pikas. Palaeogeog Palaeo-climatol Palaeoecol 326–328:160–171.
Hildebrand M. 1985. Digging of quadrupeds. In: Hildebrand M,Bramble DM, Liem KF, Wake DB, editors. Functional Verte-brate Morphology. Cambridge, MA: Belknap Press. pp 89–109.
Hoffmann RS, Smith AT. 2005. Order Lagomorpha. In: WilsonDE and Reeder DM, editors. Mammal Species of the World.Baltimore. Johns Hopkins University Press. pp 185–211.
Hopkins SSB, Davis EB. 2009. Quantitative morphological prox-ies for fossoriality in small mammals. J Morphol 90:1449–1460.
IUCN 2011. IUCN Red List of Threatened Species. Version2011.2. Available at:http://www.iucnredlist.org. Accessed on15 January 2012.
James RS, Navas CA, Herrel A. 2007. How important are skele-tal muscle mechanics in setting limits on jumping perform-ance? J Exp Biol 210:923–933.
Jungers WL. 1977. Hindlimb and pelvic adaptations to verticalclimbing and clinging in Megaladapis, a giant subfossil prosi-mian from Madagascar. Year Phys Anthropol 20:508–524.
Kniazev AV, Savinetski AB. 1988. [Changes in the populationsof small mammals of the Tsagan-Bogdo ridge (TransaltaiGobi) in the late Holocene.] Zool Zh 67:297–300.
Lanier HC, Olson LE. 2009. Inferring divergence times withinpikas (Ochotona spp.) using mtDNA and relaxed moleculardating techniques. Mol Phylogenet Evol 53:1–12.
Lessa EP, Vassallo AI, Verzi DH, Mora MS. 2008. Evolution ofmorphological adaptations for digging in living and extinct cte-nomyid and octodontid rodents. Biol J Linn Soc 95:267–283.
Lissovsky AA. 2004. Contribution to age determination of pikas(Lagomorpha, Ochotonidae, Ochotona). Russian J Theriol3:43–48.
Lissovsky AA, Ivanova NV, Borisenko AV. 2007. Molecular phy-logenetics and taxonomy of the subgenus Pika (Ochotona,Lagomorpha). J Mammal 88:1195–1204.
MacDonald SO, Jones C. 1987. Ochotona collaris. Mamm Spe-cies 281:1–4.
Markham OD, Whicker FW. 1972. Burrowing in pika (Ochotonaprinceps). J Mammal 53:387–389.
Morgan CC. 2009. Geometric morphometrics of the scapula ofSouth American caviomorph rodents (Rodentia: Hystricogna-thi): Form, function and phylogeny. Mamm Biol 74:497–506.
Niu Y, Wei F, Li M, Liu X, Feng Z. 2004. Phylogeny of pikas(Lagomorpha, Ochotona) inferred from mitochondrial cyto-chrome b sequences. Folia Zool 53:141–155.
Salton JA, Sargis EJ. 2008. Evolutionary morphology of theTenrecoidea (Mammalia) forelimb skeleton. In: Sargis EJ,Dagosto M, editors. Mammalian Evolutionary Morphology: Atribute to Frederick S. Szalay. Dordrecht, The Netherlands:Springer. pp 51–71.
Salton JA, Sargis EJ. 2009. Evolutionary morphology of the Tenre-coidea (Mammalia) hindlimb skeleton. J Morphol 270:367–387.
Samuels JX, Van Valkenburgh B. 2008. Skeletal indicators oflocomotor adaptations in living and extinct rodents. J Mor-phol 269:1387–1411.
Sargis EJ. 2002a. Functional morphology of the forelimb oftupaiids (Mammalia, Scandentia) and its phylogenetic impli-cations. J Morphol 253:10–42.
Sargis EJ. 2002b. Functional morphology of the hindlimb oftupaiids (Mammalia, Scandentia) and its phylogenetic impli-cations. J Morphol 254:149–185.
Sargis EJ, Terranova CJ, and Gebo DL. 2008. Evolutionarymorphology of the guenon postcranium and its taxonomicimplications. In: Sargis EJ, Dagosto M, editors. MammalianEvolutionary Morphology: A tribute to Frederick S. Szalay.Dordrecht, The Netherlands: Springer. pp 361–372.
Smith AT. 1988. Patterns of pika (Genus Ochotona) life historyvariation. In: Boyce MS, editor. Evolution of Life Histories:Theory and Patterns From Mammals. New Haven, CT: YaleUniversity Press. pp 233–256.
Smith AT. 2008. The world of pikas. In: Alves PC, Ferrand N,Hacklander K, editors. Lagomorph Biology: Evolution, Ecol-ogy, and Conservation. Berlin: Springer-Verlag. pp 89–102.
Smith AT, Formozov NA, Hoffman RS, Changlin Z, ErbajevaMA. 1990. Pikas. In: Chapman JA, Flux JEC, editors. Rab-bits, Hares and Pikas: Status Survey and ConservationAction Plan. Gland, Switzerland: IUCN, Gland, Switzerland.pp 14–60.
Smith AT, Weston ML. 1990. Ochotona princeps. Mamm Species352:1–8.
Smith JM, Savage RJR. 1956. Some locomotory adaptations inmammals. J Linnean Soc London Zool 42:603–622.
Stein BR. 2000. Morphology of subterranean rodents. In: LaceyEA, Patton JL, Cameron GN, editors. Life Underground: TheBiology of Subterranean Rodents. Chicago, IL: University ofChicago Press. pp 19–61.
Szalay FS, Sargis EJ. 2001. Model-based analysis of postcranialosteology of marsupials from the Paleocene of Itaborai (Bra-zil) and the phylogenetics and biogeography of Metatheria.Geodiversitas 23:139–302.
Taylor ME. 1974. The functional anatomy of the forelimb ofsome African Viverridae (Carnivora). J Morphol 143:307–335.
Taylor ME. 1976. The functional anatomy of the hindlimb ofsome African Viverridae (Carnivora). J Morphol 148:227–254.
Vizcaıno SF, Milne N. 2002. Structure and function in armadillolimbs (Mammalia: Xenarthra: Dasypodidae). J Zool 257:117–127.
Weston ML. 1982. A numerical revision of the genus Ochotona(Lagomorpha: Mammalia) and an examination of its relation-ships [dissertation]. Vancouver: University of British Colum-bia, Vancouver. p 410.
Yu N, Zheng C, Feng Z. 1992. [The phylogenetic analysis of thesubgenus Ochotona of China.] Acta Theriol Sinica 12:255–256.
Yu N, Zheng CL, Zhang YP, Li WH. 2000. Molecular system-atics of pikas (genus Ochotona) inferred from mitochondrialDNA sequences. Mol Phylogenet Evol 16:85–95.
602 A.T. REESE ET AL.
Journal of Morphology